comparison of diffusion- and pumped- sampling methods to
TRANSCRIPT

Comparison of Diffusion- and Pumped-Sampling Methods to Monitor Volatile Organic Compounds in Ground Water, Massachusetts Military Reservation, Cape Cod, Massachusetts, July 1999–December 2002
By Stacey A. Archfield and Denis R. LeBlanc
Toxic Substances Hydrology Program
In cooperation with the Air Force Center for Environmental Excellence
Scientific Investigations Report 2005-5010
U.S. Department of the InteriorU.S. Geological Survey

U.S. Department of the InteriorGale A. Norton, Secretary
U.S. Geological SurveyCharles G. Groat, Director
U.S. Geological Survey, Reston, Virginia: 2005
For sale by U.S. Geological Survey, Information Services Box 25286, Denver Federal Center Denver, CO 80225For more information about the USGS and its products: Telephone: 1-888-ASK-USGS World Wide Web: http://www.usgs.gov/
Any use of trade, product, or firm names in this publication is for descriptive purposes only and does not imply endorsement by the U.S. Government.
Although this report is in the public domain, permission must be secured from the individual copyright owners to reproduce any copyrighted materials contained within this report.
Suggested citation:Archfield, S.A., and LeBlanc, D.R., 2005, Comparison of diffusion- and pumped-sampling methods to monitor volatile organic compounds in ground water, Massachusetts Military Reservation, Cape Cod, Massachusetts, July 1999–December 2002: U.S. Geological Survey Scientific Investigations Report 2005-5010, 53 p.
iii
Contents
Abstract .......................................................................................................................................................... 1Introduction ................................................................................................................................................... 1
Purpose and Scope ............................................................................................................................. 2Description of Study Area .................................................................................................................. 2
Study Design .................................................................................................................................................. 4Well Selection ...................................................................................................................................... 4Monitoring-Well Construction and Installation .............................................................................. 4Data Collection ..................................................................................................................................... 4
Diffusion-Sampling Method ...................................................................................................... 4Pumped-Sampling Method ....................................................................................................... 7Collection of Additional Samples ............................................................................................. 8
Laboratory Analysis ............................................................................................................................. 8Data Analysis ........................................................................................................................................ 8
Comparison of Diffusion- and Pumped-Sampling Methods .................................................................. 9Comparison of Methods by Volatile Organic Compound ............................................................ 10Comparison of Methods by Well ..................................................................................................... 13Comparison of Additional Samples ................................................................................................. 13
Quality-Assurance Samples ................................................................................................... 13Replicate Samples .................................................................................................................... 13Repeated Sampling ................................................................................................................. 14Comparison of Wells Sampled with Two Pumping Methods ............................................. 16Samples Collected above the Well Screen .......................................................................... 16
Comparison of Sampling Methods to Characteristics External to the Methods ..................... 17Study Limitations, Methods Agreement, and Long-Term Monitoring ................................................ 18
Limitations of the Study Design ....................................................................................................... 18Limitations of the Statistical Analyses ........................................................................................... 19Factors Affecting the Agreement between Methods .................................................................. 19Long-Term Monitoring with Diffusion Samplers at the Study Area ........................................... 19
Summary ...................................................................................................................................................... 20Acknowledgments ...................................................................................................................................... 20References Cited ........................................................................................................................................ 21Appendix: Analytical Results for Selected Volatile Organic Compounds by Well for
Diffusion- and Pumped-Sampling Methods, Including Wells with Two Sets of Samples Collected or with Replicate Samples Collected, and Samples Collected for Quality Assurance, Massachusetts Military Reservation, Cape Cod, Massachusetts, July 1999–December 2002 .......................................................... 23

iv
Figures 1. Map showing location of study area and monitoring well sites where ground-
water samples were collected by diffusion- and pumped-sampling methods, Massachusetts Military Reservation, Cape Cod, Massachusetts, July 1999– December 2002 ............................................................................................................................. 3
2–4. Graphs showing: 2. Typical results of pumped- and diffusion-sample concentrations for volatile
organic compounds from two wells: A, 27MW0026B; and B, 27MW0023A, at the Massachusetts Military Reservation, July 1999–December 2002 .................10
3. Comparison of pumped- and diffusion-sample concentrations for volatile organic compounds detected in ground water from A, more than six; and B, six or fewer wells at or near the Massachusetts Military Reservation, July 1999–December 2002 ........................................................................12
4. Comparison of total volatile organic compound concentrations for samples collected by pumped- and diffusion-sampling methods in wells at or near the Massachusetts Military Reservation, July 1999–December 2002 .....................14
5. Comparison of A, relative percent difference between first and second sampling; and B, pumped- and diffusion-sample concentrations from repeated sampling of selected wells at or near the Massachusetts Military Reservation, July 1999–December 2002 ........................................................................15
Tables 1. Well construction and sample information for wells with samples collected
by diffusion- and pumped-sampling methods, Massachusetts Military Reservation, Cape Cod, Massachusetts, July 1999–December 2002 ................................. 5
2. Volatile organic compounds and detections of compounds in samples collected by diffusion- and pumped-sampling methods from 89 wells at or near the Massachusetts Military Reservation, July 1999–December 2002 ..................................... 11
3. Results of sign tests applied to determine if total volatile organic compound concentrations in samples collected by the diffusion-sampling method were biased relative to concentrations in samples collected by the pumped- sampling method for wells at or near the Massachusetts Military Reservation, July 1999–December 2002 ................................................................................ 13
4. Analysis of volatile organic compounds for samples collected from well 03MW0214B, Massachusetts Military Reservation, July 1999 ......................................... 16
5. List of quantitative characteristics explored to determine if a relation was present between the characteristic and the degree of agreement of the diffusion- and pumped-sample concentrations and the reasons why each characteristic might affect the agreement between the methods ................................... 17

v
CONVERSION FACTORS, HORIZONTAL AND VERTICAL DATUMS, WATER-QUALITY INFORMATION, AND ABBREVIATIONS
Multiply By To obtain
foot (ft) 0.3048 meter (m)
foot per day (ft/d) 0.3048 meter per day (m/d)
gallon (gal) 3,785 milliliter (mL)
gallon per minute (gal/min) 3.785 liter per minute (L/min)
inch (in.) 2.54 centimeter (cm)
inch per year (in/yr) 0.00696 centimeter per day (cm/d)
mile (mi) 1.609 kilometer (km)
mils (mil) 0.00254 centimeter (cm)
Temperature in degrees Celsius (ºC) may be converted to degrees Fahrenheit (ºF) as follows:
ºF = (1.8 x ºC) + 32
Horizontal coordinate information is referenced to the North American Datum of 1983 (NAD 83). Vertical coordinate information is referenced to the National Geodetic Vertical Datum of 1929 (NGVD 29). Altitude, as used in this report, refers to distance above or below NGVD 29.
Chemical concentration is given in units of milligrams per liter (mg/L) or micrograms per liter (µg/L). Milligrams and micrograms per liter are units expressing the mass of the solute per unit volume (liter) of water. One thousand micrograms per liter is equivalent to 1 milligram per liter. Micrograms per liter is approximately equivalent to “parts per billion,” and milligrams per liter is approximately equivalent to “parts per million.” Specific conductance is given in microsiemens per centimeter at 25 degrees Celsius (µS/cm at 25ºC).
AFCEE Air Force Center for Environmental Excellence cis1,2-DCE cis1,2-dichloroethene EDB 1,2-dibromoethane IRP Installation Restoration Program MMR Massachusetts Military Reservation MTBE methyl tertiary butyl ether PVC polyvinyl chloride RPD relative percent difference PCE tetrachloroethene TCE trichloroethene USGS U.S. Geological Survey USEPA U.S. Environmental Protection Agency VOA volatile organic analysis VOC volatile organic compound


Comparison of Diffusion- and Pumped-Sampling Methods to Monitor Volatile Organic Compounds in Ground Water, Massachusetts Military Reservation, Cape Cod, Massachusetts, July 1999–December 2002
By Stacey A. Archfield and Denis R. LeBlanc
AbstractTo evaluate diffusion sampling as an alternative method
to monitor volatile organic compound (VOC) concentra-tions in ground water, concentrations in samples collected by traditional pumped-sampling methods were compared to concentrations in samples collected by diffusion-sampling methods for 89 monitoring wells at or near the Massachusetts Military Reservation, Cape Cod. Samples were analyzed for 36 VOCs. There was no substantial difference between the utility of diffusion and pumped samples to detect the presence or absence of a VOC. In wells where VOCs were detected, diffusion-sample concentrations of tetrachloroethene (PCE) and trichloroethene (TCE) were significantly lower than pumped-sample concentrations. Because PCE and TCE concentrations detected in the wells dominated the calculation of many of the total VOC concentrations, when VOC concen-trations were summed and compared by sampling method, visual inspection also showed a downward concentration bias in the diffusion-sample concentration.
The degree to which pumped- and diffusion-sample concentrations agreed was not a result of variability inherent within the sampling methods or the diffusion process itself. A comparison of the degree of agreement in the results from the two methods to 13 quantifiable characteristics external to the sampling methods offered only well-screen length as being related to the degree of agreement between the methods; however, there is also evidence to indicate that the flushing rate of water through the well screen affected the agreement between the sampling methods. Despite poor agreement between the concentrations obtained by the two methods at some wells, the degree to which the concentra-tions agree at a given well is repeatable. A one-time, well-by-well comparison between diffusion- and pumped-sampling methods could determine which wells are good candidates for the use of diffusion samplers. For wells with good method
agreement, the diffusion-sampling method is a time-saving and cost-effective alternative to pumped-sampling methods in a long-term monitoring program, such as at the Massachusetts Military Reservation.
IntroductionThe Installation Restoration Program (IRP) at the
Massachusetts Military Reservation (MMR) on Cape Cod maintains an extensive, long-term program to monitor concen-trations of volatile organic compounds (VOCs) in ground water (Air Force Center for Environmental Excellence, 2004). The traditional sampling methods utilized require trained personnel, expensive equipment, and substantial time in the field. Before a sample is obtained from a monitoring well, water is purged from the well until stability of the chemical and physical properties of the well water is reached. Before the pump is moved from one well to another, the pump and equip-ment are cleaned to prevent cross-contamination. Simpler and less costly methods to monitor VOC concentrations would greatly reduce the resources needed to carry out the long-term (tens of years) monitoring program at the MMR.
Diffusion bag sampling, or simply diffusion sampling, has been demonstrated to be a viable alternative to pumped sampling to monitor concentrations of VOCs in wells (Vroblesky and Hyde, 1997). Vroblesky (2001) provides a description of diffusion samplers and guidance on their use. Field personnel require minimal instruction to construct, deploy, and retrieve diffusion samplers. In addition, the use of diffusion samplers eliminates the need to purge water from the well, dispose of this purge water, and decontaminate the sampling pump. Huffman (2002) provides an extensive literature review of studies involving the theory and applica-tion of diffusion samplers to a variety of laboratory and field environments.
Diffusion samplers are constructed from low-density polyethylene tubing that is filled with deionized water and sealed at both ends. The sampler is attached to a rope or wire and lowered into the well to the screened interval. The sampler is held in place by securing the rope or wire to the top of the well. Initially, a concentration gradient may be present between the uncontaminated water in the diffusion sampler and the surrounding water in the well. This concen-tration gradient causes VOCs to diffuse through the polyeth-ylene tubing—which is permeable to VOCs—into the water inside the sampler. If there is a free and continuous exchange of water across the well screen, the chemistry of the water surrounding the diffusion sampler reflects that of the ground water outside of the well. The diffusion process continues until equilibrium is reached between the VOC concentrations inside the sampler and in the surrounding water. After the sampler has been deployed long enough for this equilibrium to be reached (usually from days to weeks), the sampler is retrieved. Although equilibration times for individual VOCs in a labora-tory setting are known to depend on the chemical structure of the VOCs and the water temperature, Vroblesky (2001) suggests that the samplers be deployed for at least 2 weeks to ensure that VOCs in the sampler have equilibrated with all VOCs in the surrounding water.
There are limitations to the utility of diffusion sampling as a method to measure VOCs. Differences between the results from pumped samples and diffusion samples can be caused by factors that affect the diffusion process, by mixing induced by pumping the well, or by ambient vertical mixing in long-screened wells (usually longer than 5 ft). From laboratory testing, Vroblesky (2001) also notes that diffusion sampling is not a reliable method to measure concentrations of methyl tertiary butyl ether (MTBE) and acetone. Vroblesky (2001) provides a comprehensive list of factors that could cause concentrations in the diffusion and pumped samples to differ. Because of these limitations, a one time, well-by-well comparison of the methods could be used to determine the applicability of the diffusion-sampling method to monitor VOC concentrations in a long-term monitoring program.
The applicability of the diffusion-sampling method has been tested at various locations throughout the United States (Church, 2000; Vroblesky and Peters, 2000; Vroblesky and Petkewich, 2000; Vroblesky and others, 2000; Vroblesky and others, 2001; Huffman, 2002; Vroblesky and Pravecek, 2002). These tests have been limited by the number of wells used to compare methods. The results of most studies have indicated that diffusion samplers are a viable alternative to traditional pumped-sampling methods; however, the data sets used in most of these studies were small (fewer than 20 wells), and the wells had long screens.
Purpose and Scope
This report evaluates the applicability of diffusion sampling for monitoring VOC concentrations in ground water collected from monitoring wells on the MMR. The applica-bility of the diffusion-sampling method is measured by the utility of the method to detect concentrations of VOCs similar to those obtained by the pumped-sampling method. VOC concentrations in samples collected by the diffusion- and pumped-sampling methods are compared with each other; and in cases where the concentrations did not match, bias in the diffusion-sampling method is assessed. Comparisons are made between well, diffusion-sampler, aquifer, and geochemical characteristics, and the degree of agreement of the sampling methods. These comparisons add to the current understanding of diffusion samplers by examining how the samplers work in wells with short screens (2–5 ft long). This study was done cooperatively by the U.S. Geological Survey (USGS) and the Air Force Center for Environmental Excellence (AFCEE). Ground-water samples from 89 monitoring wells were collected from July 1999 through December 2002.
Description of Study Area
The MMR is on a glacial-outwash plain known as the Mashpee Pitted Plain on western Cape Cod, Massachusetts (Oldale and Barlow, 1986). The outwash-plain sediments consist of medium- to coarse-grained glaciofluvial sand and gravel underlain by deposits of fine-to-medium glaciolacustrine sand and silt. The underlying bedrock consists primarily of granodiorite (Oldale and Barlow, 1986) and is considered relatively impermeable (compared to the sediments above) to ground-water flow.
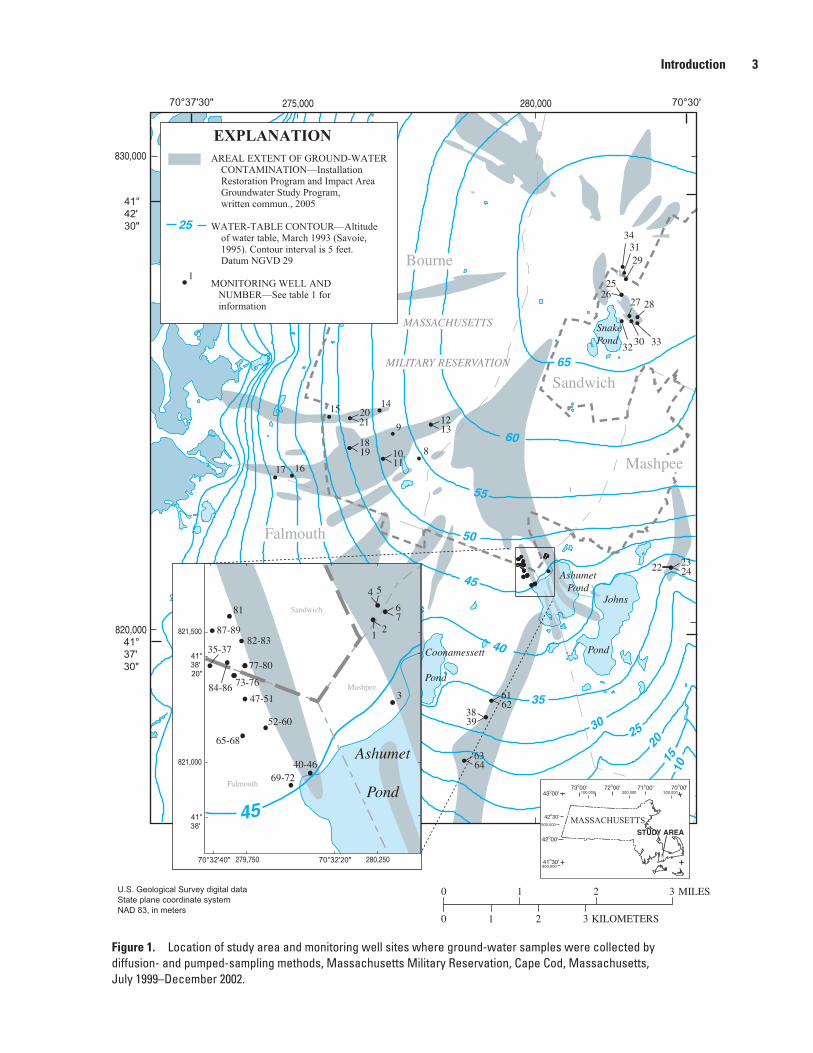
Ground water on western Cape Cod flows radially outward from a water-table high on the MMR and discharges to streams, ponds, and coastal embayments (fig. 1). Estimated ground-water-flow velocities in the sand and gravel range from 0.8 to 2.3 ft/d (LeBlanc, 1984). Recharge from precipi-tation is the only source of freshwater and is estimated to be about 27 in/yr (Walter and Whealan, 2005). Ground water is the source of drinking water for communities on the western part of Cape Cod.
Sixteen plumes that contain VOCs on the MMR are monitored regularly to assess how VOC concentrations are changing with time and to delineate the extent of the plumes. The Air Force Center for Environmental Excellence (2004) provides further detail regarding the location and characteris-tics of these plumes.
2 Comparison of Diffusion- and Pumped-Sampling Methods to Monitor VOCs in Ground Water, MMR, Cape Cod, MA
1510
25
35
45
55
20
30
40
50
60
65
17 16
15 2014
9
8
343129
25
27 28
333032
26
21 1213
232422
6162
6364
3839
1819 10
11
Bourne
Falmouth
Sandwich
Mashpee
U.S. Geological Survey digital data
State plane coordinate system
NAD 83, in meters
0 1 2 3 MILES
0 1 2 3 KILOMETERS
MASSACHUSETTS
MILITARY RESERVATION
70°37'30" 70°30'
41°
42'
30"
41°
37'
30"
275,000
830,000
820,000
280,000
45
70°32'40" 70°32'20"
41°
38'
41°
38'
20"
279,750 280,250
821,000
821,500
84-86
35-37
87-89
81
77-80
73-76
47-51
65-68
52-60
69-7240-46
3
54
21
67
82-83
Falmouth
Sandwich
Mashpee
MASSACHUSETTS
STUDY AREA
EXPLANATIONAREAL EXTENT OF GROUND-WATER CONTAMINATION—Installation Restoration Program and Impact Area Groundwater Study Program, written commun., 2005
WATER-TABLE CONTOUR—Altitude of water table, March 1993 (Savoie, 1995). Contour interval is 5 feet. Datum NGVD 29
MONITORING WELL AND NUMBER—See table 1 for information
1
25
AshumetPond
Johns
PondCoonamessett
Pond
SnakePond
Ashumet
Pond
42o00'
73o00' 72o00' 71o00' 70o00'
41o30'
42o30'
43o00' 100,000 200,000 300,000
900,000
800,000
Figure 1. Location of study area and monitoring well sites where ground-water samples were collected by diffusion- and pumped-sampling methods, Massachusetts Military Reservation, Cape Cod, Massachusetts, July 1999–December 2002.
Introduction 3

Study DesignPaired diffusion and pumped samples were collected
from 89 wells (fig. 1 and table 1) within or near contaminant plumes on or near the MMR. These samples were analyzed for concentrations of VOCs.
Well Selection
Of the 89 total wells, 34 wells were selected because these wells are part of a long-term (tens of years), water-quality-monitoring program at the MMR. AFCEE regularly collects and analyzes pumped samples from wells to monitor VOC concentrations. The diffusion sampling was conducted in conjunction with the regularly scheduled pump sampling, which minimized the effort required to collect the paired results. Wells were also selected on the basis of past detec-tions of VOCs in samples from the wells. This selection was intended to minimize the number of samples with VOC concentrations below the analytical detection limit. During 1999 and 2000, USGS personnel constructed and installed diffusion samplers in these wells (table 1) at least 2 weeks before the wells were scheduled to be sampled by AFCEE.
In 2002, the opportunity arose to collect paired diffusion and pumped samples from an additional 55 wells. Whereas the previously sampled wells have predominately 5-ft screened intervals, the wells in this data set have shorter screened inter-vals (typically 2 ft) (table 1). Most wells in this data set are arranged in clusters. Well clusters are groups of wells (from four to eight) installed close to one another at various screened depths to provide a vertical profile of concentrations at a particular mapped location. To maintain efficiency and obtain information about the vertical distribution of VOCs, 16 well clusters were selected on the basis of previous VOC detec-tions in at least one well within the cluster, and samplers were installed in all of the wells in the selected cluster regardless of the likelihood of detecting VOC concentrations. For this set of wells, USGS personnel constructed, installed, and retrieved the diffusion samplers and collected the pumped samples.
Monitoring-Well Construction and Installation
The monitoring wells used for this study are constructed of polyvinyl chloride (PVC) plastic casing. The casings generally are 2- or 2.5-in. nominal diameter, flush-joint and threaded, schedule 40 or 80 pipe. The well screens are slotted PVC casing with 0.010-in. (10 slot) openings. The screens are made by various manufacturers and are from 1 to 10 ft long (table 1). No sand pack around the screen is used and the natural sediments are allowed to collapse around the screen.
Three drilling techniques were used to install the wells. Most wells were installed by hollow-stem augering. Some wells were installed by sonic vibratory driving or air-rotary
methods. These methods use only water or air in the drilling process; drilling muds are not used. The wells were developed after installation by submersible or airlift pumping to clear the screens of accumulated fine-grained sediments, and thus, to reduce the turbidity of the pumped water.
Data Collection
For each well included in the study, paired diffusion and pumped samples were collected and analyzed for VOCs. Replicate diffusion and pumped samples were also collected from a limited number of wells. Selected wells were resampled from 2 months to 3 years later by both methods to test the repeatability of the agreement between the diffusion- and pumped-sample concentrations over time. In one well, differences in VOC concentrations in the presumably stagnant water column above the well screen were investigated.
Diffusion and pumped samples were collected from each well. The pumped sample was collected immediately after the diffusion sampler was retrieved, and the paired samples were held and transported to the laboratory together. The USGS constructed and installed the diffusion samplers according to the protocols outlined by Vroblesky (2001). USGS and AFCEE personnel shared the task of retrieving the diffu-sion samplers and collecting the pumped samples. To ensure uniform collection and handling of the diffusion samplers, AFCEE personnel were trained by USGS personnel to retrieve the diffusion samplers according to the protocols established by Vroblesky (2001).
Diffusion-Sampling MethodTo construct the samplers, a 1.5-in.-diameter, 4-mil-thick
polyethylene tube was filled with deionized water and sealed at both ends. All samplers were constructed to be 1 ft long between the sealed ends. The length of the diffusion sampler was determined by the amount of sample water needed to fill two 40-mL glass volatile organic analysis (VOA) sample vials. Sample water could be lost during transfer to the vials, so a small amount of additional water was included in the sampler to account for this loss. The diffusion sampler was then placed in a 1.5-in.-diameter polyethylene open-mesh tube to protect the sampler from damage during installation and retrieval and to facilitate attachment of the sampler to the twine used to hang the sampler in the well.
The well depths were measured prior to diffusion-sampler installation to confirm that the current depth agreed with the depth recorded at the time of the well’s installation. Validating the well-construction records before sampler installation also provided a means to ensure that the sampler would be hung at the correct depth. On the basis of the records, calculations were made to determine the length of twine needed to hang each diffusion sampler at the midpoint of the well screen.
4 Comparison of Diffusion- and Pumped-Sampling Methods to Monitor VOCs in Ground Water, MMR, Cape Cod, MA

Table 1. Well construction and sample information for wells with samples collected by diffusion- and pumped-sampling methods, Massachusetts Military Reservation, Cape Cod, Massachusetts, July 1999–December 2002.—Continued
[Well ID: See figure 1 for location. ft, foot; ft bls, feet below land surface; ID, identifier; altitudes are above NGVD 29]
Well ID
Well number
Altitude of land surface
(ft)
Altitude at the top
of the well casing
(ft)
Depth to top of
screened interval (ft bls)
Depth to bottom of screened interval (ft bls)
Screen length
(ft)
Date of diffusion- sampler
installation
Date of diffusion- sampler retrieval and collection of pumped sample
At least one volatile
organic compound detected
1 03MW0054A 58.9 61.3 130 135 5 7-21-1999 8-12-1999 Yes 2 03MW0054B 58.8 61.3 59 64 5 7-21-1999 8-12-1999 Yes 3 03MW0064 70.8 70.6 231 236 5 7-28-1999 8-16-1999 Yes 4 03MW0214B 58.0 60.5 121 126 5 7-28-1999 8-12-1999 Yes 5 03MW0214F 58.0 60.5 204 209 5 7-28-1999 8-12-1999 Yes 9-20-2002 11-12-2002 Yes
6 03MW2413A 60.8 60.4 220 225 5 7-28-1999 8-16-1999 Yes 9-20-2002 11-12-2002 Yes 7 03MW2413B 61.6 61.4 170 175 5 9-20-2002 11-12-2002 Yes 8 27MW0023A 111.2 112.1 119 124 5 7-21-1999 8-04-1999 Yes 3-20-2000 4-06-2000 Yes
9 27MW0024A 146.7 149.3 188 193 5 7-21-1999 8-09-1999 Yes 10 27MW0026A 106.0 108.3 138 148 10 7-21-1999 8-05-1999 Yes 11 27MW0026B 107.9 110.6 205 210 5 7-21-1999 8-05-1999 Yes 3-20-2000 4-10-2000 Yes 12 27MW0031A 130.6 132.9 194 199 5 7-21-1999 8-06-1999 Yes 3-20-2000 4-07-2000 Yes 13 27MW0031B 130.0 131.7 147 152 5 7-21-1999 8-09-1999 Yes 3-20-2000 4-07-2000 Yes 14
27MW0033 167.5 170.0 177 182 5 7-21-1999 8-05-1999 Yes
15 27MW0037A 179.8 181.9 213 218 5 7-21-1999 8-11-1999 Yes 3-20-2000 4-04-2000 Yes
16 27MW0038A 72.2 74.7 135 140 5 7-21-1999 8-11-1999 Yes 17 27MW0046 96.4 99.2 144 149 5 7-28-1999 10-11-1999 Yes 18 27MW0102A 236.8 239.3 300 305 5 7-28-1999 8-11-1999 Yes 3-20-2000 4-05-2000 Yes 19 27MW0102B 236.8 239.3 210 215 5 7-28-1999 8-11-1999 No
20 27MW0108A 188.6 188.2 222 227 5 7-21-1999 8-05-1999 Yes 3-20-2000 4-05-2000 Yes 21 27MW0108B 189.7 189.3 172 177 5 7-21-1999 8-05-1999 Yes 22 36MW0132A 54.3 54.0 185 190 5 4-11-2000 4-18-2000 Yes 23 36MW0132B 54.3 54.0 135 140 5 4-11-2000 4-18-2000 Yes 24 36MW0132C 54.6 54.0 79 84 5 4-11-2000 4-18-2000 Yes
25 90MW0003 157.4 160.4 144 149 5 8-31-1999 9-14-1999 Yes
26 90MW0005 157.7 160.7 184 189 5 8-31-1999 9-14-1999 Yes 27 90MW0025 152.4 151.9 160 165 5 8-31-1999 9-14-1999 Yes 28 90MW0028 145.5 145.0 177 182 5 8-31-1999 9-14-1999 Yes 29 90MW0034 131.1 133.7 94 99 5 8-31-1999 9-14-1999 No
30 90MW0040 141.2 140.9 188 193 5 8-31-1999 9-14-1999 Yes 31 90MW0041 159.6 161.6 125 130 5 9-01-1999 9-15-1999 No 32 90MW0050 83.0 82.6 86 91 5 8-31-1999 9-15-1999 Yes 33 90MW0053 143.5 143.2 189 194 5 8-31-1999 9-14-1999 Yes
Study Design 5

Table 1. Well construction and sample information for wells with samples collected by diffusion- and pumped-sampling methods, Massachusetts Military Reservation, Cape Cod, Massachusetts, July 1999–December 2002.—Continued
[Well ID: See figure 1 for location. ft, foot; ft bls, feet below land surface; ID, identifier; altitudes are above NGVD 29]
Well ID
Well number
Altitude of land surface
(ft)
Altitude at the top
of the well casing
(ft)
Depth to top of
screened interval (ft bls)
Depth to bottom of screened interval (ft bls)
Screen length
(ft)
Date of diffusion- sampler
installation
Date of diffusion- sampler retrieval and collection of pumped sample
At least one volatile
organic compound detected
34 90WT0013 163.1 166.2 92 102 10 8-31-1999 9-15-1999 Yes 35 FSW 230-0058 85.9 87.4 56 58 2 7-23-2002 8-13-2002 Yes 36 FSW 230-0068 86.3 87.8 66 68 2 7-23-2002 8-13-2002 Yes 37 FSW 230-0078 86.5 88.0 76 78 2 7-23-2002 8-13-2002 Yes 38 FSW 271-0099 35.9 37.4 97 99 2 9-20-2002 10-16-2002 Yes 11-15-2002 12-09-2002 Yes
39 FSW 271-0114 35.9 36.9 112 114 2 9-20-2002 10-16-2002 Yes 11-15-2002 12-09-2002 Yes 40 FSW 300-0010 47.2 48.2 8 10 2 7-10-2002 8-01-2002 Yes 41 FSW 300-0030 47.1 48.6 28 30 2 7-10-2002 8-01-2002 Yes 42 FSW 300-0050 47.2 48.6 48 50 2 7-10-2002 8-01-2002 No
43 FSW 300-0073 47.1 47.9 71 73 2 7-10-2002 8-01-2002 No 44 FSW 300-0099 46.9 47.8 97 99 2 7-10-2002 8-01-2002 No 45 FSW 300-0118 46.9 48.4 116 118 2 7-10-2002 8-01-2002 No 46 FSW 300-0138 47.1 48.6 136 138 2 7-10-2002 8-01-2002 No 47 FSW 343-0036 68.9 69.2 34 36 2 7-16-2002 8-07-2002 Yes
48 FSW 343-0057 68.9 69.4 55 57 2 7-16-2002 8-07-2002 Yes 49 FSW 343-0079 68.8 69.8 77 79 2 7-16-2002 8-07-2002 No 50 FSW 343-0099 68.8 69.8 97 99 2 7-16-2002 8-07-2002 No 51 FSW 343-0114 69.2 70.7 112 114 2 7-16-2002 8-07-2002 No 52 FSW 347-0020 59.7 60.7 18 20 2 7-16-2002 8-08-2002 No
53 FSW 347-0031 59.7 61.2 29 31 2 7-16-2002 8-08-2002 Yes 54 FSW 347-0038 59.5 61.0 36 38 2 7-16-2002 8-08-2002 Yes 55 FSW 347-0046 59.8 60.6 44 46 2 7-16-2002 8-08-2002 Yes 56 FSW 347-0067 60.0 60.4 65 67 2 7-16-2002 8-08-2002 No 57 FSW 347-0101 59.7 61.0 99 101 2 7-16-2002 8-08-2002 No
58 FSW 347-0116 60.0 61.5 114 116 2 7-16-2002 8-08-2002 No 59 FSW 347-0131 60.3 61.3 129 131 2 7-16-2002 8-08-2002 No 60 FSW 347-0145 60.0 61.6 143 145 2 7-16-2002 8-08-2002 No 61 FSW 350-0064 37.8 38.8 63 64 1 9-20-2002 10-11-2002 Yes 11-15-2002 12-09-2002 Yes
62 FSW 350-0110 37.8 38.8 109 110 1 9-20-2002 10-11-2002 Yes 11-15-2002 12-09-2002 Yes 63 FSW 375-0055 29.2 30.2 53 55 2 9-20-2002 10-24-2002 Yes 11-15-2002 12-09-2002 Yes 64 FSW 375-0071 29.5 30.5 69 71 2 9-20-2002 10-24-2002 Yes 11-15-2002 12-09-2002 Yes
65 FSW 383-0040 64.6 66.1 38 40 2 7-23-2002 8-22-2002 Yes 66 FSW 383-0061 64.4 65.9 59 61 2 7-23-2002 8-22-2002 Yes 67 FSW 383-0082 64.3 65.8 80 82 2 7-23-2002 8-22-2002 No 68 FSW 383-0106 64.9 66.4 104 106 2 7-23-2002 8-22-2002 No 69 FSW 424-0020 58.0 58.4 15 20 5 7-10-2002 8-06-2002 No
6 Comparison of Diffusion- and Pumped-Sampling Methods to Monitor VOCs in Ground Water, MMR, Cape Cod, MA

The calculations also were made to determine the height of the free space available below the well screen to accom-modate a stainless-steel weight that was typically attached to the bottom of the diffusion sampler. At the time of installation, the sampler was attached to a stainless-steel weight 7 in. long and 1 in. in diameter with braided polypropylene twine. If there was not enough room below the midpoint of the screen to accommodate the stainless-steel weight and the lower half of the diffusion sampler, the weight was installed above the sampler. The weight was installed above the diffusion sampler in three wells: FSW 271-0099, FSW 350-0064, and FSW 350-0110 (fig. 1 and table 1). In all other wells, the weight was installed below the sampler.
Braided polypropylene twine was attached to the diffu-sion sampler, and the sampler was lowered into the well. As the diffusion sampler was lowered, the twine was measured to the pre-calculated length so that the center of the diffusion sampler hung at the midpoint of the well screen. The twine was then attached to the top of the well and the sampler hung securely in the well at the desired depth.
As recommended by Vroblesky (2001), the diffusion samplers were given a minimum of 2 weeks to reach equi-librium and then retrieved from the well by pulling up the twine. The protective mesh was pulled back and the top of the diffusion sampler was cut open. The contents of the diffusion sampler were poured into two VOA sample vials without air bubbles, capped, and kept cold and dark until analysis.
Pumped-Sampling MethodPumped samples from 34 wells were collected by
AFCEE according to the U.S. Environmental Protection Agency’s (USEPA) low-flow sampling protocol (U.S. Environmental Protection Agency, 1996). A Grundfos Redi-Flow 2 submersible pump was set inside the well with the intake positioned in the well screen, and the water in the well was purged. Dissolved oxygen, pH, specific conductance, and turbidity were measured every 5 minutes until the quantities stabilized. The typical purge volume for a 5-ft well screen was 20 gal, and typical pumping rates for sample collection were
Table 1. Well construction and sample information for wells with samples collected by diffusion- and pumped-sampling methods, Massachusetts Military Reservation, Cape Cod, Massachusetts, July 1999–December 2002.—Continued
[Well ID: See figure 1 for location. ft, foot; ft bls, feet below land surface; ID, identifier; altitudes are above NGVD 29]
Well ID
Well number
Altitude of land surface
(ft)
Altitude at the top
of the well casing
(ft)
Depth to top of
screened interval (ft bls)
Depth to bottom of screened interval (ft bls)
Screen length
(ft)
Date of diffusion- sampler
installation
Date of diffusion- sampler retrieval and collection of pumped sample
At least one volatile
organic compound detected
70 FSW 424-0089 55.7 55.1 84 89 5 7-10-2002 8-06-2002 No 71 FSW 424-0144 56.0 55.6 139 144 5 7-10-2002 8-06-2002 No 72 FSW 424-0183 56.3 55.7 178 183 5 7-10-2002 8-06-2002 No 73 FSW 577-0061 94.7 96.6 59 61 2 7-23-2002 8-14-2002 Yes 74 FSW 577-0071 94.3 96.5 69 71 2 7-23-2002 8-14-2002 Yes
75 FSW 577-0081 94.6 96.5 79 81 2 7-23-2002 8-14-2002 Yes 76 FSW 577-0097 95.2 96.2 95 97 2 7-23-2002 8-14-2002 No 77 SDW 316-0051 95.5 96.5 49 51 2 7-23-2002 8-20-2002 No 78 SDW 316-0066 95.5 96.5 64 66 2 7-23-2002 8-20-2002 Yes 79 SDW 316-0082 95.4 96.4 80 82 2 7-23-2002 8-20-2002 Yes
80 SDW 316-0100 95.4 96.4 98 100 2 7-23-2002 8-20-2002 No 81 SDW 423-0058 87.3 90.5 53 58 5 7-23-2002 8-21-2002 Yes 82 SDW 438-0041 79.1 82.1 31 41 10 7-24-2002 8-13-2002 Yes 83 SDW 440-0078 79.6 81.0 76 78 2 7-24-2002 8-13-2002 No 84 SDW 469-0036 69.0 70.5 34 36 2 7-16-2002 8-06-2002 No
85 SDW 469-0051 69.0 70.5 49 51 2 7-16-2002 8-06-2002 Yes 86 SDW 469-0066 69.0 70.6 64 66 2 7-16-2002 8-06-2002 No 87 SDW 500-0060 79.4 80.9 58 60 2 7-23-2002 8-21-2002 No 88 SDW 500-0070 79.7 81.2 68 70 2 7-23-2002 8-21-2002 No 89 SDW 500-0080 79.5 81.0 78 80 2 7-23-2002 8-21-2002 No
Study Design 7

between 0.1 and 2 L/min [Drew Tingley, Jacobs Engineering (now at CH2M Hill), written commun., 2003]. Samples were collected in two VOA sample vials without air bubbles, capped, chilled, and kept cold and dark until analysis.
The USGS collected the pumped samples from 55 wells by placing a Keck submersible pump 2 ft above the well screen and then inflating an isolation packer in the casing. The volume of water between the packer and the bottom of the well was calculated, and three times that volume of water was purged from the well at a rate of about 1 L/min (Savoie and LeBlanc, 1998). Dissolved oxygen, pH, specific conductance, and turbidity were measured and then two VOA sample vials were filled without air bubbles, capped, chilled and kept dark until analysis.
To verify that the results for the two sets of samples collected by the two pumping methods were similar, both methods were used to sample six wells. Initially, AFCEE retrieved the diffusion samplers and collected the pumped samples after the USGS had installed the diffusion samplers 2 weeks earlier. Approximately 2 weeks after AFCEE sampled these wells, the USGS again installed diffusion samplers in the six wells and waited another 2 weeks for equilibration between the water in the diffusion sampler and the well. Then, the USGS retrieved the diffusion samplers and collected the pumped samples.
Collection of Additional SamplesReplicate samples were collected from seven wells with
5-ft screens: replicate diffusion samples from three wells, replicate pumped samples from three wells, and both replicate diffusion and pumped samples from one well. Replicate diffu-sion samples were collected by installing two samplers in the well screen, one directly above the other. The water from the upper sampler composed the primary sample, and the water from the lower sampler composed the replicate. To collect pumped-sample replicates, the replicate sample was collected immediately after the primary sample. In addition, quality-assurance samples were collected throughout the duration of the study and analyzed for VOCs: 4 equipment-blank samples, 23 trip-blank samples, and 1 water-blank sample of the deion-ized water that was used to fill the diffusion samplers.
Fifteen wells were resampled by both methods (appendix). At resampled wells, a diffusion sampler was installed and retrieved, the well was sampled by using pumped-sampling methods, and then some time later, this sampling sequence was repeated. Resampling was done to determine if the agreement between the methods changed with time; two wells were resampled 3 years after the first sampling, seven wells after 8 months, and six wells after about 2 months (table 1).
In well 03MW0214B, where there is a long water column (109 ft) above the well screen, a series of four diffusion
samplers was hung in and above the screen to compare the in-screen VOC concentrations to the VOC concentrations in the presumably stagnant column of water above the screen. Diffusion samplers were installed in the well at the midpoint of the screen (2.5 ft below the top of the screen) and 2, 5.3, and 15 ft above the top of the screen. A pumped sample also was collected immediately after the diffusion samplers were retrieved. The VOC concentrations in the diffusion sample that was collected at the midpoint of the screen were compared to those in the pumped sample, and this data pair was included as part of the larger data set for this study.
Laboratory Analysis
The samples were kept cold and dark until delivery to the MMR’s on-site laboratory operated by Severn Trent Laboratories. Samples were analyzed for 36 VOCs within the established holding times for the analytes according to USEPA protocols: USEPA Method 8620B for VOC concentrations, and USEPA Method 504 for 1,2-dibromoethane (EDB) concentrations (U.S. Environmental Protection Agency, 1988, 1995).
Data Analysis
The paired pumped- and diffusion-sample concentrations were compared to assess the utility of diffusion sampling as a method to measure VOC concentrations in ground water at the MMR. Detections of acetone or MTBE were not included in the analysis because laboratory results have shown that diffusion samplers are not a reliable method to measure these VOCs (Vroblesky, 2001).
Assessments were made to determine how VOC concen-trations in the diffusion samples matched concentrations in the pumped samples and if the diffusion-sampling method is an unbiased method to measure VOC concentrations. These comparisons assessed the utility of diffusion sampling to detect the presence or absence of a VOC, the utility of diffu-sion sampling to measure individual VOC concentrations, and the utility of diffusion sampling to measure total VOC concen-trations in water from a well. When total VOC concentrations were used in the analysis, data below the analytical detection limit were assigned a value of zero, and then individual VOC concentrations were totaled by sampling method for each well.
Analyses were done by using the relative percent differ-ence (RPD) between the VOC concentrations obtained by the two sampling methods to (1) compare the RPD between results from replicate samples obtained by each sampling method, (2) compare the results from repeated sampling of wells using both sampling methods, and (3) determine if the RPD was related to characteristics external to the sampling methods. RPD (in percent) is calculated by the equation
8 Comparison of Diffusion- and Pumped-Sampling Methods to Monitor VOCs in Ground Water, MMR, Cape Cod, MA

where
Cp is the concentration of total VOCs in the pumped sample,
and C
d is the concentration of total VOCs in the diffusion sample.
The RPD is a sensitive measure of concentration differ-ences at concentrations less than 10 µg/L because the RPD normalizes concentration differences relative to the mean concentration. For this reason, RPD was not used in the initial assessments of the utility of the diffusion-sampling method to represent VOC concentrations in samples collected by the pumped-sampling method, but rather as a tool to determine if there were patterns in how the diffusion- and pumped-sample concentrations compared.
The number of samples collected was large enough that when the pumped- and diffusion-sample concentrations did not agree, statistical methods could be used to assess if the concentration differences between the methods were random and not due to bias in the diffusion-sampling method. The methods used include the sign test and signed-rank test (Helsel and Hirsch, 1992).
A sign test was applied to make this determination for individual- and total-VOC concentrations. For each data pair, the sign (positive or negative) of the difference in concentra-tions between the pumped and diffusion samples was calcu-lated. Then, the number of positive signs (the pumped-sample concentration greater than the diffusion-sample concentration) was counted and compared to the total number of negative signs (the diffusion-sample concentration greater than the pumped-sample concentration) (Helsel and Hirsch, 1992).
The purpose of the sign test was to assess whether concentration differences between results from both sampling methods, where these differences were present, were unbi-ased. For this reason, the sign test compares only the instances where the concentrations in the pumped and diffusion samples do not agree (Helsel and Hirsch, 1992). Therefore, if the difference between the pumped- and diffusion-sample concentrations was zero, or if both methods resulted in concentrations below the analytical detection limit, the data pair was ignored. The sign test allows for inclusion of data below the analytical detection limit for one or the other method in the analysis because the test accounts for only the qualitative difference (positive or negative) between concen-trations obtained by both methods and not the numerical differences in concentrations (Helsel and Hirsch, 1992). The sign test returns a p-value, which is used to determine whether
the differences in concentration between results from the two sampling methods are unbiased. P-values were computed with a Web-based application from the University of Amsterdam (2003).
The critical p-value for determining bias in this study is 0.05. A p-value less than 0.05 means that there is less than a 5-percent chance that this result would occur if the concentration differences between the diffusion-sampling method and pumped-sampling method were random and not due to bias (Helsel and Hirsch, 1992).
To compare the agreement between methods with screen length, a signed-rank test was used. The signed-rank test is not based on any assumption about the underlying distribution of either data set (Helsel and Hirsch, 1992); and for this study, it was used to determine if there was better agreement between methods for short-screened wells than for long-screened wells. Like the sign test, the signed-rank test compares the differences in VOC concentration between the pumped- and diffusion-sample concentrations; however, unlike the sign test, the signed-rank test also accounts for the magnitude of the differences between the sampling methods (Helsel and Hirsch, 1992). If the differences in VOC concentrations between the pumped- and diffusion-sampling methods were smaller for the short-screened wells than the differences for the long-screened wells, this difference could help to explain the degree of agreement between VOC concentrations measured by the diffusion- and pumped-sampling methods. The critical p-value used to determine significance in this study is 0.05. A p-value less than 0.05 means there is less than a 5-percent chance that the results from this comparison are due to chance, and screen length did affect the agreement between the concentrations measured by the two methods (Helsel and Hirsch, 1992).
Comparison of Diffusion- and Pumped-Sampling Methods
Initial inspection of the data collected during the study indicated that concentrations in samples obtained by the two methods were in good agreement for some wells but not for others (fig. 2). Furthermore, concentrations obtained by the two methods agreed more closely for some VOCs than for others. The degree of agreement between the methods was compared by VOC and well to determine the applicability of the diffusion-sampling method to the MMR; and in cases where the concentrations obtained by the methods did not agree, to determine why this result was the case.
Comparison of Diffusion- and Pumped-Sampling Methods 9
,RPD = 100Cp Cd–
12--- Cp Cd+( )---------------------------×

Comparison of Methods by Volatile Organic Compound
Of the 89 wells sampled, 20 of the 36 VOCs were detected in at least 1 well (table 2). There appeared to be no substantial difference in the utility of either sampling method to detect a given VOC (table 2). For the most part, if a VOC was not detected in the pumped sample, it was also not detected in the diffusion sample. Alternatively, if a VOC was detected in the pumped sample, it was also detected for the
most part in the diffusion sample. For the few cases where a VOC was detected by one method but not the other, the detected concentrations were usually just above the analytical detection limit.
The most commonly detected VOC was tetrachloroethene (PCE); PCE was detected in 38 wells (table 2). Trichloroethene (TCE), chloroform, cis1,2-dichloroethene (cis1,2-DCE), and EDB were detected in 25, 25, 16, and 7 wells, respectively (table 2). Detailed analytical results are presented in the appendix. The concentrations for the five most commonly detected VOCs are compared in figure 3A. Sixty-nine percent of the data points that had at least one of the two samples above the analytical detection limit are below the line of equal concentrations. For these paired concentrations, the pumped-sample concentrations are greater than the diffusion-sample concentrations. Data points for chloroform are clustered near the line of equal concentrations; the data points for PCE and TCE deviate the most from the line of equal concentra-tions. In other words, chloroform concentrations from the diffusion and pumped samples tended to agree well, whereas concentrations of PCE and TCE in the pumped and diffusion samples did not agree as well. Concentrations of the remaining VOCs detected in fewer than six wells are compared in figure 3B. As in figure 3A, a majority of the points that had at least one sample above the analytical detection limit are below the line of equal concen-trations; 66 percent of the pumped-sample concen-trations were greater than the diffusion-sample concentrations. The number of wells whose samples yielded no detection of an individual VOC by either sampling method is listed in table 2.
The five most frequently detected VOCs—PCE, TCE, chloroform, cis1,2-DCE, and EDB—had enough paired sample concentrations above the analytical detection limits or non-zero differences between the paired concentrations to apply the sign test. PCE and TCE were the only VOCs tested whose difference between the number of positive and negative signs was significant (p-values of 0.003 and 0.043, respectively), and showed downward bias in the utility of the diffusion sample in collecting a sample whose concentrations match those of the pumped sample (table 3). The tendency of PCE to have lower concentrations in diffusion samples than pumped samples has been reported in other studies (Vroblesky and Peters, 2000; Vroblesky and others, 2000), although statistical tests were not used in these studies.
0
10
20
30
40
50
60Pumped sample
Diffusion sample
CO
NC
EN
TR
AT
ION
, IN
MIC
RO
GR
AM
S P
ER
LIT
ER
0
10
20
30
40
50
60Pumped sample
Diffusion sample
CO
NC
EN
TR
AT
ION
, IN
MIC
RO
GR
AM
S P
ER
LIT
ER
Trichloroethene (TCE) Tetrachloroethene (PCE)
Tetrachloroethene (PCE)Trichloroethene (TCE)
A. Well 27MW0026B (Well identifier 11 on figure 1)
B. Well 27MW0023A (Well identifier 8 on figure 1)
Figure 2. Typical results of pumped- and diffusion-sample concentra-tions for volatile organic compounds from two wells: A, 27MW0026B; and B, 27MW0023A, at the Massachusetts Military Reservation, Cape Cod, Massachusetts, July 1999–December 2002.
10 Comparison of Diffusion- and Pumped-Sampling Methods to Monitor VOCs in Ground Water, MMR, Cape Cod, MA

Table 2. Volatile organic compounds and detections of compounds in samples collected by diffusion- and pumped-sampling methods from 89 wells at or near the Massachusetts Military Reservation, Cape Cod, Massachusetts, July 1999–December 2002.
[VOC, volatile organic compound]
VOCNumber of wells with
VOC not detected in pumped or diffusion sample
Number of wells with VOC detected in pumped
and diffusion sample
Number of wells with VOC detected in pumped sample but
not in diffusion sample
Number of wells with VOC detected in diffusion sample but
not in pumped sample
Benzene 83 3 2 1Bromochloromethane 89 0 0 0Bromodichloromethane 89 0 0 0Bromoform 89 0 0 0Bromomethane 89 0 0 0
Carbon tetrachloride 86 2 1 0Chlorobenzene 89 0 0 0Chloroethane 89 0 0 0Chloroform 64 23 0 2Chloromethane 88 0 1 0
Dibromochloromethane 89 0 0 01,2-Dibromochloropropane 89 0 0 01,2-Dibromoethane (EDB) 82 6 0 11,2-Dichlorobenzene 87 2 0 01,3-Dichlorobenzene 89 0 0 0
1,4-Dichlorobenzene 85 3 1 01,1-Dichloroethane 84 3 0 21,2-Dichloroethane 89 0 0 01,1-Dichloroethene 86 2 0 1cis1,2-Dichloroethene 73 11 4 1
trans1,2-Dichloroethene 87 1 1 01,2-Dichloropropane 89 0 0 0cis1,3-Dichloropropene 89 0 0 0trans1,3-Dichloropropene 89 0 0 0Ethylbenzene 88 1 0 0
Methylene chloride 89 0 0 0Styrene 89 0 0 01,1,2,2-Tetrachloroethane 87 2 0 0Tetrachloroethene (PCE) 50 35 4 01,2,4-Trichlorobenzene 89 0 0 0
1,1,1-Trichloroethane 86 2 1 01,1,2-Trichloroethane 88 0 0 1Trichloroethene (TCE) 64 22 2 1Toluene 88 1 0 0Vinyl chloride 86 2 0 1Total xylenes 88 1 0 0
Comparison of Diffusion- and Pumped-Sampling Methods 11

Figure 3. Comparison of pumped- and diffusion-sample concentrations for volatile organic compounds detected in ground water from A, more than six wells; and B, six or fewer wells at or near the Massachusetts Military Reservation, Cape Cod, Massachusetts, July 1999–December 2002 (< DL, less than detection limit).
12 Comparison of Diffusion- and Pumped-Sampling Methods to Monitor VOCs in Ground Water, MMR, Cape Cod, MA
< DL
< DL
1
10
100
1,000
< DL 1 10 100 1,000
1 10 100 1,000
Chloroform1,2-Dibromoethane (EDB)cis1,2-Dichloroethene (cis1,2-DCE)Tetrachloroethene (PCE)Trichloroethene (TCE)
Line of equal concentrations
EXPLANATION
PUMPED-SAMPLE CONCENTRATION, IN MICROGRAMS PER LITER
PUMPED-SAMPLE CONCENTRATION, IN MICROGRAMS PER LITER
DIF
FU
SIO
N-S
AM
PL
E C
ON
CE
NT
RA
TIO
N,
IN M
ICR
OG
RA
MS
PE
R L
ITE
RA. Volatile organic compounds detected in more than six wells
< DL
1
10
100
1,000
BenzeneCarbon tetrachlorideChloromethane1,2-Dichlorobenzene1,4-Dichlorobenzenetrans1,2-Dichloroethene1,1-Dichloroethane1,1-DichloroetheneEthylbenzene1,1,2,2-Tetrachloroethane1,1,1-Trichloroethane1,1,2-TrichloroethaneTolueneVinyl chlorideXylenes, total
Line of equal concentrationsEXPLANATION
B. Volatile organic compounds detected in six or fewer wells
Less than detection limit in diffusion sample
Less than detection limit in diffusion sample
Less
than
det
ectio
n lim
it in
pum
ped
sam
ple
Less
than
det
ectio
n lim
it in
pum
ped
sam
ple

Comparison of Methods by Well
For the next set of comparisons, the individual VOC concentrations were summed to obtain totals VOCs for each sampling method by well. Like the comparisons of individual VOCs (fig. 3), most pumped-sample concentrations were greater than the corresponding diffusion-sample concentra-tions (fig. 4). Whereas totaling VOCs resulted in a majority of the samples having concentrations above the detection limit for both the diffusion- and pumped-sampling methods, in samples from 32 wells, all individual VOC concentrations were below the analytical detection limit, and thus, their sum was equal to zero.
To determine if the differences in total VOC concentra-tions between the pumped- and diffusion-sampling methods were unbiased, a sign test was applied. The differences in total VOC concentrations were positive for 41 wells and negative for 15 wells; concentrations were below the analytical detec-tion limit or their difference was zero for 33 wells. The p-value of 0.001 from this test indicates that total VOC diffusion-sample concentrations were significantly lower than the total VOC pumped-sample concentrations. The downward concen-tration bias is not surprising because the concentrations of two of the most commonly detected VOCs—PCE and TCE—were some of the highest concentrations among the VOCs tested, and the degree of agreement between PCE and TCE concen-trations for the two methods were among the worst for all of the VOCs (fig. 3).
Comparison of Additional Samples
Additional samples were collected for quality assur-ance and to characterize the agreement between the methods further. Replicate samples were collected to determine if the degree of agreement between the methods was within the variability of the sampling methods. Repeated sampling was done to determine if the agreement between the methods was consistent and to determine if the use of different pumping protocols to collect the pumped sample affected the agreement between the methods. Other samples were collected to deter-mine how VOC concentrations in diffusion samplers in the presumably stagnant water above the well screen compared to VOC concentrations in the diffusion sampler in the screened interval.
Quality-Assurance SamplesOf the 28 blank samples collected, none had VOC
concentrations above the analytical detection limit. Therefore, VOCs at concentrations above the analytical detection limit were not introduced or augmented in the pumped and diffusion samples by the sampling methods or equipment contamina-tion. The quality-assurance data are provided in the appendix.
Replicate SamplesReplicate samples were collected from seven wells:
replicate pumped samples from three wells, replicate diffusion samples from three wells, and both types of replicate samples from one well. For the 7 wells with replicate samples, 8 of the 36 VOCs were detected in the set of original and replicate samples, and the replicate concentrations agreed well with those in the original samples (appendix). The average RPD was 7.7 percent between diffusion replicates and 4.6 percent between pumped replicates.
The RPD between the total VOC concentrations in orig-inal and replicate samples was compared to the RPD between the total VOC concentrations in pumped and diffusion samples to determine if variability between the replicate samples could explain the concentration differences between samples collected by the diffusion- and pumped-sampling methods. The RPD difference between concentrations obtained by the two sampling methods ranged from 27 to 75 percent, whereas the RPD between concentrations in the replicate pumped samples ranged from 2.1 to 7.3 percent, and the RPD between concentrations in the replicate diffusion samples ranged from 1.6 to 5.5 percent. The close agreement between replicates eliminated variability within each sampling method as an explanation for the observed differences between concen-trations obtained by the pumped- and diffusion-sampling methods.
Table 3. Results of sign tests applied to determine if total vola-tile organic compound concentrations in samples collected by the diffusion-sampling method were biased relative to concen-trations in samples collected by the pumped-sampling method for wells at or near the Massachusetts Military Reservation, Cape Cod, Massachusetts, July 1999–December 2002.
[S+: Number of cases for which the pumped-sample concentration was greater than the diffusion-sample concentration. S-: Number of cases for which the pumped-sample concentration was less than the diffusion-sample concentration]
Volatile organic compound S+ S- p-value
Chloroform 10 15 0.4241,2-Dibromoethane (EDB) 6 1 .125cis1,2-Dichloroethene 12 4 .077Tetrachloroethene (PCE) 29 10 .003Trichloroethene (TCE) 18 7 .043
Comparison of Diffusion- and Pumped-Sampling Methods 13

Repeated Sampling Fifteen wells were sampled again by using both sampling
methods after the first set of diffusion and pumped samples was collected: two wells were resampled 3 years later, seven wells 8 months later, and six wells about 2 months later (table 1). The total VOC concentrations for the pumped and diffusion samples from each trial were calculated by adding the concentrations of the detected VOCs for each sample for each sampling method (appendix). For each well, this resulted in two pairs of data: total VOC concentrations for the pumped and diffusion samples from the first and second trials. The RPD for each pair of data also was calculated. This calculation reduced the comparison to one pair of data per well: the RPD between the pumped- and diffusion-sample concentrations for the first trial and the RPD between the pumped- and diffusion-sample concentrations for the second trial (fig. 5A).
For a given well, the qualitative agreement between the diffusion-sample concentration and the pumped-sample concentration did not change from the first pair of samples to the second pair of samples (fig. 5A). For example, if the agreement was good between the methods for the first pair of samples from a given well, it was also good for the second pair of samples from the same well. The best example of this finding is well 03MW0214F (fig. 5A), which was re-sampled 2 years after the first set of samples was collected. Concentrations of VOCs in ground water had substantially decreased (appendix); however, the RPD between the pumped- and diffusion-sample concentrations changed by less than 10 percent (fig. 5A).
Less than detection limit in diffusion sample
Le
ss t
ha
n d
ete
ctio
n li
mit
in p
um
pe
d s
am
ple
< DL
1
10
100
1,000
< DL 1 10 100 1,000
PUMPED-SAMPLE CONCENTRATION, IN MICROGRAMS PER LITER
DIF
FU
SIO
N-S
AM
PLE
CO
NC
EN
TR
AT
ION
, IN
MIC
RO
GR
AM
S P
ER
LIT
ER
Line of equal concentrations
Figure 4. Comparison of total volatile organic compound concentrations for samples collected by pumped- and diffusion-sampling methods in wells at or near the Massachusetts Military Reservation, Cape Cod, Massachusetts, July 1999–December 2002 (< DL, less than detection limit).
14 Comparison of Diffusion- and Pumped-Sampling Methods to Monitor VOCs in Ground Water, MMR, Cape Cod, MA
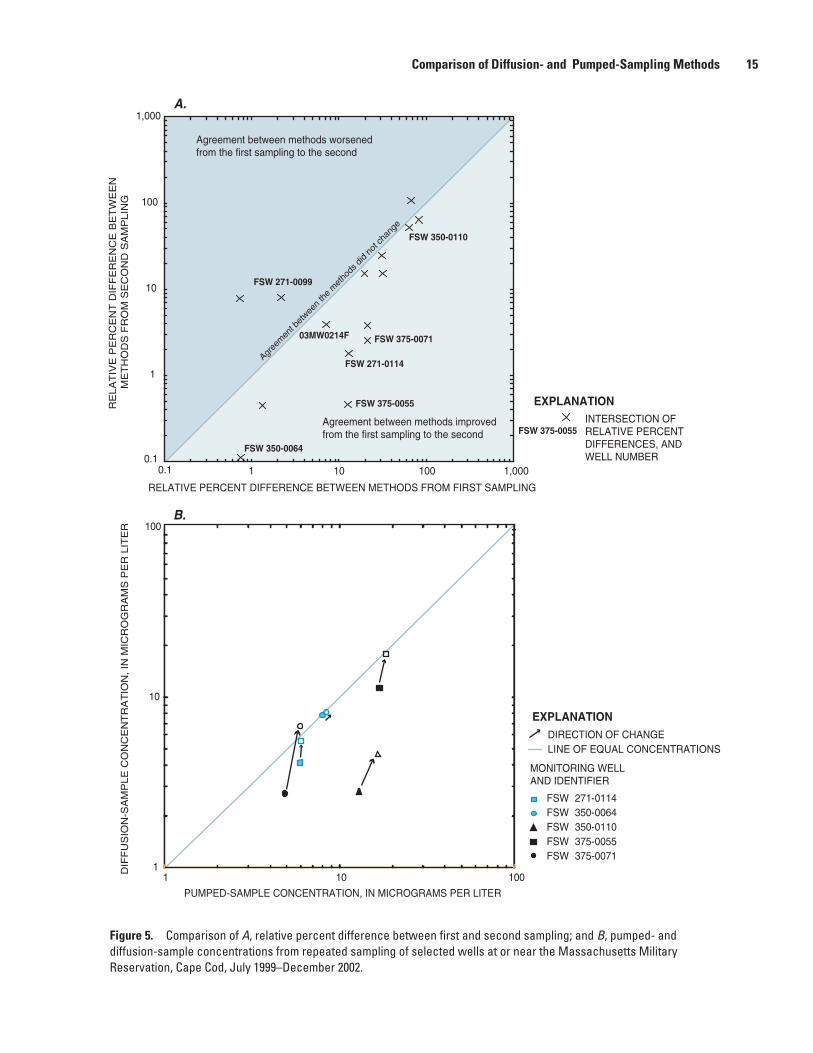
Figure 5. Comparison of A, relative percent difference between first and second sampling; and B, pumped- and diffusion-sample concentrations from repeated sampling of selected wells at or near the Massachusetts Military Reservation, Cape Cod, July 1999–December 2002.
Comparison of Diffusion- and Pumped-Sampling Methods 15
0.1
1
10
100
1,000
0.1 1 10 100 1,000
RELATIVE PERCENT DIFFERENCE BETWEEN METHODS FROM FIRST SAMPLING
RE
LA
TIV
E P
ER
CE
NT
DIF
FE
RE
NC
E B
ET
WE
EN
M
ET
HO
DS
FR
OM
SE
CO
ND
SA
MP
LIN
G
1
10
100
1 10 100
INTERSECTION OF RELATIVE PERCENTDIFFERENCES, ANDWELL NUMBER
MONITORING WELL AND IDENTIFIER
FSW 350-0064
FSW 375-0055
FSW 271-0114
FSW 375-0071
FSW 350-0110
FSW 271-0099
03MW0214F
FSW 375-0055
PUMPED-SAMPLE CONCENTRATION, IN MICROGRAMS PER LITER
DIF
FU
SIO
N-S
AM
PL
E C
ON
CE
NT
RA
TIO
N,
IN M
ICR
OG
RA
MS
PE
R L
ITE
R
FSW 271-0114FSW 350-0064FSW 350-0110FSW 375-0055FSW 375-0071
LINE OF EQUAL CONCENTRATIONSDIRECTION OF CHANGE
EXPLANATION
EXPLANATION
Agreement between methods worsenedfrom the first sampling to the second
Agreement between methods improvedfrom the first sampling to the second
Agree
men
t bet
ween
the
met
hods
did
not c
hang
e
A.
B.

Comparison of Wells Sampled with Two Pumping Methods
Because two sampling protocols were used to collect the pumped samples, six wells were sampled by both methods to address concerns that the use of different protocols affected the pumped-sample concentration. The RPD between the pumped-sample and diffusion-sample concentrations decreased from the first trial to the second trial for all sampled wells except one, FSW 271-0099 (fig. 5A). Moreover, the difference between RPDs for three wells—FSW 271-0114, FSW 375-0071, and FSW 375-0055—decreased by more than 20 percentage points from the first trial to the second trial (fig. 5A).
The better agreement between the VOC concentrations in the diffusion and pumped samples obtained by using the second pumping protocol may be a function of the sampling order and not the methods used. The average difference in the concentrations of the pumped samples was 1.3 µg/L, whereas the differences in diffusion-sample concentrations were almost twice that value. Furthermore, the data indicate that for the five wells for which the RPD decreased on the second trial, the diffusion-sample concentrations increased in all cases, whereas the pumped-sample concentrations remained rela-tively constant (fig. 5B). This constant concentration in the pumped sample is evidenced by the near-vertical direction of the arrows in figure 5B. Therefore, the increases in diffusion-sampler concentrations, not changes in the pumped-sample concentrations, caused the lower RPDs for the second trial (fig. 5B).
These wells had been purged 1 month earlier when the first set of samples was collected. The purging could have removed sediment or biological materials clogging the screen,
thereby increasing the movement of ground water through the well screen. Alternatively, the recent sampling could have purged stagnant water within the well and ensured that the water that interacted with the diffusion sampler during the second trial was representative of ground water outside the well. It is important to note that, although the RPD decreased after purging, the general degree of agreement remained the same; the degree of agreement between concentrations obtained by the two methods was good except for well FSW 350-0110, which showed a poor degree of agreement for both samplings (fig. 5B).
Samples Collected above the Well ScreenA vertical series of diffusion samplers was installed
above the screen of one well with a long (greater than 100 ft) water column (03MW0214B) so that VOC concen-trations from the diffusion sampler installed in the screened interval could be compared with VOC concentrations in the presumably stagnant water column above the well screen (table 4). Three VOCs were detected in every sample: PCE, TCE, and cis1,2-DCE. None of the VOC concentrations detected in the diffusion sampler set in the screen matched the respective pumped-sample concentrations (table 4). However, the concentrations in the sample from the diffusion sampler set in the screen matched the concentrations in the diffusion samplers installed in the blank casing above the screened interval (table 4). This result indicates that the VOC concen-trations in the screen were similar to the VOC concentrations in the presumably stagnant water above the screen instead of being similar to the concentrations of VOCs in the ground water adjacent to the screen.
Table 4. Analysis of volatile organic compounds for samples collected from well 03MW0214B, Massachusetts Military Reservation, Cape Cod, Massachusetts, July 1999.
[Samples were collected from four diffusion samplers installed in the well. One sample was collected by the pumped-sampling method. Water level at the time of sample collection was 12.51 ft below land surface and depth to top of screen is 121.4 ft below land surface. ft, foot; µg/L, micrograms per liter; --, no sample collected at this depth]
Height above top of well
screen (ft)
Tetrachloroethene (PCE) Trichloroethene (TCE) cis1,2-Dichloroethene (cis1,2-DCE)
Pumped sample (µg/L)
Diffusion sample (µg/L)
Pumped sample (µg/L)
Diffusion sample (µg/L)
Pumped sample (µg/L)
Diffusion sample (µg/L)
15 -- 1.49 -- 239 -- 2.84 5.3 -- 1.38 -- 244 -- 2.66 2 -- 1.45 -- 259 -- 2.93
In screen 5.49 1.42 1,000 274 6.02 2.82
16 Comparison of Diffusion- and Pumped-Sampling Methods to Monitor VOCs in Ground Water, MMR, Cape Cod, MA

Comparison of Sampling Methods to Characteristics External to the Methods
When the diffusion- and pumped-sampling methods were compared by well, the degree of agreement between the diffusion- and pumped-sample concentrations was good for some wells and poor for others. Furthermore, re-sampling of selected wells showed that the qualitative degree of agreement between the pumped- and diffusion-sample concentrations did not change. These results indicate that the utility of diffusion samplers in collecting samples with concentrations similar to those in pumped samples may be related to characteristics external to the sampling methods.
Thirteen characteristics were tabulated for each well. These characteristics and the reasons why these character-istics may be related to the agreement between the methods
are listed in table 5. Scatter plots (not shown) were used to compare the RPDs between the pumped- and diffusion-sample concentrations for each well and these characteristics; however, none of the characteristics listed in table 5 revealed a relation with RPDs except for screen length.
A further comparison of screen length was warranted because previous studies did not include wells with screened intervals as short as 2 ft. Only four wells in this study did not have 2-ft or 5-ft screens, so there were enough wells in the data set to warrant the use of a signed-rank test. In previous studies, substantial vertical variations in VOC concentra-tions were measured in samples from multiple diffusion samplers installed along the entire interval of a long well screen (Church, 2000; Vroblesky and others, 2000; Vroblesky and Peters, 2000). A pumped sample might integrate these variations, whereas a diffusion sampler might measure the
Table 5. List of quantitative characteristics explored to determine if a relation was present between the characteristic and the degree of agreement of the diffusion- and pumped-sample concentrations and the reasons why each characteristic might affect the agreement between the methods for this study at the Massachusetts Military Reservation, Cape Cod, Massachusetts.
CharacteristicPossible reasons characteristic may affect the
agreement between the methods
Year well installed Older well screens may clog over time, inhibiting ground-water flow through the well screen.
Diameter of well Convergence of flow toward the open borehole is directly related to borehole diameter, and therefore, could affect the rate of exchange of water through the well screen1.
Submergence of sampler below top of water column The length of the water column above sampler could affect volatilization of compounds.
Number of days diffusion sampler deployed The diffusion sampler must be deployed in the well for a sufficient amount of time to let the water in the sampler equilibrate with the surrounding ground water.
Depth to bottom of screened interval from land surface Because finer sediments could clog the well screen and inhibit the flow, this characteristic was used as a surrogate for the general fining of the outwash deposits with depth2.
Horizontal hydraulic conductivity3
Vertical hydraulic conductivity3
Anisotropic ratio3
Average linear ground-water velocity3
General aquifer characteristics may affect ground-water-flow rates and exchange of water in the well screen.
Dissolved oxygen concentration at time of sample collectionpH at time of sample collectionTemperature at time of sample collection
A chemical process may be affecting diffusion of volatile organic compounds into the diffusion sampler.
Length of well screen Long-screened wells have more potential for vertical mixing of water along the screened interval than wells with short screens and more chance for vertical concentration variations along the screened interval4.
1Freeze and Cherry, 1979, p. 428–430.2Masterson and others, 1997.3Air Force Center for Environmental Excellence, 2001; 2002a; 2002b; 2003a; 2003b.4Church and Granato, 1996.
Comparison of Diffusion- and Pumped-Sampling Methods 17

concentrations only at the location in the well screen where it was installed. Therefore, the 2-ft-screened wells may produce better agreement between concentrations obtained by the two methods.
If the agreement between concentrations in samples collected by the two methods for 2-ft-screened wells was significantly better than the agreement for the 5-ft-screened wells, the RPDs for the 2-ft-screened wells would almost always be lower than for the 5-ft-screened wells. A one-sided signed-rank test was applied to the data set, which included 22 wells with 2-ft screens and 30 wells with 5-ft screens. In this case, the alternative hypothesis was that the 2-ft-screened wells have significantly lower RPDs than the 5-ft-screened wells. With a calculated p-value of 0.0002, the signed-rank test showed that the RPDs for the 2-ft-screened wells were signifi-cantly different and lower than the RPDs for the 5-ft-screened wells. This p-value was calculated using the S-PLUS statistical software package (Statistical Science, Inc., 1991).
Study Limitations, Methods Agreement, and Long-Term Monitoring
Comparisons of diffusion- and pumped-sample concentrations indicate that the diffusion-sample concentration approximates the pumped-sample concentration to a good degree for many, but not all, wells and VOCs. The degree of agreement between the concentrations determined by the two methods was repeatable and not likely affected by variability within each sampling method. Quantitative characteristics external to the sampling methods were compared to the RPDs between the pumped- and diffusion-sample concentrations to determine how these characteristics might be related to the degree of agreement in VOC concentrations obtained by means of the two sampling methods; only the screen length indicated a relation with the RPDs.
An important assumption made when comparing diffusion- and pumped-sample concentrations is that the pumped-sample concentration is the true concentration; therefore, in this study, evaluation of the diffusion-sampling method was based on how well the diffusion-sample concentration could represent the pumped-sample concentra-tion. In the diffusion-sampling method, the concentrations of VOCs are measured at the locations where the samplers have been installed; whereas, in the pumped-sampling method, a composite sample of ground water is collected from an unknown contributing zone around the well screen. Pumping could pull ground water from areas of higher hydraulic conductivity above or below the well screen; the pumping action could result in higher or lower concentrations of VOCs in the pumped sample than the concentrations found in the well screen under ambient conditions (Vroblesky, 2001). For example, if the ground water contained higher VOCs concentrations above or below the screen, the concentrations
in the diffusion sample would consistently underrepresent the concentrations in the pumped sample, even though the diffusion sample would be correctly measuring VOC concen-trations in the ground water moving through the screen at the section where the diffusion sampler was installed (Vroblesky, 2001). Although these uncertainties are present and may explain some of the differences between the pumped- and diffusion-sample concentrations, it is reasonable to assume that the pumped-sample concentrations are representative of ambient ground-water quality at the well site.
Limitations of the Study Design
The selection of wells from the present (1999–2002) long-term water-quality-monitoring program at the MMR was based mostly on the efficiency and cost-effectiveness of the sampling effort. This well-selection method enabled testing the diffusion method for a larger data set than in previous studies; however, the study design led to different combinations of VOCs being detected in each well.
Although assigning a value of zero to all data values below the analytical detection limit is not the best approach to handling this type of data (Helsel and Hirsch, 1992), analytical detection limits were typically less than 0.5 µg/L. Any differ-ence in concentrations below the detection limit obtained by the two methods would be close to zero. Furthermore, because sampling was done during a period of 3 years, analytical detection limits varied for individual VOCs. Assigning a zero value to these data was the most efficient way to include them in the analysis. Furthermore, a Monte Carlo analysis indicated that assigning a zero value instead of the detection limit did not alter the mean or median values of the data. The results of this analysis are not presented here because it is beyond the scope of this report.
Only eight replicate samples were collected, and repli-cates of both diffusion and pumped samples were collected at only one well. Replicates can be used to determine the total variability of the sampling method. Previous studies have used the variability between VOC concentrations in the original and replicate samples to quantify an acceptable amount of difference between the results from the diffusion and pumped samples (Vroblesky and Peters, 2000; Vroblesky and Pravecek, 2002).
For each well in their study, Vroblesky and Peters (2000) used the variability between results for replicate pumped samples to define an acceptable difference between diffusion- and pumped-sample VOC concentrations. For example, if the VOC concentrations of the original and replicate pumped samples at a given well differed by 15 percent and the diffusion- and pumped-sample concentrations differed by 10 percent, the diffusion- and pumped-sample concentrations would be considered to be in good agreement, even though they were not an exact match; however, an acceptable differ-ence could not be identified in this investigation because too few replicate samples were collected.
18 Comparison of Diffusion- and Pumped-Sampling Methods to Monitor VOCs in Ground Water, MMR, Cape Cod, MA

Limitations of the Statistical Analyses
Many analyses in this study involved a comparison of paired data, that is, a comparison of the pumped- and diffusion-sample concentrations for a given VOC or well. The VOCs for which the sign test indicated bias in the utility of the diffusion-sampling method to match the pumped-sample concentrations were PCE and TCE; these were also the VOCs whose concentrations were most frequently above the analytical detection limits. Most of the remaining VOC data could not be subjected to any statistical test because of the small sample size. This result does not imply that, given more samples, analyses of the other VOCs would show bias; however, these results make it difficult to draw defini-tive conclusions about the reliability of the diffusion-sample concentrations for VOCs other than PCE and TCE.
Statistical tests such as the paired-t test and signed-rank test can be used to assess the quantitative differences between paired data. Both tests were considered for use in this study to analyze differences between the sampling methods; however, the conditions required to apply these tests could not be met with the data. Although more powerful statistical tests could not be used, the conclusions of the sign tests were verified by visual observations of the pattern in the data, as shown in the figures.
Factors Affecting the Agreement between Methods
For the wells that were sampled twice by the diffusion- and pumped-sampling methods, the agreement between the concentrations obtained by the two methods remained the same for a given well, even after a long elapsed time between sampling rounds and a substantial change in concentrations of VOCs. This persistent agreement between the methods might be related to some characteristic external to the sampling methods. Of the characteristics investigated, screen length indicated a significant relation to the RPD between the pumped- and diffusion-sample concentrations.
The wells with 2-ft screens had significantly lower RPDs than wells with 5-ft screens; however, it is not clear why this result is the case. One hypothesis is that there is more potential for vertical flow, and therefore, concentration variations along the longer screens than along the shorter screens. Pumping would integrate concentrations over the entire length of the screen, whereas diffusion sampling would measure concentra-tions only in the discrete section of screen where the sampler was installed. Vertical differences in concentration may be present in the screened interval for some wells; however, replicate diffusion samples collected in three wells with 5-ft screens do not support this explanation. The replicate diffusion samples were obtained from two separate samplers hanging at different heights in the well screen, but the RPDs between the two diffusion samples were small (less than 6 percent). Installation of diffusion samplers along the entire length of the
screened intervals in these and other wells would help deter-mine if this apparent lack of variation in concentrations along the well screens is typical of wells at the MMR.
The diffusion-sampling method has been described by others as a good approximation to the pumped-sampling method in wells with screens that are longer than 5 ft. Huffman (2002) compared the concentrations from the diffusion- and pumped-sampling methods in wells with 10-ft screens and reported no bias in the utility of the diffu-sion-sampling method in representing the pumped-sample concentrations. Nevertheless, for this study, a difference between the RPDs for total VOC concentrations measured in samples from the 2-ft and 5-ft-screened wells was observed. The RPDs for concentrations in samples from the 2-ft-screened wells were significantly lower than from wells with 5-ft screens.
Samples collected in the blank casing above the screen at one well indicated that the concentrations of VOCs in the diffusion sampler at the screened interval more closely resembled concentrations in the stagnant water above the screen than the concentrations in the pumped sample. Furthermore, at six wells there was better agreement between concentrations measured in the second sampling round (the wells had been purged recently) than in first sampling round (the wells had not been purged recently). These observations support the hypothesis that stagnant water remains in the well screen between sampling rounds unless ground water passes freely through the well screen. Factors that affect this flushing may be particular to each well and may determine how well the methods will agree. Direct measurements of flushing rates in the wells screens would help to determine if the diffusion samplers in particular wells are in direct connection with the ambient ground water adjacent to the well screen or only with the stagnant water above the well screen.
Long-Term Monitoring with Diffusion Samplers at the Study Area
Although diffusion-sample concentrations generally were less than pumped-sample concentrations, the diffu-sion samples were just as likely to detect the VOCs as the pumped samples. Therefore, with respect to the detection of the presence or absence of a particular VOC, the diffusion-sampling method is as effective as pumped-sampling methods for long-term monitoring and could be used to monitor contaminant-plume boundaries. At a given well, the agreement between the diffusion- and pumped-sample concentrations did not vary unless the diffusion sampling was done soon after the well had been pumped in a previous sampling event. If pumped-sampling methods are replaced by diffusion-sampling methods at a well where the degree of agreement between VOC concentrations obtained by the two methods was good in an initial field comparison, the results of this analysis indicate it is likely that the good degree of agreement will not change. Until there is a better understanding of the factors that
Study Limitations, Methods Agreement, and Long-Term Monitoring 19

might affect the agreement between the methods, a one-time well-by-well comparison could be used to determine which wells would be good candidates for replacement of traditional pumped-sampling methods by diffusion sampling. Diffusion samplers could be used to monitor VOC concentrations in the water in such wells with confidence.
SummaryDiffusion and pumped samples were collected from
89 monitoring wells at and near the Massachusetts Military Reservation (MMR) and analyzed for 36 volatile organic compounds (VOCs) by the U.S. Geological Survey in coopera-tion with the Air Force Center for Environmental Excellence. With this data set, various visual and statistical comparisons were made to determine the potential usefulness of diffusion samplers as an alternative method to monitor concentrations of VOCs in ground-water monitoring wells.
There was no substantial difference between the utili-ties of diffusion sampling and pumped sampling as methods to detect the presence or absence of a particular VOC. Visual inspection of the graphical display of individual VOC concentrations in the pumped sample plotted in rela-tion to the diffusion-sample concentrations—particularly for PCE and TCE—showed a tendency for the diffusion-sample concentration to underpredict the pumped-sample concentration; this bias was confirmed statistically. When individual VOC concentrations were summed and the resulting total VOC concentrations compared by well, the same conclu-sion was reached. This result was expected because PCE and TCE concentrations detected in the wells dominated the calculation of many of the total VOC concentrations.
Poor agreement between the pumped- and diffusion-sampler concentrations of total VOCs was not likely a result of variability inherent to the sampling methods. The differ-ence between the total VOC concentrations in the original and replicate pumped samples was small; the same observa-tion was true for the original and replicate diffusion samples. Furthermore, the relative percent difference (RPD) between the pumped- and diffusion-sample concentrations for each well was greater than the RPD between the replicate samples for each method.
The agreement between the sampling methods was repeatable. If the diffusion- and pumped-sample concentrations agreed well in the first round, the second
round of sampling produced the same result. This observation was true even for the case of a 3-year interval between the first and second rounds, during which VOC concentrations decreased by a factor of 10.
The signed-rank test showed better agreement between the methods in wells with 2-ft screens as compared to wells with 5-ft screens; however, it is not clear why this is the case. There is evidence from repeated sampling and from the results of diffusion samplers hung in series above the well screen to indicate that the flushing rate of water through the screen affects the degree of agreement between the methods. Direct measurements of well-screen flushing rates could confirm this hypothesis and lead to a better understanding of the applicability of diffusion sampling at the MMR.
Despite poor agreement between the concentrations obtained by the two methods at some wells, the degree to which the concentrations agree at a given well is repeatable. A one-time, well-by-well comparison between diffusion- and pumped-sampling methods could determine which wells are good candidates for use of diffusion samplers. For wells with good agreement, the diffusion-sampler method is a time-saving and cost-effective alternative to pumped-sampling methods in a long-term monitoring program such as at the Massachusetts Military Reservation.
AcknowledgmentsThe authors thank Rose Forbes and Jon Davis of the
Air Force Center for Environmental Excellence for their support of this project, USGS colleagues Don Vroblesky, Forest Lyford, Peter Church, and professors Richard Vogel and Bruce Boghosian of Tufts University for their invaluable technical assistance; Drew Tingley and John Guay of CH2M Hill (formerly of Jacobs Engineering), for the retrieval of the diffusion samplers and collection of the pumped samples; Shannon Dionne, Caroline Olson, and Vicki-Rose Siegel of the USGS for their assistance in the construction, instal-lation, and retrieval of the diffusion samplers and for their help with the data reduction and analysis; Josh Cummings (formerly of Severn Trent Laboratories) of Jacobs Engineering for analysis of water samples; and Ank Webbers and Reagan Huffman of the USGS, Rose Forbes of AFCEE, and Richard Willey and Kathryn Hess (formerly of the USGS) of the U.S. Environmental Protection Agency for their report reviews.
20 Comparison of Diffusion- and Pumped-Sampling Methods to Monitor VOCs in Ground Water, MMR, Cape Cod, MA

References Cited
Air Force Center for Environmental Excellence, 2001, Final Fuel Spill-1 wellfield design report: Otis Air National Guard Base, MA, AFC-J23-35S19902-M23-0005, prepared by Jacobs Engineering Group, Inc., for AFCEE/MMR, Installation Restoration Program, December 2001, variously paged.
Air Force Center for Environmental Excellence, 2002a, Final Fuel Spill-12 2001 annual system performance and ecological impact monitoring report: Otis Air National Guard Base, MA, ENR-J23-35Z15603-M31-0004, prepared by Jacobs Engineering Group, Inc., for AFCEE/MMR, Installation Restoration Program, November 2002, variously paged.
Air Force Center for Environmental Excellence, 2002b, Final combined Storm Drain-5 and Chemical Spill-10 2001 annual system performance and ecological impact moni-toring report: Otis Air National Guard Base, MA, A3P-J23-35Z01504-M31-0005, prepared by Jacobs Engineering Group, Inc., for AFCEE/MMR, Installation Restoration Program, July 2002, variously paged.
Air Force Center for Environmental Excellence, 2003a, Draft Landfill-1 2002 annual system performance and ecological impact monitoring report: Otis Air National Guard Base, MA, NER-J23-35Z15609-M31-0002, prepared by Jacobs Engineering Group, Inc., for AFCEE/MMR, Installation Restoration Program, January 2003, variously paged.
Air Force Center for Environmental Excellence, 2003b, Final Ashumet Valley Axial 2001 annual system performance and ecological impact monitoring report: Otis Air National Guard Base, MA, ENR-J23-35Z15613-M31-0004, prepared by Jacobs Engineering Group, Inc., for AFCEE/MMR, Installation Restoration Program, January 2003, variously paged.
Air Force Center for Environmental Excellence, 2004, Overview of ground-water plumes; accessed on March 17, 2004, at http://www.mmr.org/Cleanup/plumes/overview.htm
Church, P.E., 2000, Evaluation of a diffusion sampling method for determining concentrations of volatile organic compounds in ground water, Hanscom Air Force Base, Bedford, Massachusetts: U.S. Geological Survey Water-Resources Investigations Report 00-4242, 20 p.
Church, P.E. and Granato, G.E., 1996, Bias in ground-water data caused by well-bore flow in long screen wells: Groundwater, v. 34, no. 2, p. 262–273.
Freeze, R.A., and Cherry, J.A., 1979, Ground Water: Edgewood Cliffs, NJ, Prentice-Hall, 604 p.
Helsel, D.R., and Hirsch, R.M., 1992, Statistical methods in water resources: New York, Elsevier Science Publishing Company, Inc., Studies in Environmental Science 49, 522 p.
Huffman, R.L., 2002, Comparison of passive diffusion bag samplers and submersible pump sampling methods for monitoring volatile organic compounds in ground water at Area 6, Naval Air Station Whidbey Island, Washington: U.S. Geological Survey Water-Resources Investigations Report 02-4203, 24 p.
LeBlanc, D.R., 1984, Sewage plume in a sand and gravel aquifer, Cape Cod, Massachusetts: U.S. Geological Survey Water-Supply Paper 2218, 28 p.
Masterson, J.P., Stone, B.D., Walter, D.A., and Savoie, J., 1997, Hydrogeologic framework of western Cape Cod, Massachusetts: U.S. Geological Survey Hydrologic-Investigations Atlas 741, 1 pl.
Oldale, R.N., and Barlow, R.A., 1986, Geologic map of Cape Cod and the Islands, Massachusetts: U.S. Geological Survey Miscellaneous Investigations Series Map I-1763, scale 1:100,000, 1 sheet.
Savoie, Jennifer, 1995, Altitude and configuration of the water table, western Cape Cod, Massachusetts, March 1993: U.S. Geological Survey Open-File Report 94-462, 1 sheet, scale 1:50,000.
Savoie, Jennifer, and LeBlanc, D.R., eds., 1998, Water-quality data and methods of analysis for samples collected near a plume of sewage-contaminated ground water, Ashumet Valley, Cape Cod, Massachusetts, 1993-94: U.S. Geological Survey Water-Resources Investigations Report 97-4269, 208 p.
Statistical Science, Inc., 1991, S-PLUS reference manual: Seattle, WA, Statistical Science, Inc., 846 p.
U.S. Environmental Protection Agency, 1988, Methods for the determination of organic compounds in drinking water: EPA-600/4-88-039, variously paged.
References Cited 21

U.S. Environmental Protection Agency, 1995, Methods for the determination of organic compounds in drinking water: Supplement III, 500 Series, EPA-600/R-95-131, variously paged.
U.S. Environmental Protection Agency, 1996, Low stress (low flow) purging and sampling procedure for the collection of groundwater samples from monitoring wells: Region 1 Low Stress (Low Flow) SOP, SOP # GW 0001, July 1996, Revision 2, 13 p.
University of Amsterdam, 2003, Institute for Phonetic Sciences Services—Statistical tests; accessed on October 9, 2003, at http://fonsg3.let.uva.nl/Service/Statistics.html
Vroblesky, D.A., 2001, User’s guide for polyethylene-based diffusion bag samplers to obtain volatile organic compound concentrations in wells, part 1—Deployment, recovery, data interpretation, and quality control and assurance: U.S. Geological Survey Water-Resources Investigations Report 01-4060, 18 p.
Vroblesky, D.A., Borchers, J.W., Campbell, T.R., and Kinsey, W.B., 2000, Investigation of polyethylene passive diffu-sion samplers for sampling volatile organic compounds in ground water at Davis Global Communications, Sacramento, California, August 1998 to February 1999: U.S. Geological Survey Open-File Report 00-307, 13 p.
Vroblesky, D.A., and Hyde, W.T., 1997, Diffusion samplers as an inexpensive approach to monitoring VOCs in ground water: Ground Water Monitoring and Remediation, v. 17, no. 3, p. 177–184.
Vroblesky, D.A., and Peters, B.C., 2000, Diffusion sampler testing at Naval Air Station North Island, San Diego County, California, November 1999 to January 2000: U.S. Geological Survey Water-Resources Investigations Report 00-4182, 27 p.
Vroblesky, D.A., and Petkewich, M.D., 2000, Field testing of passive diffusion bag samplers for collection of ground-water volatile organic compound concentrations at Naval Industrial Reserve Ordnance Plant, Fridley, Minnesota, November 1999 to May 2000: U.S. Geological Survey Water-Resources Investigations Report 00-4246, 10 p.
Vroblesky, D.A., Petkewich, M.D., and Casey, C.C., 2001, Evaluation of passive diffusion bag samplers in selected wells at the Naval Surface Warfare Center, Louisville, Kentucky, July 1999 to January 2000: U.S. Geological Survey Water-Resources Investigations Report 01-4163, 16 p.
Vroblesky, D.A., and Pravecek, T., 2002, Evaluation of passive diffusion bag and dialysis samplers in selected wells at Hickam Air Force Base, Hawaii, July 2001: U.S. Geological Survey Water-Resources Investigation Report 02-4159, 28 p.
Walter, D.A, and Whealan, A.T., 2005, Simulated effects of pumping and water sources to wells and surface waters, Sagamore and Monomoy Flow Lenses, Cape Cod, Massachusetts: U.S. Geological Survey Scientific Investigations Report 2004-5181, 85 p.
22 Comparison of Diffusion- and Pumped-Sampling Methods to Monitor VOCs in Ground Water, MMR, Cape Cod, MA

Appendix: Analytical Results for Selected Volatile Organic Compounds by Well for Diffusion- and Pumped-Sampling Methods, Including Wells with Two Sets of Samples Collected or with Replicate Samples Collected, and Samples Collected for Quality Assurance, Massachusetts Military Reservation, Cape Cod, Massachusetts, July 1999–December 2002


Tables 1-1. Analytical results for volatile organic compounds detected in more than six
wells for samples collected by diffusion- and pumped-sampling methods, including wells with two sets of samples collected or with replicate samples collected, Massachusetts Military Reservation, Cape Cod, Massachusetts, July 1999–December 2002 ........................................................................................................ 27
1-2. Analytical results for volatile organic compounds detected in six or fewer wells for samples collected by diffusion- and pumped-sampling methods, including wells with two sets of samples collected or with replicate samples collected, Massachusetts Military Reservation, July 1999–December 2002 ..................................... 33
1-3. Total volatile organic compound concentrations by well with two sets of samples collected or with replicate samples collected, Massachusetts Military Reservation, July 1999–December 2002 ................................................................................ 45
1-4. Analytical results for volatile organic compounds detected in more than six wells for samples collected for quality assurance, Massachusetts Military Reservation, August 1999–December 2002 ........................................................................... 51
1-5. Analytical results for volatile organic compounds detected in six or fewer wells for samples collected for quality assurance, Massachusetts Military Reservation, August 1999–December 2002 ........................................................................... 52


Table 1-1. Analytical results for volatile organic compounds detected in more than six wells for samples collected by diffusion- and pumped-sampling methods, including wells with two sets of samples collected or with replicate samples collected, Massachusetts Military Reservation, Cape Cod, Massachusetts, July 1999–December 2002.—Continued
[Well ID: See figure 1 for location. All concentrations in micrograms per liter. cis1,2-DCE, cis1,2-dichloroethene; EDB, 1,2-dibromoethane; ID, identifier; NA, not analyzed; PCE, tetrachloroethene; R, second sampling event for well; REP, replicate sample; TCE, trichloroethene; <, less than the analytical detection limit]
Well ID
Well number
Date diffusion sampler retrieved
Sample type
PCE TCE cis1,2-DCE Chloroform EDB1,2-Di-chloro-
benzene
1 03MW0054A 8-12-1999 Diffusion 1.19 266 3.02 <0.29 <0.28 <0.24 8-12-1999 Pumped 1.5 258 2.87 <.29 <.28 <.24 2 03MW0054B 8-12-1999 Diffusion <.22 <.35 <.24 <.29 <.28 <.24 8-12-1999 Pumped <.22 <.35 <.24 <.29 <.28 <.24
3 03MW0064 8-16-1999 Diffusion <.22 16.7 <.24 <.29 <.28 <.24 8-16-1999 Pumped <.22 19.7 <.24 <.29 <.28 <.24 4 03MW0214B 8-12-1999 Diffusion 1.42 274 2.82 <.29 <.28 <.24 8-12-1999 Pumped 5.49 1,000 6.02 <.29 <.28 <.24
5 03MW0214F 8-12-1999 Diffusion 5.32 241 10.3 <.29 <.28 <.24 8-12-1999 Pumped 7.48 310 10.7 <.29 <.28 <.24 03MW0214F-R 11-12-2002 Diffusion .28 2.75 <.347 <.336 <.002 <.305 11-12-2002 Pumped .29 3.26 <.347 <.336 <.002 <.305
6 03MW2413A 8-16-1999 Diffusion <.22 38.6 <.24 <.29 <.28 <.24 8-16-1999 Pumped 1.66 156 2.34 <.29 <.28 <.24 03MW2413A-R 11-12-2002 Diffusion <.146 .53 <.347 <.336 <.002 <.305 11-12-2002 Pumped .32 25.6 <.347 <.336 <.002 <.305
7 03MW2413B 11-12-2002 Diffusion <.146 20 <.347 .82 <.002 <.305 11-12-2002 Pumped .86 88.7 .9 .7 <.002 <.305 8 27MW0023A 8-04-1999 Diffusion 8.5 10 <.26 2 <.32 <.24 8-04-1999 Pumped 11 9.1 <.26 1.8 <.32 <.24 27MW0023A-R 4-06-2000 Diffusion 3.6 3.3 <.08 .76 <.1 <.08 4-06-2000 Pumped 3.5 2.6 <.08 .62 <.1 <.08 4-06-2000 Pumped REP 3.7 2.7 <.08 .62 <.1 <.08 9 27MW0024A 8-09-1999 Diffusion 1.7 1.2 28 <.22 <.32 <.24 8-09-1999 Pumped 4.4 1.6 34 <.22 <.32 <.24
10 27MW0026A 8-05-1999 Diffusion 1.8 .95 <.13 .9 <.16 <.12 8-05-1999 Diffusion REP 1.9 .93 <.13 .88 <.16 <.12 8-05-1999 Pumped 4.2 1.1 <.13 .88 <.16 <.12 8-05-1999 Pumped REP 4.5 1.2 <.13 .95 <.16 <.12
11 27MW0026B 8-05-1999 Diffusion 2.4 1.4 <.13 2.2 <.16 <.12 8-05-1999 Pumped 29 7.1 <.26 7.4 <.32 <.24 27MW0026B-R 4-10-2000 Diffusion 3 2.2 <.08 4.1 <.1 <.08 4-10-2000 Pumped 24 5.8 .81 6.1 .67 <.08
12 27MW0031A 8-09-1999 Diffusion 15 150 45 <1.1 <1.6 <1.2 8-09-1999 Pumped 21 150 48 <1.1 <1.6 <1.2 27MW0031A-R 4-07-2000 Diffusion 11 99 37 <.4 <.5 <.45 4-07-2000 Pumped 14 91 33 <.4 <.5 <.45
13 27MW0031B 8-06-1999 Diffusion 1.7 16 17 2.6 <.16 <.12 8-06-1999 Pumped 7.7 31 26 3.3 <.32 <.24 27MW0031B-R 4-07-2000 Diffusion 2.6 29 20 1.7 <.2 <.16 4-07-2000 Pumped 5.2 30 24 2.4 <.2 <.16
Appendix 27

Table 1-1. Analytical results for volatile organic compounds detected in more than six wells for samples collected by diffusion- and pumped-sampling methods, including wells with two sets of samples collected or with replicate samples collected, Massachusetts Military Reservation, Cape Cod, Massachusetts, July 1999–December 2002.—Continued
[Well ID: See figure 1 for location. All concentrations in micrograms per liter. cis1,2-DCE, cis1,2-dichloroethene; EDB, 1,2-dibromoethane; ID, identifier; NA, not analyzed; PCE, tetrachloroethene; R, second sampling event for well; REP, replicate sample; TCE, trichloroethene; <, less than the analytical detection limit]
Well ID
Well number
Date diffusion sampler retrieved
Sample type
PCE TCE cis1,2-DCE Chloroform EDB1,2-Di-chloro-
benzene
14 27MW0033 8-05-1999 Diffusion <0.1 <0.12 <0.13 <0.11 <0.16 <0.12 8-05-1999 Pumped <.1 4.9 1.1 <.11 <.16 <.12 8-05-1999 Pumped REP <.1 4.5 1.2 <.11 <.16 <.12
15 27MW0037A 8-11-1999 Diffusion 3.9 19 <.13 .61 <.16 <.12 8-11-1999 Diffusion REP 5.2 18 <.13 .79 <.16 <.12 8-11-1999 Pumped 2.7 39 <.26 <.22 <.32 <.24 27MW0037A-R 4-04-2000 Diffusion 3.9 15 <.08 <.08 <.1 <.08 4-04-2000 Pumped 3.6 27 <.16 <.16 <.2 <.16
16 27MW0038A 8-11-1999 Diffusion <.1 <.12 <.13 <.11 <.16 <.12 8-11-1999 Pumped 1 2.6 .93 .96 <.16 <.12 17 27MW0046 10-11-1999 Diffusion 1.61 2.56 .54 < .11 < .1 < .12 10-11-1999 Pumped 1 2.4 .74 < .11 < .1 < .12
18 27MW0102A 8-11-1999 Diffusion 16 6.1 9.6 1.1 <.16 <.12 8-11-1999 Diffusion REP 14 6.2 9.7 1 <.16 <.12 8-11-1999 Pumped 48 7.5 21 <.44 <.64 <.48 27MW0102A-R 4-05-2000 Diffusion 18 5.3 11 <.08 <.1 <.08 4-05-2000 Pumped 36 5.8 24 <.16 <.2 <.16 19 27MW0102B 8-11-1999 Diffusion <.1 <.12 <.13 <.11 <.16 <.12 8-11-1999 Pumped <.1 <.12 <.13 <.11 <.16 <.12
20 27MW0108A 8-05-1999 Diffusion .42 6.3 19 <.11 <.16 <.12 8-05-1999 Pumped 1.2 51 7.2 <.44 <.64 <.48 27MW0108A-R 4-05-2000 Diffusion .71 20 1.7 <.08 <.1 <.08 4-05-2000 Pumped 1.2 31 <.32 <.32 <.4 <.32 4-05-2000 Pumped REP 1.2 31 <.32 <.32 <.4 <.32 21 27MW0108B 8-05-1999 Diffusion <.1 <.12 <.13 .9 <.16 <.12 8-05-1999 Pumped <.1 <.12 <.13 .92 <.16 <.12
22 36MW0132A 4-18-2000 Diffusion NA NA NA NA 3.33 NA 4-18-2000 Pumped NA NA NA NA 3.73 NA 23 36MW0132B 4-18-2000 Diffusion NA NA NA NA 6.14 NA 4-18-2000 Pumped NA NA NA NA 6.78 NA 24 36MW0132C 4-18-2000 Diffusion NA NA NA NA 4.56 NA 4-18-2000 Pumped NA NA NA NA 4.56 NA
25 90MW0003 9-14-1999 Diffusion <2.5 <3 <3.2 <2.8 4.28 <3.00 9-14-1999 Pumped <2 <2.4 <2.6 <2.2 <.32 <2.4 26 90MW0005 9-14-1999 Diffusion <.1 <.12 <.13 <.11 1.5 <.12 9-14-1999 Pumped <.2 <.24 <2.6 <.22 2 <.24
27 90MW0025 9-14-1999 Diffusion <.1 <.12 <.13 1.7 <.16 <.12 9-14-1999 Pumped <.1 <.12 <.13 1.4 <.16 <.12 28 90MW0028 9-14-1999 Diffusion <.1 <.12 <.13 1.2 <.16 <.12 9-14-1999 Pumped <.1 <.12 <.13 1.3 <.16 <.12
28 Comparison of Diffusion- and Pumped-Sampling Methods to Monitor VOCs in Ground Water, MMR, Cape Cod, MA
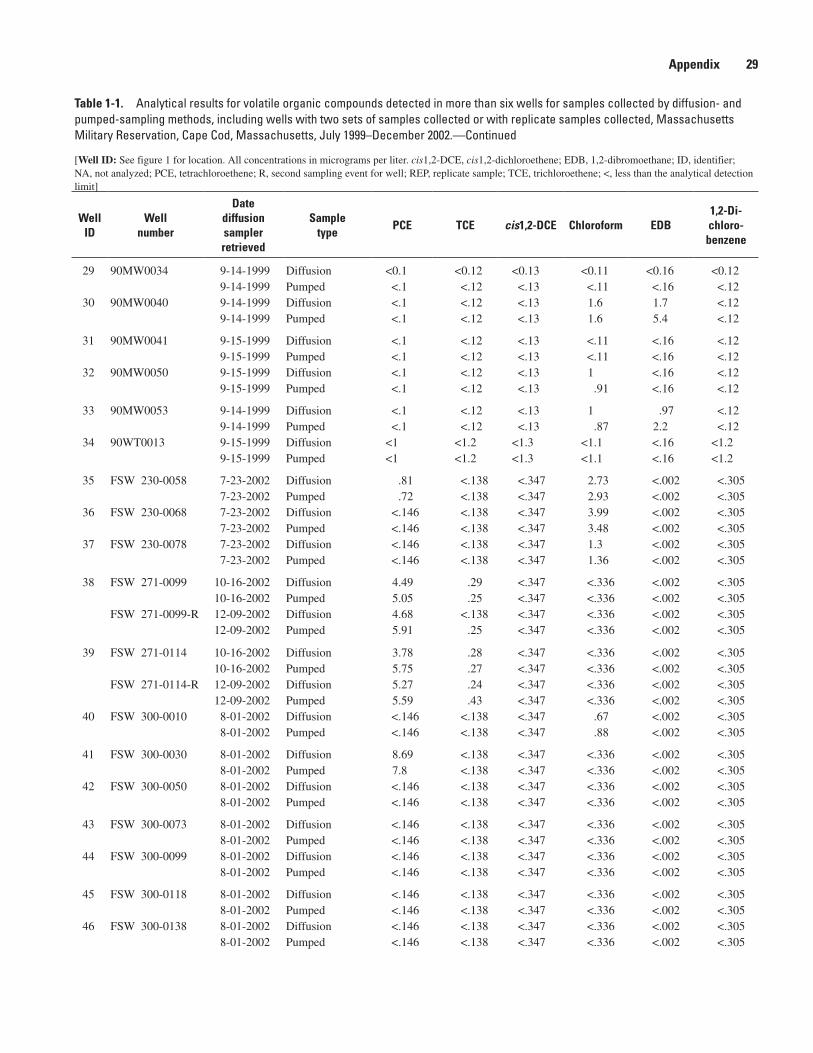
Table 1-1. Analytical results for volatile organic compounds detected in more than six wells for samples collected by diffusion- and pumped-sampling methods, including wells with two sets of samples collected or with replicate samples collected, Massachusetts Military Reservation, Cape Cod, Massachusetts, July 1999–December 2002.—Continued
[Well ID: See figure 1 for location. All concentrations in micrograms per liter. cis1,2-DCE, cis1,2-dichloroethene; EDB, 1,2-dibromoethane; ID, identifier; NA, not analyzed; PCE, tetrachloroethene; R, second sampling event for well; REP, replicate sample; TCE, trichloroethene; <, less than the analytical detection limit]
Well ID
Well number
Date diffusion sampler retrieved
Sample type
PCE TCE cis1,2-DCE Chloroform EDB1,2-Di-chloro-
benzene
29 90MW0034 9-14-1999 Diffusion <0.1 <0.12 <0.13 <0.11 <0.16 <0.12 9-14-1999 Pumped <.1 <.12 <.13 <.11 <.16 <.12 30 90MW0040 9-14-1999 Diffusion <.1 <.12 <.13 1.6 1.7 <.12 9-14-1999 Pumped <.1 <.12 <.13 1.6 5.4 <.12
31 90MW0041 9-15-1999 Diffusion <.1 <.12 <.13 <.11 <.16 <.12 9-15-1999 Pumped <.1 <.12 <.13 <.11 <.16 <.12 32 90MW0050 9-15-1999 Diffusion <.1 <.12 <.13 1 <.16 <.12 9-15-1999 Pumped <.1 <.12 <.13 .91 <.16 <.12
33 90MW0053 9-14-1999 Diffusion <.1 <.12 <.13 1 .97 <.12 9-14-1999 Pumped <.1 <.12 <.13 .87 2.2 <.12 34 90WT0013 9-15-1999 Diffusion <1 <1.2 <1.3 <1.1 <.16 <1.2 9-15-1999 Pumped <1 <1.2 <1.3 <1.1 <.16 <1.2
35 FSW 230-0058 7-23-2002 Diffusion .81 <.138 <.347 2.73 <.002 <.305 7-23-2002 Pumped .72 <.138 <.347 2.93 <.002 <.305 36 FSW 230-0068 7-23-2002 Diffusion <.146 <.138 <.347 3.99 <.002 <.305 7-23-2002 Pumped <.146 <.138 <.347 3.48 <.002 <.305 37 FSW 230-0078 7-23-2002 Diffusion <.146 <.138 <.347 1.3 <.002 <.305 7-23-2002 Pumped <.146 <.138 <.347 1.36 <.002 <.305
38 FSW 271-0099 10-16-2002 Diffusion 4.49 .29 <.347 <.336 <.002 <.305 10-16-2002 Pumped 5.05 .25 <.347 <.336 <.002 <.305 FSW 271-0099-R 12-09-2002 Diffusion 4.68 <.138 <.347 <.336 <.002 <.305 12-09-2002 Pumped 5.91 .25 <.347 <.336 <.002 <.305
39 FSW 271-0114 10-16-2002 Diffusion 3.78 .28 <.347 <.336 <.002 <.305 10-16-2002 Pumped 5.75 .27 <.347 <.336 <.002 <.305 FSW 271-0114-R 12-09-2002 Diffusion 5.27 .24 <.347 <.336 <.002 <.305 12-09-2002 Pumped 5.59 .43 <.347 <.336 <.002 <.305 40 FSW 300-0010 8-01-2002 Diffusion <.146 <.138 <.347 .67 <.002 <.305 8-01-2002 Pumped <.146 <.138 <.347 .88 <.002 <.305
41 FSW 300-0030 8-01-2002 Diffusion 8.69 <.138 <.347 <.336 <.002 <.305 8-01-2002 Pumped 7.8 <.138 <.347 <.336 <.002 <.305 42 FSW 300-0050 8-01-2002 Diffusion <.146 <.138 <.347 <.336 <.002 <.305 8-01-2002 Pumped <.146 <.138 <.347 <.336 <.002 <.305
43 FSW 300-0073 8-01-2002 Diffusion <.146 <.138 <.347 <.336 <.002 <.305 8-01-2002 Pumped <.146 <.138 <.347 <.336 <.002 <.305 44 FSW 300-0099 8-01-2002 Diffusion <.146 <.138 <.347 <.336 <.002 <.305 8-01-2002 Pumped <.146 <.138 <.347 <.336 <.002 <.305
45 FSW 300-0118 8-01-2002 Diffusion <.146 <.138 <.347 <.336 <.002 <.305 8-01-2002 Pumped <.146 <.138 <.347 <.336 <.002 <.305 46 FSW 300-0138 8-01-2002 Diffusion <.146 <.138 <.347 <.336 <.002 <.305 8-01-2002 Pumped <.146 <.138 <.347 <.336 <.002 <.305
Appendix 29

Table 1-1. Analytical results for volatile organic compounds detected in more than six wells for samples collected by diffusion- and pumped-sampling methods, including wells with two sets of samples collected or with replicate samples collected, Massachusetts Military Reservation, Cape Cod, Massachusetts, July 1999–December 2002.—Continued
[Well ID: See figure 1 for location. All concentrations in micrograms per liter. cis1,2-DCE, cis1,2-dichloroethene; EDB, 1,2-dibromoethane; ID, identifier; NA, not analyzed; PCE, tetrachloroethene; R, second sampling event for well; REP, replicate sample; TCE, trichloroethene; <, less than the analytical detection limit]
Well ID
Well number
Date diffusion sampler retrieved
Sample type
PCE TCE cis1,2-DCE Chloroform EDB1,2-Di-chloro-
benzene
47 FSW 343-0036 8-07-2002 Diffusion 1.4 <0.138 <0.347 <0.336 <0.002 <0.305 8-07-2002 Pumped 1.36 <.138 <.347 <.336 <.002 <.305 48 FSW 343-0057 8-07-2002 Diffusion .59 <.138 12.9 <.336 <.002 1 8-07-2002 Pumped 1.06 <.138 11.5 <.336 <.002 1.18
49 FSW 343-0079 8-07-2002 Diffusion <.146 <.138 <.347 <.336 <.002 <.305 8-07-2002 Pumped <.146 <.138 <.347 <.336 <.002 <.305 50 FSW 343-0099 8-07-2002 Diffusion <.146 <.138 <.347 <.336 <.002 <.305 8-07-2002 Pumped <.146 <.138 <.347 <.336 <.002 <.305
51 FSW 343-0114 8-07-2002 Diffusion <.146 <.138 <.347 <.336 <.002 <.305 8-07-2002 Pumped <.146 <.138 <.347 <.336 <.002 <.305 52 FSW 347-0020 8-08-2002 Diffusion <.146 <.138 <.347 <.336 <.002 <.305 8-08-2002 Pumped <.146 <.138 <.347 <.336 <.002 <.305
53 FSW 347-0031 8-08-2002 Diffusion 12.1 <.138 <.347 1.29 <.002 <.305 8-08-2002 Pumped 13.3 <.138 <.347 1.29 <.002 <.305 54 FSW 347-0038 8-08-2002 Diffusion 9.16 <.138 <.347 1.39 <.002 <.305 8-08-2002 Pumped 11.1 <.138 <.347 1.31 <.002 <.305
55 FSW 347-0046 8-08-2002 Diffusion 2.6 <.138 <.347 <.336 <.002 <.305 8-08-2002 Pumped 2.52 <.138 <.347 <.336 <.002 <.305 56 FSW 347-0067 8-08-2002 Diffusion <.146 <.138 <.347 <.336 <.002 <.305 8-08-2002 Pumped <.146 <.138 <.347 <.336 <.002 <.305
57 FSW 347-0101 8-08-2002 Diffusion <.146 <.138 <.347 <.336 <.002 <.305 8-08-2002 Pumped <.146 <.138 <.347 <.336 <.002 <.305 58 FSW 347-0116 8-08-2002 Diffusion <.146 <.138 <.347 <.336 <.002 <.305 8-08-2002 Pumped <.146 <.138 <.347 <.336 <.002 <.305
59 FSW 347-0131 8-08-2002 Diffusion <.146 <.138 <.347 <.336 <.002 <.305 8-08-2002 Pumped <.146 <.138 <.347 <.336 <.002 <.305 60 FSW 347-0145 8-08-2002 Diffusion <.146 <.138 <.347 <.336 <.002 <.305 8-08-2002 Pumped <.146 <.138 <.347 <.336 <.002 <.305
61 FSW 350-0064 10-11-2002 Diffusion 7.74 <.138 <.347 <.336 <.002 <.305 10-11-2002 Pumped 7.89 .21 <.347 <.336 <.002 <.305 FSW 350-0064-R 12-09-2002 Diffusion 8.21 <.138 <.347 <.336 <.002 <.305 12-09-2002 Pumped 8.3 <.138 <.347 <.336 <.002 <.305
62 FSW 350-0110 10-11-2002 Diffusion 1.88 .54 .37 <.336 <.002 <.305 10-11-2002 Pumped 7.77 5.33 <.347 <.336 <.002 <.305 FSW 350-0110-R 12-09-2002 Diffusion 3.39 .79 .46 <.336 <.002 <.305 12-09-2002 Pumped 10.5 6.11 <.347 <.336 <.002 <.305
63 FSW 375-0055 10-24-2002 Diffusion 7.33 3.92 <.347 <.336 <.002 <.305 10-24-2002 Pumped 12.2 4.38 <.347 <.336 <.002 <.305 FSW 375-0055-R 12-09-2002 Diffusion 12.9 4.48 <.347 .54 <.002 <.305 12-09-2002 Pumped 13.8 4.18 <.347 .51 <.002 <.305
30 Comparison of Diffusion- and Pumped-Sampling Methods to Monitor VOCs in Ground Water, MMR, Cape Cod, MA

Table 1-1. Analytical results for volatile organic compounds detected in more than six wells for samples collected by diffusion- and pumped-sampling methods, including wells with two sets of samples collected or with replicate samples collected, Massachusetts Military Reservation, Cape Cod, Massachusetts, July 1999–December 2002.—Continued
[Well ID: See figure 1 for location. All concentrations in micrograms per liter. cis1,2-DCE, cis1,2-dichloroethene; EDB, 1,2-dibromoethane; ID, identifier; NA, not analyzed; PCE, tetrachloroethene; R, second sampling event for well; REP, replicate sample; TCE, trichloroethene; <, less than the analytical detection limit]
Well ID
Well number
Date diffusion sampler retrieved
Sample type
PCE TCE cis1,2-DCE Chloroform EDB1,2-Di-chloro-
benzene
64 FSW 375-0071 10-24-2002 Diffusion 1.85 0.87 <0.347 <0.336 <0.002 <0.305 10-24-2002 Pumped 3.13 1.72 <.347 <.336 <.002 <.305 FSW 375-0071-R 12-09-2002 Diffusion 4.49 2.23 <.347 <.336 <.002 <.305 12-09-2002 Pumped 3.95 2.04 <.347 <.336 <.002 <.305
65 FSW 383-0040 8-22-2002 Diffusion 2.29 <.138 <.347 .85 <.002 <.305 8-22-2002 Pumped 2.2 <.138 <.347 .86 <.002 <.305 66 FSW 383-0061 8-22-2002 Diffusion .81 <.138 <.347 <.336 <.002 <.305 8-22-2002 Pumped .47 <.138 <.347 <.336 <.002 <.305
67 FSW 383-0082 8-22-2002 Diffusion <.146 <.138 <.347 <.336 <.002 <.305 8-22-2002 Pumped <.146 <.138 <.347 <.336 <.002 <.305 68 FSW 383-0106 8-22-2002 Diffusion <.146 <.138 <.347 <.336 <.002 <.305 8-22-2002 Pumped <.146 <.138 <.347 <.336 <.002 <.305
69 FSW 424-0020 8-06-2002 Diffusion <.146 <.138 <.347 <.336 <.002 <.305 8-06-2002 Pumped <.146 <.138 <.347 <.336 <.002 <.305 70 FSW 424-0089 8-06-2002 Diffusion <.146 <.138 <.347 <.336 <.002 <.305 8-06-2002 Pumped <.146 <.138 <.347 <.336 <.002 <.305
71 FSW 424-0144 8-06-2002 Diffusion <.146 <.138 <.347 <.336 <.002 <.305 8-06-2002 Pumped <.146 <.138 <.347 <.336 <.002 <.305 72 FSW 424-0183 8-06-2002 Diffusion <.146 .52 <.347 <.336 <.002 <.305 8-06-2002 Pumped <.146 <.138 <.347 <.336 <.002 <.305
73 FSW 577-0061 8-14-2002 Diffusion <.146 <.138 <.347 .92 <.002 <.305 8-14-2002 Pumped .98 <.138 <.347 .94 <.002 <.305 74 FSW 577-0071 8-14-2002 Diffusion 2.28 <.138 <.347 1.81 <.002 <.305 8-14-2002 Pumped 2.12 <.138 <.347 1.66 <.002 <.305
75 FSW 577-0081 8-14-2002 Diffusion 1.02 <.138 <.347 <.336 <.002 <.305 8-14-2002 Pumped 1.1 <.138 <.347 <.336 <.002 <.305 76 FSW 577-0097 8-14-2002 Diffusion <.146 <.138 <.347 <.336 <.002 <.305 8-14-2002 Pumped <.146 <.138 <.347 <.336 <.002 <.305
77 SDW 316-0051 8-20-2002 Diffusion <.146 <.138 <.347 <.336 <.002 <.305 8-20-2002 Pumped <.146 <.138 <.347 <.336 <.002 <.305 78 SDW 316-0066 8-20-2002 Diffusion 1.22 <.138 <.347 <.336 <.002 <.305 8-20-2002 Pumped 1.48 <.138 <.347 <.336 <.002 <.305
79 SDW 316-0082 8-20-2002 Diffusion .53 <.138 <.347 <.336 <.002 .71 8-20-2002 Pumped .64 <.138 .76 <.336 <.002 .91 80 SDW 316-0100 8-20-2002 Diffusion <.146 <.138 <.347 <.336 <.002 <.305 8-20-2002 Pumped <.146 <.138 <.347 <.336 <.002 <.305
81 SDW 423-0058 8-21-2002 Diffusion 1.36 <.138 <.347 .77 <.002 <.305 8-21-2002 Pumped .95 <.138 <.347 .62 <.002 <.305 82 SDW 438-0041 8-13-2002 Diffusion <.146 <.138 <.347 <.336 <.002 <.305 8-13-2002 Pumped 1.31 <.138 <.347 <.336 <.002 <.305
Appendix 31
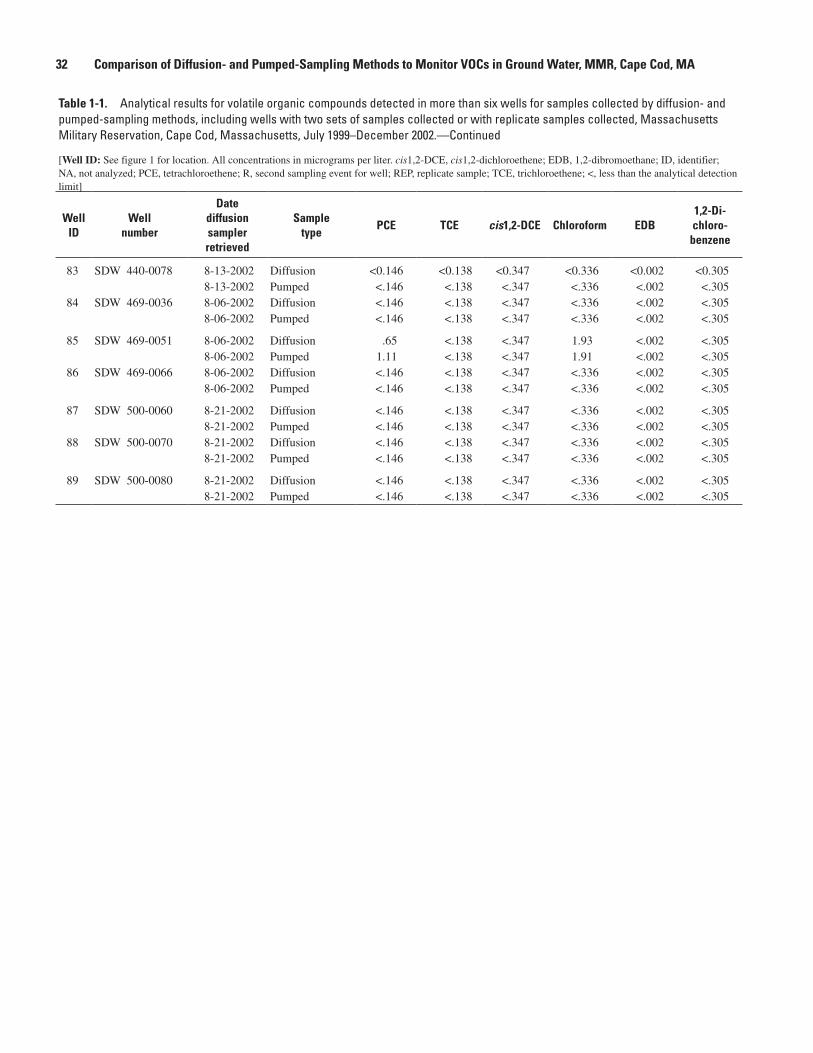
Table 1-1. Analytical results for volatile organic compounds detected in more than six wells for samples collected by diffusion- and pumped-sampling methods, including wells with two sets of samples collected or with replicate samples collected, Massachusetts Military Reservation, Cape Cod, Massachusetts, July 1999–December 2002.—Continued
[Well ID: See figure 1 for location. All concentrations in micrograms per liter. cis1,2-DCE, cis1,2-dichloroethene; EDB, 1,2-dibromoethane; ID, identifier; NA, not analyzed; PCE, tetrachloroethene; R, second sampling event for well; REP, replicate sample; TCE, trichloroethene; <, less than the analytical detection limit]
Well ID
Well number
Date diffusion sampler retrieved
Sample type
PCE TCE cis1,2-DCE Chloroform EDB1,2-Di-chloro-
benzene
83 SDW 440-0078 8-13-2002 Diffusion <0.146 <0.138 <0.347 <0.336 <0.002 <0.305 8-13-2002 Pumped <.146 <.138 <.347 <.336 <.002 <.305 84 SDW 469-0036 8-06-2002 Diffusion <.146 <.138 <.347 <.336 <.002 <.305 8-06-2002 Pumped <.146 <.138 <.347 <.336 <.002 <.305
85 SDW 469-0051 8-06-2002 Diffusion .65 <.138 <.347 1.93 <.002 <.305 8-06-2002 Pumped 1.11 <.138 <.347 1.91 <.002 <.305 86 SDW 469-0066 8-06-2002 Diffusion <.146 <.138 <.347 <.336 <.002 <.305 8-06-2002 Pumped <.146 <.138 <.347 <.336 <.002 <.305
87 SDW 500-0060 8-21-2002 Diffusion <.146 <.138 <.347 <.336 <.002 <.305 8-21-2002 Pumped <.146 <.138 <.347 <.336 <.002 <.305 88 SDW 500-0070 8-21-2002 Diffusion <.146 <.138 <.347 <.336 <.002 <.305 8-21-2002 Pumped <.146 <.138 <.347 <.336 <.002 <.305
89 SDW 500-0080 8-21-2002 Diffusion <.146 <.138 <.347 <.336 <.002 <.305 8-21-2002 Pumped <.146 <.138 <.347 <.336 <.002 <.305
32 Comparison of Diffusion- and Pumped-Sampling Methods to Monitor VOCs in Ground Water, MMR, Cape Cod, MA

Table 1-2. Analytical results for volatile organic compounds detected in six or fewer wells for samples collected by diffusion- and pumped-sampling methods, including wells with two sets of samples collected or with replicate samples collected, Massachusetts Military Reservation, Cape Cod, Massachusetts, July 1999–December 2002.—Continued
[Well identifier: See figure 1 for location. All concentrations in micrograms per liter. ID, identifier; NA, not analyzed; R, second sampling event for well; REP, replicate sample; trans1,2-DCE, trans1,2-dichloroethene; 1,1-DCE, 1,1-dichloroethene; 1,1,2,2-TeCA, 1,1,2,2-tetrachloroethane; 1,1,1-TCA, 1,1,1-tri-chloroethane; 1,1,2-TCA, 1,1,2-trichloroethane; 1,1-DCA, 1,1-dichloroethane; <, less than the analytical detection limit]
Well ID
Well number
Date diffu-sion sampler
retrieved
Sample type
trans- 1,2- DCE
1,1- DCE
Benzene1,4-Di- chloro-
benzene
1,1,2,2- TeCA
1,1,1- TCA
1,1,2- TCA
1 03MW0054A 8-12-1999 Diffusion <0.24 <0.24 <0.28 <0.26 <0.32 <0.23 <0.33 8-12-1999 Pumped <.24 <.24 <.28 <.26 <.32 <.23 <.33 2 03MW0054B 8-12-1999 Diffusion <.24 <.3 <.28 <.26 <.32 <.23 <.33 8-12-1999 Pumped <.24 <.3 <.28 <.26 <.32 <.23 <.33
3 03MW0064 8-16-1999 Diffusion <.24 <.3 <.28 <.26 <.32 <.23 <.33 8-16-1999 Pumped <.24 <.3 <.28 <.26 <.32 <.23 <.33 4 03MW0214B 8-12-1999 Diffusion <.24 <.3 <.28 <.26 <.32 <.23 <.33 8-12-1999 Pumped <.24 <.3 <.28 <.26 <.32 <.23 <.33
5 03MW0214F 8-12-1999 Diffusion <.24 <.3 <.28 <.26 <.32 <.23 <.33 8-12-1999 Pumped .531 <.3 <.28 <.26 <.32 <.23 <.33 03MW0214F-R 11-12-2002 Diffusion <.271 <.226 <.216 <.38 <.477 <.528 <.40 11-12-2002 Pumped <.271 <.226 <.216 <.38 <.477 <.528 <.40
6 03MW2413A 8-16-1999 Diffusion <.24 <.3 <.28 <.38 <.32 <.23 <.33 8-16-1999 Pumped <.24 <.3 <.28 <.38 <.32 <.23 <.33 03MW2413A-R 11-12-2002 Diffusion <.271 <.226 <.216 <.38 <.477 <.528 <.40 11-12-2002 Pumped <.271 <.226 <.216 <.38 <.477 <.528 <.40
7 03MW2413B 11-12-2002 Diffusion <.271 <.226 <.216 <.38 <.477 <.528 <.40 11-12-2002 Pumped <.271 <.226 <.216 <.38 <.477 <.528 <.40
8 27MW0023A 8-04-1999 Diffusion <.24 1.4 <.2 <.19 <.28 6.8 <.2 8-04-1999 Pumped <.24 1.1 <.2 <.19 <.28 6.6 <.2 27MW0023A-R 4-06-2000 Diffusion <.09 .68 <.11 <.09 <.13 3.5 <.11 4-06-2000 Pumped <.09 <.09 <.11 <.09 <.13 2.9 <.11 4-06-2000 Pumped REP <.09 <.09 <.11 <.09 <.13 2.8 <.11
9 27MW0024A 8-09-1999 Diffusion <.24 <.26 <.2 <.19 <.28 <.19 <.2 8-09-1999 Pumped <.24 <.26 .46 1.7 <.28 <.19 <.2
10 27MW0026A 8-05-1999 Diffusion <.12 <.13 <.099 <.097 <.14 <.094 <.098 8-05-1999 Diffusion REP <.12 <.13 <.099 <.097 <.14 <.094 <.098 8-05-1999 Pumped <.12 <.13 <.099 <.097 <.14 <.094 <.098 8-05-1999 Pumped REP <.12 <.13 <.099 <.097 <.14 <.094 <.098 11 27MW0026B 8-05-1999 Diffusion <.12 <.13 <.099 <.097 <.14 <.094 <.098 8-05-1999 Pumped <.24 <.26 <.2 <.19 <.28 1.6 <.2
27MW0026B-R 4-10-2000 Diffusion <.09 <.09 <.11 <.1 <.13 <.09 <.11 4-10-2000 Pumped <.09 .54 <.11 <.1 <.13 1.5 <.11
12 27MW0031A 8-06-1999 Diffusion <1.2 <1.3 <.99 <.97 <1.4 <.94 <.98 8-06-1999 Pumped <1.2 <1.3 <.99 <.97 <1.4 <.94 <.98 27MW0031A-R 4-07-2000 Diffusion <.45 <.45 <.55 6.4 <.65 <.45 <.55 4-07-2000 Pumped <.45 <.45 <.55 5.9 <.65 <.45 <.55 13 27MW0031B 8-09-1999 Diffusion <.12 <.13 1.2 .55 <.14 .56 <.098 8-09-1999 Pumped <.25 <.26 1.1 2.3 <.28 1 <.2 27MW0031B-R 4-07-2000 Diffusion <.18 <.18 <.22 1.6 <.26 <.18 <.22 4-07-2000 Pumped <.18 <.18 <.22 2.3 <.26 <.18 <.22
Appendix 33

Table 1-2. Analytical results for volatile organic compounds detected in six or fewer wells for samples collected by diffusion- and pumped-sampling methods, including wells with two sets of samples collected or with replicate samples collected, Massachusetts Military Reservation, Cape Cod, Massachusetts, July 1999–December 2002.—Continued
[Well identifier: See figure 1 for location. All concentrations in micrograms per liter. ID, identifier; NA, not analyzed; R, second sampling event for well; REP, replicate sample; trans1,2-DCE, trans1,2-dichloroethene; 1,1-DCE, 1,1-dichloroethene; 1,1,2,2-TeCA, 1,1,2,2-tetrachloroethane; 1,1,1-TCA, 1,1,1-tri-chloroethane; 1,1,2-TCA, 1,1,2-trichloroethane; 1,1-DCA, 1,1-dichloroethane; <, less than the analytical detection limit]
Well ID
Well number
Date diffu-sion sampler
retrieved
Sample type
trans- 1,2- DCE
1,1- DCE
Benzene1,4-Di- chloro-
benzene
1,1,2,2- TeCA
1,1,1- TCA
1,1,2- TCA
14 27MW0033 8-05-1999 Diffusion <0.12 <0.13 <0.099 <0.097 <0.14 <0.094 <0.098 8-05-1999 Pumped <.12 <.13 <.099 <.097 <.14 <.094 <.098 8-05-1999 Pumped REP <.12 <.13 <.099 <.097 <.14 <.094 <.098
15 27MW0037A 8-11-1999 Diffusion <.12 <.13 <.099 <.097 5.3 <.094 <.098 8-11-1999 Diffusion REP <.12 <.13 <.099 <.097 5.4 <.094 <.098 8-11-1999 Pumped <.24 <.26 <.2 <.19 8.2 <.19 <.2 27MW0037A-R 4-04-2000 Diffusion <.09 <.09 <.11 <.1 4.6 <.09 <.11 4-04-2000 Pumped <.18 <.18 <.22 <.2 5.9 <.18 <.22
16 27MW0038A 8-11-1999 Diffusion <.12 <.13 <.099 <.097 <.14 <.094 <.098 8-11-1999 Pumped <.12 <.13 <.099 <.097 <.14 <.094 <.098 17 27MW0046 10-11-1999 Diffusion <.12 <.532 <.099 <.097 <.14 1.15 <.098 10-11-1999 Pumped <.168 .67 <.371 <.097 <.14 1.3 <.098
18 27MW0102A 8-11-1999 Diffusion <.12 <.13 .26 <.097 <.14 <.094 <.098 8-11-1999 Diffusion REP <.12 <.13 .25 <.097 <.14 <.094 <.098 8-11-1999 Pumped <.48 <.523 <.4 <.39 <.56 <.38 <.39 27MW0102A-R 4-05-2000 Diffusion <.09 <.09 <.11 <.1 <.13 <.09 <.11 4-05-2000 Pumped <.18 <.18 <.22 <.2 <.26 <.18 <.22 19 27MW0102B 8-11-1999 Diffusion <.12 <.13 <.099 <.097 <.14 <.094 <.098 8-11-1999 Pumped <.12 <.13 <.099 <.097 <.14 <.094 <.098
20 27MW0108A 8-05-1999 Diffusion .87 1 <.099 <.097 9.7 <.094 <.098 8-05-1999 Pumped 2.2 2.6 <.4 <.39 22 <.38 <.39 27MW0108A-R 4-05-2000 Diffusion <.09 <.09 <.11 <.1 7.3 <.09 <.11 4-05-2000 Pumped <.36 <.36 <.44 <.4 14 <.36 <.44 4-05-2000 Pumped REP <.36 <.36 <.44 <.4 15 <.36 <.44 21 27MW0108B 8-05-1999 Diffusion <.12 <.13 <.099 <.097 <.14 <.094 <.098 8-05-1999 Pumped <.12 <.13 <.099 <.097 <.14 <.094 <.098
22 36MW0132A 4-18-2000 Diffusion NA NA NA NA NA NA NA 4-18-2000 Pumped NA NA NA NA NA NA NA
23 36MW0132B 4-18-2000 Diffusion NA NA NA NA NA NA NA 4-18-2000 Pumped NA NA NA NA NA NA NA 24 36MW0132C 4-18-2000 Diffusion NA NA NA NA NA NA NA 4-18-2000 Pumped NA NA NA NA NA NA NA
25 90MW0003 9-14-1999 Diffusion <3 <3.2 250 <2.4 <3.5 <2.4 <2.4 9-14-1999 Pumped <2.4 <2.6 310 <1.9 <2.8 <1.9 <2 26 90MW0005 9-14-1999 Diffusion <.12 <.13 <.099 <.097 <.14 <.094 <.098 9-14-1999 Pumped <.24 <.26 41 <1.9 <.28 <.19 <.2
27 90MW0025 9-14-1999 Diffusion <.12 <.13 <.099 <.097 <.14 <.094 <.098 9-14-1999 Pumped <.12 <.13 <.099 <.097 <.14 <.094 <.098 28 90MW0028 9-14-1999 Diffusion <.12 <.13 <.099 <.097 <.14 <.094 <.098 9-14-1999 Pumped <.12 <.13 <.099 <.097 <.14 <.094 <.098
34 Comparison of Diffusion- and Pumped-Sampling Methods to Monitor VOCs in Ground Water, MMR, Cape Cod, MA
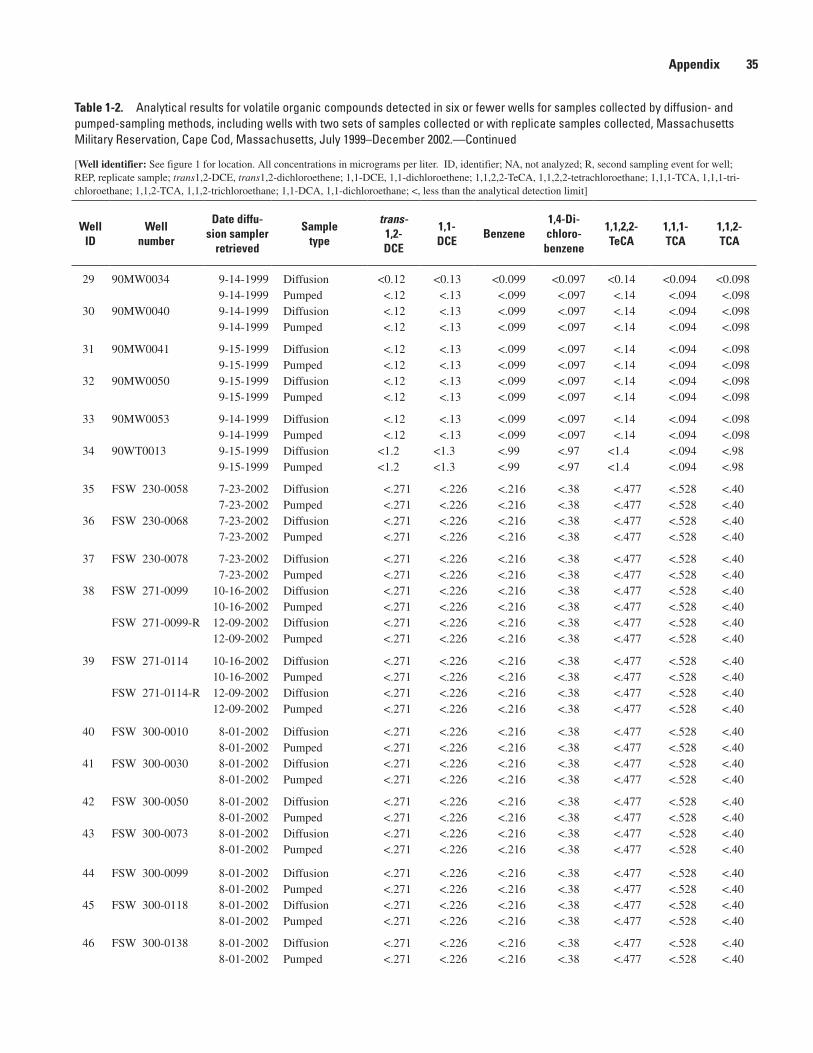
Table 1-2. Analytical results for volatile organic compounds detected in six or fewer wells for samples collected by diffusion- and pumped-sampling methods, including wells with two sets of samples collected or with replicate samples collected, Massachusetts Military Reservation, Cape Cod, Massachusetts, July 1999–December 2002.—Continued
[Well identifier: See figure 1 for location. All concentrations in micrograms per liter. ID, identifier; NA, not analyzed; R, second sampling event for well; REP, replicate sample; trans1,2-DCE, trans1,2-dichloroethene; 1,1-DCE, 1,1-dichloroethene; 1,1,2,2-TeCA, 1,1,2,2-tetrachloroethane; 1,1,1-TCA, 1,1,1-tri-chloroethane; 1,1,2-TCA, 1,1,2-trichloroethane; 1,1-DCA, 1,1-dichloroethane; <, less than the analytical detection limit]
Well ID
Well number
Date diffu-sion sampler
retrieved
Sample type
trans- 1,2- DCE
1,1- DCE
Benzene1,4-Di- chloro-
benzene
1,1,2,2- TeCA
1,1,1- TCA
1,1,2- TCA
29 90MW0034 9-14-1999 Diffusion <0.12 <0.13 <0.099 <0.097 <0.14 <0.094 <0.098 9-14-1999 Pumped <.12 <.13 <.099 <.097 <.14 <.094 <.098 30 90MW0040 9-14-1999 Diffusion <.12 <.13 <.099 <.097 <.14 <.094 <.098 9-14-1999 Pumped <.12 <.13 <.099 <.097 <.14 <.094 <.098
31 90MW0041 9-15-1999 Diffusion <.12 <.13 <.099 <.097 <.14 <.094 <.098 9-15-1999 Pumped <.12 <.13 <.099 <.097 <.14 <.094 <.098 32 90MW0050 9-15-1999 Diffusion <.12 <.13 <.099 <.097 <.14 <.094 <.098 9-15-1999 Pumped <.12 <.13 <.099 <.097 <.14 <.094 <.098
33 90MW0053 9-14-1999 Diffusion <.12 <.13 <.099 <.097 <.14 <.094 <.098 9-14-1999 Pumped <.12 <.13 <.099 <.097 <.14 <.094 <.098 34 90WT0013 9-15-1999 Diffusion <1.2 <1.3 <.99 <.97 <1.4 <.094 <.98 9-15-1999 Pumped <1.2 <1.3 <.99 <.97 <1.4 <.094 <.98
35 FSW 230-0058 7-23-2002 Diffusion <.271 <.226 <.216 <.38 <.477 <.528 <.40 7-23-2002 Pumped <.271 <.226 <.216 <.38 <.477 <.528 <.40 36 FSW 230-0068 7-23-2002 Diffusion <.271 <.226 <.216 <.38 <.477 <.528 <.40 7-23-2002 Pumped <.271 <.226 <.216 <.38 <.477 <.528 <.40
37 FSW 230-0078 7-23-2002 Diffusion <.271 <.226 <.216 <.38 <.477 <.528 <.40 7-23-2002 Pumped <.271 <.226 <.216 <.38 <.477 <.528 <.40 38 FSW 271-0099 10-16-2002 Diffusion <.271 <.226 <.216 <.38 <.477 <.528 <.40 10-16-2002 Pumped <.271 <.226 <.216 <.38 <.477 <.528 <.40 FSW 271-0099-R 12-09-2002 Diffusion <.271 <.226 <.216 <.38 <.477 <.528 <.40 12-09-2002 Pumped <.271 <.226 <.216 <.38 <.477 <.528 <.40
39 FSW 271-0114 10-16-2002 Diffusion <.271 <.226 <.216 <.38 <.477 <.528 <.40 10-16-2002 Pumped <.271 <.226 <.216 <.38 <.477 <.528 <.40 FSW 271-0114-R 12-09-2002 Diffusion <.271 <.226 <.216 <.38 <.477 <.528 <.40 12-09-2002 Pumped <.271 <.226 <.216 <.38 <.477 <.528 <.40
40 FSW 300-0010 8-01-2002 Diffusion <.271 <.226 <.216 <.38 <.477 <.528 <.40 8-01-2002 Pumped <.271 <.226 <.216 <.38 <.477 <.528 <.40 41 FSW 300-0030 8-01-2002 Diffusion <.271 <.226 <.216 <.38 <.477 <.528 <.40 8-01-2002 Pumped <.271 <.226 <.216 <.38 <.477 <.528 <.40
42 FSW 300-0050 8-01-2002 Diffusion <.271 <.226 <.216 <.38 <.477 <.528 <.40 8-01-2002 Pumped <.271 <.226 <.216 <.38 <.477 <.528 <.40 43 FSW 300-0073 8-01-2002 Diffusion <.271 <.226 <.216 <.38 <.477 <.528 <.40 8-01-2002 Pumped <.271 <.226 <.216 <.38 <.477 <.528 <.40
44 FSW 300-0099 8-01-2002 Diffusion <.271 <.226 <.216 <.38 <.477 <.528 <.40 8-01-2002 Pumped <.271 <.226 <.216 <.38 <.477 <.528 <.40 45 FSW 300-0118 8-01-2002 Diffusion <.271 <.226 <.216 <.38 <.477 <.528 <.40 8-01-2002 Pumped <.271 <.226 <.216 <.38 <.477 <.528 <.40
46 FSW 300-0138 8-01-2002 Diffusion <.271 <.226 <.216 <.38 <.477 <.528 <.40 8-01-2002 Pumped <.271 <.226 <.216 <.38 <.477 <.528 <.40
Appendix 35

Table 1-2. Analytical results for volatile organic compounds detected in six or fewer wells for samples collected by diffusion- and pumped-sampling methods, including wells with two sets of samples collected or with replicate samples collected, Massachusetts Military Reservation, Cape Cod, Massachusetts, July 1999–December 2002.—Continued
[Well identifier: See figure 1 for location. All concentrations in micrograms per liter. ID, identifier; NA, not analyzed; R, second sampling event for well; REP, replicate sample; trans1,2-DCE, trans1,2-dichloroethene; 1,1-DCE, 1,1-dichloroethene; 1,1,2,2-TeCA, 1,1,2,2-tetrachloroethane; 1,1,1-TCA, 1,1,1-tri-chloroethane; 1,1,2-TCA, 1,1,2-trichloroethane; 1,1-DCA, 1,1-dichloroethane; <, less than the analytical detection limit]
Well ID
Well number
Date diffu-sion sampler
retrieved
Sample type
trans- 1,2- DCE
1,1- DCE
Benzene1,4-Di- chloro-
benzene
1,1,2,2- TeCA
1,1,1- TCA
1,1,2- TCA
47 FSW 343-0036 8-07-2002 Diffusion <0.271 <0.226 <0.216 <0.38 <0.477 <0.528 <0.40 8-07-2002 Pumped <.271 <.226 <.216 <.38 <.477 <.528 <.40 48 FSW 343-0057 8-07-2002 Diffusion <.271 <.226 .82 3.13 <.477 <.528 <.40 8-07-2002 Pumped <.271 <.226 .63 4.06 <.477 <.528 <.40
49 FSW 343-0079 8-07-2002 Diffusion <.271 <.226 <.216 <.38 <.477 <.528 <.40 8-07-2002 Pumped <.271 <.226 <.216 <.38 <.477 <.528 <.40 50 FSW 343-0099 8-07-2002 Diffusion <.271 <.226 <.216 <.38 <.477 <.528 <.40 8-07-2002 Pumped <.271 <.226 <.216 <.38 <.477 <.528 <.40
51 FSW 343-0114 8-07-2002 Diffusion <.271 <.226 <.216 <.38 <.477 <.528 <.40 8-07-2002 Pumped <.271 <.226 <.216 <.38 <.477 <.528 <.40 52 FSW 347-0020 8-08-2002 Diffusion <.271 <.226 <.216 <.38 <.477 <.528 <.40 8-08-2002 Pumped <.271 <.226 <.216 <.38 <.477 <.528 <.40
53 FSW 347-0031 8-08-2002 Diffusion <.271 <.226 <.216 <.38 <.477 <.528 <.40 8-08-2002 Pumped <.271 <.226 <.216 <.38 <.477 <.528 <.40 54 FSW 347-0038 8-08-2002 Diffusion <.271 <.226 <.216 <.38 <.477 <.528 <.40 8-08-2002 Pumped <.271 <.226 <.216 <.38 <.477 <.528 <.40
55 FSW 347-0046 8-08-2002 Diffusion <.271 <.226 <.216 <.38 <.477 <.528 <.40 8-08-2002 Pumped <.271 <.226 <.216 <.38 <.477 <.528 <.40 56 FSW 347-0067 8-08-2002 Diffusion <.271 <.226 <.216 <.38 <.477 <.528 <.40 8-08-2002 Pumped <.271 <.226 <.216 <.38 <.477 <.528 <.40
57 FSW 347-0101 8-08-2002 Diffusion <.271 <.226 <.216 <.38 <.477 <.528 <.40 8-08-2002 Pumped <.271 <.226 <.216 <.38 <.477 <.528 <.40 58 FSW 347-0116 8-08-2002 Diffusion <.271 <.226 <.216 <.38 <.477 <.528 <.40 8-08-2002 Pumped <.271 <.226 <.216 <.38 <.477 <.528 <.40
59 FSW 347-0131 8-08-2002 Diffusion <.271 <.226 <.216 <.38 <.477 <.528 <.40 8-08-2002 Pumped <.271 <.226 <.216 <.38 <.477 <.528 <.40 60 FSW 347-0145 8-08-2002 Diffusion <.271 <.226 <.216 <.38 <.477 <.528 <.40 8-08-2002 Pumped <.271 <.226 <.216 <.38 <.477 <.528 <.40
61 FSW 350-0064 10-11-2002 Diffusion <.271 <.226 <.216 <.38 <.477 <.528 <.40 10-11-2002 Pumped <.271 <.226 <.216 <.38 <.477 <.528 <.40 FSW 350-0064-R 12-09-2002 Diffusion <.271 <.226 <.216 <.38 <.477 <.528 <.40 12-09-2002 Pumped <.271 <.226 <.216 <.38 <.477 <.528 <.40
62 FSW 350-0110 10-11-2002 Diffusion <.271 <.226 <.216 <.38 <.477 <.528 <.40 10-11-2002 Pumped <.271 <.226 <.216 <.38 <.477 <.528 <.40 FSW 350-0110-R 12-09-2002 Diffusion <.271 <.226 <.216 <.38 <.477 <.528 <.40 12-09-2002 Pumped <.271 <.226 <.216 <.38 <.477 <.528 <.40
36 Comparison of Diffusion- and Pumped-Sampling Methods to Monitor VOCs in Ground Water, MMR, Cape Cod, MA

Table 1-2. Analytical results for volatile organic compounds detected in six or fewer wells for samples collected by diffusion- and pumped-sampling methods, including wells with two sets of samples collected or with replicate samples collected, Massachusetts Military Reservation, Cape Cod, Massachusetts, July 1999–December 2002.—Continued
[Well identifier: See figure 1 for location. All concentrations in micrograms per liter. ID, identifier; NA, not analyzed; R, second sampling event for well; REP, replicate sample; trans1,2-DCE, trans1,2-dichloroethene; 1,1-DCE, 1,1-dichloroethene; 1,1,2,2-TeCA, 1,1,2,2-tetrachloroethane; 1,1,1-TCA, 1,1,1-tri-chloroethane; 1,1,2-TCA, 1,1,2-trichloroethane; 1,1-DCA, 1,1-dichloroethane; <, less than the analytical detection limit]
Well ID
Well number
Date diffu-sion sampler
retrieved
Sample type
trans- 1,2- DCE
1,1- DCE
Benzene1,4-Di- chloro-
benzene
1,1,2,2- TeCA
1,1,1- TCA
1,1,2- TCA
63 FSW 375-0055 10-24-2002 Diffusion <0.271 <0.226 <0.216 <0.38 <0.477 <0.528 <0.40 10-24-2002 Pumped <.271 <.226 <.216 <.38 <.477 <.528 <.40 FSW 375-0055-R 12-09-2002 Diffusion <.271 <.226 <.216 <.38 <.477 <.528 <.40 12-09-2002 Pumped <.271 <.226 <.216 <.38 <.477 <.528 <.40
64 FSW 375-0071 10-24-2002 Diffusion <.271 <.226 <.216 <.38 <.477 <.528 <.40 10-24-2002 Pumped <.271 <.226 <.216 <.38 <.477 <.528 <.40 FSW 375-0071-R 12-09-2002 Diffusion <.271 <.226 <.216 <.38 <.477 <.528 <.40 12-09-2002 Pumped <.271 <.226 <.216 <.38 <.477 <.528 <.40
65 FSW 383-0040 8-22-2002 Diffusion <.271 <.226 <.216 <.38 <.477 <.528 <.40 8-22-2002 Pumped <.271 <.226 <.216 <.38 <.477 <.528 <.40 66 FSW 383-0061 8-22-2002 Diffusion <.271 <.226 <.216 <.38 <.477 <.528 <.40 8-22-2002 Pumped <.271 <.226 <.216 <.38 <.477 <.528 <.40
67 FSW 383-0082 8-22-2002 Diffusion <.271 <.226 <.216 <.38 <.477 <.528 <.40 8-22-2002 Pumped <.271 <.226 <.216 <.38 <.477 <.528 <.40 68 FSW 383-0106 8-22-2002 Diffusion <.271 <.226 <.216 <.38 <.477 <.528 <.40 8-22-2002 Pumped <.271 <.226 <.216 <.38 <.477 <.528 <.40
69 FSW 424-0020 8-06-2002 Diffusion <.271 <.226 <.216 <.38 <.477 <.528 <.40 8-06-2002 Pumped <.271 <.226 <.216 <.38 <.477 <.528 <.40 70 FSW 424-0089 8-06-2002 Diffusion <.271 <.226 <.216 <.38 <.477 <.528 <.40 8-06-2002 Pumped <.271 <.226 <.216 <.38 <.477 <.528 <.40
71 FSW 424-0144 8-06-2002 Diffusion <.271 <.226 <.216 <.38 <.477 <.528 <.40 8-06-2002 Pumped <.271 <.226 <.216 <.38 <.477 <.528 <.40 72 FSW 424-0183 8-06-2002 Diffusion <.271 <.226 <.216 <.38 <.477 <.528 <.40 8-06-2002 Pumped <.271 <.226 <.216 <.38 <.477 <.528 <.40
73 FSW 577-0061 8-14-2002 Diffusion <.271 <.226 <.216 <.38 <.477 <.528 <.40 8-14-2002 Pumped <.271 <.226 <.216 <.38 <.477 <.528 <.40 74 FSW 577-0071 8-14-2002 Diffusion <.271 <.226 <.216 <.38 <.477 <.528 <.40 8-14-2002 Pumped <.271 <.226 <.216 <.38 <.477 <.528 <.40
75 FSW 577-0081 8-14-2002 Diffusion <.271 <.226 <.216 <.38 <.477 <.528 <.40 8-14-2002 Pumped <.271 <.226 <.216 <.38 <.477 <.528 <.40 76 FSW 577-0097 8-14-2002 Diffusion <.271 <.226 <.216 <.38 <.477 <.528 <.40 8-14-2002 Pumped <.271 <.226 <.216 <.38 <.477 <.528 <.40
77 SDW 316-0051 8-20-2002 Diffusion <.271 <.226 <.216 <.38 <.477 <.528 <.40 8-20-2002 Pumped <.271 <.226 <.216 <.38 <.477 <.528 <.40 78 SDW 316-0066 8-20-2002 Diffusion <.271 <.226 <.216 <.38 <.477 <.528 <.40 8-20-2002 Pumped <.271 <.226 <.216 <.38 <.477 <.528 <.40
Appendix 37

Table 1-2. Analytical results for volatile organic compounds detected in six or fewer wells for samples collected by diffusion- and pumped-sampling methods, including wells with two sets of samples collected or with replicate samples collected, Massachusetts Military Reservation, Cape Cod, Massachusetts, July 1999–December 2002.—Continued
[Well identifier: See figure 1 for location. All concentrations in micrograms per liter. ID, identifier; NA, not analyzed; R, second sampling event for well; REP, replicate sample; trans1,2-DCE, trans1,2-dichloroethene; 1,1-DCE, 1,1-dichloroethene; 1,1,2,2-TeCA, 1,1,2,2-tetrachloroethane; 1,1,1-TCA, 1,1,1-tri-chloroethane; 1,1,2-TCA, 1,1,2-trichloroethane; 1,1-DCA, 1,1-dichloroethane; <, less than the analytical detection limit]
Well ID
Well number
Date diffu-sion sampler
retrieved
Sample type
trans- 1,2- DCE
1,1- DCE
Benzene1,4-Di- chloro-
benzene
1,1,2,2- TeCA
1,1,1- TCA
1,1,2- TCA
79 SDW 316-0082 8-20-2002 Diffusion <0.271 <0.226 <0.216 3.89 <0.477 <0.528 <0.40 8-20-2002 Pumped <.271 <.226 <.216 4.26 <.477 <.528 <.40 80 SDW 316-0100 8-20-2002 Diffusion <.271 <.226 <.216 <.38 <.477 <.528 <.40 8-20-2002 Pumped <.271 <.226 <.216 <.38 <.477 <.528 <.40
81 SDW 423-0058 8-21-2002 Diffusion <.271 <.226 <.216 <.38 <.477 <.528 <.40 8-21-2002 Pumped <.271 <.226 <.216 <.38 <.477 <.528 <.40 82 SDW 438-0041 8-13-2002 Diffusion <.271 <.226 <.216 <.38 <.477 <.528 <.40 8-13-2002 Pumped <.271 <.226 <.216 <.38 <.477 <.528 <.40
83 SDW 440-0078 8-13-2002 Diffusion <.271 <.226 <.216 <.38 <.477 <.528 <.40 8-13-2002 Pumped <.271 <.226 <.216 <.38 <.477 <.528 <.40 84 SDW 469-0036 8-06-2002 Diffusion <.271 <.226 <.216 <.38 <.477 <.528 <.40 8-06-2002 Pumped <.271 <.226 <.216 <.38 <.477 <.528 <.40
85 SDW 469-0051 8-06-2002 Diffusion <.271 <.226 <.216 <.38 <.477 <.528 <.40 8-06-2002 Pumped <.271 <.226 <.216 <.38 <.477 <.528 <.40 86 SDW 469-0066 8-06-2002 Diffusion <.271 <.226 <.216 <.38 <.477 <.528 <.40 8-06-2002 Pumped <.271 <.226 <.216 <.38 <.477 <.528 <.40
87 SDW 500-0060 8-21-2002 Diffusion <.271 <.226 <.216 <.38 <.477 <.528 <.40 8-21-2002 Pumped <.271 <.226 <.216 <.38 <.477 <.528 <.40 88 SDW 500-0070 8-21-2002 Diffusion <.271 <.226 <.216 <.38 <.477 <.528 <.40 8-21-2002 Pumped <.271 <.226 <.216 <.38 <.477 <.528 <.40
89 SDW 500-0080 8-21-2002 Diffusion <.271 <.226 <.216 <.38 <.477 <.528 <.40 8-21-2002 Pumped <.271 <.226 <.216 <.38 <.477 <.528 <.40
38 Comparison of Diffusion- and Pumped-Sampling Methods to Monitor VOCs in Ground Water, MMR, Cape Cod, MA

Table 1-2. Analytical results for volatile organic compounds detected in six or fewer wells for samples collected by diffusion- and pumped-sampling methods, including wells with two sets of samples collected or with replicate samples collected, Massachusetts Military Reservation, Cape Cod, Massachusetts, July 1999–December 2002.—Continued
[Well ID: See figure 1 for location. All concentrations in micrograms per liter. ID, identifier; NA, not analyzed; R, second sampling event for well; REP, repli-cate sample; trans1,2-DCE, trans1,2-dichloroethene; 1,1-DCE, 1,1-dichloroethene; 1,1,2,2-TeCA, 1,1,2,2-tetrachloroethane; 1,1,1-TCA, 1,1,1-trichloroethane; 1,1,2-TCA, 1,1,2-trichloroethane; 1,1-DCA, 1,1-dichloroethane; <, less than the analytical detection limit]
Well ID
Well number
Date diffu-sion sampler
retrieved
Sample type
1,1-DCAEthyl
benzeneToluene
Carbon tetra-
chloride
Vinyl chloride
Methyl chloride
Xylenes, total
1 03MW0054A 8-12-1999 Diffusion <0.29 <0.21 <0.29 <0.27 <0.27 <0.28 <0.79 8-12-1999 Pumped <.29 <.21 <.29 <.27 <.27 <.28 <.79 2 03MW0054B 8-12-1999 Diffusion <.29 <.21 <.29 <.27 <.27 <.28 <.79 8-12-1999 Pumped <.29 <.21 <.29 <.27 <.27 1.01 <.79 3 03MW0064 8-16-1999 Diffusion <.29 <.21 <.29 <.27 <.27 <.28 <.79 8-16-1999 Pumped <.29 <.21 <.29 <.27 <.27 <.28 <.79
4 03MW0214B 8-12-1999 Diffusion <.29 <.21 <.29 <.27 <.27 <.28 <.79 8-12-1999 Pumped <.29 <.21 <.29 <.27 <.27 <.28 <.79 5 03MW0214F 8-12-1999 Diffusion <.29 <.21 <.29 <.27 <.27 <.28 <.79 8-12-1999 Pumped <.29 <.21 <.29 <.27 <.27 <.28 <.79 03MW0214F-R 11-12-2002 Diffusion <.156 <.178 <.185 <.618 <.413 <.486 NA 11-12-2002 Pumped <.156 <.178 <.185 <.618 <.413 <.486 NA
6 03MW2413A 8-16-1999 Diffusion <.29 <.21 <.29 <.27 <.27 <.28 <.79 8-16-1999 Pumped <.29 <.21 <.29 <.27 <.27 <.28 <.79 03MW2413A-R 11-12-2002 Diffusion <.156 <.178 <.185 <.618 <.413 <.486 NA 11-12-2002 Pumped <.156 <.178 <.185 <.618 <.413 <.486 NA 7 03MW2413B 11-12-2002 Diffusion <.156 <.178 <.185 <.618 <.413 <.486 NA 11-12-2002 Pumped <.156 <.178 <.185 <.618 <.413 <.486 NA
8 27MW0023A 8-04-1999 Diffusion <.26 <.19 <.26 42 <.26 <.26 <.58 8-04-1999 Pumped <.26 <.19 <.22 38 <.26 <.26 <.58 27MW0023A-R 4-06-2000 Diffusion .58 <.1 <.09 11 <.08 <.1 <.11 4-06-2000 Pumped <.07 <.1 <.09 8.3 <.08 <.1 <.11 4-06-2000 Pumped REP .5 <.1 <.09 8.3 <.08 <.1 <.11
9 27MW0024A 8-09-1999 Diffusion 1.8 <.19 <.22 <.2 1.7 <.26 <.58 8-09-1999 Pumped 2.3 <.19 <.22 <.2 2.6 <.26 <.58
10 27MW0026A 8-05-1999 Diffusion <.13 <.096 <.11 <.1 <.13 <.13 <.29 8-05-1999 Diffusion REP <.13 <.096 <.11 <.1 <.13 <.13 <.29 8-05-1999 Pumped <.13 <.096 <.11 <.1 <.13 <.13 <.29 8-05-1999 Pumped REP <.13 <.096 <.11 <.1 <.13 <.13 <.29 11 27MW0026B 8-05-1999 Diffusion <.13 <.096 <.11 <.1 <.13 <.13 <.29 8-05-1999 Pumped <.26 <.19 <.22 <.200 <.26 <.26 <.58 27MW0026B-R 4-10-2000 Diffusion <.07 <.1 .68 <.08 <.08 <.1 <.11 4-10-2000 Pumped .5 <.1 <.09 6.2 <.08 .91 <.11
12 27MW0031A 8-06-1999 Diffusion 5.5 <.96 <1.1 6.4 <1.3 <1.3 <2.9 8-06-1999 Pumped 6 <.96 <1.1 13 <1.3 <1.3 <2.9 27MW0031A-R 4-07-2000 Diffusion 4.3 <.5 <.45 6 <.4 <.5 <.55 4-07-2000 Pumped 3.8 <.5 <.45 11 <.4 <.5 <.55 13 27MW0031B 8-09-1999 Diffusion 2.2 <.096 <.11 <.1 <.13 <.13 <.29 8-09-1999 Pumped 2.9 <.19 <.22 <.2 <.26 <.26 <.58 27MW0031B-R 4-07-2000 Diffusion 2.2 <.2 <.18 <.16 <.16 <.2 <.22 4-07-2000 Pumped 2.7 <.2 <.18 <.16 <.16 <.2 <.22
Appendix 39

Table 1-2. Analytical results for volatile organic compounds detected in six or fewer wells for samples collected by diffusion- and pumped-sampling methods, including wells with two sets of samples collected or with replicate samples collected, Massachusetts Military Reservation, Cape Cod, Massachusetts, July 1999–December 2002.—Continued
[Well ID: See figure 1 for location. All concentrations in micrograms per liter. ID, identifier; NA, not analyzed; R, second sampling event for well; REP, repli-cate sample; trans1,2-DCE, trans1,2-dichloroethene; 1,1-DCE, 1,1-dichloroethene; 1,1,2,2-TeCA, 1,1,2,2-tetrachloroethane; 1,1,1-TCA, 1,1,1-trichloroethane; 1,1,2-TCA, 1,1,2-trichloroethane; 1,1-DCA, 1,1-dichloroethane; <, less than the analytical detection limit]
Well ID
Well number
Date diffu-sion sampler
retrieved
Sample type
1,1-DCAEthyl
benzeneToluene
Carbon tetra-
chloride
Vinyl chloride
Methyl chloride
Xylenes, total
14 27MW0033 8-05-1999 Diffusion <0.13 <0.096 <0.11 <0.1 <0.13 <0.13 <0.29 8-05-1999 Pumped <.13 <.096 <.11 <.1 <.13 <.13 <.29 8-05-1999 Pumped REP <.13 <.096 <.11 <.1 <.13 <.13 <.29
15 27MW0037A 8-11-1999 Diffusion <.13 <.096 <.11 <.1 <.13 <.13 <.29 8-11-1999 Diffusion REP <.13 <.096 <.11 <.1 <.13 <.13 <.29 8-11-1999 Pumped <.26 <.19 <.22 <.2 <.26 <.26 <.58 27MW0037A-R 4-04-2000 Diffusion <.07 <.1 <.09 <.08 <.08 <.1 <.11 4-04-2000 Pumped <.14 <.2 <.18 <.16 <.16 <.2 <.22
16 27MW0038A 8-11-1999 Diffusion <.13 <.096 <.11 <.1 <.13 <.13 <.29 8-11-1999 Pumped <.13 <.096 <.11 <.1 <.13 <.13 <.29 17 27MW0046 10-11-1999 Diffusion <.13 <.096 <.11 <.222 <.13 <.16 <.29 10-11-1999 Pumped <.13 <.282 <.197 .64 <.13 <.16 <.29
18 27MW0102A 8-11-1999 Diffusion 1.2 <.096 <.11 <.1 .52 <.13 <.29 8-11-1999 Diffusion REP 1.2 <.096 <.11 <.1 .56 <.13 <.29 8-11-1999 Pumped <.52 <.38 <.44 <.4 <.52 <.52 <1.2 27MW0102A-R 4-05-2000 Diffusion <.07 <.1 <.09 <.08 <.08 <.1 <.11 4-05-2000 Pumped <.14 <.2 <.18 <.16 <.16 <.2 <.22 19 27MW0102B 8-11-1999 Diffusion <.13 <.096 <.11 <.1 <.13 <.13 <.29 8-11-1999 Pumped <.13 <.096 <.11 <.1 <.13 <.13 <.29
20 27MW0108A 8-05-1999 Diffusion <.13 <.096 <.11 <.1 <.13 <.13 <.29 8-05-1999 Pumped <.52 <.38 <.44 <.4 <.52 <.64 <1.2 27MW0108A-R 4-05-2000 Diffusion <.07 <.1 <.09 <.08 <.08 <.1 <.11 4-05-2000 Pumped <.28 <.4 <.36 <.32 <.32 <.32 <.44 4-05-2000 Pumped REP <.28 <.4 <.36 <.32 <.32 <.32 <.44 21 27MW0108B 8-05-1999 Diffusion <.13 <.096 <.11 <.1 <.13 <.13 <.29 8-05-1999 Pumped <.13 <.096 <.11 <.1 <.13 <.13 <.29
22 36MW0132A 4-18-2000 Diffusion NA NA NA NA NA NA NA 4-18-2000 Pumped NA NA NA NA NA NA NA 23 36MW0132B 4-18-2000 Diffusion NA NA NA NA NA NA NA 4-18-2000 Pumped NA NA NA NA NA NA NA 24 36MW0132C 4-18-2000 Diffusion NA NA NA NA NA NA NA 4-18-2000 Pumped NA NA NA NA NA NA NA
25 90MW0003 9-14-1999 Diffusion <3.2 <2.4 <2.8 <2.5 <3.2 <3.2 <7.2 9-14-1999 Pumped <2.6 <1.9 <2.2 <2 <2.6 <3.2 <5.8 26 90MW0005 9-14-1999 Diffusion <.13 <.096 <.11 <.1 <.13 <.13 <.29 9-14-1999 Pumped <.26 <.19 <.22 <.2 <.26 <.26 <.58
27 90MW0025 9-14-1999 Diffusion <.13 <.096 <.11 <.1 <.13 <.13 <.29 9-14-1999 Pumped <.13 <.096 <.11 <.1 <.13 <.13 <.29 28 90MW0028 9-14-1999 Diffusion <.13 <.096 <.11 <.1 <.13 <.13 <.29 9-14-1999 Pumped <.13 <.096 <.11 <.1 <.13 <.13 <.29
40 Comparison of Diffusion- and Pumped-Sampling Methods to Monitor VOCs in Ground Water, MMR, Cape Cod, MA

Table 1-2. Analytical results for volatile organic compounds detected in six or fewer wells for samples collected by diffusion- and pumped-sampling methods, including wells with two sets of samples collected or with replicate samples collected, Massachusetts Military Reservation, Cape Cod, Massachusetts, July 1999–December 2002.—Continued
[Well ID: See figure 1 for location. All concentrations in micrograms per liter. ID, identifier; NA, not analyzed; R, second sampling event for well; REP, repli-cate sample; trans1,2-DCE, trans1,2-dichloroethene; 1,1-DCE, 1,1-dichloroethene; 1,1,2,2-TeCA, 1,1,2,2-tetrachloroethane; 1,1,1-TCA, 1,1,1-trichloroethane; 1,1,2-TCA, 1,1,2-trichloroethane; 1,1-DCA, 1,1-dichloroethane; <, less than the analytical detection limit]
Well ID
Well number
Date diffu-sion sampler
retrieved
Sample type
1,1-DCAEthyl
benzeneToluene
Carbon tetra-
chloride
Vinyl chloride
Methyl chloride
Xylenes, total
29 90MW0034 9-14-1999 Diffusion <0.13 <0.096 <0.11 <0.1 <0.13 <0.13 <0.29 9-14-1999 Pumped <.13 <.096 <.11 <.1 <.13 <.13 <.29 30 90MW0040 9-14-1999 Diffusion <.13 <.096 <.11 <.1 <.13 <.13 <.29 9-14-1999 Pumped <.13 <.096 <.11 <.1 <.13 <.13 <.29
31 90MW0041 9-15-1999 Diffusion <.13 <.096 <.11 <.1 <.13 <.13 <.29 9-15-1999 Pumped <.13 <.096 <.11 <.1 <.13 <.13 <.29 32 90MW0050 9-15-1999 Diffusion <.13 <.096 <.11 <.1 <.13 <.13 <.29 9-15-1999 Pumped <.13 <.096 <.11 <.1 <.13 <.13 <.29
33 90MW0053 9-14-1999 Diffusion <.13 <.096 <.11 <.1 <.13 <.13 <.29 9-14-1999 Pumped <.13 <.096 <.11 <.1 <.13 <.13 <.29 34 90WT0013 9-15-1999 Diffusion <.13 44 18 <1 <1.3 <1.3 350 9-15-1999 Pumped <.13 31 8.7 <1 <1.3 <1.3 230
35 FSW 230-0058 7-23-2002 Diffusion <.156 <.178 <.185 <.618 <.413 <.486 NA 7-23-2002 Pumped <.156 <.178 <.185 <.618 <.413 <.486 NA 36 FSW 230-0068 7-23-2002 Diffusion <.156 <.178 <.185 <.618 <.413 <.486 NA 7-23-2002 Pumped <.156 <.178 <.185 <.618 <.413 <.486 NA
37 FSW 230-0078 7-23-2002 Diffusion <.156 <.178 <.185 <.618 <.413 <.486 NA 7-23-2002 Pumped <.156 <.178 <.185 <.618 <.413 <.486 NA 38 FSW 271-0099 10-16-2002 Diffusion <.156 <.178 <.185 <.618 <.413 <.486 NA 10-16-2002 Pumped <.156 <.178 <.185 <.618 <.413 <.486 NA FSW 271-0099-R 12-09-2002 Diffusion <.156 <.178 <.185 <.618 <.413 <.486 NA 12-09-2002 Pumped <.156 <.178 <.185 <.618 <.413 <.486 NA
39 FSW 271-0114 10-16-2002 Diffusion <.156 <.178 <.185 <.618 <.413 <.486 NA 10-16-2002 Pumped <.156 <.178 <.185 <.618 <.413 <.486 NA FSW 271-0114-R 12-09-2002 Diffusion <.156 <.178 <.185 <.618 <.413 <.486 NA 12-09-2002 Pumped <.156 <.178 <.185 <.618 <.413 <.486 NA
40 FSW 300-0010 8-01-2002 Diffusion <.156 <.178 <.185 <.618 <.413 <.486 NA 8-01-2002 Pumped <.156 <.178 <.185 <.618 <.413 <.486 NA 41 FSW 300-0030 8-01-2002 Diffusion <.156 <.178 <.185 <.618 <.413 <.486 NA 8-01-2002 Pumped <.156 <.178 <.185 <.618 <.413 <.486 NA
42 FSW 300-0050 8-01-2002 Diffusion <.156 <.178 <.185 <.618 <.413 <.486 NA 8-01-2002 Pumped <.156 <.178 <.185 <.618 <.413 <.486 NA 43 FSW 300-0073 8-01-2002 Diffusion <.156 <.178 <.185 <.618 <.413 <.486 NA 8-01-2002 Pumped <.156 <.178 <.185 <.618 <.413 <.486 NA
44 FSW 300-0099 8-01-2002 Diffusion <.156 <.178 <.185 <.618 <.413 <.486 NA 8-01-2002 Pumped <.156 <.178 <.185 <.618 <.413 <.486 NA 45 FSW 300-0118 8-01-2002 Diffusion <.156 <.178 <.185 <.618 <.413 <.486 NA 8-01-2002 Pumped <.156 <.178 <.185 <.618 <.413 <.486 NA
Appendix 41

Table 1-2. Analytical results for volatile organic compounds detected in six or fewer wells for samples collected by diffusion- and pumped-sampling methods, including wells with two sets of samples collected or with replicate samples collected, Massachusetts Military Reservation, Cape Cod, Massachusetts, July 1999–December 2002.—Continued
[Well ID: See figure 1 for location. All concentrations in micrograms per liter. ID, identifier; NA, not analyzed; R, second sampling event for well; REP, repli-cate sample; trans1,2-DCE, trans1,2-dichloroethene; 1,1-DCE, 1,1-dichloroethene; 1,1,2,2-TeCA, 1,1,2,2-tetrachloroethane; 1,1,1-TCA, 1,1,1-trichloroethane; 1,1,2-TCA, 1,1,2-trichloroethane; 1,1-DCA, 1,1-dichloroethane; <, less than the analytical detection limit]
Well ID
Well number
Date diffu-sion sampler
retrieved
Sample type
1,1-DCAEthyl
benzeneToluene
Carbon tetra-
chloride
Vinyl chloride
Methyl chloride
Xylenes, total
46 FSW 300-0138 8-01-2002 Diffusion <0.156 <0.178 <0.185 <0.618 <0.413 <0.486 NA 8-01-2002 Pumped <.156 <.178 <.185 <.618 <.413 <.486 NA 47 FSW 343-0036 8-07-2002 Diffusion <.156 <.178 <.185 <.618 <.413 .486 NA 8-07-2002 Pumped <.156 <.178 <.185 <.618 <.413 <.486 NA
48 FSW 343-0057 8-07-2002 Diffusion <.156 <.178 <.185 <.618 <.413 <.486 NA 8-07-2002 Pumped <.156 <.178 <.185 <.618 <.413 <.486 NA 49 FSW 343-0079 8-07-2002 Diffusion <.156 <.178 <.185 <.618 <.413 <.486 NA 8-07-2002 Pumped <.156 <.178 <.185 <.618 <.413 <.486 NA
50 FSW 343-0099 8-07-2002 Diffusion <.156 <.178 <.185 <.618 <.413 <.486 NA 8-07-2002 Pumped <.156 <.178 <.185 <.618 <.413 <.486 NA 51 FSW 343-0114 8-07-2002 Diffusion <.156 <.178 <.185 <.618 <.413 <.486 NA 8-07-2002 Pumped <.156 <.178 <.185 <.618 <.413 <.486 NA
52 FSW 347-0020 8-08-2002 Diffusion <.156 <.178 <.185 <.618 <.413 <.486 NA 8-08-2002 Pumped <.156 <.178 <.185 <.618 <.413 <.486 NA 53 FSW 347-0031 8-08-2002 Diffusion <.156 <.178 <.185 <.618 <.413 <.486 NA 8-08-2002 Pumped <.156 <.178 <.185 <.618 <.413 <.486 NA
54 FSW 347-0038 8-08-2002 Diffusion <.156 <.178 <.185 <.618 <.413 <.486 NA 8-08-2002 Pumped <.156 <.178 <.185 <.618 <.413 <.486 NA 55 FSW 347-0046 8-08-2002 Diffusion <.156 <.178 <.185 <.618 <.413 <.486 NA 8-08-2002 Pumped <.156 <.178 <.185 <.618 <.413 <.486 NA
56 FSW 347-0067 8-08-2002 Diffusion <.156 <.178 <.185 <.618 <.413 <.486 NA 8-08-2002 Pumped <.156 <.178 <.185 <.618 <.413 <.486 NA 57 FSW 347-0101 8-08-2002 Diffusion <.156 <.178 <.185 <.618 <.413 <.486 NA 8-08-2002 Pumped <.156 <.178 <.185 <.618 <.413 <.486 NA
58 FSW 347-0116 8-08-2002 Diffusion <.156 <.178 <.185 <.618 <.413 <.486 NA 8-08-2002 Pumped <.156 <.178 <.185 <.618 <.413 <.486 NA 59 FSW 347-0131 8-08-2002 Diffusion <.156 <.178 <.185 <.618 <.413 <.486 NA 8-08-2002 Pumped <.156 <.178 <.185 <.618 <.413 <.486 NA 60 FSW 347-0145 8-08-2002 Diffusion <.156 <.178 <.185 <.618 <.413 <.486 NA 8-08-2002 Pumped <.156 <.178 <.185 <.618 <.413 <.486 NA
61 FSW 350-0064 10-11-2002 Diffusion <.156 <.178 <.185 <.618 <.413 <.486 NA 10-11-2002 Pumped <.156 <.178 <.185 <.618 <.413 <.486 NA FSW 350-0064-R 12-09-2002 Diffusion <.156 <.178 <.185 <.618 <.413 <.486 NA 12-09-2002 Pumped <.156 <.178 <.185 <.618 <.413 <.486 NA
62 FSW 350-0110 10-11-2002 Diffusion <.156 <.178 <.185 <.618 <.413 <.486 NA 10-11-2002 Pumped <.156 <.178 <.185 <.618 <.413 <.486 NA FSW 350-0110-R 12-09-2002 Diffusion <.156 <.178 <.185 <.618 <.413 <.486 NA 12-09-2002 Pumped <.156 <.178 <.185 <.618 <.413 <.486 NA
42 Comparison of Diffusion- and Pumped-Sampling Methods to Monitor VOCs in Ground Water, MMR, Cape Cod, MA

Table 1-2. Analytical results for volatile organic compounds detected in six or fewer wells for samples collected by diffusion- and pumped-sampling methods, including wells with two sets of samples collected or with replicate samples collected, Massachusetts Military Reservation, Cape Cod, Massachusetts, July 1999–December 2002.—Continued
[Well ID: See figure 1 for location. All concentrations in micrograms per liter. ID, identifier; NA, not analyzed; R, second sampling event for well; REP, repli-cate sample; trans1,2-DCE, trans1,2-dichloroethene; 1,1-DCE, 1,1-dichloroethene; 1,1,2,2-TeCA, 1,1,2,2-tetrachloroethane; 1,1,1-TCA, 1,1,1-trichloroethane; 1,1,2-TCA, 1,1,2-trichloroethane; 1,1-DCA, 1,1-dichloroethane; <, less than the analytical detection limit]
Well ID
Well number
Date diffu-sion sampler
retrieved
Sample type
1,1-DCAEthyl
benzeneToluene
Carbon tetra-
chloride
Vinyl chloride
Methyl chloride
Xylenes, total
63 FSW 375-0055 10-24-2002 Diffusion <0.156 <0.178 <0.185 <0.618 <0.413 <0.486 NA 10-24-2002 Pumped <.156 <.178 <.185 <.618 <.413 <.486 NA FSW 375-0055-R 12-09-2002 Diffusion <.156 <.178 <.185 <.618 <.413 <.486 NA 12-09-2002 Pumped <.156 <.178 <.185 <.618 <.413 <.486 NA
64 FSW 375-0071 10-24-2002 Diffusion <.156 <.178 <.185 <.618 <.413 <.486 NA 10-24-2002 Pumped <.156 <.178 <.185 <.618 <.413 <.486 NA FSW 375-0071-R 12-09-2002 Diffusion <.156 <.178 <.185 <.618 <.413 <.486 NA 12-09-2002 Pumped <.156 <.178 <.185 <.618 <.413 <.486 NA
65 FSW 383-0040 8-22-2002 Diffusion <.156 <.178 <.185 <.618 <.413 <.486 NA 8-22-2002 Pumped <.156 <.178 <.185 <.618 <.413 <.486 NA 66 FSW 383-0061 8-22-2002 Diffusion <.156 <.178 <.185 <.618 <.413 <.486 NA 8-22-2002 Pumped <.156 <.178 <.185 <.618 <.413 <.486 NA
67 FSW 383-0082 8-22-2002 Diffusion <.156 <.178 <.185 <.618 <.413 <.486 NA 8-22-2002 Pumped <.156 <.178 <.185 <.618 <.413 <.486 NA 68 FSW 383-0106 8-22-2002 Diffusion <.156 <.178 <.185 <.618 <.413 <.486 NA 8-22-2002 Pumped <.156 <.178 <.185 <.618 <.413 <.486 NA
69 FSW 424-0020 8-06-2002 Diffusion <.156 <.178 <.185 <.618 <.413 <.486 NA 8-06-2002 Pumped <.156 <.178 <.185 <.618 <.413 <.486 NA 70 FSW 424-0089 8-06-2002 Diffusion <.156 <.178 <.185 <.618 <.413 <.486 NA 8-06-2002 Pumped <.156 <.178 <.185 <.618 <.413 <.486 NA
71 FSW 424-0144 8-06-2002 Diffusion <.156 <.178 <.185 <.618 <.413 <.486 NA 8-06-2002 Pumped <.156 <.178 <.185 <.618 <.413 <.486 NA 72 FSW 424-0183 8-06-2002 Diffusion <.156 <.178 <.185 <.618 <.413 <.486 NA 8-06-2002 Pumped <.156 <.178 <.185 <.618 <.413 <.486 NA
73 FSW 577-0061 8-14-2002 Diffusion <.156 <.178 <.185 <.618 <.413 <.486 NA 8-14-2002 Pumped <.156 <.178 <.185 <.618 <.413 <.486 NA 74 FSW 577-0071 8-14-2002 Diffusion <.156 <.178 <.185 <.618 <.413 <.486 NA 8-14-2002 Pumped <.156 <.178 <.185 <.618 <.413 <.486 NA
75 FSW 577-0081 8-14-2002 Diffusion <.156 <.17 <.185 <.618 <.413 <.486 NA 8-14-2002 Pumped <.156 <.178 <.185 <.618 <.413 <.486 NA 76 FSW 577-0097 8-14-2002 Diffusion <.156 <.178 <.185 <.618 <.413 <.486 NA 8-14-2002 Pumped <.156 <.178 <.185 <.618 <.413 <.486 NA
77 SDW 316-0051 8-20-2002 Diffusion <.156 <.178 <.185 <.618 <.413 <.486 NA 8-20-2002 Pumped <.156 <.178 <.185 <.618 <.413 <.486 NA 78 SDW 316-0066 8-20-2002 Diffusion <.156 <.178 <.185 <.618 <.413 <.486 NA 8-20-2002 Pumped <.156 <.178 <.185 <.618 <.413 <.486 NA
Appendix 43

Table 1-2. Analytical results for volatile organic compounds detected in six or fewer wells for samples collected by diffusion- and pumped-sampling methods, including wells with two sets of samples collected or with replicate samples collected, Massachusetts Military Reservation, Cape Cod, Massachusetts, July 1999–December 2002.—Continued
[Well ID: See figure 1 for location. All concentrations in micrograms per liter. ID, identifier; NA, not analyzed; R, second sampling event for well; REP, repli-cate sample; trans1,2-DCE, trans1,2-dichloroethene; 1,1-DCE, 1,1-dichloroethene; 1,1,2,2-TeCA, 1,1,2,2-tetrachloroethane; 1,1,1-TCA, 1,1,1-trichloroethane; 1,1,2-TCA, 1,1,2-trichloroethane; 1,1-DCA, 1,1-dichloroethane; <, less than the analytical detection limit]
Well ID
Well number
Date diffu-sion sampler
retrieved
Sample type
1,1-DCAEthyl
benzeneToluene
Carbon tetra-
chloride
Vinyl chloride
Methyl chloride
Xylenes, total
79 SDW 316-0082 8-20-2002 Diffusion <0.156 <0.178 <0.185 <0.618 <0.413 <0.486 NA 8-20-2002 Pumped <.156 <.178 <.185 <.618 <.413 <.486 NA 80 SDW 316-0100 8-20-2002 Diffusion <.156 <.178 <.185 <.618 <.413 <.486 NA 8-20-2002 Pumped <.156 <.178 <.185 <.618 <.413 <.486 NA
81 SDW 423-0058 8-21-2002 Diffusion <.156 <.178 <.185 <.618 <.413 <.486 NA 8-21-2002 Pumped <.156 <.178 <.185 <.618 <.413 <.486 NA 82 SDW 438-0041 8-13-2002 Diffusion <.156 <.178 <.185 <.618 <.413 <.486 NA 8-13-2002 Pumped <.156 <.178 <.185 <.618 <.413 <.486 NA
83 SDW 440-0078 8-13-2002 Diffusion <.156 <.178 <.185 <.618 <.413 <.486 NA 8-13-2002 Pumped <.156 <.178 <.185 <.618 <.413 <.486 NA 84 SDW 469-0036 8-06-2002 Diffusion <.156 <.178 <.185 <.618 <.413 <.486 NA 8-06-2002 Pumped <.156 <.178 <.185 <.618 <.413 <.486 NA
85 SDW 469-0051 8-06-2002 Diffusion <.156 <.178 <.185 <.618 <.413 <.486 NA 8-06-2002 Pumped <.156 <.178 <.185 <.618 <.413 <.486 NA 86 SDW 469-0066 8-06-2002 Diffusion <.156 <.178 <.185 <.618 <.413 <.486 NA 8-06-2002 Pumped <.156 <.178 <.185 <.618 <.413 <.486 NA
87 SDW 500-0060 8-21-2002 Diffusion <.156 <.178 <.185 <.618 <.413 <.486 NA 8-21-2002 Pumped <.156 <.178 <.185 <.618 <.413 <.486 NA 88 SDW 500-0070 8-21-2002 Diffusion <.156 <.178 <.185 <.618 <.413 <.486 NA 8-21-2002 Pumped <.156 <.17 <.185 <.618 <.413 <.486 NA
89 SDW 500-0080 8-21-2002 Diffusion <.156 <.178 <.185 <.618 <.413 <.486 NA 8-21-2002 Pumped <.156 <.178 <.185 <.618 <.413 <.486 NA
44 Comparison of Diffusion- and Pumped-Sampling Methods to Monitor VOCs in Ground Water, MMR, Cape Cod, MA

Table 1-3. Total volatile organic compound concentrations by well with two sets of samples collected or with replicate samples col-lected, Massachusetts Military Reservation, Cape Cod, Massachusetts, July 1999–December 2002.—Continued
[Well ID: See figure 1 for location. All concentrations are in micrograms per liter. Total volatile organic compound concentrations were calculated by assign-ing a zero value to all concentrations below the analytical detection limit. ID, identifier; ND, no volatile organic compounds detected; R, second sampling event for well; REP, replicate sample; VOCs, volatile organic compound]
Well ID
Well numberDate diffusion
sampler retrievedSample type
Total VOCs detected
Total VOCs used in analysis
1 03MW0054A 8-12-1999 Diffusion 270.21 270.21 8-12-1999 Pumped 262.37 262.37 2 03MW0054B 8-12-1999 Diffusion ND 0 8-12-1999 Pumped 1.01 1.01
3 03MW0064 8-16-1999 Diffusion 16.7 16.7 8-16-1999 Pumped 19.7 19.7
4 03MW0214B 8-12-1999 Diffusion 278.24 278.24 8-12-1999 Pumped 1,011.51 1,011.51 5 03MW0214F 8-12-1999 Diffusion 256.62 256.62 8-12-1999 Pumped 328.711 328.711 03MW0214F-R 11-12-2002 Diffusion 3.03 3.03 11-12-2002 Pumped 3.55 3.55
6 03MW2413A 8-16-1999 Diffusion 38.6 38.6 8-16-1999 Pumped 160 160 03MW2413A-R 11-12-2002 Diffusion .53 .53 11-12-2002 Pumped 25.92 25.92 7 03MW2413B 11-12-2002 Diffusion 20.82 20.82 11-12-2002 Pumped 91.16 91.16
8 27MW0023A 8-04-1999 Diffusion 70.7 70.7 8-04-1999 Pumped 67.6 67.6 27MW0023A-R 4-06-2000 Diffusion 23.42 23.42 4-06-2000 Pumped 17.92 17.92 4-06-2000 Pumped REP 18.62 18.62
9 27MW0024A 8-09-1999 Diffusion 34.4 34.4 8-09-1999 Pumped 47.06 47.06
10 27MW0026A 8-05-1999 Diffusion 3.65 3.65 8-05-1999 Diffusion REP 3.71 3.71 8-05-1999 Pumped 6.18 6.18 8-05-1999 Pumped REP 6.65 6.65 11 27MW0026B 8-05-1999 Diffusion 6 6 8-05-1999 Pumped 45.1 45.1 27MW0026B-R 4-10-2000 Diffusion 9.98 9.98 4-10-2000 Pumped 47.03 47.03
12 27MW0031A 8-06-1999 Diffusion 221.9 221.9 8-06-1999 Pumped 238 238 27MW0031A-R 4-07-2000 Diffusion 163.7 163.7 4-07-2000 Pumped 158.7 158.7 13 27MW0031B 8-09-1999 Diffusion 41.81 41.81 8-09-1999 Pumped 75.3 75.3 27MW0031B-R 4-07-2000 Diffusion 57.1 57.1 4-07-2000 Pumped 66.6 66.6
Appendix 45

Table 1-3. Total volatile organic compound concentrations by well with two sets of samples collected or with replicate samples col-lected, Massachusetts Military Reservation, Cape Cod, Massachusetts, July 1999–December 2002.—Continued
[Well ID: See figure 1 for location. All concentrations are in micrograms per liter. Total volatile organic compound concentrations were calculated by assign-ing a zero value to all concentrations below the analytical detection limit. ID, identifier; ND, no volatile organic compounds detected; R, second sampling event for well; REP, replicate sample; VOCs, volatile organic compound]
Well ID
Well numberDate diffusion
sampler retrievedSample type
Total VOCs detected
Total VOCs used in analysis
14 27MW0033 8-05-1999 Diffusion ND 0 8-05-1999 Pumped 6 6 8-05-1999 Pumped REP 5.7 5.7
15 27MW0037A 8-11-1999 Diffusion 28.81 28.81 8-11-1999 Diffusion REP 29.39 29.39 8-11-1999 Pumped 49.9 49.9 27MW0037A-R 4-04-2000 Diffusion 23.5 23.5 4-04-2000 Pumped 36.5 36.5
16 27MW0038A 8-11-1999 Diffusion ND 0 8-11-1999 Pumped 5.49 5.49 17 27MW0046 10-11-1999 Diffusion 5.86 5.86 10-11-1999 Pumped 6.75 6.75
18 27MW0102A 8-11-1999 Diffusion 34.78 34.78 8-11-1999 Diffusion REP 32.91 32.91 8-11-1999 Pumped 76.5 76.5 27MW0102A-R 4-05-2000 Diffusion 34.3 34.3 4-05-2000 Pumped 65.8 65.8 19 27MW0102B 8-11-1999 Diffusion ND 0 8-11-1999 Pumped ND 0
20 27MW0108A 8-05-1999 Diffusion 37.29 37.29 8-05-1999 Pumped 86.2 86.2 27MW0108A-R 4-05-2000 Diffusion 29.71 29.71 4-05-2000 Pumped 46.2 46.2 4-05-2000 Pumped REP 47.2 47.2 21 27MW0108B 8-05-1999 Diffusion .9 .9 8-05-1999 Pumped .92 .92
22 36MW0132A 4-18-2000 Diffusion 3.33 3.33 4-18-2000 Pumped 3.73 3.73 23 36MW0132B 4-18-2000 Diffusion 6.14 6.14 4-18-2000 Pumped 6.78 6.78 24 36MW0132C 4-18-2000 Diffusion 4.56 4.56 4-18-2000 Pumped 4.56 4.56
25 90MW0003 9-14-1999 Diffusion 254.28 254.28 9-14-1999 Pumped 310 310 26 90MW0005 9-14-1999 Diffusion 1.5 1.5 9-14-1999 Pumped 43 43
27 90MW0025 9-14-1999 Diffusion 1.7 1.7 9-14-1999 Pumped 1.4 1.4 28 90MW0028 9-14-1999 Diffusion 1.2 1.2 9-14-1999 Pumped 1.3 1.3
46 Comparison of Diffusion- and Pumped-Sampling Methods to Monitor VOCs in Ground Water, MMR, Cape Cod, MA

Table 1-3. Total volatile organic compound concentrations by well with two sets of samples collected or with replicate samples col-lected, Massachusetts Military Reservation, Cape Cod, Massachusetts, July 1999–December 2002.—Continued
[Well ID: See figure 1 for location. All concentrations are in micrograms per liter. Total volatile organic compound concentrations were calculated by assign-ing a zero value to all concentrations below the analytical detection limit. ID, identifier; ND, no volatile organic compounds detected; R, second sampling event for well; REP, replicate sample; VOCs, volatile organic compound]
Well ID
Well numberDate diffusion
sampler retrievedSample type
Total VOCs detected
Total VOCs used in analysis
29 90MW0034 9-14-1999 Diffusion ND 0 9-14-1999 Pumped ND 0 30 90MW0040 9-14-1999 Diffusion 3.3 3.3 9-14-1999 Pumped 7 7
31 90MW0041 9-15-1999 Diffusion ND 0 9-15-1999 Pumped ND 0 32 90MW0050 9-15-1999 Diffusion 1 1 9-15-1999 Pumped .91 .91
33 90MW0053 9-14-1999 Diffusion 1.97 1.97 9-14-1999 Pumped 3.07 3.07 34 90WT0013 9-15-1999 Diffusion 412 412 9-15-1999 Pumped 269.7 269.7
35 FSW 230-0058 7-23-2002 Diffusion 3.54 3.54 7-23-2002 Pumped 3.65 3.65 36 FSW 230-0068 7-23-2002 Diffusion 3.99 3.99 7-23-2002 Pumped 3.48 3.48 37 FSW 230-0078 7-23-2002 Diffusion 1.3 1.3 7-23-2002 Pumped 1.36 1.36
38 FSW 271-0099 10-16-2002 Diffusion 4.78 4.78 10-16-2002 Pumped 5.3 5.3 FSW 271-0099-R 12-09-2002 Diffusion 4.68 4.68 12-09-2002 Pumped 6.16 6.16
39 FSW 271-0114 10-16-2002 Diffusion 4.06 4.06 10-16-2002 Pumped 6.02 6.02 FSW 271-0114-R 12-09-2002 Diffusion 5.51 5.51 12-09-2002 Pumped 6.02 6.02
40 FSW 300-0010 8-01-2002 Diffusion .67 .67 8-01-2002 Pumped .88 .88 41 FSW 300-0030 8-01-2002 Diffusion 8.69 8.69 8-01-2002 Pumped 7.8 7.8 42 FSW 300-0050 8-01-2002 Diffusion ND 0 8-01-2002 Pumped ND 0
43 FSW 300-0073 8-01-2002 Diffusion ND 0 8-01-2002 Pumped ND 0 44 FSW 300-0099 8-01-2002 Diffusion ND 0 8-01-2002 Pumped ND 0
45 FSW 300-0118 8-01-2002 Diffusion ND 0 8-01-2002 Pumped ND 0 46 FSW 300-0138 8-01-2002 Diffusion ND 0 8-01-2002 Pumped ND 0
Appendix 47

Table 1-3. Total volatile organic compound concentrations by well with two sets of samples collected or with replicate samples col-lected, Massachusetts Military Reservation, Cape Cod, Massachusetts, July 1999–December 2002.—Continued
[Well ID: See figure 1 for location. All concentrations are in micrograms per liter. Total volatile organic compound concentrations were calculated by assign-ing a zero value to all concentrations below the analytical detection limit. ID, identifier; ND, no volatile organic compounds detected; R, second sampling event for well; REP, replicate sample; VOCs, volatile organic compound]
Well ID
Well numberDate diffusion
sampler retrievedSample type
Total VOCs detected
Total VOCs used in analysis
47 FSW 343-0036 8-07-2002 Diffusion 1.4 1.4 8-07-2002 Pumped 1.36 1.36 48 FSW 343-0057 8-07-2002 Diffusion 18.44 18.44 8-07-2002 Pumped 18.43 18.43
49 FSW 343-0079 8-07-2002 Diffusion ND 0 8-07-2002 Pumped ND 0 50 FSW 343-0099 8-07-2002 Diffusion ND 0 8-07-2002 Pumped ND 0
51 FSW 343-0114 8-07-2002 Diffusion ND 0 8-07-2002 Pumped ND 0 52 FSW 347-0020 8-08-2002 Diffusion ND 0 8-08-2002 Pumped ND 0
53 FSW 347-0031 8-08-2002 Diffusion 13.39 13.39 8-08-2002 Pumped 14.59 14.59 54 FSW 347-0038 8-08-2002 Diffusion 10.55 10.55 8-08-2002 Pumped 12.41 12.41
55 FSW 347-0046 8-08-2002 Diffusion 2.6 2.6 8-08-2002 Pumped 2.52 2.52 56 FSW 347-0067 8-08-2002 Diffusion ND 0 8-08-2002 Pumped ND 0
57 FSW 347-0101 8-08-2002 Diffusion ND 0 8-08-2002 Pumped ND 0 58 FSW 347-0116 8-08-2002 Diffusion ND 0 8-08-2002 Pumped ND 0
59 FSW 347-0131 8-08-2002 Diffusion ND 0 8-08-2002 Pumped ND 0 60 FSW 347-0145 8-08-2002 Diffusion ND 0 8-08-2002 Pumped ND 0
61 FSW 350-0064 10-11-2002 Diffusion 7.74 7.74 10-11-2002 Pumped 8.1 8.1 FSW 350-0064-R 12-09-2002 Diffusion 8.21 8.21 12-09-2002 Pumped 8.3 8.3
62 FSW 350-0110 10-11-2002 Diffusion 2.79 2.79 10-11-2002 Pumped 13.1 13.1 FSW 350-0110-R 12-09-2002 Diffusion 4.64 4.64 12-09-2002 Pumped 16.61 16.61
63 FSW 375-0055 10-24-2002 Diffusion 11.25 11.25 10-24-2002 Pumped 16.58 16.58 FSW 375-0055-R 12-09-2002 Diffusion 17.92 17.92 12-09-2002 Pumped 18.49 18.49
48 Comparison of Diffusion- and Pumped-Sampling Methods to Monitor VOCs in Ground Water, MMR, Cape Cod, MA

Table 1-3. Total volatile organic compound concentrations by well with two sets of samples collected or with replicate samples col-lected, Massachusetts Military Reservation, Cape Cod, Massachusetts, July 1999–December 2002.—Continued
[Well ID: See figure 1 for location. All concentrations are in micrograms per liter. Total volatile organic compound concentrations were calculated by assign-ing a zero value to all concentrations below the analytical detection limit. ID, identifier; ND, no volatile organic compounds detected; R, second sampling event for well; REP, replicate sample; VOCs, volatile organic compound]
Well ID
Well numberDate diffusion
sampler retrievedSample type
Total VOCs detected
Total VOCs used in analysis
64 FSW 375-0071 10-24-2002 Diffusion 2.72 2.72 10-24-2002 Pumped 4.85 4.85 FSW 375-0071-R 12-09-2002 Diffusion 6.72 6.72 12-09-2002 Pumped 5.99 5.99
65 FSW 383-0040 8-22-2002 Diffusion 3.14 3.14 8-22-2002 Pumped 3.06 3.06 66 FSW 383-0061 8-22-2002 Diffusion .81 .81 8-22-2002 Pumped .47 .47
67 FSW 383-0082 8-22-2002 Diffusion ND 0 8-22-2002 Pumped ND 0 68 FSW 383-0106 8-22-2002 Diffusion ND 0 8-22-2002 Pumped ND 0
69 FSW 424-0020 8-06-2002 Diffusion ND 0 8-06-2002 Pumped ND 0 70 FSW 424-0089 8-06-2002 Diffusion ND 0 8-06-2002 Pumped ND 0
71 FSW 424-0144 8-06-2002 Diffusion ND 0 8-06-2002 Pumped ND 0 72 FSW 424-0183 8-06-2002 Diffusion .52 .52 8-06-2002 Pumped ND 0
73 FSW 577-0061 8-14-2002 Diffusion .92 .92 8-14-2002 Pumped 1.92 1.92 74 FSW 577-0071 8-14-2002 Diffusion 4.09 4.09 8-14-2002 Pumped 3.78 3.78
75 FSW 577-0081 8-14-2002 Diffusion 1.02 1.02 8-14-2002 Pumped 1.1 1.1 76 FSW 577-0097 8-14-2002 Diffusion ND 0 8-14-2002 Pumped ND 0
77 SDW 316-0051 8-20-2002 Diffusion ND 0 8-20-2002 Pumped ND 0 78 SDW 316-0066 8-20-2002 Diffusion 1.22 1.22 8-20-2002 Pumped 1.48 1.48
79 SDW 316-0082 8-20-2002 Diffusion 5.13 5.13 8-20-2002 Pumped 6.57 6.57 80 SDW 316-0100 8-20-2002 Diffusion ND 0 8-20-2002 Pumped ND 0
81 SDW 423-0058 8-21-2002 Diffusion 2.13 2.13 8-21-2002 Pumped 1.57 1.57 82 SDW 438-0041 8-13-2002 Diffusion ND 0 8-13-2002 Pumped 1.31 1.31
Appendix 49

Table 1-3. Total volatile organic compound concentrations by well with two sets of samples collected or with replicate samples col-lected, Massachusetts Military Reservation, Cape Cod, Massachusetts, July 1999–December 2002.—Continued
[Well ID: See figure 1 for location. All concentrations are in micrograms per liter. Total volatile organic compound concentrations were calculated by assign-ing a zero value to all concentrations below the analytical detection limit. ID, identifier; ND, no volatile organic compounds detected; R, second sampling event for well; REP, replicate sample; VOCs, volatile organic compound]
Well ID
Well numberDate diffusion
sampler retrievedSample type
Total VOCs detected
Total VOCs used in analysis
83 SDW 440-0078 8-13-2002 Diffusion ND 0 8-13-2002 Pumped ND 0 84 SDW 469-0036 8-06-2002 Diffusion ND 0 8-06-2002 Pumped ND 0
85 SDW 469-0051 8-06-2002 Diffusion 2.58 2.58 8-06-2002 Pumped 3.02 3.02 86 SDW 469-0066 8-06-2002 Diffusion ND 0 8-06-2002 Pumped ND 0
87 SDW 500-0060 8-21-2002 Diffusion ND 0 8-21-2002 Pumped ND 0 88 SDW 500-0070 8-21-2002 Diffusion ND 0 8-21-2002 Pumped ND 0
89 SDW 500-0080 8-21-2002 Diffusion ND 0 8-21-2002 Pumped ND 0
50 Comparison of Diffusion- and Pumped-Sampling Methods to Monitor VOCs in Ground Water, MMR, Cape Cod, MA

Table 1-4. Analytical results for volatile organic compounds detected in more than six wells for samples collected for quality assur-ance, Massachusetts Military Reservation, Cape Cod, Massachusetts, August 1999–December 2002.
[All concentrations in micrograms per liter. cis1,2-DCE, cis1,2-dichloroethene; EDB, 1,2-dibromoethane; PCE, tetrachloroethene; TCE, trichloroethene; <, less than the analytical detection limit]
Quality assurance sample type
Date collected
PCE TCE cis1,2-DCE Chloroform EDB1,2-
Dichloro- benzene
Equipment blank 8-05-1999 <0.1 <0.12 <0.13 <0.11 <0.11 <0.12 9-14-1999 <.1 <.12 <.13 <.11 <.11 <.12 4-07-2000 <.11 <.09 <.08 <.08 <.08 <.08 12-17-2002 <.146 <.138 <.347 <.336 <.493 <.305
Trip blank 8-04-1999 <.1 <.12 <.13 <.11 <.11 <.12 8-05-1999 <.1 <.12 <.13 <.11 <.11 <.12 8-06-1999 <.1 <.12 <.13 <.11 <.11 <.12 8-09-1999 <.1 <.12 <.13 <.11 <.11 <.12 8-11-1999 <.1 <.12 <.13 <.11 <.11 <.12
8-12-1999 <.22 <.35 <.24 <.29 <.29 <.24 8-16-1999 <.22 <.35 <.24 <.29 <.29 <.24 9-14-1999 <.1 <.12 <.13 <.11 <.11 <.12 10-11-1999 <.1 <.12 <.13 <.11 <.11 <.12 3-31-2000 <.11 <.09 <.08 <.08 <.08 <.08
4-04-2000 <.11 <.09 <.08 <.08 <.08 <.08 4-05-2000 <.11 <.09 <.08 <.08 <.08 <.08 4-06-2000 <.11 <.09 <.08 <.08 <.08 <.08 4-07-2000 <.11 <.09 <.08 <.08 <.08 <.08 4-10-2000 <.11 <.09 <.08 <.08 <.08 <.08
10-11-2002 <.146 <.138 <.347 <.336 <.336 <.305 10-16-2002 <.146 <.138 <.347 <.336 <.336 <.305 10-24-2002 <.146 <.138 <.347 <.336 <.336 <.305 11-12-2002 <.146 <.138 <.347 <.336 <.336 <.305 8-13-2002 <.146 <.138 <.347 <.336 <.493 <.305
8-20-2002 <.146 <.138 <.347 <.336 <.493 <.305 8-22-2002 <.146 <.138 <.347 <.336 <.493 <.305 12-17-2002 <.146 <.138 <.347 <.336 <.493 <.305
Water blank 8-07-2002 <.146 <.138 <.347 <.336 <.493 <.305
Appendix 51

Table 1-5. Analytical results for volatile organic compounds detected in six or fewer wells for samples collected for quality assur-ance, Massachusetts Military Reservation, Cape Cod, Massachusetts, August 1999–December 2002.
[All concentrations in micrograms per liter. 1,1-DCE, 1,1-dichloroethene; 1,1,2,2-TeCA, 1,1,2,2-tetrachloroethane; 1,1,1-TCA, 1,1,1-trichloroethane; 1,1,2-TCA, 1,1,2-trichloroethane; 1,1-DCA, 1,1-dichloroethane; trans1,2-DCE, trans1,2-dichloroethene; <, less than the analytical detection limit; NA, not analyzed]
Quality assurance sample type
Date collected
trans1,2-DCE 1,1-DCE Benzene1,4-Dichloro-
benzene1,1,2,2-TeCA 1,1,1-TCA 1,1,2-TCA
Equipment blank 8-05-1999 <0.12 <0.13 <0.099 <.097 <0.14 <0.094 <0.098 9-14-1999 <.12 <.13 <.099 <.097 <.14 <.094 <.098 4-07-2000 <.09 <.09 <.11 <.1 <.13 <.09 <.11 12-17-2002 <.271 <.226 <.216 <.38 <.477 <.528 <.4
Trip blank 8-04-1999 <.12 <.13 <.099 <.097 <.14 <.094 <.098 8-05-1999 <.12 <.13 <.099 <.097 <.14 <.094 <.098 8-06-1999 <.12 <.13 <.099 <.097 <.14 <.094 <.098 8-09-1999 <.12 <.13 <.099 <.097 <.14 <.094 <.098 8-11-1999 <.12 <.13 <.099 <.097 <.14 <.094 <.098
8-12-1999 <.24 <.3 <.28 <.26 <.32 <.23 <.33 8-16-1999 <.24 <.3 <.28 <.26 <.32 <.23 <.33 9-14-1999 <.12 <.13 <.099 <.097 <.14 <.094 <.098 10-11-1999 <.12 <.13 <.099 <.097 <.14 <.094 <.098 3-31-2000 <.09 <.09 <.11 <.1 <.13 <.09 <.11
4-04-2000 <.09 <.09 <.11 <.1 <.13 <.09 <.11 4-05-2000 <.09 <.09 <.11 <.1 <.13 <.09 <.11 4-06-2000 <.09 <.09 <.11 <.1 <.13 <.09 <.11 4-07-2000 <.09 <.09 <.11 <.1 <.13 <.09 <.11 4-10-2000 <.09 <.09 <.11 <.1 <.13 <.09 <.11
10-11-2002 <.271 <.226 <.216 <.38 <.477 <.528 <.4 10-16-2002 <.271 <.226 <.216 <.38 <.477 <.528 <.4 10-24-2002 <.271 <.226 <.216 <.38 <.477 <.528 <.4 11-12-2002 <.271 <.226 <.216 <.38 <.477 <.528 <.4 8-13-2002 <.271 <.226 <.216 <.38 <.477 <.528 <.4 8-20-2002 <.271 <.226 <.216 <.38 <.477 <.528 <.4
8-22-2002 <.271 <.226 <.216 <.38 <.477 <.528 <.4 12-17-2002 <.271 <.226 <.216 <.38 <.477 <.528 <.4
Water blank 8-07-2002 <.271 <.226 <.216 <.38 <.477 <.528 <.4
52 Comparison of Diffusion- and Pumped-Sampling Methods to Monitor VOCs in Ground Water, MMR, Cape Cod, MA

Table 1-5. Analytical results for volatile organic compounds detected in six or fewer wells for samples collected for quality assur-ance, Massachusetts Military Reservation, Cape Cod, Massachusetts, August 1999–December 2002.—Continued
[All concentrations in micrograms per liter.1,1-DCE, 1,1-dichloroethene; 1,1,2,2-TeCA,1,1,2,2-tetrachloroethane; 1,1,1-TCA, 1,1,1-trichloroethane; 1,1,2-TCA, 1,1,2-trichloroethane; 1,1-DCA, 1,1-dichloroethane; trans1,2-DCE, trans1,2-dichloroethene; <, less than the detection limit; NA, concentration is less than the analytical detection limit]
Quality assurance sample type
Date collected
1,1-DCA Ethylbenzene TolueneCarbon tetra-
chlorideVinyl
chlorideMethyl
chlorideXylenes,
total
Equipment blank 8-05-1999 <0.13 <0.096 <0.11 <0.1 <0.13 <0.16 <0.29 9-14-1999 <.13 <.096 <.11 <.1 <.13 <.16 NA 4-07-2000 <.07 <.1 <.09 <.08 <.08 <.08 <.11 12-17-2002 <.156 <.178 <.185 <.618 <.413 <.429 NA
Trip blank 8-04-1999 <.13 <.096 <.11 <.1 <.13 <.16 <.29 8-05-1999 <.13 <.096 <.11 <.1 <.13 <.16 <.29 8-06-1999 <.13 <.096 <.11 <.1 <.13 <.16 <.29 8-09-1999 <.13 <.096 <.11 <.1 <.13 <.16 <.29 8-11-1999 <.13 <.096 <.11 <.1 <.13 <.16 <.29
8-12-1999 <.29 <.21 <.29 <.27 <.27 <.28 <.79 8-16-1999 <.29 <.21 <.29 <.27 <.27 <.28 <.79 9-14-1999 <.13 <.096 <.11 <.1 <.13 <.16 <.29 10-11-1999 <.13 <.096 <.11 <.1 <.13 <.16 <.29 3-31-2000 <.07 <.1 <.09 <.08 <.08 <.08 <.11
4-04-2000 <.07 <.1 <.09 <.08 <.08 <.08 <.11 4-05-2000 <.07 <.1 <.09 <.08 <.08 <.08 <.11 4-06-2000 <.07 <.1 <.09 <.08 <.08 <.08 <.11 4-07-2000 <.07 <.1 <.09 <.08 <.08 <.08 <.11 4-10-2000 <.07 <.1 <.09 <.08 <.08 <.08 <.11
10-11-2002 <.156 <.178 <.185 <.618 <.413 <.429 NA 10-16-2002 <.156 <.178 <.185 <.618 <.413 <.429 NA 10-24-2002 <.156 <.178 <.185 <.618 <.413 <.429 NA 11-12-2002 <.156 <.178 <.185 <.618 <.413 <.429 NA 8-13-2002 <.156 <.178 <.185 <.618 <.413 <.429 NA
8-20-2002 <.156 <.178 <.185 <.618 <.413 <.429 NA 8-22-2002 <.156 <.178 <.185 <.618 <.413 <.429 NA 12-17-2002 <.156 <.178 <.185 <.618 <.413 <.429 NA
Water blank 8-07-2002 <.156 <.178 <.185 <.618 <.413 <.429 NA
Appendix 53
