comparison of biomass allometric approaches for regional scale carbon mapping
DESCRIPTION
Comparison of biomass allometric approaches for regional scale carbon mapping. Scott Powell – Montana State University Robert Kennedy – Boston University Janet Ohmann – USDA Forest Service Warren Cohen – USDA Forest Service Matthew Gregory – Oregon State University - PowerPoint PPT PresentationTRANSCRIPT

Comparison of biomass allometric approaches for regional scale carbon mapping
Scott Powell – Montana State UniversityRobert Kennedy – Boston UniversityJanet Ohmann – USDA Forest ServiceWarren Cohen – USDA Forest Service
Matthew Gregory – Oregon State UniversityHeather Roberts – Oregon State University
Van Kane – University of WashingtonJim Lutz – University of Washington
ForestSAT: Corvallis, Oregon, September 2012
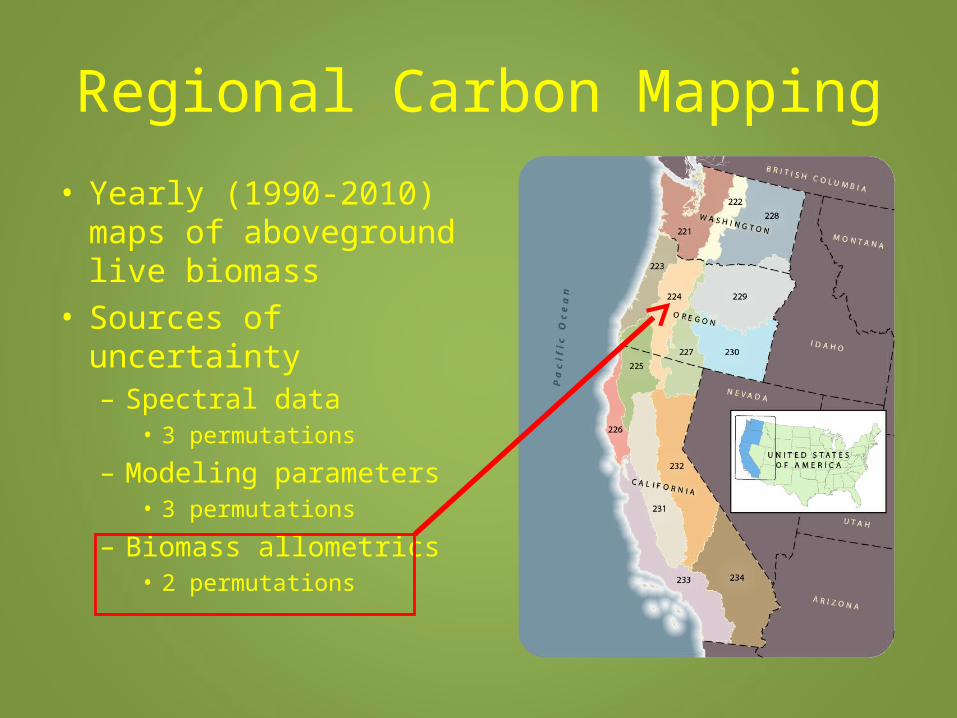
Regional Carbon Mapping
• Yearly (1990-2010) maps of aboveground live biomass
• Sources of uncertainty– Spectral data
• 3 permutations
– Modeling parameters• 3 permutations
– Biomass allometrics• 2 permutations
Biomass Allometric Equations
• Enable scaling of tree-level measurements to biomass.
• Variety of approaches ranging from generic to site-specific.– Different scales, assumptions, uses, and
interpretations.– Carbon accounting vs. carbon mapping

Objectives• Compare mapped predictions of aboveground
biomass based on two common allometric approaches.
• Improve understanding of the range of uncertainty introduced into carbon mapping from selection of biomass allometric approach.
• Assess differences in estimated biomass based on forest structure, composition, and land ownership.
Methods
Allometric approaches:
1. Jenkins Equations: Nationally genericJenkins, J.C., D.C. Chojnacky, L.S. Heath, and R.A. Birdsey. 2003. National-scale biomass estimators for United States tree species. Forest Science 49(1): 12-35.
2. Component Ratio Method (CRM): Regionally-tailored but nationally consistentHeath, L.S., M.H. Hansen, J.E. Smith, W.B. Smith, and P.D. Miles. 2009. Investigation into calculating tree biomass and carbon in the FIADB using a biomass expansion factor approach. In: McWilliams, W., Moisen, G., Czaplewski, R., comps. 2009. 2008 Forest Inventory and Analysis (FIA) Symposium; October 21-23, 2008: Park City, UT. Proc. RMRS-P-56CD. Fort Collins, CO: U.S. Department of Agriculture, Forest Service, Rocky Mountain Research Station. 1 CD.
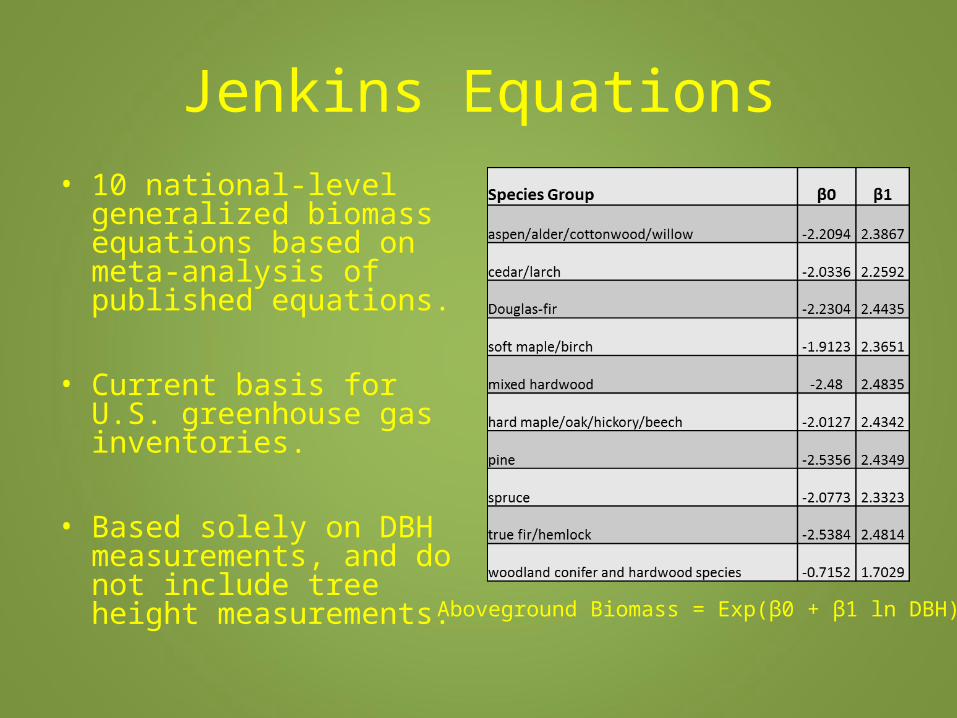
Jenkins Equations• 10 national-level
generalized biomass equations based on meta-analysis of published equations.
• Current basis for U.S. greenhouse gas inventories.
• Based solely on DBH measurements, and do not include tree height measurements. Aboveground Biomass = Exp(β0 + β1 ln DBH)

Component Ratio Method (CRM)
• Basis for current FIA biomass estimates
• Nationally-consistent method that relies on regional FIA volume equations and specific gravity to estimate biomass.
• Volume equations incorporate tree height (or surrogate)

Previous Studies
• Zhou and Hemstrom, 2009 – PNW-RP-584– CRM biomass estimates were 17% lower than Jenkins
biomass estimates for aboveground softwood biomass in Oregon.
• Domke et al., 2012 – Forest Ecology and Management.– CRM biomass estimates were 16% lower than Jenkins
biomass estimates for the 20 most common species in the U.S.
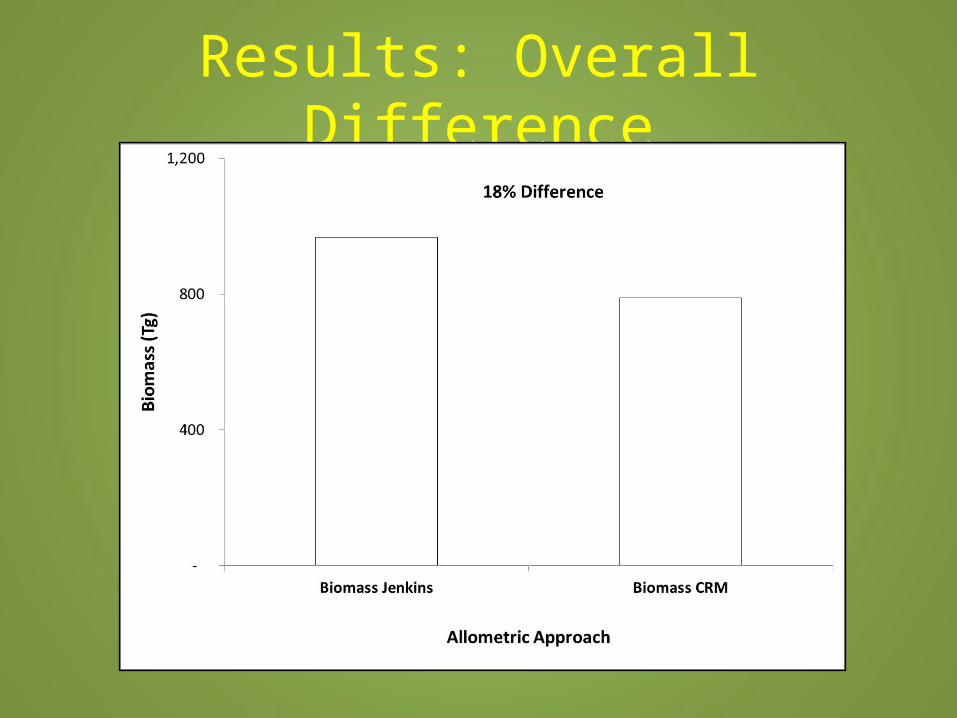
Results: Overall Difference
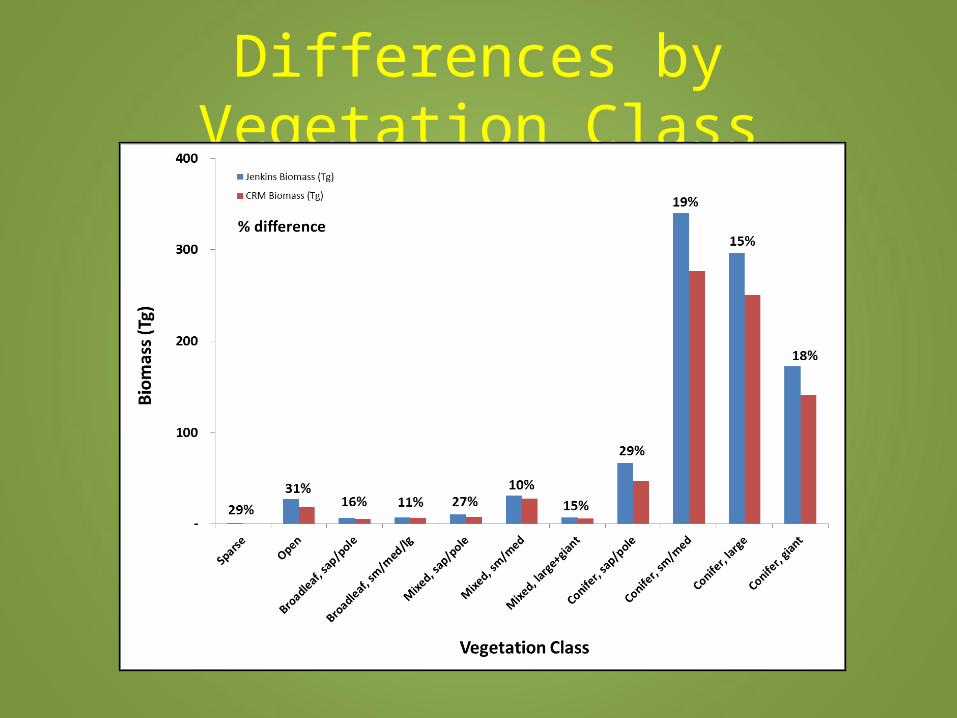
Differences by Vegetation Class

Spatial Variation: Relative Differences by Height and Age
Ratio = Jenkins/CRM

Spatial Variation: Absolute Differences by Height and Age
Difference = Jenkins - CRM
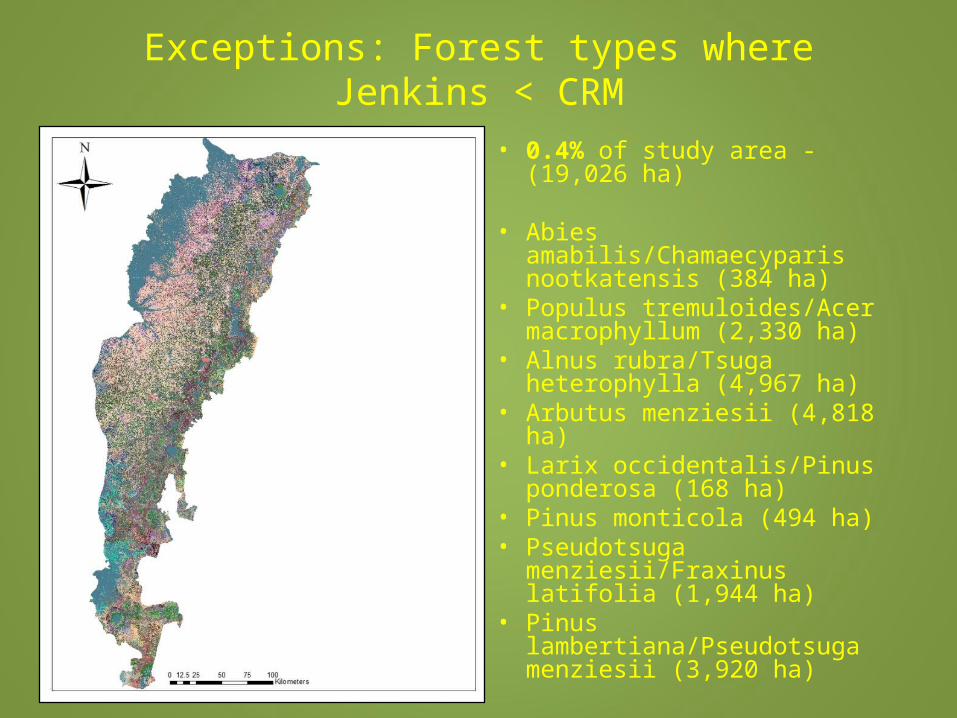
Exceptions: Forest types where Jenkins < CRM
• 0.4% of study area - (19,026 ha)
• Abies amabilis/Chamaecyparis nootkatensis (384 ha)
• Populus tremuloides/Acer macrophyllum (2,330 ha)
• Alnus rubra/Tsuga heterophylla (4,967 ha)
• Arbutus menziesii (4,818 ha)• Larix occidentalis/Pinus
ponderosa (168 ha)• Pinus monticola (494 ha)• Pseudotsuga menziesii/Fraxinus
latifolia (1,944 ha)• Pinus lambertiana/Pseudotsuga
menziesii (3,920 ha)
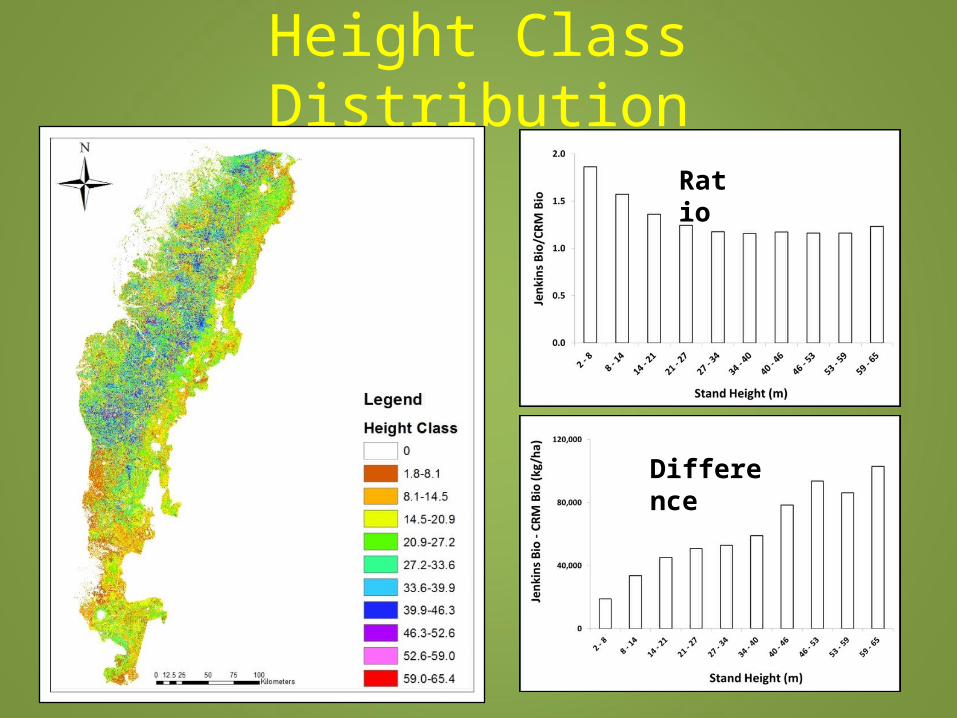
Height Class Distribution
Ratio
Difference

Height Class

Age Class Distribution
Ratio
Difference
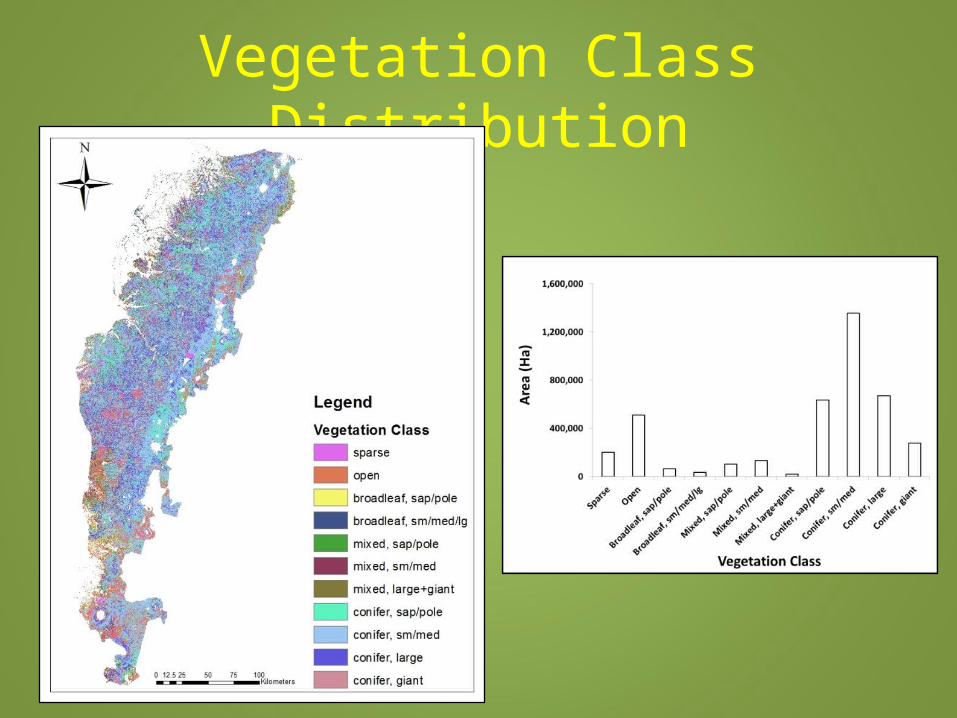
Vegetation Class Distribution
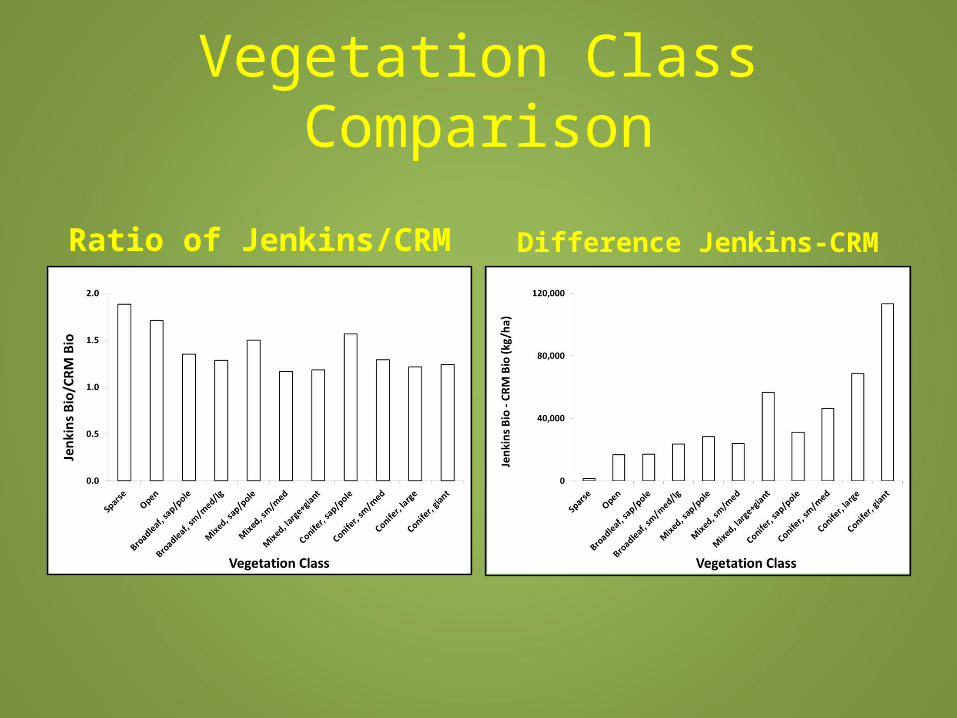
Vegetation Class Comparison
Ratio of Jenkins/CRM Difference Jenkins-CRM

Ownership Class Distribution
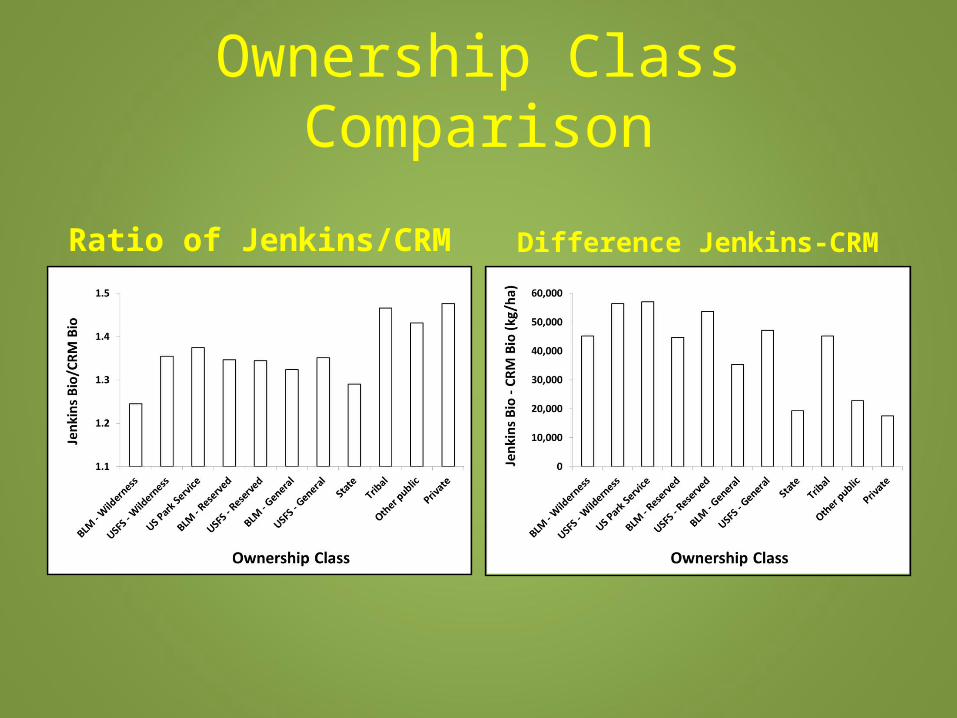
Ownership Class Comparison
Ratio of Jenkins/CRM Difference Jenkins-CRM

Conclusions
• Overall difference between methods is 18% but there is significant spatial variation (up to 31% in young, open stands).
• Jenkins biomass > CRM biomass, especially in younger, shorter, more open stands on private lands.
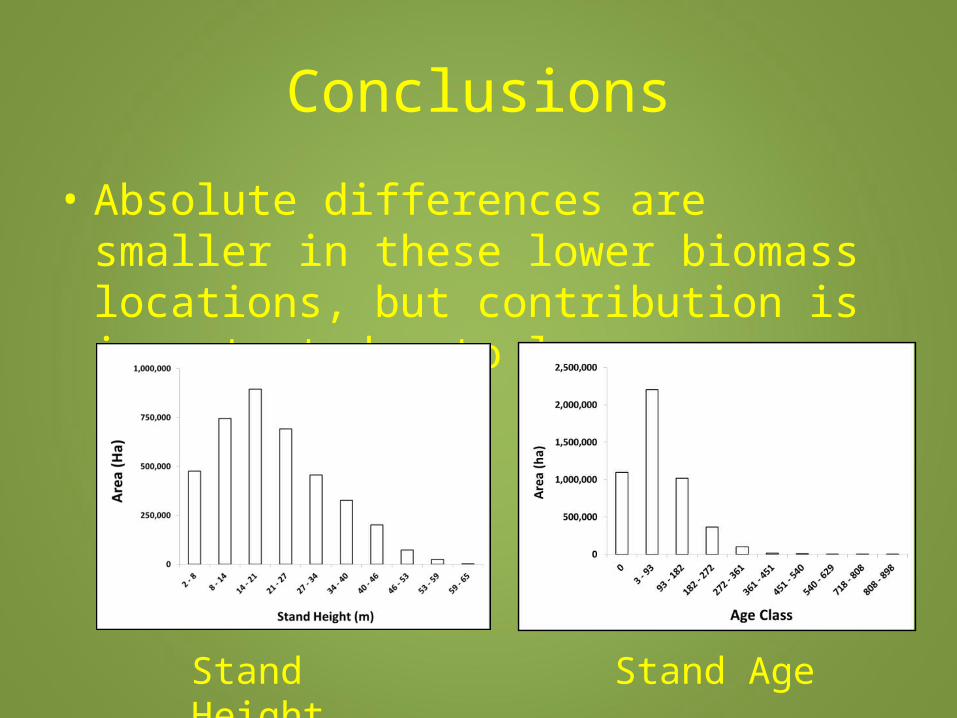
Conclusions
• Absolute differences are smaller in these lower biomass locations, but contribution is important due to large area.
Stand Height Stand Age

Conclusions
• Neither approach is inherently “correct”.– Incorporation of regionally-tailored volume
equations within a nationally-consistent framework is an improvement for spatially explicit purposes.
• Need additional scales of validation, including Lidar-derived biomass estimates (with “local” allometric equations).
Conclusions
• Implications for strict accounting purposes AND mapping applications.
• Careful equation selection in highly disturbed landscapes (young, short, open stands).
• Temporal considerations: Jenkins would potentially over-estimate biomass (relative to CRM) in post-disturbance, regenerating stands.
