comparison of acculturation outcomes among russian minority and native majority in estonia and...
TRANSCRIPT
Workshop: Russian minori+es and Russian migrants – integra+on challenges and perspec+ves in Estonia and Norway Prof. Raivo Ve+k, Tallinn University, Estonia Prof. David Lackland Sam, Bergen University, Norway Marianna Makarova, Tallinn University / Integra7on and Migra7on Founda7on Our People, Estonia
Interna+onal conference „Integra+on Challenges in a Radicalizing World“ 29 – 30 November 2016, Tallinn, Estonia

Comparison of acculturation outcomes among Russian minority and native majority
in Estonia and Norway
Raivo Vetik, Jüri Kruusvall Tallinn University

Contents 1. Introduc3on to the DIMA (Determinants of Inclusive
Migrant Accultura3on) project 2. Theory: different defini3ons of the research object and
units – the Chicago school, Berry and DIMA project 3. Empirical results: comparison of adapta3on outcomes
among different subject posi3ons in Estonia and Norway received along the rela3onal accultura3on model.

1. Introduc+on
• DIMA is financed by the Norwegian Research Council • Schedule: September 2013 – 2016 • Estonian team: Raivo Ve3k, Maaris Raudsepp, Jüri Kruusvall,
Larissa Kus-‐Harbord, Aune Valk, Marianna Makarova, Triin-‐Ketlin Siska, Marii Haak, Madli Raudkivi
• Partners at the University of Bergen: David Lacland Sam, Valeria Markova, Arsenii Markov
31/01/17 4

Objec+ves: • to compare accultura3on processes and outcomes among
Russians and na3ve majority in Estonia and Norway • to contribute to the larger MIRIPS project, based on a
psychological model of Berry • to expand the psychological model by introducing the field-‐
theore3cal (Bourdieu) concept ‘asymmetrical accultura3on field’
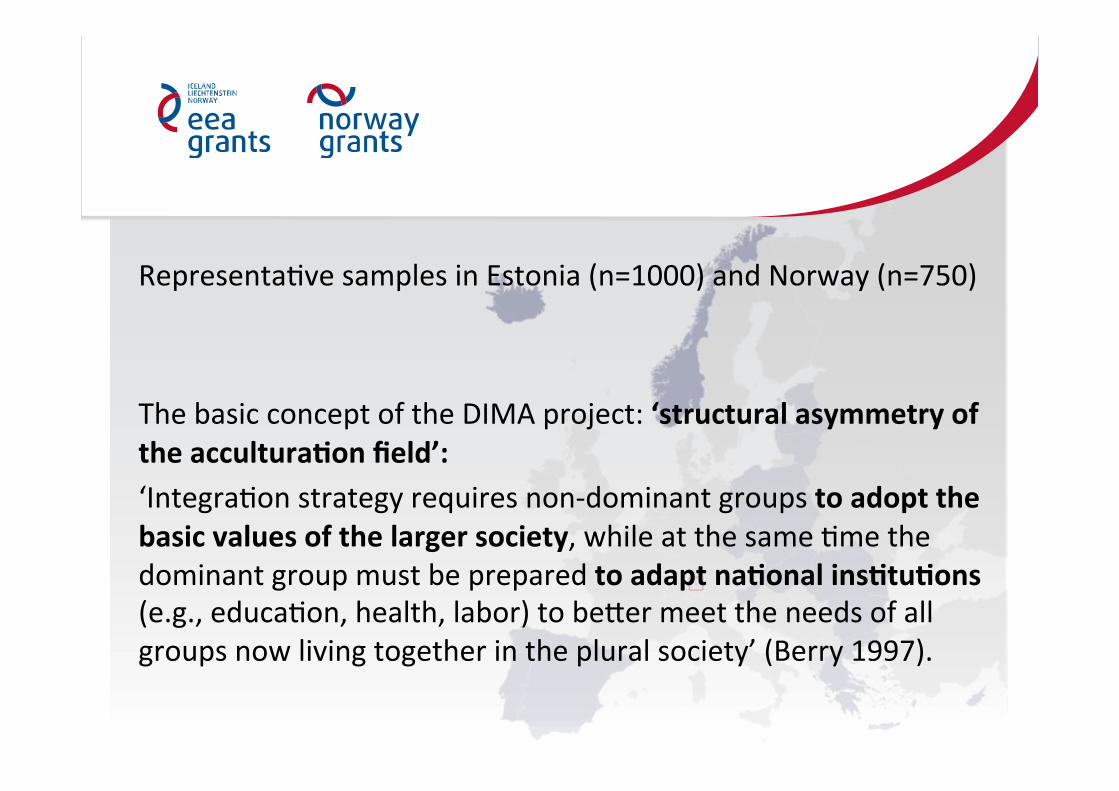
Representa3ve samples in Estonia (n=1000) and Norway (n=750) The basic concept of the DIMA project: ‘structural asymmetry of the accultura+on field’: ‘Integra3on strategy requires non-‐dominant groups to adopt the basic values of the larger society, while at the same 3me the dominant group must be prepared to adapt na+onal ins+tu+ons (e.g., educa3on, health, labor) to beeer meet the needs of all groups now living together in the plural society’ (Berry 1997).
2. Different defini+ons of the
research objects
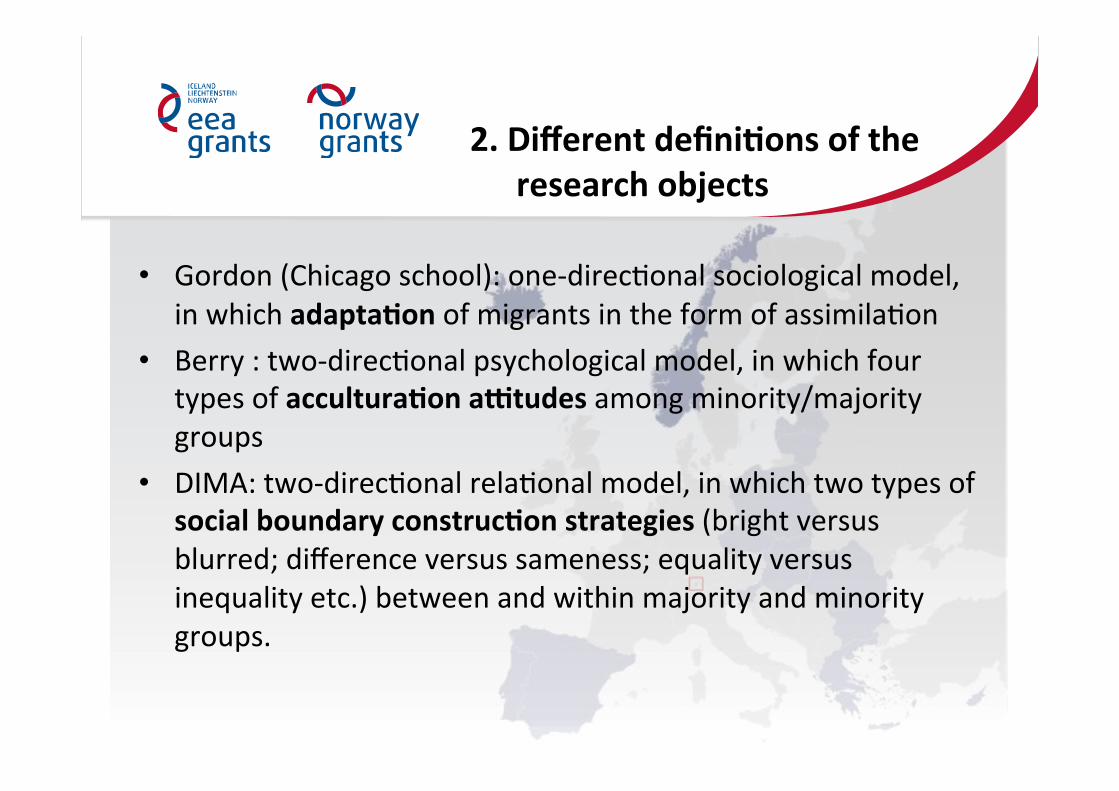
• Gordon (Chicago school): one-‐direc3onal sociological model, in which adapta+on of migrants in the form of assimila3on
• Berry : two-‐direc3onal psychological model, in which four types of accultura+on aYtudes among minority/majority groups
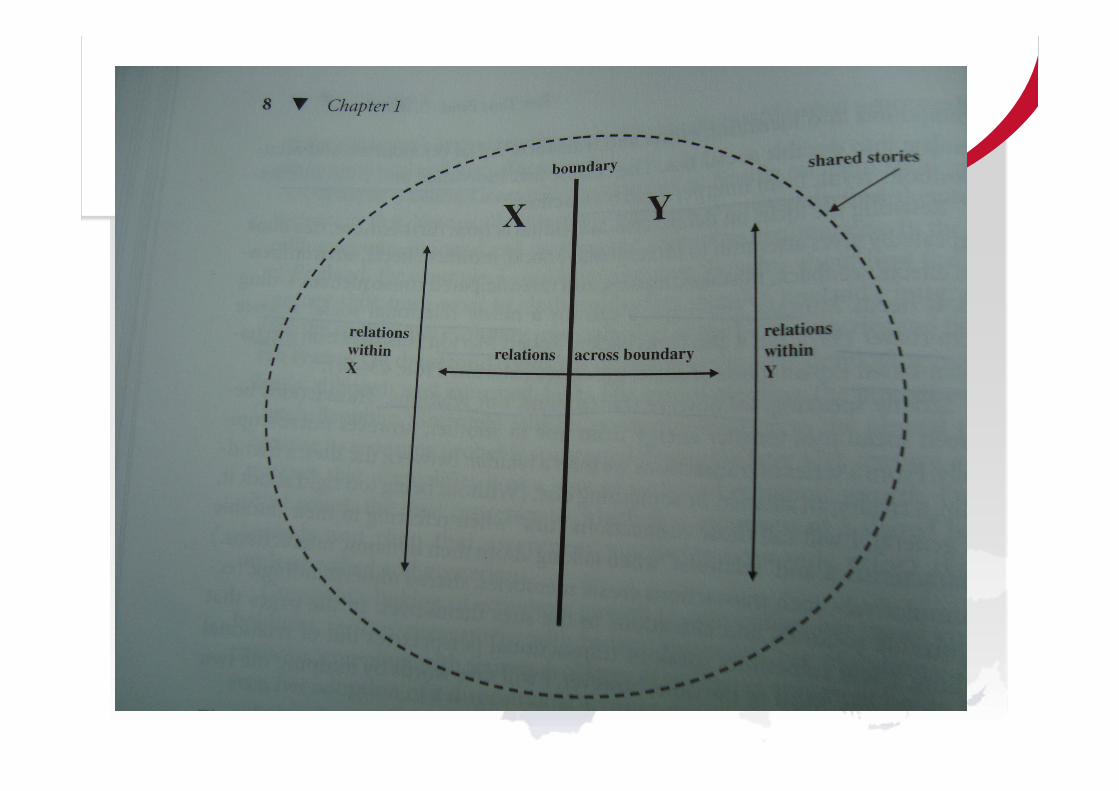
• DIMA: two-‐direc3onal rela3onal model, in which two types of social boundary construc+on strategies (bright versus blurred; difference versus sameness; equality versus inequality etc.) between and within majority and minority groups.
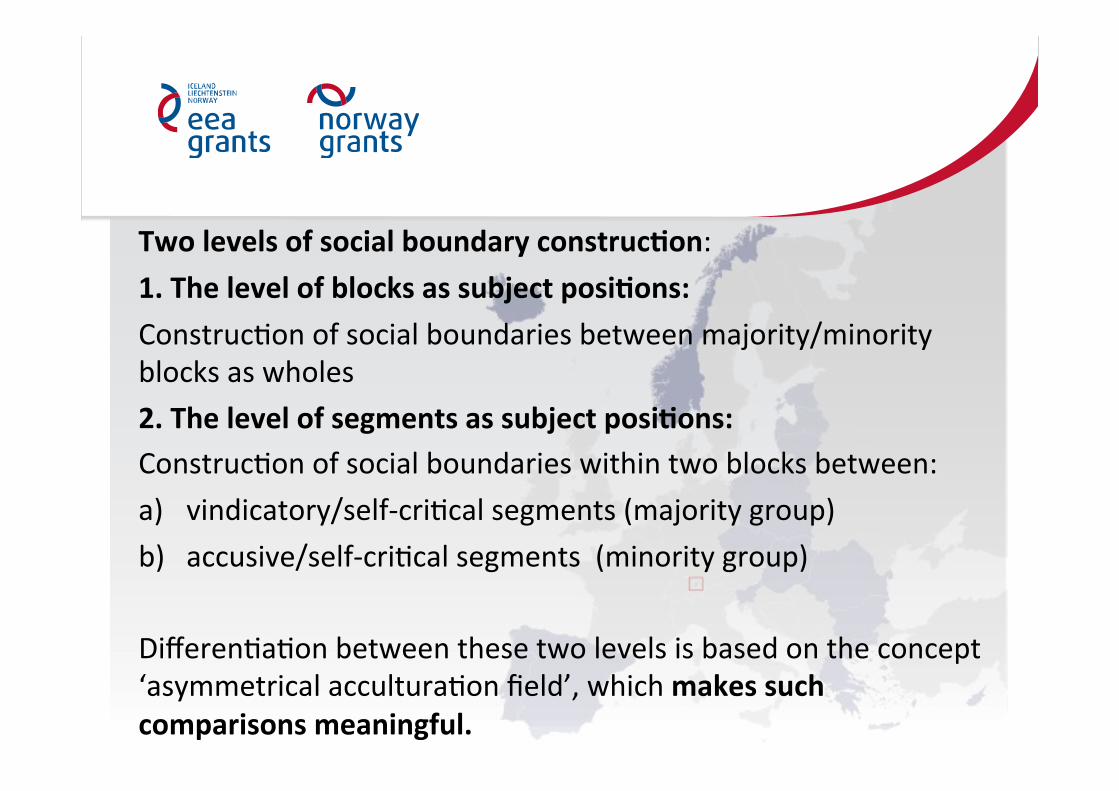
Two levels of social boundary construc+on: 1. The level of blocks as subject posi+ons: Construc3on of social boundaries between majority/minority blocks as wholes 2. The level of segments as subject posi+ons: Construc3on of social boundaries within two blocks between: a) vindicatory/self-‐cri3cal segments (majority group) b) accusive/self-‐cri3cal segments (minority group) Differen3a3on between these two levels is based on the concept ‘asymmetrical accultura3on field’, which makes such comparisons meaningful.

3. Empirical results
The DIMA project data allows comparisons on three levels: • the level of na3ons – comparison between 2 country contexts
(thus, we need to study also the histories of inter-‐cultural rela3ons, respec3ve laws, policies etc.) as well as paeerns of the rela3ons between blocks and segments
• the level of blocks – comparison between 2 majority and 2 minority blocks
• the level of segments – comparison between 4 self-‐righteous and 4 self-‐cri+cal segments

Distribu+on of subject posi+ons in the two na3ons (cluster analysis was carried out on the baeery of ques3ons on social boundary construc3on regarding ethnic inequality in labor market): Estonia • Estonians: vindicatory sp 72% and self-‐cri3cal sp 28%; • Russians: accusive sp 100% (very accusive sp 57% and moderately
accusive sp 43%, i.e. no self-‐cri+cal clusters among Russians!!!) Norway • Norwegians: vindicatory 51% and self-‐cri3cal 49%; • Russians: accusive sp 68% and self-‐cri3cal 32%. Thus, the cross-‐country comparison between Estonia and Norway highlights the role of na+onal context in accultura+on processes!!!

Socio-‐economic adapta+on
(means in the Lickert scale and percents)
Est EstRus Nor NorRus
vind s-‐c sig acc s-‐c sig vind s-‐c sig acc s-‐c sig
Life sa+sfac+on 3,3 3,5 2,5 2,9 *** 4,0 3,9 3,5 4,0 ***
Family socio-‐economic situa+on is good
56 45 37 46 66 75 75 86
Socio-‐economic discrimina+on
2,4 2,8 *** 4,3 3,7 *** 3,4 3,6 3,1 2,6 ***
Job does not correspond to educ.
30 21 48 34 29 30 41 29
Unemployed during last 5 years
17 17 20 12 14 17 41 45
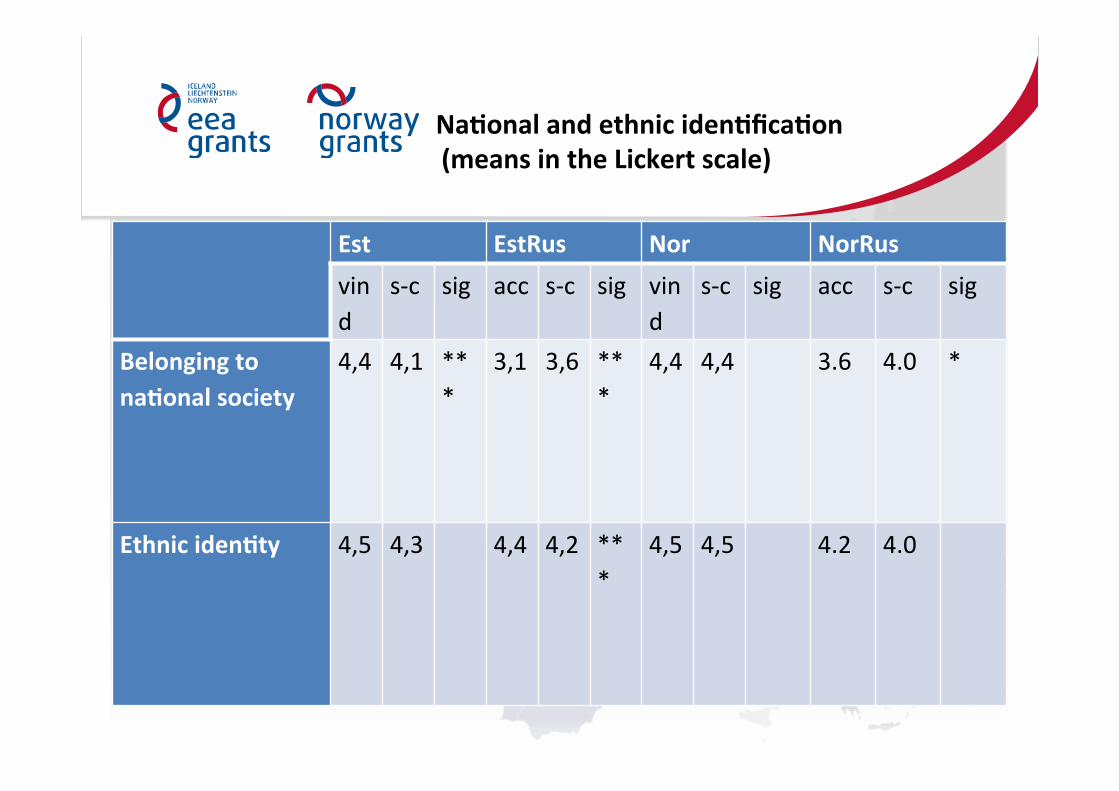
Na+onal and ethnic iden+fica+on
(means in the Lickert scale)
Est EstRus Nor NorRus vind
s-‐c sig acc s-‐c sig vind
s-‐c sig acc s-‐c sig
Belonging to na+onal society
4,4 4,1 ***
3,1 3,6 ***
4,4 4,4 3.6 4.0 *
Ethnic iden+ty
4,5 4,3 4,4 4,2 ***
4,5 4,5 4.2 4.0

Inter-‐cultural adapta+on
(percents and means in the Lickert scale)
Est EstRus Nor NorRus
vind
s-‐c sig acc s-‐c sig vind
s-‐c sig acc s-‐c sig
Feelings towards the ’other’ group
52 55 67 79 ***
53 58 *** 71 76
Trust of the ’other’ group
3,2 3,6 ***
2.9 3.6 ***
3,2 3,8 4,0 4,4 ***

Accultura+on scales (means in Lickert scale)
Est EstRus Nor NorRus
vind
s-‐c sig acc s-‐c sig vind
s-‐c sig acc s-‐c sig
Minority culture maintenance
3,5 3,9 ***
3,3 3,5 ***
2,9 3,5 ***
4,30 4,0
Adop+on of majority values and tradi+ons
3,8 3,7 2,7 3,0 ***
4,7 4,6 3,8 4,0

Conclusions 1) The level of na+ons – different histories and paeerns of
inter-‐ethnic polariza3on impact accultura3on outcomes. 2) The level of blocs – asymmetry between the majority/
minority statuses brings about the tendency to see the ‘other’ in terms of bright inter-‐cultural boundaries.
3) The level of segments – the reasons behind the tendency to construct closed inter-‐cultural boundaries by self-‐righteous segments have to do with their lower socio-‐economic posi3on in society.

Thus, • integra3on policies should tackle insecuri+es and inequali+es, which exist along ethnic lines.
However, • insecurity and inequality as social phenomena implement important social func+ons (innova3on, mo3va3on etc.), par3cularly in the context of globalizing world.
Is integra3on a mission impossible? Not at all.

For more conference materials and presenta3ons please visit www.misakonverents.ee