comparison between western and emerging plants: opex...
TRANSCRIPT

Comparison between Western and Emerging Plants: OPEX Benchmarking Nicolas Ponce
28/10/15
www.pharmaprocessforum.com

Agenda
2
Introduction to the University of St.Gallen 1
2 Introduction to St.Gallen’s Work on Operational Excellence
Comparison between Western and Emerging Plants 3
Conclusion of the Comparison 4
Overview of 2016 Activities 5

3
The University of St.Gallen Institute of Technology Management (ITEM-HSG) and Division of Production Management
Founded in 1898 39 institutes and 5 schools (Management,
Economics and Political Science, Finance, Law, Humanities and Social Sciences)
8,020 students (25% international students), 719 research associates, 93 professors
University of St.Gallen (HSG)
Founded in 1988 4 professors for Production Mgmt.,
Innovation Mgmt., Operations Mgmt. and Entrepreneurship with 40+ research associates
Institute of Technology Management
Division of Production Management
Led by Prof. Dr. Thomas Friedli Currently 12 research associates

4
Division of Production Management at ITEM-HSG Three competence centers

Agenda
5
Introduction to the University of St.Gallen 1
Comparison between Western and Emerging Plants 3
Conclusion of the Comparison 4
Overview of 2016 Activities 5
2 Introduction to St.Gallen’s Work on Operational Excellence
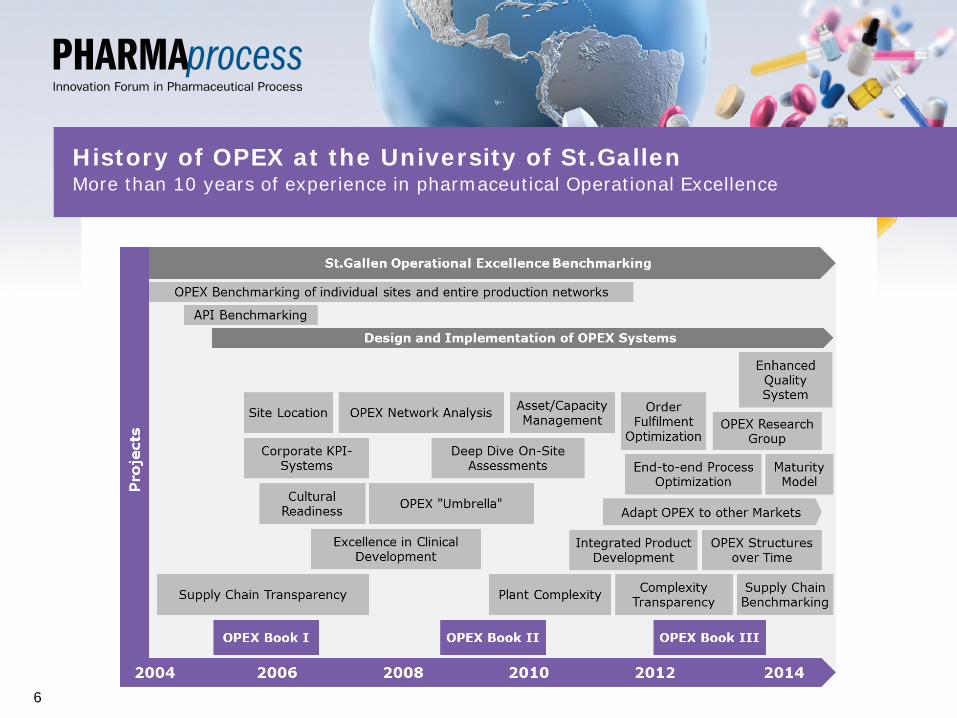
History of OPEX at the University of St.Gallen More than 10 years of experience in pharmaceutical Operational Excellence
6

The ITEM-HSG defines Operational Excellence as a philosophy directing an organization towards continuous improvement!
It is the balanced management of cost, quality and time focusing on the needs of the customer It comprises structural & behavioural changes to support the needed activities the best way possible To be sustainable it has to be pushed by Top Management and to be designed to engage every single employee
A Definition of Operational Excellence The St.Gallen understanding
7
Operational Excellence is not only about performance, it is also about the way an organization achieves superior performance and about
how it continuously improves itself!

The St.Gallen Operational Excellence Model A framework for thinking about OPEX
8
The St.Gallen Operational Excellence Model consists of a technical and a social sub-system

The St.Gallen Operational Excellence Benchmarking Key facts
9
Industry Pharmaceutical
Number of Production Sites
315 (Total)*
230 (Formulation & Packaging)
61 (API)
24 (Biotech)
Number of Companies
124 (Total), including 11 companies of the Top 20**
Content – Scope
Enabler Implementation and Performance Metrics (KPIs)
Content – Modules
Total Productive Maintenance (TPM) Total Quality Management (TQM) Just-In-Time (JIT) Effective Management System (EMS)
*Status: October 2015 **According to Pharmaceutical Executive

KPIs cannot be analysed without the consideration of specific approaches, tools or without understanding the specific
site situation and role
Implementation of approaches and tools
Relevant KPIs for the categories: TPM, TQM, JIT and Effective Management System
Restrictions by business and product program
The St.Gallen Operational Excellence Benchmarking Architecture
10
Structural Factors
Enabler
KPIs

What We Investigate KPIs (excerpt)
11
TPM sub-element Loading (API, F&P*)
OEE (API, F&P)
Set-up and Cleaning (API, F&P)
Dedicated Equipment (API, F&P)
Unplanned Maintenance (API, F&P)
Maintenance Cost/ Overall Cost
Maintenance Cost/ Conversion Cost
JIT sub-element Days-on-hand
Service Level (Delivery and Suppliers)
Forecast Accuracy
Production Schedule Accuracy
Production Freeze Period
Priority Orders
Material Turns (Raw Material, WIP**, Finished Goods)
Order Lead Time
Changeover Time
TQM sub-element Complaint rate customer
Yield
Right First Time
Rejected Batches
Scrap Rate
Release time
Deviations per batch
Deviation Closure Time
Quality Cost/ Overall Cost
Quality Cost/ Conversion Cost
Quality Cost per Batch
*F&P: Formulation & Packaging **WIP: Work-in-progress
EMS sub-element Group Work
Functional Integration
Training Days
Employee Suggestions
Level of Qualification
Level of Safety

What We Investigate Enabler (excerpt)
12
Preventive maintenance The statement applies to our plant...
Not at all Partially Completely Don`t know
We have a formal program for maintaining our machines and equipment.
Maintenance plans and checklists are posted closely to our machines and maintenance jobs are documented.We emphasize good maintenance as a strategy for increasing quality and planning for compliance. All potential bottleneck machines are identified and supplied with additional spare parts. We continuously optimize our maintenance program based on a dedicated failure analysis.Our maintenance department focuses on assisting machine operators perform their own preventive maintenance. Our machine operators are actively involved into the decision makingprocess when we decide to buy new machines. Our machines are mainly maintained internally. We try to avoid external maintenance service as far as possible.
The enabler implementation is based on a self-assessment: A Likert scale from 1 (not at all) to 5 (completely) is provided for each enabler

The St.Gallen Operational Excellence Benchmarking Performance calculation
13
Balanced approach for the performance calculation: Consideration of a variety of KPIs to capture the performance holistically

Agenda
14
Introduction to the University of St.Gallen 1
Comparison between Western and Emerging Plants 3
Conclusion of the Comparison 4
Overview of 2016 Activities 5
2 Introduction to St.Gallen’s Work on Operational Excellence

Motivation for Operational Excellence COGS – The cost of goods sold as major part of the overall cost
15
25%11%
18%
22%
20%
11%
12%
63%
9%
31%53%
5%13%
Brand-name companies
Contract manufacturer
4%
3%
Generics manufacturer
Margin
Manufacturing
Sales & Marketing General & Administration
R&D

Motivation for Operational Excellence The potential for pharmaceutical companies
16
15%11%
25%
17%
44% 40%
16%
16% 16%
Property, plant, & equipment cost
Labor cost
Other cost
Material cost
Top 10% Average plant*
€ 1.5m lower QC/QA cost 1
2 € 1.4m lower maintenance cost
€ 840k lower depreciation due to better asset utilization 3
€ 740k lower cost due to better yield 4
Cost savings potential**
*100% = € 40m overall cost **Average cost saving potential of € 6.4 million

Classification of Emerging Markets Emerging Market is used as an umbrella buzz word with various definitions
The term emerging market was coined by economists at the International Finance Corporation in 1981
Commonly applied and colloquial classification criteria are abundant and have become ubiquitous in foreign policy and trade debates, organizations’ annual reports, and media
These criteria can usually be assigned to one of the three categories poverty, capital markets or growth potential:
17
Category Criteria
Poverty Low- or middle-income country Low average living standards Not industrialized
Capital market Low market capitalization relative to GDP Low stock market turnover and few listed stocks
Growth potential Economic liberalization Open to foreign investment Recent economic growth

Classification of Emerging Markets Definition for this comparison
Following HOSKISSON ET AL. and the Development Policy and Analysis Division of the United Nations, an emerging market falls in one of the two groups of either developing countries or economies in transition
18
Developing countries North Africa Sub-Saharan Africa
East Asia South Asia West Asia
Mexico and Central America South America Caribbean
Small island developing States
Economies in transition South-Eastern Europe
Commonwealth of Independent States
Implications Emerging markets are widespread over
the globe and exist in almost every geographic region!
The level of economic development between emerging markets differs on a broad bandwidth and constitutes different conditions for companies having business activities there!
Large emerging markets are heterogeneous countries, i.e. culture and economic prosperity of regions are not congruent within the same market!

Building the Data Samples Altogether the chosen data sets were divided into four samples
The quantitative data used for this comparison stems from the St.Gallen Operational Excellence Benchmarking
Under consideration of the previously defined classification of emerging markets the chosen data sets were split into: − Data sets from advanced countries (advanced sample, n=217) − Data sets from emerging countries (emerging sample, n=37)
Taking into account only the data sets from advanced countries a further sample was created, comprising only the ten best performing manufacturing sites (top-10 sample, n=10)
In order to assess the differences between pharmaceutical manufacturing sites of multinational organizations and domestic manufacturers the emerging sample was split in these two groups: − Data sets from multinationals (offshore sample, n=18) − Data sets from domestic manufacturers (domestic sample, n=19)
19

Geographic Distribution of the advanced & top-10 Sample n=217
20
Top-10
Belgium 10%
Canada 10%
Germany 30%
Italy 20%
The Netherlands 10%
US 20%
Austria 2.3%Belgium 3.2%
Canada 3.7%Denmark 2.8%
Finland 4.6%
France 5.5%
Germany 26.3%
Greece 0.5%Ireland 5.1%
Italy 7.4%Japan 0.5%
Norway 0.9%Portugal 0.5%
Sweden 0.9%
Spain 6.0%
Switzerland 13.8%
The Netherlands 6.5%
UK 5.1%US 4.6%

Geographic Distribution of the emerging Sample n=37
21
Czech Republic 5%
Estonia 3%
Poland 13%
Romania 3%
Slovenia 8%
Brazil 11%
Mexico 5%Puerto Rico 5%
Taiwan 14%
China 11%
Malaysia 8%
India 3%
Sub-Saharan Africa 11%

Structural Factors Comparison Size of manufacturing site
22
Pharmaceutical manufacturing sites in both the advanced and emerging sample are of different sizes (employee counts) indicating that implementing Operational Excellence is relevant for companies regardless their size and geographic region
Number of employees advanced n=217
emerging n=37
<100 18% 8%
100-300 41% 26%
301-500 23% 38%
501-1.000 13% 21%
>1.000 5% 7%

Structural Factors Comparison Production structure
23
In both samples the production structure of the majority of manufacturing sites focus on at least two dosage forms (mixed sites) instead of only manufacturing a single dosage form
Production structure advanced n=217
emerging n=37
API 16% 23%
Solids 21% 16%
Semi Solids 1% 3%
Liquids 3% 0%
Sterile Liquids 7% 6%
Mixed 52% 52%

Structural Factors Comparison Business model
24
Differences between the samples are observable in the underlying business model. The majority of domestic manufacturers produces generics whereas multinationals in emerging markets and sites in advanced countries are predominantly research driven and manufacture IP-protected drugs
Business model advanced n=217
offshore n=18
domestic n=19
Research driven 47% 50% 27%
Generics 30% 39% 68%
Contract manufacturer 23% 11% 5%

Enabler Implementation Comparison Technical system
25
Sub-system top-10 n=10
advanced n=217
offshore n=18
domestic n=19
TPM
Preventive maintenance 79% 75% 75% 75%
Technology assessment & usage 64% 60% 60% 61%
Housekeeping 87% 83% 84% 82%
TQM
Process management 73% 72% 72% 73%
Cross-functional product develop. 76% 68% 73% 63%
Customer integration 75% 73% 73% 73%
Supplier quality management 75% 69% 69% 68%
JIT
Setup time reduction 69% 63% 60% 66%
Pull production 62% 49% 47% 51%
Layout optimization 73% 64% 63% 66%
Planning adherence 76% 71% 71% 71%
x>75% 75%>x>65% 65%>x>60% x<60%

Enabler Implementation Comparison Social system and basic elements
26
Sub-system top-10 n=10
advanced n=217
offshore n=18
domestic n=19
EMS
Direction setting 88% 80% 83% 77%
Management commitment & company culture 76% 73% 74% 72%
Employee involvement & continuous improvement 71% 67% 70% 64%
Functional integration & qualification 71% 66% 64% 67%
Basic elements
Standardization 69% 73% 71% 76%
Visualization 56% 60% 62% 59%
x>75% 75%>x>65% 65%>x>60% x<60%

Enabler Implementation Comparison Interim conclusion
27
Reviewing the enabler implementation comparison results it appears that there is only little variety at implementation of OPEX practices between domestic and offshore sites
Even more surprising is that there is also little difference between these two samples and the cluster representing manufacturing sites in advanced markets
Apart from the basic elements sites of the top-10 sample indicate an at least as high or even higher implementation level of OPEX practices than offshore and domestic emerging market sites
Generally, there are two explanations for these results: 1. The enabler implementation is based on a self-assessment and consequently
the benchmarking results depend to a large extend on the knowledge and maturity level of the participating site
2. Sites which participate twice at the benchmarking usually are more self-critical the second time as they aware that they can do more with regard to the activities stated in the OPEX benchmarking questionnaire

Operational Performance Comparison Production schedule accuracy
28
Comparing the samples it becomes evident that domestic sites have the lowest level of production schedule accuracy. Noteworthy, firstly, their counterparts, namely offshore sites of multinational organizations, provide a higher accuracy which is close to the top-10 manufacturing sites. Secondly, the average pharmaceutical site in an advanced market has a low production schedule accuracy that is akin to domestic sites. This allows the conclusion that it is less the emerging market per se that is the driver of low production schedule accuracy. Rather it is the capability of the site’s management to provide the production department with an adequate level of stability
top-10 n=10
advanced n=217
offshore n=18
domestic n=19
96.2% 85.3% 92.2% 81.9%

Operational Performance Comparison Production freeze period [days]*
29
A means to create planning stability is the introduction of a production freeze. The comparison shows that it is only the top-10 sites which positively set themselves apart from the other samples providing their customers with significantly higher production flexibility. Though a shorter production freeze period is less prone to external shocks and thus lowers the probability of disruptions it requires a tightly controlled supply chain as it does not allow long delivery times for supplies. Thus, the accuracy of the production schedule is not directly influenced by the length of the freezing period but rather by how the site adheres to it
top-10 n=10
advanced n=217
offshore n=18
domestic n=19
13.9 21.9 26.9 21.3
*Freezing period is the ‘frozen’ time within the production schedule in which the production department does not allow any changes in order to maintain a stable and balanced production system
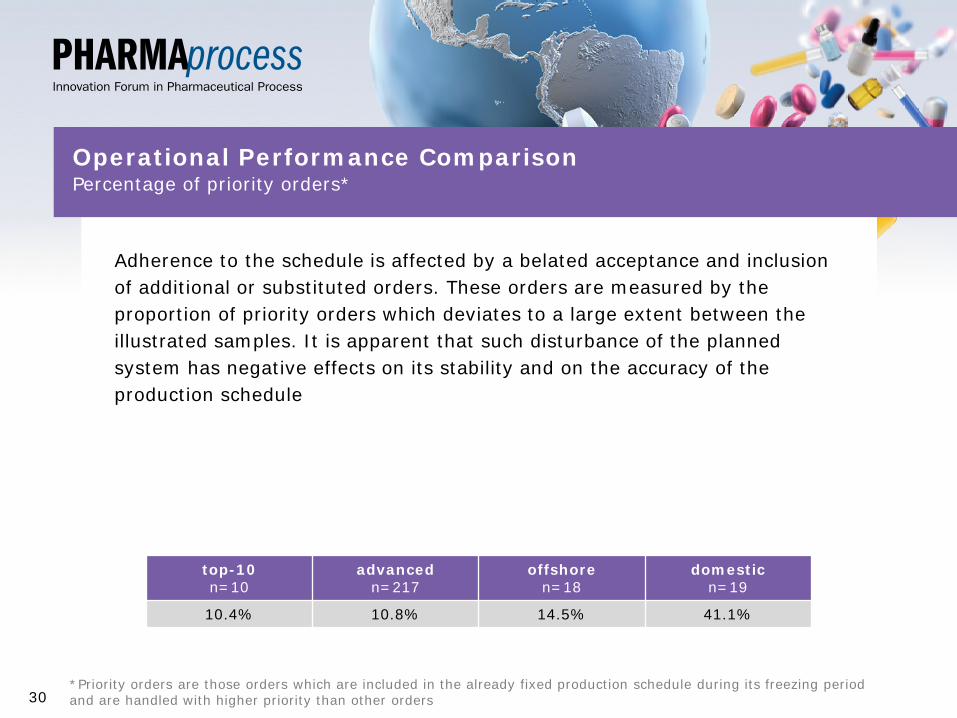
Operational Performance Comparison Percentage of priority orders*
30
Adherence to the schedule is affected by a belated acceptance and inclusion of additional or substituted orders. These orders are measured by the proportion of priority orders which deviates to a large extent between the illustrated samples. It is apparent that such disturbance of the planned system has negative effects on its stability and on the accuracy of the production schedule
top-10 n=10
advanced n=217
offshore n=18
domestic n=19
10.4% 10.8% 14.5% 41.1%
*Priority orders are those orders which are included in the already fixed production schedule during its freezing period and are handled with higher priority than other orders

The availability of equipment that is dedicated to a single product alleviates scheduling of manufacturing machinery. Less changeovers and higher planning flexibility also affect the accuracy of the production schedule in a positive way. Domestic sites have the lowest percentage of dedicated equipment among the samples. On the one hand this might stem from fewer resources of these sites that do not allow investments in a broad machine portfolio. On the other hand the manufacturers’ product portfolio in emerging markets is less characterized by high volume and therefore does less justify equipment solely dedicated to one product
top-10 n=10
advanced n=217
offshore n=18
domestic n=19
Formulation 46.7% 24.8% 24.3% 10.9%
Packaging 54.3% 22.1% 29.9% 5.9%
Operational Performance Comparison Percentage of dedicated equipment
31

On average, domestic pharmaceutical manufacturers in emerging markets have longer production lead times than offshore sites of multinational organizations or sites in advanced economies. The comparatively low production lead time of the top-10 sites is seen as an indicator for their efforts in implementing Operational Excellence at their sites. On the contrary, domestic sites have the samples’ shortest lead time for quality tasks like validations, batch review, and final release. This result should be viewed with caution, since the benchmarking doesn’t provide any information about the underlying workload and procedures
Operational Performance Comparison Production lead time [days]
32
top-10 n=10
advanced n=217
offshore n=18
domestic n=19
Manufacturing 6.3 11.2 7.6 16.5
QA/QC 10.7 20.5 18.0 7.5

The comparison of the manufacturing sites’ process stability exhibits that sites in advanced economies have a better control of their processes than pharmaceutical organizations in emerging markets. Interestingly, this applies whether the site belongs to a Western based multinational company or is a domestic emerging market company. Such low process stability and deviating product quality is seen as a root cause for occasionally poor drug quality. Moreover, it is apparent that the top-10 sites not only have less deviations per batch, but they also need less time to close such deviations. Since there is no value added this constitutes a large potential for waste reduction at pharmaceutical manufacturing sites
Operational Performance Comparison Deviations per batch and deviation closure time [days]
33
top-10 n=10
advanced n=217
offshore n=18
domestic n=19
Deviations per batch 0.12 0.16 0.33 0.29
Deviation closure time 13.4 26.6 29.3 22.4

The highest service level is demonstrated by emerging market offshore sites whereas domestic sites display the lowest level. Since both samples’ sites operate in a similar environment such difference can hardly be reduced to poor infrastructure like road conditions. Rather, the KPI covers the dimensions time, quantity and quality (on time in full; OTIF) and thus provides room for improvement in regards to the previously mentioned quality deviations
Operational Performance Comparison Service level (delivery)
34
top-10 n=10
advanced n=217
offshore n=18
domestic n=19
90.1% 91.7% 94.7% 87.6%

The level of functional integration – percentage of trained employees who can work on three or more functions – between domestic emerging market sites and multinational offshore sites deviates by more than 15%. Since a high level of functional integration is a result of education and training, this observation reveals that domestic sites are characterized by less purposeful training than their counterparts in and from advanced economies
Operational Performance Comparison Functional integration
35
top-10 n=10
advanced n=217
offshore n=18
domestic n=19
56.0% 45.0% 44.5% 29.5%

Operational Performance Comparison Interim conclusion
36
As the level of enabler implementation indicates the efforts a production site takes to improve its operations, the measurement of respective KPIs provides insights into the site’s operational performance
The comparison of selected KPIs provides mixed findings. Although the implementation level of Operational Excellence practices at domestic emerging market manufacturing sites affirms these sites perform a rather high level of Operational Excellence, such level is not sufficiently reflected in the discussed KPIs
These findings are in line with the on-site analyses which were conducted by UNIDO and the University of St.Gallen in Kenya and South Africa. The next section provides a brief overview about these OPEX missions which helps to understand the final conclusion of this comparison

Agenda
37
Introduction to the University of St.Gallen 1
Comparison between Western and Emerging Plants 3
Conclusion of the Comparison 4
Overview of 2016 Activities 5
2 Introduction to St.Gallen’s Work on Operational Excellence

UNIDO & St.Gallen Missions in Kenya and South Africa Next planned OPEX mission in South Africa on November 9th – 18th
38
Objective In a joint project with the United Nations Industrial Development Organization (UNIDO), assessment of the applicability and acceptance of the St.Gallen Operational Excellence (OPEX) model and benchmarking at selected pharmaceutical manufacturers in South Africa
Approach 10 days’ stay in
South Africa (November 2015)
Several site visits to combine a qualitative on-site perspective to the benchmarking data
Conference on Operational Excellence with local pharma leaders in South Africa
Deliverables Introduction of
OPEX to site, production, and quality managers
OPEX assessment and establishment of a South African data sample
OPEX Reports (backed-up with impressions from site visits) for participating manufacturing sites
Next steps Discussion
between UNIDO and the South African Department of Trade & Industry (DIT) to assess the engagement regarding a possible intervention
Identification of companies that might be interested
Discussion and development of collaborations with local universities and knowledge centers in South Africa

UNIDO & St.Gallen Missions in Kenya and South Africa Impressions
39

Barriers to Overcome for Emerging Plants Existing external and internal barriers in emerging markets
40
Building on a literature review, the benchmarking results, and the on-site analyses in Kenya and South Africa the following barriers were identified, which hamper the further development towards Excellence
External barriers Internal barriers
Poor education of employees Mere focus on lean tools
Government involvement Missing link to business strategy
Rigid sociocultural system Poor quality practices
Weak supplier performance Poor inventory management
Lack of resources
Poor employee training
Lacking understanding of lean
Short-term thinking
Management behavior
Working attitude
Staff turnover rate

Conclusion of the Comparison Discrepancy between OPEX enabler implementation and performance
41
The comparison results pose a certain discrepancy between the enabler implementation of Operational Excellence practices and the actual site performance assessed by selected KPIs
On the one hand the indications denote a scarce understanding of Operational Excellence or at least a lack of a decent benchmark for comparing the own site’s capabilities as a learning opportunity. Such a possibility of comparison would contribute to a better reflection of own achievements and shortcomings of practice implementations
On the other hand the comparison of KPIs showed values which are either on the top level of the top-10 manufacturing sites, or far below an industry average. Combined, the divergence of KPIs raises questions that cannot be answered by merely analyzing survey data

Conclusion of the Comparison Need for a clear guidance on how to holistically implement OPEX initiatives
42
In summary, the visited companies in particular, and other domestic pharmaceutical manufacturing sites in emerging markets in general – regardless their status quo and progress within the implementation of selected OPEX concepts – might lack a customized and tailored process as to how to transform their operations towards OPEX
Emerging markets must not only be distinguished from advanced markets, but different characteristics of these markets also necessitate an individual differentiation of emerging markets from each other
There are companies that assume emerging markets to function similarly to advanced markets but lagging behind in their development. Some of these companies hold a view that (managerial) concepts that work at home, will also equally work abroad

Agenda
43
Introduction to the University of St.Gallen 1
Comparison between Western and Emerging Plants 3
Conclusion of the Comparison 4
Overview of 2016 Activities 5
2 Introduction to St.Gallen’s Work on Operational Excellence

St.Gallen OPEX Roadshow 2016 Exchange platform with presentations and workshop sessions on OPEX
44
Locations
Dublin (Ireland) February 9th
Peking (China) May (t.b.d.)
Peapack-Gladstone, June (t.b.d.) New Jersey (U.S.)
Barcelona (Spain) t.b.d.
Zurich (Switzerland) September (t.b.d.)
Find more information and sign up on: http://opexbenchmarking.com/opex-roadshow-2016/index.php
Agenda

St.Gallen OPEX Research Group 2016 Mode of operations
45
Get to know one another
Identification of current challenges and possible research questions as well as definition of exchange topics
Get insights in the current research of St.Gallen University
Location: Zurich Airport
Presentation of first research outcomes, discussions and adaptions
Exchange on defined exchange topics
Site tour Location: At site of
one of the participants
Presentation of research outcomes, discussions and adaptions
Exchange on defined exchange topics
Site tour Location: At site of
one of the participants
Presentation & discussion of research outcomes
Derivation of consequences for participating companies
Exchange of “good practices” in the participating companies
Site tour Location: At site of
one of the participants
First Meeting Intermediate
Meeting I (after 3 months)
Intermediate Meeting II
(after 6 months)
Final Meeting (after 9 months)
In 2015, the OPEX Research Group comprises 8 companies: Bayer, Boehringer Ingelheim, Genentech/Roche, Pfizer,
Sandoz, Sanofi, Shire, and Takeda

St.Gallen OPEX Research Group 2016 Member benefits
46
Terms and conditions of participation: Project duration: 10 months (1-3 people of your company)
Participation fee: USD 15.000 excl. travel expenses
Professionally hosted and coordinated platform for exchange, networking, and research on Operational Excellence
Preparation, moderation, and documentation of meetings by ITEM-HSG
Mix of discussions, presentations, workshops, and site tour’s organized at the sites of the participating companies
Definition of research fields and access to latest research results from the University of St.Gallen
Possibility to benchmark and learn OPEX practices against leading organizations and enlarge the network with industry leaders

St.Gallen OPEX Books Combination of theoretical knowledge and practical examples on OPEX
47
The Pathway to Operational Excellence in the Pharmaceutical Industry
The follow-up to our first OPEX Book is bringing together academia's research and companies' experiences in one book
Leading company representatives describe and explain their OPEX programs in-depth, discuss successful practices, and challenges (e.g. Pfizer, Wyeth, etc.)
Leading Pharmaceutical Operational Excellence
This book presents such leading practices for managing OPEX throughout the pharmaceutical industry. Based on the St.Gallen OPEX Model we describe the current status of OPEX and the future challenges that have to be dealt with. The ample theoretical background is complemented hand-in-hand by case studies contributed by authors from leading pharmaceutical companies like Pfizer, Novartis, Abbott, Amgen, etc.
Operational Excellence in the Pharmaceutical Industry
Detailed overview of the result of the first OPEX Benchmarking conducted by the University of St.Gallen
Shows the different key issues of setting up an improvement program for operational excellence as well as the status of pharmaceutical production with regard to lean thinking

48
Thank you very much for your attention! Q&A

University of St.Gallen Institute of Technology Management Nicolas Ponce Research Associate [email protected] +41 (0) 71 224 72 69 Prof. Dr. Thomas Friedli Director [email protected]
Contact:
49