comparing union and nonunion staff perceptions of the
TRANSCRIPT

Research in Higher Education, Vol. 38, No. 1, 1997
COMPARING UNION AND NONUNIONSTAFF PERCEPTIONS OF THE HIGHEREDUCATION WORK ENVIRONMENT
Jim Vander Putten, Michael K. McLendon, andMarvin W. Peterson
Evidence of substantial growth in unionization among university noninstructional staffover the past 20 years (Hurd and Woodhead, 1987) and the emergence of a qualitymovement in higher education linking employee attitudes toward the work environ-ment with increased productivity point to the need for additional research into unionand nonunion staff perceptions of the work environment. This paper describes aconceptually oriented, exploratory study of the university work environment as per-ceived and defined by union and nonunion noninstructional staff.
Public-sector union participation expanded rapidly between 1960 and 1976(Edwards, 1989), but was followed by 20 years of little growth. In 1994, theBureau of Labor Statistics (U.S. Department of Labor, 1994) estimated thatapproximately 16.7 million wage and salary employees, 15.5% of total U.S.employment, were union members. Of this total, 7.1 million worked in federal,state, and local government, where they constituted 38.7% of employment. Inaddition, another 1 million public-sector workers were represented at theirworkplace by a union, though these workers are not union members themselves.
While blue-collar employees in higher education have been organized fordecades (Becker, 1990), in recent years union activity has spread to othergroups of workers including clerical and technical employees. In 1983, clericaland technical employees at Yale University, Adelphi University, and the Uni-versity of Cincinnati, as well as clerical workers in universities throughout Iowa
Contributed Paper for the 36th Annual Forum, The Association for Institutional Research, Albu-querque, NM, May 8,1996.
Jim Vander Putten, Michael K. McLendon, and Marvin W. Peterson, Center for the Study ofHigher and Postsecondary Education, University of Michigan, Ann Arbor Address correspondenceto: Jim Vander Putten, 2117 School of Education Building, 610 E. University, Ann Arbor, MI48109-1259.
131
0361-0365/97/0200-0131$12.iO/0 O 1997 Human Sciences Press, Inc.

and the University of California system became union-affiliated. In 1988, labtechnicians and clerical and medical school employees voted to organize atHarvard University. Indeed, one estimate has identified 40% of the clericalworkforce in public institutions and 25% of the clerical workforce at privateinstitutions as union affiliated (Becker, 1990).
Smith and Hopkins (1979) analyzed the nature of labor unions and identifiedthat they are often organized to address shortcomings in the work setting. Fur-thermore, once an employee joins a union, the prominence and importance ofthese shortcomings may exacerbate the employee's perceptions of the workenvironment (Johnson and Johnson, 1995). The basic premise of this study isthat a problem-focused approach to viewing the work environment may influ-ence noninstructional staff perceptions of that environment, and foster differ-ences in perceptions between union and nonunion staff. As a result, the purposeof this paper is to explore union and nonunion noninstructional staff perceptionsof the higher education work environment.
LITERATURE
Three bodies of literature provide background and context for this study: (a)the concept of "work environment," particularly as it applies to the higher edu-cation context; (b) the work environment of noninstructional staff in highereducation; and, (c) the effects of union membership or affiliation on perceptionsof the work environment.
The Work Environment
The concept of a work environment is critical to understanding the variousinfluences on employee performance and improving the work environment.This concept also provides members with an understanding of the meaning oftheir organization and their internal work environment (Peterson et al., 1986;Peterson and Spencer, 1993), and can also provide a framework within whichan organization's employees make sense of the nonrational and informal aspectsof their institutional environment (Peterson and Spencer, 1993).
There are several ways to conceptualize an organization's work environment:(1) as objective patterns of behavior or working conditions; (2) as the perceivedpatterns of behavior and attitudes related to that environment; or (3) as theunderlying values and beliefs of the organization or its participants (Peterson etal., 1994). These conceptualizations of work environment can be understood ascomprising the organization's culture or climate.
Organizational culture has been defined as "the basic assumptions and beliefsthat are shared by the organization" (Schein, 1985) and as "being comprised ofshared values, beliefs, and principles" (Dennison, 1990). Observers of "culture"
132 VANDER PUTTEN, MCLENDON, AND PETERSON
in the higher education context have described it as the "organizational glue"that holds the institution together (Peterson and Spencer, 1993) and as "thecollective values held by members of the organization [which] derive [their]force from the traditions, processes, and goals held by those most intimatelyinvolved in the organization's working" (Chaffee and Tierney, 1988, p. 5). Inhigher education, these collective values are inherent in the institution's history,tradition, academic mission, governance processes, administrative methods, anddelivery processes (Austin, 1990; Chaffee and Tierney, 1988; Keller, 1983; Pe-terson and Spencer, 1993).
Studies of "climate" in higher education institutions have described it as the"current, common patterns of important dimensions of organizational life or itsmembers' perceptions of and attitudes toward them" (Peterson et al., 1986).Similarly, Schneider and Rentsch (1988) defined institutional climate as theorganizational policies, practices, and procedures that communicate the goalsthat are important to an organization and that create a sense of institutionalimperative. Finally, an important distinction between climate and culture hasbeen drawn by Peterson and Spencer (1993), who identified the former as refer-ring to organizational "atmosphere" and the latter to organizational "values."
Thus, organizational culture and climate, understood as comprising thebroader concept of a work environment, are said to exert powerful influenceson the ways in which organizational members perceive their work environment.
Noninstructional Staff and the Higher Education Work Environment
Although noninstructional staff have received little attention in the scholarlyliterature, several studies found important differences between administratorand faculty perceptions of their institutions (Austin and Gamson, 1983; Black-burn et al., 1989,1990; Bowen and Schuster, 1986; Peterson and White, 1992).In one multiple-institution study, Birnbaum (1987) used qualitative methods ofinquiry to study senior administrators and faculty at 32 institutions. Looking atone institution, Blackburn, Lawrence, Hart, and Dickman (1990) found thatadministrators and faculty at the same institution held different perceptions ofthe work environment. More recently, Blackburn and Lawrence (1995) studiedadministrative and faculty views of the workplace using national surveys, andconfirmed that these two groups "often judge the quality of the work environ-ment quite differently" (p. 241).
All of these studies, however, have focused on perceptions of the work envi-ronment among administrative staff. A recent study by Barrett, Vander Putten,Peterson, and Cameron (1995) content analyzed noninstructional staff com-ments regarding the higher education work environment, and identified sixbroad themes that emerged from the data: compensation issues, quality con-cerns, physical environment, general work environment, personal work experi-
UNION/NONUNION PERCEPTIONS 133

ence, and staff development opportunities. Of the 3,700 comments provided byrespondents in the study, the two most frequently mentioned content categorieswere personal work experience and general work environment.
Personal and organizational dimensions can significantly influence how indi-viduals perceive their work environment. Among the personal or individualcharacteristics that have been considered are gender, age, ethnicity, level ofeducation (including participation in professional development activities), andyears in their current position and at their institution (Asplund, 1988; Austinand Gamson, 1983; Jones and James, 1979). Organizational variables includethe structure of work, work processes, communication, and perceived leader-ship and support (Senge, 1990; Sherr, 1990; Deming, 1986). These can influ-ence and shape the ways in which individuals perceive their work environmentso that what one person may identify as being a positive factor in the workenvironment, another may interpret as a negative. These perceptions help toform individuals' perceptions of organizational culture and climate.
The Effects of Union Membership on the Work Environment
Although almost no research has been conducted that compares union andnonunion staff employees' perceptions of the higher education work environ-ment, two other bodies of literature help generate a set of hypotheses regardingpossible differences in the perceptions of the work environment among unionand nonunion noninstructional staff.
One area of research that may provide insights into the relationship betweenunion status and perceptions of the work environment can be found in thefaculty unionization/collective bargaining literature, especially those studiesfocusing on the individual- and organizational-level effects of faculty unioniza-tion. For example, Bimbaum (1980) suggested that because collective bargain-ing usually occurs under conflictive conditions, a unionized faculty environ-ment commonly leads to defensive behavior such as impaired communicationand the misrepresentation of individual motives, values, and emotions, whileGilmore (1981) reported a change from collegial to adversarial relationshipsbetween unionized faculty and administration. Baldridge (1978) argued thatunions themselves generate concentrated control, bureaucratic red tape, pro-cedural regularity, and procedural restrictions. Richardson and Mortimer (1978)found decreases in innovation at unionized colleges.
A second body of research has been conducted on union membership inbusiness and industry, and has addressed a variety of topics including the im-pact of union status on job satisfaction (Berger, Olson, and Boudreau, 1983;Gordon and DeNisi, 1995), work attitudes (Boothe and Lincoln, 1993), level ofcommitment to employer (Conlon and Gallagher, 1987), and level of attach-ment to union and productivity (Meador and Walters, 1994). In addition, re-search that compares union and nonunion employees has investigated attitudes
134 VANDER PUTTEN, MCLENDON, AND PETERSON

UNION/NONUNION PERCEPTIONS 135
toward union representation (Hills, 1985), work values among professional em-ployees (Hovekamp, 1994), the perceived role of unions (Keegan, 1987), andsupport for worker participation (Olson and Fenwick, 1986), among others.This literature helps inform an understanding of the possible effect of unionaffiliation on employees' perceptions of the work environment. Hovekamp(1994), for example, found no significant differences in the work values ofunion and nonunion professional librarians. However, in a survey of severalmajor industrial sectors, Sanchez and Juetten (1988) found differences betweenunion and nonunion members regarding satisfaction with salary issues.
Despite these well-developed bodies of literature, much has yet to be learnedabout union and nonunion staff members' perceptions of the higher educationwork environment. Evidence of substantial growth in unionization among uni-versity noninstructional staff over the past 20 years (Hurd and Woodhead,1987) and the emergence of a quality movement in higher education linkingemployee attitudes toward the work environment with increased productivitypoint to the need for additional research into this important area.
CONCEPTUAL FRAMEWORK
The preceding literature review has identified numerous possible influencesof staff members' perceptions of the work environment. Although the centralfocus of this study involves the relationship between union affiliation and staffperceptions of the work environment, other variables have also been included.The independent variables in this study, depicted in Figure 1, are (a) staff mem-
FIG. 1. Conceptual framework.

bers' "personal characteristics," including age, gender, race, education level,and (b) staff members' "organizational status," including functional area andunit tenure. The dependent variables in this study consist of ten unit, climate,philosophy, improvement, and outcomes measures that represent the constructof a Work Environment. This study examines the relative influence of these sixindependent variables and of union affiliation upon staff members' perceptionsof their work environment.
RESEARCH QUESTION
The literature on the effects of unionization on faculty and on business workenvironments suggests the following primary research question, which serves todirect this study: Do union and nonunion university noninstructional staff mem-bers have significantly different perceptions of the work environment?
METHODOLOGY
Data Source
This paper draws upon the results of a study of non-instructional staff mem-bers' work environment perceptions conducted during 1993-94. Informed byan extensive review of the total quality and continuous improvement literaturein business and in higher education, a survey instrument was designed to mea-sure noninstructional staff members' perceptions of their immediate work unit,with an emphasis on continuous quality improvement values, work processes,and practices.
Survey Instrument and Response Rates
The survey instrument consisted of 190 items representing 13 categories ofthe "quality work environment," and was administered to all permanent non-instructional staff members at a Midwestern research university. In addition,two open-ended questions were included in the survey to obtain respondents'perceptions of their work environment and the survey instrument itself. A totalof 4,891 questionnaires were processed for a usable response rate of 47.3%.Response rates by functional area—defined as seven organizational areas clus-tered by their primary functional purpose within the university—ranged from36.6% to 60%. Approximately 2,450 survey respondents answered the open-ended question regarding the work environment ("The Culture and Climate forQuality," 1994).
All union-affiliated noninstructional staff at this university belong to one offour university-classified job types: service/maintenance; police/security; nurs-ing; and operating engineers. Descriptive statistical analyses identified that 865,or 17.7%, of survey respondents are union-affiliated.
136 VANDER PUTTEN, MCLENDON, AND PETERSON

A factor analysis of the survey's thirteen conceptual categories resulted in 27factors. These factors were comprised of groups of items of similar content. Allquestionnaire items were included in the factor on which it had the highestloading if it was above .40. These factors were then converted to indices de-signed to measure the same construct. Reliability tests were then conducted oneach of the twenty-seven indices. Reliabilities for these indices range from .53to .96 ("The Culture and Climate for Quality," 1994).
Quantitative Methodology
The quantitative component of this study consisted of two processes, datareduction and data analysis. These two processes are considered as follows:
Data Reduction
To make data analysis more manageable and to make the data results moremeaningful, a data reduction process was performed. Out of the original set of27 indices resulting from the factor analysis discussed above, 10 were selectedto comprise this study's "work environment" construct. The 10 indices werechosen for the analysis on the basis of their high alpha reliabilities and theirconceptual distinctiveness from one another. Table 1 displays the 10 work envi-ronment indices including the number of survey items contained in each indexalong with respective indices' alpha reliabilities. Appendix 1 contains a descrip-tion of each of the 10 indices.
UNION/NONUNION PERCEPTIONS 137
TABLE 1. Reliability of Quality Environment Variable Indices
Quality Environment Indices
Culture Measures:Status QuoError PreventionContinuous Improvement
Philosophy Measure:Unit Philosophy
Climate Measures:Supportive Unit ClimateSupportive Work Processes
Outcome Measures:Overall PerformanceRate of ImprovementNo. of Errors and MistakesCost of Service
No. of Items
666
5
1513
4444
Alpha Reliability
.80
.70
.76
.81
.95
.94
.84
.90
.89
.87

At the core of this study is the relationship between union affiliation andnoninstructional staff members' perceptions of their work environment. Thisrelationship is studied relative to six other variables that may also influencestaff members' perceptions of the work environment: age, race, gender, educa-tional level, functional area, and tenure in unit. If a relationship exists betweenany one of the six independent variables and either the union/nonunion variableor the 10 dependent variables, then that one independent variable's influencemust be considered in the analysis. However, if no relationship is found to existbetween an independent variable and either the union/nonunion variable or the10 dependent variables, then the respective independent variable may be re-moved from further analysis. These considerations provide a logical sequenceof steps for the data analysis.
1. Relationship of personal characteristics and unit status to union affilia-tion: An analysis of the relationship of the four personal characteristic variablesand the two organizational status variables to union affiliation was conducted todetermine which, if any, of these independent variables should be considered infurther analyses. Because the independent variables consisted of nominal-scaleand ordinal-scale data, chi-square and t-tests were used. Results of these testsare presented in Table 2. There were significant differences between union andnonunion staff members on three of the four personal characteristic variables—gender, race, and education level—and on one of the two organizational statusvariables—functional area. All differences between union and non union staffmembers on these four independent variables were significant at the .001 level.
2. Relationship of personal characteristics to staff members' perceptions ofthe work environment: The second step of the analysis was to test the relation-ship between the personal characteristic variables and the ten dependent workenvironment variables. One-way analysis of variance and correlations wereused to test this relationship. The results of this analysis are presented in Table3. The relationship between the age and race variables and staff perceptions of
138
Quantitative Analysis Methodology
VANDER PUTTEN, MCLENDON, AND PETERSON
TABLE 2. Relationship of Organizational Status and Personal CharacteristicsVariables to Union Affiliation
Independent Variables
Organizational Status Variables:Functional AreaTenure in Unit
Personal Characteristic Variables:AgeGenderRace
Test of Significace
chi-squaret-test
t-testchi-squarechi-square
P
**
****

TABLE 3. Relationship of Personal Characteristics Variables to Quality Culture,Philosophy, Climate, and Outcome Indices
Work Environment Indices
Quality CultureStatus QuoError PreventionContinuous Improvement
Quality PhilosophyUnit Philosophy
Quality ClimateSupportive Unit ClimateSupportive Work Processes
Quality OutcomeOverall PerformanceRate of ImprovementNo. of Errors and MistakesCost of Services
Personal Characteristics Variables
Gender Race(ANOVA)
***
*
**
*
**
****
****
Age Education(Correlations)
****#*
**
****
**#*
a*
**
**
*
UNION/NONUNION PERCEPTIONS 139
*p < .05.**p < .001.
the work environment are striking. On nine of the 10 dependent variables, staffperceptions differed significantly according to age of the respondent. Similarly,staff perceptions of their work environment also differed significantly accordingto race of the respondent on seven of the 10 quality indices.
3. Relationship of unit status to staff members' perceptions of the work envi-ronment: The next step of the analysis was to test the relationship of the secondset of independent variables—consisting of the organizational status variables,functional area, and tenure in unit—to the 10 dependent work environmentperception variables. One-way analysis of variance and correlation was used totest this relationship. The results are displayed in Table 4. While little relation-ship was found between unit tenure and staff perceptions of the work environ-ment, functional area was found to have a significant relationship with nine ofthe ten dependent variables.
4. Relationship of union affiliation to staff perceptions of the work environ-ment, controlling for the influence of personal characteristic and unit statusvariables: The last step in the analysis was to simultaneously consider the influ-ence of the six independent variables and of union affiliation upon the 10dependent variables. A seven-way analysis of variance was used to test thisrelationship. The results are displayed in Table 5. When all seven of the inde-pendent variables were considered simultaneously, union affiliation was found

TABLE 4. Relationship of Organizational Status Variables to Quality Culture,Philosophy, Climate, and Outcome Indices
Work Environment Indices
Quality CultureStatus QuoError PreventionContinuous Improvement
Quality PhilosophyUnit Philosophy
Quality ClimateSupportive Unit ClimateSupportive Work Processes
Quality OutcomeOverall PerformanceRate of ImprovementNo. of Errors and MistakesCost of Services
Organizational Status Variables
Functional Area(ANOVA)
****
*
***
*****
Tenure in Unit(Correlations)
***
*
140 VANDER PUTTEN, MCLENDON, AND PETERSON
*p < .05.**p < .001.
to have a significant relationship with nine of the 10 dependent variables. Thatis, the relationship between union affiliation and staff perceptions of the workenvironment exists independent of other important possible sources of influencesuch as education level, race, age, gender, functional area, and tenure in unit. Ofparticular interest is the direction of the differences in responses by union andnonunion staff. Union-affiliated staff members perceive their work environmentmore negatively than do nonunion staff on eight of nine dependent measures forwhich significant differences between the two groups exist. Specifically, union-affiliated staff members perceive their unit philosophy, unit climate, and unitoutcomes more negatively than do their nonunion counterparts.
Content Analysis Methodology
Unlike quantitative analysis methods and research designs, few writers agreeon a precise procedure for data collection, analysis, and reporting of the resultsof qualitative research. Qualitative approaches to conducting research, includinginstitutional research (Fetterman, 1991), take a variety of forms: interpretive,systematic, theory-driven, holistic ethnography, cognitive anthropology, andphenomenological interviewing (Attinasi, 1990), among others. In addition,qualitative researchers have research design options that can be drawn from a

variety of disciplinary fields, including anthropology, psychology, social psy-chology, sociology, and education.
As a result, the process of data analysis is eclectic; no "one right way" exists(Tesch, 1990). It requires researchers to be open to possibilities, develop cate-gories, make comparisons and contrasts, and see alternative explanations for thefindings. External validity (generalizability of findings) is not the intent of qual-itative research, but rather the intent is to form a unique interpretation of events.However, some generalizability can be identified from the broad content cate-gories and themes that emerged from the content analysis when they are com-pared to the categories (dimensions) used in the fixed response section of thesurvey.
Creswell (1994) identified several important issues to consider when con-ducting qualitative research in general, and one in particular is relevant for theapproach to data analysis in this study. Creswell identified that qualitative re-searchers are interested in meaning: how people make sense of their lives, theirexperiences, and structures of their environment. As a reflection of this perspec-tive, the content analysis was conducted from the noninstructional staff mem-ber's point of view, and the context of their perceptions of the work environ-ment was used to identify categories that characterize the positive, negative,and neutral aspects of the work environment.
Data Analysis
Two researchers used Tesch's (1990) eight-step qualitative process to clustertopics and themes from the open-ended responses. They worked independentlyfor initial coding of the data, and then worked together to complete a secondreview of the data for data reduction and to facilitate a shift to a conceptuallyoriented approach to code the data, identify coding subcategories, and makesubcategory coding assignments. A third review was completed to reach con-sensus on coding assignments. A third researcher was available for assistance insolving coding differences.
RESULTS
While Barrett et al. (1995) identified six broad categories in their contentanalysis of the qualitative data, the "personal work experience" broad categoryis most relevant for this study because it focuses on individual respondents'immediate work unit. Using the "work environment" component of the concep-tual framework as a guide for identifying corresponding subcategories in thepersonal work experience qualitative data, four subcategories are similar to thevariables used in the quantitative analyses in Table 5.
One indication of salient qualitative perceptions of the work environment is
UNION/NONUNION PERCEPTIONS 141

TABLE 5. ANOVA: Relationship of Union Affiliation, Organizational Status andPersonal Characteristic Variables to Quality Culture, Philosophy, Climate, and
Outcome Indices
Work EnvironmentIndices
Quality CultureStatus QuoError PreventionContinuous Improve-ment
Quality PhilosophyUnit Philosophy
Quality ClimateSupportive UnitClimateSupportive WorkProcesses
Quality OutcomeOverall PerformanceRate of ImprovementNo. of Errors andMistakesCost of Services
Independent Variables
UnionAffil.
+ **_**
**
_**
_**
_***
_*
_*
Fund.Area
*****
*
**
*
***
*
Tenure
******
**
**
**
****
*
Educ.Level
*
**
*
*
*
****
*
Race
*
*
**
**
****
Age
******
**
**
**
***»
*
Gender
*
*
142 VANDER PUTTEN, MCLENDON, AND PETERSON
the frequency with which respondents make comments that cluster in specificsubcategories. The subcategory "supervisor has poor leadership skills" pos-sessed the largest number of comments (N = 159). Of those respondents whomade comments that fit this subcategory, 52.8% (N = 84) were union membersand 47.2% (N = 75) were nonunion members. To illustrate this subcategory,one female unionized staff member characterized her work environment this way:
The work staff in my unit is very dedicated and quality oriented. But, our morale isvery low because our management staff, in our view, consistently lacks in leadership& direction, and we feel we could even function in an improved way without them.The reason we function at all is in spite of the mgmt. staff.
Because the frequency of comments among union and nonunion staff are simi-lar in this subcategory, it is important to consider the views of nonunion staff aswell. One male nonunionized staff member described leadership in his work unit:
Mgmt. & leadership tends to be weak in my unit. Decisions are made "in crisis"because of inability to make decisions in planning process [sic].
*p < .05.**p < .001.

These comments provide insights into perceptions that were not directly mea-sured in the fixed-response portion of the survey: leadership in the work envi-ronment. In addition, the frequencies of comments indicate that noninstructionalstaff members who are members of unions, as well as those who are not, per-ceive the work environment similarly in regard to this issue.
The subcategory with the second highest frequency of comments (N = 107)is "coworkers are supportive/good to work with," and corresponds with thequantitative variable "supportive work processes." Of those respondents whomade comments fitting this subcategory, 50.5% (N = 54) were union membersand 49.5% (N = 53) were nonunion members. Identifying positive aspects ofher work environment, one female union staff member commented:
It is great—it is a very positive envt. As always a few changes could perhaps makeit better, but we as a whole unit get along fairly well and we do socialize during theyear and get to know one another better.
In the same respect, one male nonunion staff member wrote this:
Despite all difficulties, I am thankful for my job, I am blessed w/ good people inmy unit. Overall my experience has been very good. Staff also includes AFSCMEemployees.
Results from ANOVAs involving the quantitative variables "supportive workprocesses" and "union status" indicated significant differences in work environ-ment perceptions. However, the results of the qualitative analysis contradictsthis rinding and indicates that union and nonunion staff members perceive thework environment similarly in regard to supportive co-workers and the workprocess.
A second indicator of qualitatively identified work environment perceptionsfocuses on discrepancies in the frequencies of union and nonunion staff mem-bers' comments in a specific subcategory. One subcategory, "unit is not cohe-sive; teamwork does not exist," addresses another facet of the quantitative anal-ysis variable "supportive work processes" and showed the greatest difference infrequency of comments. Of the 34 respondents who made comments in thissubcategory, 64.7% (N = 22) were union staff members, and 35.3% (N = 12)were nonunion staff members. A female noninstructional staff member whobelongs to a union made this observation:
Work experience until recently has been pleasant—everyone really worked as ateam—now we feel disconnected—worked w/o supervision & constant criticism, nowtreated as peons, double-standard is the norm, morale is very low & can anticipatemany turnovers. I think office staff should be treated with the same dignity expectedby those in charge—with the economy the way it is, everyone needs their job but wetruly need more people-oriented in charge & then when people are fairly happyw/their work, watch them grow & go!
Also describing the changing nature of the work environment from positive tonegative over time, a male union staff member said:
UNION/NONUNION PERCEPTIONS 143

My first 4 1/2 yis. were very positive—our unit worked as a team and communicatedvery easily with each other. New mgmt. was brought in along with a complete turn-over of personnel and teamwork and communication ceased to exist.
While Smith and Hopkins (1979) identified that labor unions often addressshortcomings in the work setting, the influence of union membership on workenvironment perceptions expressed by union staff members is noticeably absentin comments fitting this subcategory.
The second subcategory that demonstrated a distinct discrepancy in frequen-cies of comments was "fear of change exists; status quo perpetuated." Thissubcategory clearly corresponds to the quantitative analysis variable "statusquo"; however, the pattern of mentions is opposite to that of the previous sub-category. Of the 27 comments in this subcategory, 59.3% (N = 16) were madeby nonunion staff members, as compared to 40.7% (N = 11) by union-affili-ated staff members. A male nonunion staff member summarized his perceptionsthis way:
Working for the U would be more enjoyable if there were less emphasis made onbureaucratic procedures. Too many decisions are based on "well, we've always done itthis way." Much of my unit's current efficiency improvements can be attributed toincreased use of computers and computer networks—has made a big difference formany people. Acknowledgment of this process with encouragement to become morecomputer literate would be even more helpful.
Another male nonunion staff member confirmed this idea:
I have worked in only one unit at the U for almost 15 years. It has been a stable,enjoyable (for the most part) environment. Many long-term committed individuals—slow to make changes.
Considering the emphasis that labor unions place on protecting existing num-bers of jobs in organizations where they are present, it is somewhat surprisingto note that nonunion respondents comprised the majority in this subcategory.In comparison to the quantitative results, these findings run counter to the quan-titative results, in which nonunion staff members were less likely to perceivetheir work environment as static and unchanging.
DISCUSSION
Edwards (1989) predicted that public sector union participation will continuealong a no-growth path in the future. A number of other factors not commonlycited in the literature may also exert influence on future levels of unionism.First, legislative changes at the state level granting public-sector employees theright to organize and bargain collectively or to strengthen existing bargaininglaws hold the potential of facilitating growth in the number of public-sectoremployees covered by collective bargaining agreements. Alternatively, the pri-vatization of higher education services as a strategy for cost reduction poses aclear threat to public sector unions. Regardless of whether actual employment
144 VANDER PUTTEN, MCLENDON, AND PETERSON

shifts from the public to the private sector, the power of public-sector unionsand their ability to attract new members will be reduced and competition fromthe private sector will place pressure on higher education administrators andpublic sector unions managers to control costs. Both of these forces suggest thatunionism among noninstructional staff will in the future continue to representan important dynamic for colleges and universities.
This study has identified some important implications of unionization for thehigher education work environment. Significant differences have been foundbetween union and nonunion noninstructional staff perceptions of the work en-vironment. The quantitative analysis found that union-affiliated staff membersperceive the culture, philosophy, climate, and outcomes of their work environ-ment more negatively than do nonunion staff. The qualitative analysis con-firmed this finding, with the exception of the perception of a status quo workenvironment, in which nonunion staff were more likely to hold this view.
Future research in the area of union/nonunion perceptions of the work envi-ronment should consider the benefits of using multiple-method research de-signs. Other qualitative research methods in addition to content analysis (e.g.,participant observation, ethnographic interviewing, document analysis) hold thepotential to yield important data when combined with a variety of quantitativemethods. As a result of using a multiple method approach, greater insights intoconceptual dimensions of the higher education work environment can begained, new theoretical models can be developed, and issues for future researchcan be identified. In addition, these insights can assist higher education admin-istrators to assess the work environment for administrative action and improve-ment to benefit all members of the higher education community.
Asplund, G. (1988). Women Managers: Changing Organizational Cultures. Chichester,GB: Wiley.
Attinasi, L. (1990, Fall-Winter). Phenomenological Interviewing in the Conduct of Insti-tutional Research: An Argument and an Illustration. AIR Professional File No. 38.Tallahassee, FL: The Association for Institutional Research.
Austin, A. (1990). Faculty cultures, faculty values. In W. Tierney (ed.), Assessing Aca-demic Climates and Cultures (pp. 61-74). San Francisco: Jossey-Bass.
Austin, A., and Gamson, Z. (1983). Academic Workplace: New Demands, HeightenedTensions. ASHE-ERIC Higher Education Research Report No. 10. Washington, DC:Association for the Study of Higher Education.
Baldridge, J. V. (1978). Policy Making and Effective Leadership: A National Study ofAcademic Management. San Francisco: Jossey-Bass.
Barrett, M., Vander Putten, J., Peterson, M, and Cameron, K. (1995). Perceptions ofNon-instructional Staff at the University of Michigan: A Content Analysis. ERIC Doc-ument Reproduction Service No. ED 387 016.
Becker, C. (1990, February 12). Lessons of the Harvard drive. The Nation, pp. 196-198.Berger, C, Olson, C., and Boudreau, J. (1983, December). Effects of unions on job
UNION/NONUNION PERCEPTIONS 145
REFERENCES

satisfaction: The role of work-related values and perceived rewards. OrganizationalBehavior and Human Performance 32: 289-324.
Birnbaum, R. (1980). Creative Academic Bargaining: Managing Conflict in the Union-ized College and University. New York: Teachers College, Columbia University.
Blackburn, R., and Lawrence, I. (1995). Faculty at Work; Motivation, Expectation, Satis-faction. Baltimore: Johns Hopkins University Press.
Blackburn, R., Lawrence, J., Hart, K., and Dickman, E. (1990). Same Institution, Differ-ent Perceptions: Faculty and Administrators Report on the Work Environment. AnnArbor: University of Michigan, NCRIPTAL.
Blackburn, R., Pitney, J., Lawrence, J., and Trautvetter, L. (1989). Administrators' careerbackgrounds and their congruence with faculty beliefs and behaviors. Paper presentedat the annual meeting of the American Educational Research Association, San Francisco.
Boothe, J., and Lincoln, J. (1993, Spring). Unions and work attitudes in the United Statesand Japan. Industrial Relations 32: 159-187.
Bowen, H., and Schuster, J. (1986). American Professors: A National Resource Imper-iled. New York: Oxford University Press.
Chaffee, E., and Tierney, W. (1988). Collegiate Culture and Leadership Strategies. NewYork: Macmillan.
Conlon, E., and Gallagher, D. (1987, March). Commitment to employer and union: Ef-fects of membership status. Academy of Management Journal 30: 151-162.
Creswell, J. (1994). Research Design: Qualitative and Quantitative Approaches. Thou-sand Oaks, CA: Sage.
Deming, W. (1986). Out of the Crisis. Cambridge, MA: MIT Center for Advanced Engi-neering Study.
Dennison, D. (1990). Corporate Culture and Organizational Effectiveness. New York:John Wiley & Sons.
Edwards, L., (1989). The future of public sector unions: Stagnation or growth? TheAmerican Economic Review 79(2): 161-165.
Fetterman, D. (1991). Using Qualitative Methods in Institutional Research. New Direc-tions for Institutional Research, No. 72. San Francisco: Jossey-Bass.
Gilmore, J. (1981). The impact of faculty collective bargaining on the management ofpublic higher educational institutions. Journal of Collective Negotiations in the PublicSector 10(2): 145-152.
Gordon, M., & DeNisi, A. (1995, January). A re-examination of the relationship betweenunion membership and job satisfaction. Industrial and Labor Relations Review 48:222-236.
Guthrie-Morse, J. (1981). Assessing the impact of faculty unions: The financial implica-tions of collective bargaining. Journal of Higher Education 52(3): 237-255.
Hills, S. (1985, January). The attitudes of union and nonunion male workers towardunion representation. Industrial and Labor Relations Review 38:179-194.
Hovekamp, T. (1994). Work values among professional employees in union and non-union research library institutions. Journal of Applied Social Psychology 24(11): 981-993.
Hurd, R., and Woodhead, G. (1987). The Unionization of Clerical Workers at Large U.S.Universities and Colleges. National Center for the Study of Collective Bargaining inHigher Education and the Professions.
Jackson, P., and Clark, R. (1987). Collective bargaining and faculty compensation: Fac-ulty as a new working class. Sociology of Education 60: 242-256.
Johnson, G., and Johnson, W. (1995). The effects of union membership on multiple workcommitments among female public sector employees. Journal of Psychology 129(2):181-191.
146 VANDER PUTTEN, MCLENOON, AND PETERSON

Jones, A., and James, L. (1979). Psychological climate: Dimensions and relationships ofindividual and aggregated work environment perceptions. Organizational Behaviorand Human Performance 23: 201-250.
Keegan, C. (1987, August). How union members and nomnembers view the role ofunions. Monthly Labor Review 110: 50-51.
Keller, G. (1983). Academic Strategy: The Management Revolution in American HigherEducation. Baltimore: Johns Hopkins Press.
Meador, M., and Walters, S. (1994, Fall). Unions and productivity: Evidence from aca-deme. Journal of Labor Research 15: 373-386.
Olson, J., and Fenwick, R. (1986, August). Support for worker participation: Attitudesamong union and non-union workers. American Sociological Review 51: 505-522.
Peterson, M., and Spencer, M. (1993). Qualitative and quantitative approaches to aca-demic culture: Do they tell us the same thing? In J. Smart (ed.), Higher Education:Handbook of Theory and Research, vol. 9 (pp. 344-388). New York: Agathon.
Peterson, M., and White, T. (1992). Faculty and administrator perceptions of their envi-ronments: Different views or different models of organization? Research in HigherEducation, 33(2): 177-204.
Peterson, M., Cameron, K., Jones, P., Mets, L., and Ettington, D. (1986). The Organiza-tional Context for Teaching and Learning: A Review of the Research Literature. AnnArbor: NCRIPTAL, University of Michigan.
Peterson, M., Cameron, K., Julia, J., Winn, B., Spencer, M., and Vander Putten, J. (1994,May). Assessing the culture and climate for quality improvement in the work environ-ment. Paper presented at the Association for Institutional Research Forum, New Or-leans, LA.
Richardson, R., and Mortimer, K. (1978). Collective bargaining and the redefinition ofadministrative roles. Educational Record 59(4): 332-344.
Sanchez, P., and Juetten, S. (1988). What do employees think about their compensation?Journal of Compensation and Benefits 4(3): 164-175.
Schein, E. (1985). Organizational Culture and Leadership: A Dynamic View. San Fran-cisco: Jossey-Bass.
Schneider, B., and Rentsch, J. (1988). Managing climates and cultures. In J. Hage (ed.),Futures of Organizations: Innovating to Adapt Strategy and Human Resources toTechnological Change (pp. 181-200). Lexington, MA: Heath.
Senge, P. (1990). The Fifth Discipline: The Art & Practice of the Learning Organization.New York: Doubleday/Currency.
Sherr, L. (1990). Is there a better way to manage higher education? In T. Karolewski(ed.), Higher Education and the Future: Initiatives for Institutional Research. Tal-lahassee, FL: The Association for Institutional Research.
Smith, R., and Hopkins, A. (1979). Public employee attitudes toward unions. Industrialand Labor Relations Review 32(4): 484-495.
Tesch, R. (1990). Qualitative Research: Analysis Types and Software Tools. New York:Falmer.
U.S. Department of Labor (1994). Handbook of Labor Statistics. Washington, D.C.: Bu-reau of Labor Statistics.
UNION/NONUNION PERCEPTIONS 147
APPENDIX 1. Description of Quality Culture, Climate, Philosophy,and Outcome Indices
Quality Culture
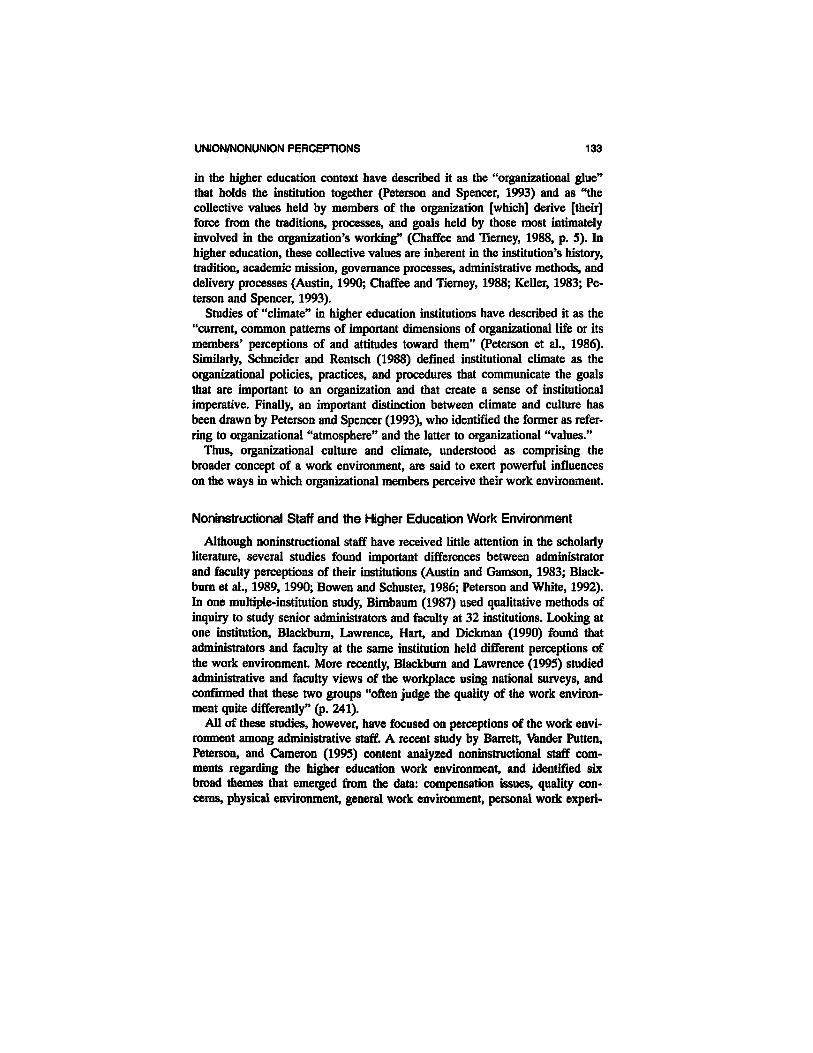
Status Quo: six items related to staff members' perceptions that therehave been no changes in the unit improvement orientation; status quoincludes staff members' perception that unit leadership has done noth-ing to enhance quality improvement, quality is not measured, there isno attempt to provide quality training, little thought is given to thoseserved, no teams exist, and that approach to costs is the same as al-ways.Error Prevention: six items related to staff members' perception thatthere have been ongoing changes in the unit improvement orientation;this index focuses on the prevention of errors and mistakes; includesstaff perceptions that leaders try to prevent mistakes, errors, and budgetinefficiencies, team formation is actively encouraged, and attempts aremade to exceed the expectations of those we serve.Continuous Improvement: six items related to staff members' percep-tion that there have been constant efforts to address unit improvementorientation; this index focuses on the units' continuous striving for im-provement; continuous improvement includes staff perceptions thatleaders are continuously raising performance standards, expectations ofthose served are exceeded, costs are reduced without any effect to ser-vice provided, and almost all staff members work in teams.
Quality PhilosophyUnit Philosophy: five items related to the way staff members in a par-ticular unit fundamentally feel about quality improvement in their workenvironment; quality philosophy includes staff members' perceptions oftheir mission and purpose, willingness to change and improve, propen-sity to interact and share success stories, priorities relating to quality,and concerns for quality.
Quality ClimateSupportive Unit Climate: fifteen items that relate to the general atmo-sphere or mood within the work unit; unit climate focuses on how em-ployees feel about their daily interactions with coworkers, leaders, andthe work itself; it also refers to the sense of cooperation, teamwork,trust, enjoyment and the feeling of being valued, accepted, and soughtafter for input into decision making.Supportive Work Processes: thirteen items related to the key elementsof improving the quality and design of basic day-to-day work pro-cesses; this index includes understanding and improving processeswhich are both problematic and problem-free; it focuses on process as-sessment, reduced work cycle time, efficiency, and effectiveness; it alsoexamines the scope and effectiveness of process improvement.
Reliability
.80
.77
.76
.81
.95
.94
148 VANDER PUTTEN. MCLENOON, AND PETERSON
APPENDIX 1. Continued
Quality Culture
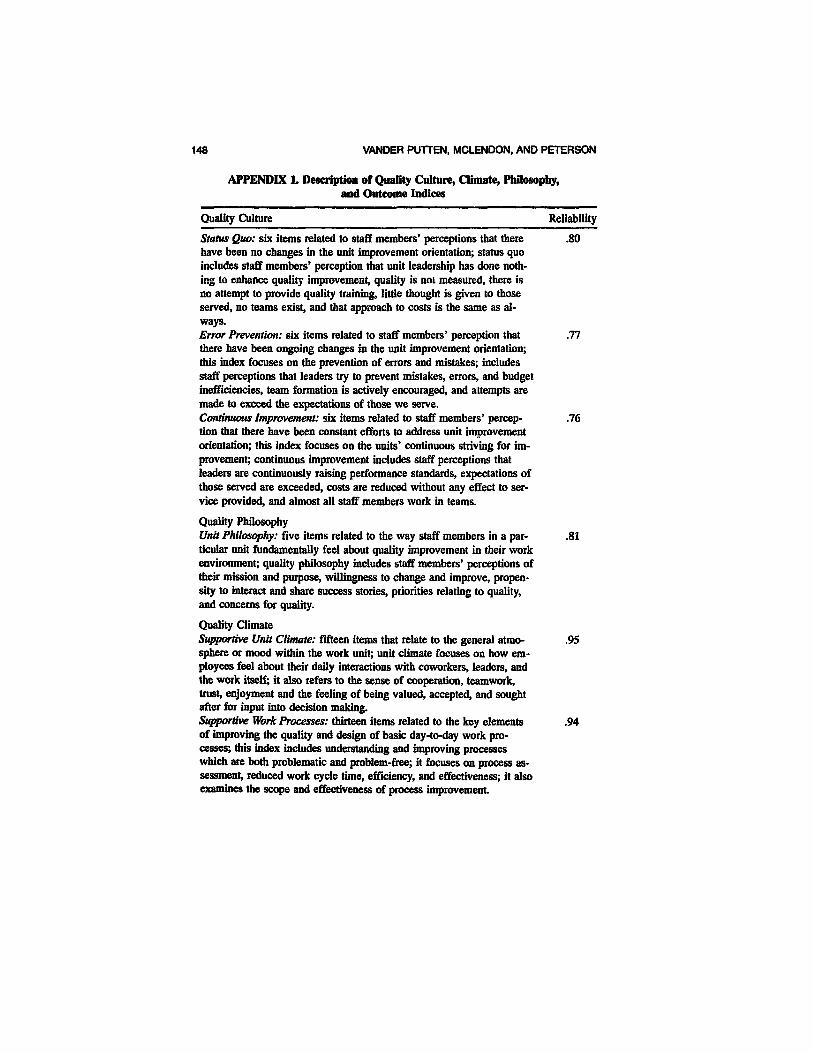
Quality OutcomesOverall Unit Performance: four items related to the overall level ofperformance when compared to similar unit, expectations of thoseserved, unit goals, and last year's performance at the same time.Rate of Improvement: four items related to the rate of improvementwhen compared to similar unit, expectations of those served, unit goals,and last year's performance at the same time.Number of Errors and Mistakes: four items related to the number oferrors and mistakes when compared to similar unit, expectations ofthose served, unit goals, and last year's performance at the same time.Cost of Services: four items related to the cost of services when com-pared to similar unit, expectations of those served, unit goals, and lastyear's performance at the same time.
Reliability
.84
.90
.89
.87
UNION/NONUNION PERCEPTIONS 149