comparing performance of universal health care countries, 2021
TRANSCRIPT

2021
Mackenzie Moir and Bacchus Barua
Comparing Performance of Universal Health Care Countries, 2021


2021 • Fraser Institute
Comparing Performance of Universal Health Care
Countries, 2021by Mackenzie Moir and Bacchus Barua

Contents
Executive Summary / i
Introduction / 1
1. Method / 2
2. How much does Canada spend on health care compared to other countries? / 8
3. How well does Canada’s health-care system perform? / 11
4 Health status and outcomes / 33
Conclusion / 39
Appendix—additional tables and data / 41
References / 50
About the Authors / 56
Acknowledgments / 57
About the Fraser Institute / 57
Publishing Information / 58
Purpose, Funding, and Independence / 59
Editorial Advisory Board / 60
Comparing Performance of Universal Health Care Countries, 2021 • Moir and Barua • i
fraserinstitute.org
Executive Summary
Comparing the performance of different countries’ health-care systems provides an opportunity for policy makers and the general public to determine how well Canada’s health-care system is performing relative to its international peers. Overall, the data examined suggest that, although Canada’s is among the most expensive universal-access health-care systems in the OECD, its performance is modest to poor.
This study uses a “value for money approach” to compare the cost and performance of 28 universal health-care systems in high-income countries. The level of health-care expenditure is measured using two indicators, while the performance of each country’s health-care system is measured using 40 indi-cators, representing the four broad categories:
1. availability of resources2. use of resources3. access to resources4. quality and clinical performance.
Five measures of the overall health status of the population are also included. However, these indicators can be influenced to a large degree by non-medical determinants of health that lie outside the purview of a country’s health-care system and policies.
Expenditure on health careCanada spends more on health care than the majority of high-income OECD countries with universal health-care systems. After adjustment for “age”, the percentage of the population over 65, it ranks second highest for expendi-ture on health care as a percentage of GDP and eighth highest for health-care expenditure per capita.
Availability of resourcesThe availability of medical resources is perhaps one of the most basic require-ments for a properly functioning health-care system. Data suggests that Canada has substantially fewer human and capital medical resources than many peer jurisdictions that spend comparable amounts of money on health care. After adjustment for age, it has significantly fewer physicians, acute-care beds, and psychiatric beds per capita compared to the average of OECD countries included in the study. It ranks close to the average for nurses and ranked eighth for the

ii • Comparing Performance of Universal Health Care Countries, 2021 • Moir and Barua
fraserinstitute.org
number of long-term care beds (per 1,000 over the age of 65). While Canada has the third most Gamma cameras (per million population, age-adjusted), it has fewer other medical technologies than the average high-income OECD country with universal health care for which comparable inventory data are available.
Use of resourcesMedical resources are of little use if their services are not being consumed by those with health-care demands. Data suggests that Canada’s performance is mixed in terms of use of resources, performing at higher rates than the average OECD country on under half the indicators examined (for example, cataract surgery and knee replacement), and average to lower rates on the rest. Canada reports the least degree of hospital activity (as measured by rates for curative-care discharges) in the group of countries studied.
Access to resourcesWhile both the level of medical resources available and their use can provide insight into accessibility, it is also beneficial to measure accessibility more dir-ectly by examining measures of timeliness of care and cost-related barriers to access. Canada ranked last (or close to last) on four of four indicators of time-liness of care; and ranked seventh (out of ten) on the indicator measuring the percentage of patients who reported that cost was a barrier to access.
Quality and clinical performanceWhen assessing indicators of availability of, access to, and use of resources, it is of critical importance to include some measure of quality and clinical per-formance in the areas of primary care, acute care, mental health care, cancer care, and patient safety. While Canada does well on five indicators of clinical performance and quality (such as rates of survival for breast, colon, and rectal cancers), its performance on the seven others examined in this study are either no different from the average or in some cases—particularly obstetric traumas and diabetes-related amputations—worse.
The data examined in this report suggest that there is an imbalance between the value Canadians receive and the relatively high amount of money they spend on their health-care system. Although Canada ranks among the most expensive universal-access health-care systems in the OECD, its performance for availability and access to resources is generally below that of the average OECD country, while its performance for use of resources and quality and clinical performance is mixed.

Comparing Performance of Universal Health Care Countries, 2021 • Moir and Barua • 1
fraserinstitute.org
Introduction
Measuring and reporting the performance of health-care systems is vital for ensuring accountability and transparency, and is valuable for identifying areas for improvement. Comparing the performance of different countries’ health-care systems provides an opportunity for policy makers and the general public to determine how well Canada’s health-care system is performing relative to its international counterparts.
This is the sixth edition of Comparing Performance of Universal Health Care Countries. The original report was the work of Barua, Timmermans, Nason, and Esmail (2016), who followed the examples of Esmail and Walker (2008), Rovere and Skinner (2012), and Barua (2013) to examine the performance of health-care systems using a “value for money” approach. That is, the perform-ances of various health-care systems are assessed using indicators measuring:
1. the expenditure on health care (the cost); and 2. the provision of health care (the value).
The cost of health care is measured using two indicators, while the provision of health care is measured using 40 indicators, representing four broad categories:
1. availability of resources;2. use of resources;3. access to resources; 4. clinical performance and quality.
Five indicators measuring the overall health status of the population are also included. The intention is to provide Canadians with a better understanding of how much they spend on health care in comparison to other countries with universal health-care systems, and assess whether the availability, use, access, and quality of their system is of commensurate value.
The first section of this paper provides an overview of the methodology used and then explains what is being measured and how. The second section presents data reflecting how much Canada spends on health care in compari-son with other countries. The third section presents data reflecting the per-formance of Canada’s health-care system (compared to other countries) as measured by the availability of resources, use of resources, access to resources, and clinical performance and quality. The fourth section examines indicators reflecting the overall health status of the populations in the countries exam-ined. A conclusion follows.

2 • Comparing Performance of Universal Health Care Countries, 2021 • Moir and Barua
fraserinstitute.org
1. Method
What is measured, and why?The objective of this report is to provide an overview of the amount different countries spend on their respective health-care systems, and to concurrently measure (using several indicators) the value they receive for that expendi-ture. When measuring the quality of health care in Canada, the Canadian Institute of Health Information (CIHI) identifies two distinct questions: “How healthy are Canadians?”; and “How healthy is the Canadian health system?” (CIHI, 2011b: ix).
The answer to the first question—How healthy are Canadians?—can be informed through the examination of indicators of health status. While such indicators are included in section four of this paper, the information they provide must be interpreted with caution when assessing the performance of the health-care system. This is because the health status of a population is determined by a number of factors, some of which (like timely access to qual-ity medical care) may fall under the purview of a health-care system, while others (like smoking rates, environmental quality, genetic factors, and lifestyle choices) may not.
In this study, we are more concerned with the second question—“How healthy is the Canadian health system?”—as measured by indicators reflecting the availability of resources, use of resources, access to resources, and clinical performance and quality. [1] The interaction between these various compon-ents can be seen in figure 1. This study focuses primarily on area 2 of the figure, includes indicators reflecting area 3 for reference (as it is partly affected by area 2), but excludes area 1. While indicators measuring the cost and perform-ance of the health-care system as a result of government policy are included in this paper, government health-care policy itself is neither examined nor assessed. [2]
What indicators are included?The level of health-care expenditure is measured using two indicators, while the performance of each country’s health-care system is measured using 40 indi-cators, representing the four broad categories of: [1] availability of resources;
[1] For a broader explanation of the framework of analysis used in this report, see Barua, 2013.[2] For example, unlike Esmail and Walker (2008) this report does not present data on how each country’s universal health-insurance system is structured, whether they employ user-fees and co-payments, how hospitals and doctors are paid, and so on.

Comparing Performance of Universal Health Care Countries, 2021 • Moir and Barua • 3
fraserinstitute.org
[2] use of resources; [3] access to resources; and [4] clinical performance and quality. In addition, five indicators measuring health status are also included; however, as mentioned above, the authors recognize that these may be affected by factors outside the purview of, and the amount of money spent on, the health-care system in question.
All the indicators used in this report are either publicly available, or derived from publicly available data from the Organisation for Economic Co-operation and Development (OECD), the Commonwealth Fund, and the World Health Organization (WHO). The choice of indicators included are primarily based on those presented in Esmail and Walker (2008) and Rovere and Skinner (2012), and are categorized using the framework presented in Barua (2013).
In addition, since the publication of the above reports, several new indi-cators have become available from the OECD, Commonwealth Fund, and WHO. Barua and colleagues examined these indicators and included those that either provide new information, or add more nuanced detail, within the previously identified area of concern (Barua, Timmermans, Nason, and Esmail, 2016). [3]
[3] Five indicators used in the first two editions of this report (Barua, Timmermans, Nason, and Esmail, 2016; Barua, Hasan, and Timmermans, 2017) are no longer available from the OECD: 1. the number of digital subtraction angiography units; 2. the number of lithotrip-ters; 3. the number of kidney transplants performed; and 4. the five-year relative survival for colorectal cancer. This indicator was replaced by two indicators: the five-year net survival for colon cancer and the five-year net survival for rectal cancer, both of which are included in the current edition of the report. Also no longer available from the OECD is waiting time of more than four weeks for getting an appointment with a specialist. Another difference from the first two editions is that all indicators of cancer survival are now reported, by the OECD, as net survival rather than relative survival.
Figure 1: Framework for analysis of health care
[1] Non-medical determinents
of health
Government health-care policy
Health-care system Health-care expenditure • availability of resources • use of resources • access to resources • quality and clinical performance
[3] Health status
Adapted from OECD, 2015; Barua, 2013.
[2]

4 • Comparing Performance of Universal Health Care Countries, 2021 • Moir and Barua
fraserinstitute.org
In last year’s edition of the report, we added three new indicators: [1] Long-Term Care Beds (per thousand population, aged 65 and older); [2] rates of Post-Operative Wound Dehiscence; and [3] rates of Post-Operative Sepsis after Abdominal Surgery (per hundred thousand hospital discharges, 15 years and over). Of these, the rates of Post-Operative Wound Dehiscence and Post-Operative Sepsis after Abdominal surgery were removed as data are no longer readily available from the OECD. The previous indicator measuring hospital discharges has been replaced by curative-care discharges in order to improve comparability, while the indicator measuring Mortality Amenable to Health Care (calculated by previous authors) is now replaced by the OECD’s new indicator measuring Treatable Mortality. A complete list of the indicators used in this report, organized according to the categories mentioned above, is pre-sented in table 1. While the selection of indicators included in this report is not comprehensive, they are meant to provide readers with a broad overview of the performance of each country’s health-care system.
What is the time-frame?Data from the OECD are for 2019, or the most recent year available. Data from the WHO for Healthy Life Expectancy (HALE) are for 2019. While newer data are available for certain countries, the authors have chosen to use the year that provides the most complete and comparable data for this edition of the report.[4] However, the authors have chosen to include data for 2020 (instead of 2016) from the Commonwealth Fund surveys in order to allow more meaningful comparisons.
Which countries are included?The countries [5] included for comparison in this study were chosen based on the following three criteria:
1. must be a member of the OECD;2. must have universal (or near-universal) coverage for core-medical services;3. must be classified as a “high-income” country by the World Bank. [6]
[4] For example, while there are 2019 data available for the Treatable Mortality indicator, the most complete year with Canadian data remains 2017.[5] It is of note that there may be significant variation within each country examined. This is particularly true in Canada where the provision of health-care services is a provincial responsibility and there may be meaningful differences with regards to policy, spending, and the delivery of care.[6] “High-income” countries are those that have a gross national income (GNI) per capita of US$12,535 or more in 2019.

Comparing Performance of Universal Health Care Countries, 2021 • Moir and Barua • 5
fraserinstitute.org
Table 1: Indicators used in Comparing Performance of Universal Health Care Countries, 2021Category Indicator Source
SpendingTotal expenditure on health (% gross domestic product) OECD, 2021Total expenditure on health (per-capita US PPP) OECD, 2021
Availability of resources
Physicians (per thousand population) OECD, 2021Nurses (per thousand population) OECD, 2021Curative (acute) care beds (per thousand population) OECD, 2021Psychiatric care beds (per thousand population) OECD, 2021Long-term care beds (hospital + residential) (per thousand pop, 65 years +) OECD, 2021Magnetic Resonance Imaging (MRI) units (per million population) OECD, 2021Computed Tomography (CT) scanners (per million population) OECD, 2021Positron Emission Tomography (PET) scanners (per million population) OECD, 2021Gamma cameras (per million population) OECD, 2021Mammographs (per million population) OECD, 2021
Use of resources
Doctor consultations (per hundred population) OECD, 2021Curative-care discharges (per hundred thousand population) OECD, 2021Magnetic Resonance Imaging (MRI) examinations (per thousand population) OECD, 2021Computed Tomography (CT) examinations (per thousand population) OECD, 2021Cataract surgery (per hundred thousand population) OECD, 2021Transluminal coronary angiolasty (per hundred thousand population) OECD, 2021Coronary artery bypass graft (CABG) (per hundred thousand population) OECD, 2021Stem cell transplantation (per hundred thousand population) OECD, 2021Appendectomy (per hundred thousand population) OECD, 2021Cholecystectomy (per hundred thousand population) OECD, 2021Repair of inguinal hernia (per hundred thousand population) OECD, 2021Hip replacement (per hundred thousand population) OECD, 2021Knee replacement (per hundred thousand population) OECD, 2021
Access to resources
Able to get same day appointment when sick (%) CIHI, 2021Very/somewhat easy getting care after hours (%) CIHI, 2021Waited less than four weeks for specialist appointment (%) CIHI, 2021Waited less than four months for non-emergency or elective surgery (%) CIHI, 2021Experienced barrier to access because of cost in past year (%) Schneider et al., 2021
Quality and clinical performance
Breast cancer five-year net survival (%) OECD, 2021Cervical cancer five-year net survival (%) OECD, 2021Colon cancer five-year net survival (%) OECD, 2021Rectal cancer five-year net survival (%) OECD, 2021Admission-based AMI 30-day in-hospital mortality (per hundred patients) OECD, 2021Admission based hemorrhagic stroke 30-day in hospital mortality (per hundred patients) OECD, 2021Admission-based Ischemic stroke 30-day in-hospital mortality (per hundred patients) OECD, 2021Hip-fracture surgery initiated within 48 hours of admission to the hospital (per 100 patients) OECD, 2021Diabetes lower extremity amputation (per hundred thousand population) OECD, 2021Obstetric trauma vaginal delivery with instrument (per hundred vaginal deliveries) OECD, 2021Obstetric trauma vaginal delivery without instrument (per hundred vaginal deliveries) OECD, 2021In-patient suicide among patients diagnosed with a mental disorder (per hundred patients) OECD, 2021
Health statusLife expectancy at birth (years) OECD, 2021Infant mortality rate (per thousand live births) OECD, 2021Perinatal mortality (per thousand total births) OECD, 2021Healthy life expectancy (HALE) at birth (years) WHO, 2021; OECD, 2021Treatable mortality OECD, 2021
Note: For precise definitions, see CIHI, 2021; OECD, 2021; Schneider, Shah, Doty, Tikkanen, Fields, and Williams II, 2021; and WHO, 2020.

6 • Comparing Performance of Universal Health Care Countries, 2021 • Moir and Barua
fraserinstitute.org
Of 36 OECD members in 2019 considered for inclusion, the OECD (2019b) concludes that seven countries—Chile, Estonia, Hungary, Mexico, Poland, the Slovak Republic, and the United States—do not have universal (or near-universal) coverage for core medical services. Of the 29 countries remaining for consideration, Turkey does not meet the criteria of being classified in the high-income group (in 2019) according to the World Bank (2021). The remain-ing 28 countries that meet the three criteria above can be seen in table 2 (p. 9).
Are the indicators adjusted for comparability?The populations of the 28 countries included for comparison in this report vary significantly in their age profiles. For example, while seniors represented only 11.9% of Israel’s population in 2019, they represented 28.4% of the population in Japan in the same year (OECD, 2021). This is important because it is well established that older populations require higher levels of health-care spend-ing as a result of consuming more health-care resources and services (Esmail and Walker, 2008). [7] For example, in 2016 seniors over 65 years of age repre-sented 17% of the Canadian population but consumed 45% of all health-care expenditures (CIHI, 2018).
For this reason, in addition to presenting unadjusted figures, this study also presents indicators measuring health-care expenditures, availability of resources, and use of resources adjusted according to the age-profile of the country. [8] While such adjustment may not affect the overall conclusion [9] about the performance of a country’s health-care system compared to expendi-ture, it does provide a more nuanced view when examining indicators individ-ually. For this reason, both unadjusted and age-adjusted rankings are presented in this paper. Taking the example of health care spending, the age-adjustment process used in this paper is based on the following two factors.
[7] The Canadian Institute of Health Information (CIHI) suggests that “[o]lder seniors consume more health care dollars largely as a consequence of two factors: the cost of health care in the last few months of life, and the minority of the population with chronic illnesses that tend to require more intensive medical attention with age”. They also note that “[t]here is some evidence that proximity to death rather than aging is the key factor in terms of health expenditure” (CIHI, 2011a: 16–17).[8] It is unclear whether indicators of timely access to care need to be adjusted for age, and the methodology for making such an adjustment has not been explored by the authors. Indicators of clinical performance and quality are already adjusted for age by the OECD. The indicators of health status (such as life expectancy) used in this report generally do not require (further) age-adjustment. The methodology for calculating Treatable Mortality incorporates an age-adjustment process for their standardized rates.[9] As Barua (2013) notes, in the process of calculating an overall value-for-money score, age-adjustment would apply to both the value and cost components in opposite directions and may cancel each other out in the process.

Comparing Performance of Universal Health Care Countries, 2021 • Moir and Barua • 7
fraserinstitute.org
1. An estimate of how health expenditures have historically changed as a result of changes in the proportion of the population over 65It is possible to calculate the change in average per-capita government health-care expenditures when the age structure changes, while keeping the age-specific expenditure constant (see, e.g., Barua, Palacios, and Emes, 2016; Morgan and Cunningham, 2011; Pinsonnault, 2011). While five-year age bands are most commonly used, we can adapt this method so that only two age bands are used (0–65, and 65+) to estimate the elasticity of real, total health-care expenditures per capita solely due to changes in the proportion of the population over 65. Using Canadian [10] population and per-capita health-care expenditure data from 1980 to 2000 (Grenon, 2001), and keeping the age-specific expenditure data constant, [11] we estimate that for every 1% (or percentage point, since the share of population over 65 is a percentage itself ) increase in proportion of population over 65, health-care expenditure increased by 3.1%.
2. The degree to which the proportion of a country’s population over 65 deviates from the OECD averageIf β represents the proportion of the population over 65, and HCEpc is health care expenditure per capita in a particular country, then:
HCEpc age-adjusted = HCEpc (1 + 0.03098) (βoecd − β)
One way to think of this estimation is, if βoecd had exactly one-percentage point more seniors as a share of the population than Canada, the adjusted expendi-ture for Canada should be equal to Canada’s projected health-care expendi-ture per capita when its population over 65 increases by one percentage point. Following Esmail and Walker (2008), we assume that it is logical to apply the same proportional increase (due to ageing) derived from our spending estimate to indicators measuring the number of resources and their use. [12]
[10] Detailed age-specific historical data on health-care spending for every OECD country were not available so we assume that the effect of ageing on health-care spending in Canada reflects how ageing would affect health-care spending in high-income OECD countries more generally.[11] 1990 is used as a base year. A sensitivity analysis using 1980 and 2000 as base years did not yield significantly different results.[12] Esmail and Walker note that, “[l]ike health expenditures, where the elderly consume far more resources than other proportions of the population, medical professionals [and resources, more generally] are likely to be needed at a higher rate as the population ages” (2008: 53). In the absence of precise estimates, we assume that increased use of med-ical resources rise roughly proportionally to increased use of all health-care services (as reflected by increased health-care spending).

8 • Comparing Performance of Universal Health Care Countries, 2021 • Moir and Barua
fraserinstitute.org
2. How much does Canada spend on health care compared to other countries?
When attempting to measure the performance of health-care systems, it is essential to consider the costs of maintaining such systems. It is not meaning-ful to either “define higher national levels of spending on health as negative without considering the benefits” (Rovere and Skinner, 2012: 15) or, conversely, to define a health system with higher levels of benefits as positive without con-sidering the costs. There are two measures that can help inform us about the relative differences between the amount of money spent by different countries on health care. The first is health-care expenditure as a percentage of gross domestic product (GDP). As Esmail and Walker note, this indicator “controls for the level of income in a given country and shows what share of total pro-duction is committed to health care expenditures”. Such a measure also helps avoid potentially “flawed comparisons with low spending in less developed OECD countries … while also not overvaluing high expenditures in relatively rich countries” (2008: 17) .
A second measure is health-care expenditure per capita, adjusted for comparison using purchasing power parity data (PPP). While there are some important theoretical concerns about the reliability of international compari-sons using data reliant on PPP, there are also several benefits to using this indicator. Apart from being more straightforward from a conceptual stand-point, how countries rank on this indicator is less susceptible to short-term fluctuations in GDP.
Out of 28 countries, Canada ranked 6th highest for health-care expendi-ture as a percentage of GDP and the 10th highest for health-care expenditure per capita (table A1, p. 42). After adjustment for age, Canada ranks second highest for health-care expenditure as a percentage of GDP and 8th highest for health-care expenditure per capita (table 2; figures 2a, 2b). Clearly, these indicators suggest that Canada spends more on health care than the majority of high-income OECD countries with universal health-care systems.

Comparing Performance of Universal Health Care Countries, 2021 • Moir and Barua • 9
fraserinstitute.org
Table 2: Spending on health care, age-adjusted, 2019
Spending as percentage of GDP Spending per capitaPercentage Rank
(out of 28)US$ PPP Rank
(out of 28)
Australia 10.3 9 5,366.8 11
Austria 10.4 8 5,697.0 6
Belgium 10.6 6 5,450.7 9
Canada 11.3 2 5,579.8 8
Czech Republic 7.6 24 3,330.4 22
Denmark 9.7 14 5,354.2 12
Finland 8.3 19 4,156.6 17
France 10.7 5 5,077.4 14
Germany 10.8 4 5,994.0 4
Greece 7.1 25 2,100.3 27
Iceland 9.9 13 5,233.6 13
Ireland 7.7 22 5,876.7 5
Israel 9.2 15 3,578.7 19
Italy 7.6 23 3,219.2 23
Japan 8.2 21 3,495.2 21
Korea 9.2 16 3,831.3 18
Latvia 6.4 27 1,978.4 28
Lithuania 6.8 26 2,641.5 26
Luxembourg 6.2 28 6,221.6 3
Netherlands 10.1 12 5,678.9 7
New Zealand 10.1 11 4,679.9 15
Norway 11.0 3 7,072.1 2
Portugal 8.7 18 3,050.3 25
Slovenia 8.3 20 3,199.7 24
Spain 9.0 17 3,540.7 20
Sweden 10.6 7 5,377.5 10
Switzerland 11.4 1 7,215.5 1
United Kingdom 10.2 10 4,535.1 16
OECD average (of 28 countries)
9.2 4,590.5
Note: Because the table shows rounded values, countries may have different ranks even if they appear to have same values.Sources: OECD, 2021; calculations by authors.

10 • Comparing Performance of Universal Health Care Countries, 2021 • Moir and Barua
fraserinstitute.org
Figure 2a: Health-care spending as a percentage of GDP, age-adjusted, 2019
Sources: OECD, 2021; calculations by authors.
0 2 4 6 8 10 12Luxembourg
LatviaLithuania
GreeceCzech Republic
ItalyIrelandJapan
SloveniaFinland
PortugalSpainKorea
OECD averageIsrael
DenmarkIceland
NetherlandsNew Zealand
United KingdomAustralia
AustriaSwedenBelgium
FranceGermany
NorwayCanada
Switzerland
Percentage
Figure 2b: Health-care spending per capita (PPP US$), age-adjusted, 2019
Sources: OECD, 2021; calculations by authors.
0 1,000 2,000 3,000 4,000 5,000 6,000 7,000 8,000Latvia
GreeceLithuaniaPortugalSlovenia
ItalyCzech Republic
JapanSpainIsraelKorea
FinlandUnited Kingdom
OECD averageNew Zealand
FranceIceland
DenmarkAustraliaSwedenBelgiumCanada
NetherlandsAustriaIreland
GermanyLuxembourg
NorwaySwitzerland
PPP US$

Comparing Performance of Universal Health Care Countries, 2021 • Moir and Barua • 11
fraserinstitute.org
3. How well does Canada’s health-care system perform?
In light of Canada’s relatively high spending on health care, the following sec-tion examines the performance of Canada’s health-care system using 40 indi-cators, representing the four broad categories of: 1. availability of resources; 2. use of resources; 3. access to resources; 4. clinical performance and quality.
3.1 Availability of resourcesThe availability of adequate medical resources is perhaps one of the most basic requirements for a properly functioning health-care system. Due to its integral nature, along with the availability of comparable data, indicators of medical resources available are frequently examined by researchers, especially in the context of health-care expenditures (e.g., Esmail and Walker, 2008; Rovere and Skinner, 2012). The World Health Organisation (WHO) notes that “[t]he provision of health care involves putting together a considerable number of resource inputs to deliver an extraordinary array of different service outputs” (WHO, 2000: 75) and suggests that human resources, physical capital, and consumables such as medicine are the three primary inputs of a health system.
Of these, this study includes indictors of human and capital resources (table 3), and of technology resources (table 4). [13] Research has shown that drugs are also considered one of the most important forms of medical technol-ogy used to treat patients. [14] However, indicators of the availability, novelty, and consumption of pharmaceuticals are not included in this paper because comprehensive and comparable data are not available.
[13] When analyzing medical resources in general, research also indicates that “more is not always better”. For instance, Watson and McGrail (2009) found no association between avoidable mortality and the overall supply of physicians. The CIHI notes that what it calls the “structural dimensions” that characterize health-care systems are not “directional” and do not necessarily reflect the performance of health systems (CIHI, 2011c). Similarly, Kelly and Hurst (2006) contend that, while structural indicators (medical resources) are often necessary for delivering high-quality medical care, they are not always sufficient on their own: simply having an abundance of medical resources does not necessarily mean that they are being used efficiently or appropriately at all times. Therefore, this study makes no assertions about the optimal level at which such resources should be available.[14] See, for example, Skinner and Rovere, 2011: 22–23; Cremieux et al., 2005; Frech and Miller, 1999; Kleinke, 2001; and Lichtenberg and Virabhak, 2002.

12 • Comparing Performance of Universal Health Care Countries, 2021 • Moir and Barua
fraserinstitute.org
Table 3: Availability of human and capital resources per thousand population, age-adjusted, 2019Physicians Nurses Acute beds Psychiatric beds Long-term care beds
per ’000
Rank (out of 28)
per ’000
Rank (out of 28)
per ’000
Rank (out of 26)
per ’000
Rank (out of 28)
per ’000*
Rank (out of 24)
Australia 4.2 10 13.3 6 — — 0.46 20 — —
Austria 5.3 2 10.4 15 5.3 4 0.69 13 49.1 13
Belgium 3.2 21 11.1 10 5.0 6 1.41 2 69.2 3
Canada 2.8 26 10.4 14 2.0 25 0.37 24 54.3 8
Czech Republic 4.0 14 8.3 20 3.9 8 0.90 10 45.6 16
Denmark 4.1 11 9.9 17 2.4 22 0.51 18 37.9 19
Finland 2.9 25 13.0 7 2.4 23 0.54 17 57.2 6
France 3.1 23 10.7 11 2.9 16 0.79 12 51.4 12
Germany 4.0 13 12.8 8 5.5 3 1.20 4 54.2 9
Greece 5.6 1 3.1 28 3.3 11 0.64 14 4.1 24
Iceland 4.5 5 17.7 3 2.6 19 0.41 21 55.5 7
Ireland 3.8 15 14.9 4 3.1 13 0.38 23 47.5 14
Israel 4.1 12 6.2 24 2.7 18 0.47 19 20.2 21
Italy 3.6 18 5.4 26 2.3 24 0.07 28 19.4 22
Japan 1.9 28 8.8 19 5.8 2 1.93 1 35.1 20
Korea 2.8 27 8.9 18 8.0 1 1.39 3 60.4 5
Latvia 3.1 22 4.2 27 2.9 15 1.14 5 17.0 23
Lithuania 4.4 6 7.5 22 5.0 5 0.94 8 41.3 18
Luxembourg 3.4 19 13.5 5 3.8 9 0.93 9 81.6 1
Netherlands 3.7 17 10.6 12 2.6 20 0.79 11 74.0 2
New Zealand 3.8 16 11.4 9 2.8 17 0.36 25 52.3 11
Norway 5.2 3 18.7 1 3.3 12 1.09 6 43.5 17
Portugal 4.8 4 6.5 23 3.0 14 0.57 16 — —
Slovenia 3.2 20 10.0 16 4.0 7 0.63 15 52.7 10
Spain 4.3 8 5.8 25 2.4 21 0.35 26 46.1 15
Sweden 4.2 9 10.5 13 1.8 26 0.40 22 — —
Switzerland 4.4 7 18.2 2 3.6 10 0.94 7 64.4 4
United Kingdom 3.0 24 8.3 21 — — 0.35 27 — —
OECD average 3.8 10.3 3.6 0.7 47.2
Notes: Because the table shows rounded values, countries may have different ranks even if they appear to have same values. * The OECD reports long-term care beds per 1,000 population over the age of 65 in the relevant country. For this reason, the authors do not adjust this indicator for age using the method described on page 6.Sources: OECD, 2021; calculations by authors.

Comparing Performance of Universal Health Care Countries, 2021 • Moir and Barua • 13
fraserinstitute.org
Human and capital resourcesHuman resources are perhaps “the most important of the health system’s inputs [and] usually the biggest single item in the recurrent budget for health” (WHO, 2000: 77). Importantly, apart from physicians, who, according to the WHO (2000), play the primary role in the health-care system, it is also useful to meas-ure the number of other health personnel such as nurses who are involved in the direct provision of care. At the same time, services cannot be effectively delivered without physical capital such as hospitals, [15] beds, and equipment. For this reason, it is useful to examine the number of physicians, nurses, cura-tive (acute) care beds, psychiatric beds per thousand population, and long-term care beds (per thousand over the age of 65).
Measuring the availability of long-term care resources like beds will be important for those who will “at some point require LTC services that cannot be delivered a home” (OECD, 2019b: 236). This report contains an indicator measuring the relative availability of long-term care beds. Adapted from Health at a Glance 2019 (OECD, 2019b), this measure combines two sets of data: 1. hospital long-term care beds per 1,000 over the age of 65; and 2. residential long-term care beds per 1,000 over the age of 65. As these data measure the availability of beds for those over the age of 65 in the relevant country, the authors did not apply the age-adjustment method outlined on page 6. The data for long-term care beds per 1,000 population (for all age groups) are available in appendix A2.
Out of 28 countries, Canada ranks 26th for physicians, 18th for nurses, 25th (out of 26) for curative (acute) care beds, and 22nd (out of 28) for psychi-atric care beds per thousand population (table A2, p. 43) and 10th (out of 24) for long-term care beds per thousand population. As can be seen in table 3, after adjustment for age, Canada ranks 26th for physicians (figure 3a), 14th for nurses (figure 3b), 25th for curative (acute) care beds (out of 26) (figure 3c), 24th (out of 28) for psychiatric care beds per thousand population, ranked 8th (out of 24) for long-term care beds per thousand population (65 and over). Except for above-average availability of long-term care beds, and middling nursing density, Canada clearly has fewer human and capital medical resources per capita than other high-income OECD countries with universal health care.
Technology and diagnostic imaging resourcesResearch suggests that medical technology plays a significant role for improv-ing the efficiency of medical services, ultimately benefiting patients while reducing health-care expenditures over time (Or, Wang, and Jamison, 2005).
[15] While data on the number of hospitals in the countries examined in this report are available, they are not included due to large variability in size and specialty. The number of beds in some ways serves as a proxy for the amount of physical capital that would be represented by a measure of the number of hospitals in a country.

14 • Comparing Performance of Universal Health Care Countries, 2021 • Moir and Barua
fraserinstitute.org
Figure 3b: Nurses per ’000 population, age-adjusted, 2019 or most recent
Sources: OECD, 2021; calculations by authors.
0 4 8 12 16 20GreeceLatvia
ItalySpainIsrael
PortugalLithuania
United KingdomCzech Republic
JapanKorea
DenmarkSlovenia
OECD averageAustria
CanadaSweden
NetherlandsFrance
BelgiumNew Zealand
GermanyFinland
AustraliaLuxembourg
IrelandIceland
SwitzerlandNorway
Per thousand population
Figure 3a: Physicians per ’000 population, age-adjusted, 2019 or most recent
Sources: OECD, 2021; calculations by authors.
0 1 2 3 4 5 6JapanKorea
CanadaFinland
United KingdomFranceLatvia
BelgiumSlovenia
LuxembourgItaly
NetherlandsNew Zealand
OECD averageIreland
Czech RepublicGermany
IsraelDenmarkAustraliaSweden
SpainSwitzerland
LithuaniaIceland
PortugalNorwayAustriaGreece
Per thousand population

Comparing Performance of Universal Health Care Countries, 2021 • Moir and Barua • 15
fraserinstitute.org
For example, medical technologies such as new diagnostic equipment and innovative surgical and laboratory procedures improve the efficiency of hospi-tals and increase the comfort and safety of patients (Esmail and Wrona, 2008). For this reason, it is useful to examine the number of Magnetic Resonance Imaging (MRI) units, Computed Tomography (CT) scanners, Positron Emission Tomography (PET) scanners, Gamma cameras, and Mammographs per million population.
Per million population, Canada ranks 22nd (out of 24) for MRI units, 24th (out of 26) for CT scanners, 19th (out of 24) for PET scanners, 3rd (out of 23) for Gamma cameras, and 12th (out of 21) for Mammographs (table A3, p. 44). After adjustment for age, Canada ranks 21st (out of 24) for MRI units (figure 4a), 22nd (out of 26) for CT scanners (figure 4b), 17th (out of 24) for PET scanners, 3rd (out of 23) for Gamma cameras, and 14th (out of 21) for Mammographs (table 4). While Canada has the third most Gamma cameras (per million population) on an age-adjusted basis, it has fewer other medical technologies than the average high-income OECD country with universal health care for which comparable inventory data is available.
Figure 3c: Acute-care beds per ’000 population, age-adjusted, 2019 or most recent
Sources: OECD, 2021; calculations by authors.
0 2 4 6 8 10SwedenCanada
ItalyFinland
DenmarkSpain
NetherlandsIceland
IsraelNew Zealand
FranceLatvia
PortugalIreland
NorwayGreece
OECD averageSwitzerland
LuxembourgCzech Republic
SloveniaBelgium
LithuaniaAustria
GermanyJapanKorea
Per thousand population

16 • Comparing Performance of Universal Health Care Countries, 2021 • Moir and Barua
fraserinstitute.org
Figure 4a: MRI units per million population, age-adjusted, 2019 or most recent
Sources: OECD, 2021; calculations by authors.
0 10 20 30 40 50
IsraelUnited KingdomCzech Republic
CanadaBelgiumSlovenia
LithuaniaNetherlands
LatviaFrance
AustraliaLuxembourg
New ZealandSpain
NorwayIreland
OECD averageIcelandAustriaFinland
ItalyGreece
GermanyKoreaJapan
Per million population0 20 40 60 80 100
United KingdomIsrael
NetherlandsFinlandCanada
Czech RepublicNew Zealand
FranceSlovenia
LuxembourgSpain
BelgiumIreland
LithuaniaNorwayAustria
OECD averageItaly
GermanyLatvia
GreeceSwitzerland
DenmarkKorea
IcelandAustralia
Japan
Figure 4b: CT scanners per million population, age-adjusted, 2019 or most recent

Comparing Performance of Universal Health Care Countries, 2021 • Moir and Barua • 17
fraserinstitute.org
Table 4: Availability of technological and diagnostic imaging resources per million pop.., age-adjusted, 2019
MRI Units CT Scanners PET Scanners Gamma Cameras Mammographs
Per million
Rank (out of 24)
Per million
Rank (out of 26)
Per million
Rank (out of 24)
Per million
Rank (out of 23)
Per million
Rank (out of 21)
Australia 16.1 14 76.1 2 4.1 4 20.3 2 25.4 9
Austria 25.0 7 28.7 11 2.7 11 10.2 9 21.7 10
Belgium 11.5 20 24.1 15 2.9 10 25.6 1 36.5 3
Canada 10.5 21 15.2 22 1.6 17 15.9 3 18.6 14
Czech Republic 10.1 22 16.0 21 1.5 18 11.1 8 11.2 21
Denmark — — 39.7 5 8.1 1 14.3 4 14.8 17
Finland 26.2 6 14.9 23 3.0 9 6.9 14 26.1 7
France 14.8 15 17.5 19 2.4 12 6.6 17 — —
Germany 31.7 3 32.5 9 — — — — — —
Greece 28.9 4 38.5 7 1.2 21 11.4 6 60.5 2
Iceland 22.4 8 54.3 3 3.2 7 9.6 10 19.2 13
Ireland 18.5 9 24.6 14 2.1 13 6.8 16 19.5 12
Israel 6.3 24 12.0 25 1.9 14 11.3 7 — —
Italy 26.6 5 32.1 10 3.1 8 6.9 15 30.4 4
Japan 41.1 1 83.1 1 3.4 6 8.6 11 25.6 8
Korea 36.0 2 44.6 4 4.2 3 6.6 18 71.3 1
Latvia 14.5 16 35.4 8 1.5 19 3.5 22 26.4 6
Lithuania 13.5 18 25.6 13 0.7 24 2.8 23 15.3 16
Luxembourg 16.7 13 18.5 17 1.8 15 13.0 5 13.0 19
Netherlands 13.7 17 14.7 24 4.5 2 7.4 13 — —
New Zealand 17.0 12 17.0 20 1.1 23 4.0 20 21.6 11
Norway 18.2 10 27.7 12 1.2 22 3.7 21 12.9 20
Portugal — — — — — — — — — —
Slovenia 12.1 19 17.6 18 1.4 20 7.9 12 14.4 18
Spain 17.3 11 18.9 16 1.7 16 6.6 19 16.2 15
Sweden — — — — — — — — — —
Switzerland — — 39.1 6 3.9 5 — — 29.6 5
United Kingdom 7.3 23 9.5 26 — — — — — —
OECD Average 19.0 29.9 2.6 9.6 25.2
Sources: OECD, 2021; calculations by authors.

18 • Comparing Performance of Universal Health Care Countries, 2021 • Moir and Barua
fraserinstitute.org
3.2 Use of resourcesWhile measurement of the availability of medical resources is valuable, it does not provide us with information about their use. Importantly, med-ical resources are of little use if their services are not being consumed by those with health-care demands. A similar observation is made by Figueras, Saltman, Busse, and Dubois who note that “the number of units provides no information about the efficiency with which they are operated (utilization rates)” (2004: 122). The WHO similarly points out that “major equipment purchases are an easy way for the health system to waste resources, when they are underused, yield little health gain, and use up staff time and recurrent budget” (2000: xvii). Thus, simply having an abundance of medical resources does not necessarily mean that they are being used; for this reason, it is import-ant to also include the volume of services or use of resources. In other words,
“[t]he volume of care and services produced measures the quantity of health-related goods and services produced by the health-care system” (Champagne et al., 2005, quoted, in translation, by Tchouaket, Lamarche1, Goulet, and Contandriopoulos, 2012: 109).
In order to get a better idea of the quantity of health-related goods [16] and services provided by different countries, we examine indictors measuring the number of doctors’ consultations per capita, curative-care discharge rates per hundred thousand population, [17] MRI examinations per thousand popu-lation, and CT scans per thousand population. In addition, Canada’s ranking based on the number of nine specific procedures performed relative to other countries is also discussed (for data see tables A5 and A6, pp. 46–49). [18]
[16] Data measuring the consumption of antibiotics were available but were not included in this study due to variability among countries in policies concerning use of antibiotics.[17] Previous versions of this report included an indicator measuring hospital discharge rates. The OECD (2017: 174) defines hospital discharge rates as “… the number of patients who leave a hospital after staying at least one night” including “… deaths in hospital fol-lowing inpatient care”. The OECD (2017) notes a number of methodological differences between countries for this indicator. For example, some same-day separations are included in Chile, Japan, Norway, and the United States while healthy babies born in hospitals (which can account for about 3% to 10% of all discharges) are excluded in several coun-tries like Australia, Austria, Canada, Chile, Estonia, Finland, Greece, Ireland, Luxembourg, Mexico, and Norway. Further, data for Canada only included “curative-care discharges” defined as “health care contacts during which the principal intent is to relieve symptoms of illness or injury, to reduce the severity of an illness or injury, or to protect against exacer-bation and/or complication of an illness or injury that could threaten life or normal func-tion”. In order to ensure better comparability, curative-care discharges are now reported for all countries (including Canada).[18] Of course, as the CIHI points out that “the utilization of health-care services should be related to the need for services” and that “other things being equal, a healthier popula-tion would have less need for services than an unhealthier one” (2011a: 17). However, this would also imply that a healthier population should therefore spend less on health-care

Comparing Performance of Universal Health Care Countries, 2021 • Moir and Barua • 19
fraserinstitute.org
Canada ranks 13th (out of 26) for doctor consultations per capita, 27th (out of 27) for curative-care discharge rates per 100,000 population, 17th (out of 22) for MRI exams per thousand population, and 13th (out of 22) for CT scans per thousand population (table A4, p. 45). After adjustment for age, Canada ranks 12th (out of 26) for doctor consultations per capita (figure 5a), 27th (out of 27) for curative-care discharge rates per 100,000 population (figure 5b), 17th (out of 22) for MRI examinations per thousand population, and 13th (out of 22) for CT scans per thousand population (table 5).
Canada ranks just below the average high-income OECD country with universal health care for the rate of doctor consultations on an age-adjusted basis. Canada ranks below average for CT and MRI examinations on an age-adjusted basis, and ranks as the country with the lowest curative-care
services too (assuming other things, especially income, are equal). On the other hand, the provision of services (as measured by rates of use) can also be viewed as a purchased benefit, or simply an indication of the amount in services that a health-care system pro-vides. Given that there have also been several recent academic examinations of the overuse of medical services (e.g., Korenstein, Falk, Howell, Bishop, and Keyhani, 2012; Chamot, Charvet, and Perneger, 2009), this study makes no assertions about the optimal level for the use of medical services.
Figure 5a: Consultations with doctor per capita, age-adjusted, 2019 or most recent
Sources: OECD, 2021; calculations by authors.
0 5 10 15 20SwedenGreece
DenmarkFinland
New ZealandSwitzerland
NorwayFranceLatvia
LuxembourgSlovenia
AustriaIrelandIcelandCanada
OECD averageSpain
BelgiumAustralia
Czech RepublicNetherlands
GermanyItaly
LithuaniaJapanIsraelKorea
Per capita
20 • Comparing Performance of Universal Health Care Countries, 2021 • Moir and Barua
fraserinstitute.org
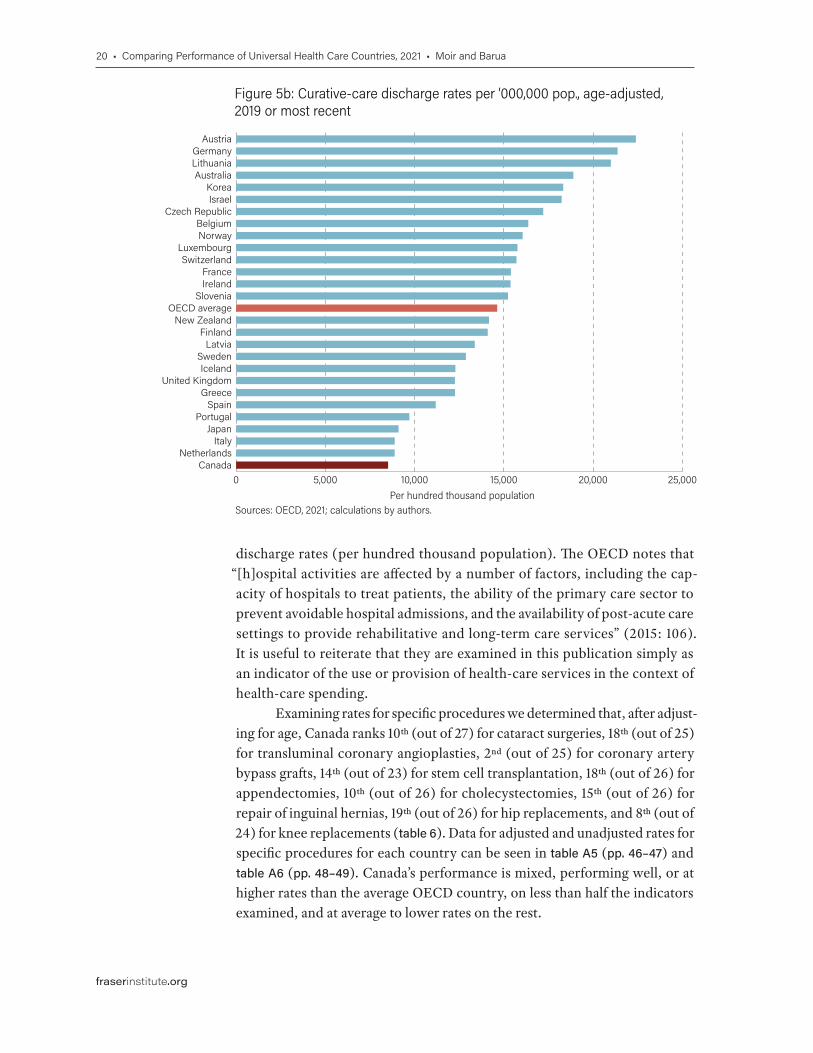
discharge rates (per hundred thousand population). The OECD notes that “[h]ospital activities are affected by a number of factors, including the cap-acity of hospitals to treat patients, the ability of the primary care sector to prevent avoidable hospital admissions, and the availability of post-acute care settings to provide rehabilitative and long-term care services” (2015: 106). It is useful to reiterate that they are examined in this publication simply as an indicator of the use or provision of health-care services in the context of health-care spending.
Examining rates for specific procedures we determined that, after adjust-ing for age, Canada ranks 10th (out of 27) for cataract surgeries, 18th (out of 25) for transluminal coronary angioplasties, 2nd (out of 25) for coronary artery bypass grafts, 14th (out of 23) for stem cell transplantation, 18th (out of 26) for appendectomies, 10th (out of 26) for cholecystectomies, 15th (out of 26) for repair of inguinal hernias, 19th (out of 26) for hip replacements, and 8th (out of 24) for knee replacements (table 6). Data for adjusted and unadjusted rates for specific procedures for each country can be seen in table A5 (pp. 46–47) and table A6 (pp. 48–49). Canada’s performance is mixed, performing well, or at higher rates than the average OECD country, on less than half the indicators examined, and at average to lower rates on the rest.
Figure 5b: Curative-care discharge rates per ’000,000 pop., age-adjusted, 2019 or most recent
Sources: OECD, 2021; calculations by authors.
0 5,000 10,000 15,000 20,000 25,000Canada
NetherlandsItaly
JapanPortugal
SpainGreece
United KingdomIceland
SwedenLatvia
FinlandNew Zealand
OECD averageSlovenia
IrelandFrance
SwitzerlandLuxembourg
NorwayBelgium
Czech RepublicIsraelKorea
AustraliaLithuaniaGermany
Austria
Per hundred thousand population

Comparing Performance of Universal Health Care Countries, 2021 • Moir and Barua • 21
fraserinstitute.org
Table 5: Use of resources, age-adjusted, 2019
Doctor consultations Curative-care discharge rates MRI examinations CT examinations
Per capita
Rank (out of 26)
Per 100,000
Rank (out of 27)
Per 1,000
Rank (out of 22)
Per 1,000
Rank (out of 22)
Australia 8.0 9 18,890.5 4 56.0 21 153.7 12
Austria 6.6 15 22,393.6 1 147.8 1 195.9 5
Belgium 7.3 10 16,366.7 8 98.0 7 204.6 4
Canada 6.9 12 8,514.6 27 64.4 17 149.8 13
Czech Republic 8.0 8 17,203.1 7 58.6 19 111.2 17
Denmark 3.9 24 — — 87.1 9 180.4 8
Finland 4.0 23 14,095.9 16 48.4 22 61.2 22
France 5.7 19 15,393.3 12 118.5 5 191.6 7
Germany 9.0 6 21,368.4 2 133.4 2 133.1 14
Greece 2.9 25 12,258.2 21 79.2 12 177.0 9
Iceland 6.8 13 12,283.7 19 124.8 3 267.5 2
Ireland 6.7 14 15,372.8 13 — — — —
Israel 10.1 2 18,236.9 6 58.5 20 195.9 6
Italy 9.2 5 8,885.8 25 66.4 14 85.7 20
Japan 9.3 3 9,100.2 24 83.7 10 172.0 11
Korea 19.3 1 18,322.2 5 83.1 11 279.8 1
Latvia 5.8 18 13,369.6 17 66.0 15 175.7 10
Lithuania 9.2 4 20,992.6 3 64.9 16 128.3 15
Luxembourg 6.3 17 15,760.8 10 103.4 6 255.8 3
Netherlands 8.7 7 8,883.9 26 58.9 18 109.7 18
New Zealand 4.2 22 14,166.3 15 — — — —
Norway 4.6 20 16,052.1 9 122.3 4 90.1 19
Portugal — — 9,705.2 23 — — — —
Slovenia 6.5 16 15,231.6 14 77.6 13 81.4 21
Spain 7.2 11 11,183.3 22 97.5 8 122.2 16
Sweden 2.5 26 12,871.5 18 — — — —
Switzerland 4.3 21 15,704.6 11 — — — —
United Kingdom — — 12,258.7 20 — — — —
OECD Average 7.0 14,624.7 86.3 160.1
Source: OECD, 2021; calculations by authors.

22 • Comparing Performance of Universal Health Care Countries, 2021 • Moir and Barua
fraserinstitute.org
3.3 Access to resourcesWhile both the level of medical resources available and their use can pro-vide insight into accessibility, it is also useful to measure accessibility directly. Various dimensions of accessibility—physical, financial, and psychological— can be measured (Kelly and Hurst, 2006). However, another important inter-pretation of accessibility (for which objective data is more readily available) is the timeliness of care, as measured by waiting lists.
Murray and Frenk propose that individuals value prompt attention for two reasons: “it may lead to better health outcomes” and “it can allay fears and concerns that come with waiting for diagnosis or treatment” (2000: 720). Existing empirical support [19] for the first notion has been studied extensively by Nadeem Esmail who found that “adverse consequences from prolonged waiting are increasingly being identified and quantified in medical and econom-ics literature” (Esmail, 2009: 11). In addition, waiting for treatment can, itself, also adversely affect the lives of those on waiting lists. For example, in Canada
“18% of individuals who visited a specialist indicated that waiting for the visit affected their life compared with 11% and 12% for non-emergency surgery
[19] For a comprehensive review of studies looking at the adverse consequences associ-ated with increased wait times, see Day, 2013.
Table 6: Use of resources in Canada, by specialty, per 100,000 population, age-adjusted ranks, 2018
Procedure Rate (per 100,000 population)
Rank Average of selected countries
Cataract surgery 1,137.9 10 (out of 27) 1,013.9
Transluminal coronary angioplasty 163.8 18 (out of 25) 217.6
Coronary artery bypass graft 56.1 2 (out of 25) 36.1
Stem cell transplantation 6.9 14 (out of 23) 7.0
Appendectomy 115.4 18 (out of 26) 127.9
Cholecystectomy 205.9 10 (out of 26) 185.7
Repair of inguinal hernia 174.8 15 (out of 26) 182.0
Hip replacement 174.8 19 (out of 26) 200.2
Knee replacement 206.1 8 (out of 24) 161.5
Source: OECD, 2021; calculations by authors.

Comparing Performance of Universal Health Care Countries, 2021 • Moir and Barua • 23
fraserinstitute.org
and diagnostic tests, respectively”; many of these people experienced worry, stress, anxiety, pain, and difficulties with activities of daily living (Statistics Canada 2006: 10, 11).
The CIHI (2011b) and the OECD (2011) include various measures of access in their reports, while the Commonwealth Fund (2015, 2017), the Fraser Institute (Barua, 2015; Rovere and Skinner, 2012), [20] and the Health Consumer Powerhouse (Björnberg, 2012) have measured access to health care by focusing primarily on wait times. [21] This report includes five indi-cators of access to care (four measuring timeliness, and one measuring finan-cial barriers to access): 1. the percentage of patients who were able to get an appointment on the same/next day when sick; 2. who reported that it was very or somewhat easy to get care after hours; 3. who waited less than four weeks for an appointment with a specialist; 4. who waited less than four months for elective surgery; and 5. who found cost a barrier to access in the past year. [22] Unlike indicators in previous sections, lower rates are preferable for many indicators in this section. However, the performances of countries on each indicator are ordered such that a rank of 1 indicates superior performance on all indicators.
As can be seen in table 7, Canada is ranked 9th (out of 10) for the percent-age of patients able to make a same-day appointment when sick (41%; figure 6a), and ranks 8th (out of 10) for the percentage of patients who report that it is very or somewhat easy to find care after hours (39%).
Canada also ranked worst (10th out of 10) for the percentage of patients who reported waiting four weeks or less for a specialist appointment (38%; figure 6b) and worst (10th out of 10) for the percentage of patients who reported waiting less than four months for elective surgery (62%; figure 6c).
Canada placed at or near the bottom among other countries with universal-access health-care systems on four out of four indicators of timeli-ness of care but fell at the 10-country average on the indicator measuring the percentage of patients (14%; figure 6d) who found cost was a barrier to access, ranking 7th (out of 10).
[20] Barua (2013) also includes wait times for access to new pharmaceuticals.[21] There is an abundance of literature that focuses on the medical and technical relation-ship between resources, use, wait times, and outcomes (which are not examined in this report). Nevertheless, as with the other indicators discussed, this analysis does not make any assertions about the optimal level of accessibility.[22] Readers should exercise caution when interpreting indicators measuring timeliness of care from the Commonwealth Fund’s survey because of the COVID-19 pandemic. Indeed, in their updated ranking of health-care systems, Schneider and colleagues (2021) have chosen not to include these indicators. However, an examination of these indicators reveal that Canada’s ranking is relatively unchanged in comparison to results from the previous 2016 survey. As a result, we include these indicators for a comprehensive gauge of the per-formance of Canada’s health-care system relative to its international peers.

24 • Comparing Performance of Universal Health Care Countries, 2021 • Moir and Barua
fraserinstitute.org
Table 7: Timely access to resources, 2020
Able to make an appointment
on same day when sick
Very or somewhat easy to find care
after hours
Waited less than 4 weeks for an
appointment with a specialist
Waited less than 4 months for
elective surgery
Found cost a barrier to access
in past year
% Rank (out of 10)
% Rank (out of 10)
% Rank (out of 10)
% Rank (out of 10)
% Rank (out of 10)
Australia 66 3 56 3 54 5 72 6 21 9
Austria — — — — — — — — — —
Belgium — — — — — — — — — —
Canada 41 9 39 8 38 10 62 10 14 7
Czech Republic — — — — — — — — — —
Denmark — — — — — — — — — —
Finland — — — — — — — — — —
France 55 5 43 6 45 6 90 3 11 4
Germany 76 1 47 5 67 3 99 1 11 4
Greece — — — — — — — — — —
Iceland — — — — — — — — — —
Ireland — — — — — — — — — —
Israel — — — — — — — — — —
Italy — — — — — — — — — —
Japan — — — — — — — — — —
Korea — — — — — — — — — —
Latvia — — — — — — — — — —
Lithuania — — — — — — — — — —
Luxembourg — — — — — — — — — —
Netherlands 71 2 72 1 69 1 87 4 9 2
New Zealand 63 4 56 3 58 4 76 5 18 8
Norway 52 8 65 2 42 8 71 8 8 1
Portugal — — — — — — — — — —
Slovenia — — — — — — — — — —
Spain — — — — — — — — — —
Sweden 38 10 24 10 42 8 71 8 11 4
Switzerland 54 7 40 7 68 2 94 2 23 10
United Kingdom 55 5 37 9 45 6 72 6 10 3
OECD Average 57 48 53 79 14
Sources: CIHI, 2021; Schneider, Shah, Doty, Tikkanen, Fields, and Williams II, 2021.

Comparing Performance of Universal Health Care Countries, 2021 • Moir and Barua • 25
fraserinstitute.org
Figure 6a: Percentage of patients able to make a same-day appointment when sick, 2020
Sources: CIHI, 2021.
0 20 40 60 80SwedenCanadaNorway
SwitzerlandUnited Kingdom
FranceOECD average
New ZealandAustralia
NetherlandsGermany
Percentage
Figure 6b: Percentage of patients who waited less than 4 weeks for an appointment with specialist, 2020
Sources: CIHI, 2021.
0 10 20 30 40 50 60 70 80CanadaSwedenNorway
United KingdomFrance
OECD averageAustralia
New ZealandGermany
SwitzerlandNetherlands
Percentage
Figure 6c: Percentage of patients who waited less than 4 months for elective surgery, 2020
Sources: CIHI Fund, 2021.
0 20 40 60 80 100CanadaSwedenNorway
United KingdomAustralia
New ZealandOECD average
NetherlandsFrance
SwitzerlandGermany
Percentage

26 • Comparing Performance of Universal Health Care Countries, 2021 • Moir and Barua
fraserinstitute.org
3.4 Clinical performance and qualityWhen assessing indicators of availability of, access to, and use of, resources, it is of critical importance to include as well some measure of clinical performance and quality. The OECD presents a number of indicators measuring different aspects of health-care quality in the areas of primary care, acute care, mental health care, patient safety, patient experiences, and cancer care. This report contains 14 indicators of clinical performance and quality:
• one indicator of primary care—diabetes-related amputation of a lower extremity; [23]
• four indicators of acute care—hip-fracture surgery initiated within 2 days of admission to the hospital, 30-day mortality after admission to hospital for acute myocaridal infarction (AMI), hemorrhagic stroke, and ischemic stroke;
• one indicator of mental health care—in-patient suicide among patients diagnosed with a mental disorder;
• four indicators of cancer care—five-year survival rates for breast, cervical, colon, and rectal cancers; and
• two indicators of patient safety—obstetric trauma during a vaginal delivery, with an instrument and without an instrument.
[23] Amputation of a lower extremity “is a significant complication of diabetes that is costly to individuals economically, socially and psychologically” (Buckley, Kearns, Kearney, Perry, and Bradley, 2014: 1). It is considered to be a preventable complication and, hence, reflective of the quality of care provided by a health-care system.
Figure 6d: Percentage of patients who found cost a barrier to access in the past year, 2020
Sources: Schneider et al., 2021.
0 5 10 15 20 25Switzerland
AustraliaNew Zealand
CanadaOECD average
SwedenGermany
FranceUnited Kingdom
NetherlandsNorway
Percentage

Comparing Performance of Universal Health Care Countries, 2021 • Moir and Barua • 27
fraserinstitute.org
The indicators included in this report were chosen based on the assessment by Barua, Timmermans, Nason, and Esmail (2016) of how closely each indicator reflects direct intervention by the health-care system, whether data is available for Canada, and the novelty of information conveyed by the indicator. For example, hospital admission rates for asthma are not included since these may largely reflect genetic and environmental factors. [24] On the other hand, the age-sex standard-ized mortality rate (per 100 patients) within 30 days after admission to a hospital for an acute myocardial infarction is included. Not only does this account for the prevalence of the disease but it more closely “reflects the processes of care, such as timely transport of patients and effective medical interventions” and is “influ-enced by not only the quality of care provided in hospitals but also differences in hospital transfers, average length of stay and AMI severity” (OECD 2015: 138).
While the absolute rate for each indicator is presented in table 8a and table 8b (pp. 30–33), each country’s relative performance is based on the upper and lower confidence intervals of that rate (calculated by the OECD) in rela-tion to the calculated average range for the included OECD countries for nine of the 12 indicators used in this section. Further, while lower rates are prefer-able for certain indicators, the performances of countries on each indicator are ordered such that a rank of 1 indicates superior performance on all indicators.
Primary careCanada ranks 19th (out of 24) for performance on the indicator measuring the rate of diabetes-related lower extremity amputation, which is statistically worse than the average range for the OECD countries included for comparison (table 8a).
Acute careCanada ranks 6th (out of 22) for the rate of hip-fracture surgery initiated within 48 hours after admission to the hospital. Canada ranks 9th (out of 27) for per-formance on the indicator measuring 30-day mortality after admission to hos-pital for AMI (statistically better than average), 17th (out of 27) for perform-ance on the indicator measuring 30-day mortality after admission to hospital for a hemorrhagic stroke (not statistically different from the average), and 17th (out of 27) for performance on the indicator measuring 30-day mortality after admission to hospital for an ischemic stroke (not statistically different from the average) (table 8a).
Mental health careThe OECD reports a rate of 0.06% for in-patient suicides among patients diag-nosed with a mental disorder in Canada (not statistically different from the average). This performance ranks Canada 12th out of 18 (table 8a).
[24] The OECD (2015) notes that disease prevalence may explain some (though not all) of the cross-country variation in these rates.

28 • Comparing Performance of Universal Health Care Countries, 2021 • Moir and Barua
fraserinstitute.org
Table 8a: Clinical performance and quality, 2019: primary care, acute care, mental health care Table 8a, continued
Diabetes lower extremity amputation
Hip-fracture surgery initiated within 48 hours after admission
to the hospital
Admission-based AMI 30-day in-hospital mortality
Admission-based hemorrhagic stroke
30-day in-hospital mortality
Admission-based ischemic stroke
30-day in-hospital mortality
In-patient suicide among patients diagnosed
with a mental disorder Age-sex standardized
rate per 100,000; 15 years and older
Rank (out of 24)
Crude rate per 100 patients;
65 years and older
Rank (out of 22)
Age-sex standardized rate per 100 patients;
45 years and older
Rank (out of 27)
Age-sex standardized rate per 100 patients;
45 years and older
Rank (out of 27)
Age-sex standardized rate per 100 patients;
45 years and older
Rank (out of 27)
Age-sex standardized rate per 100 patients;
15 years and older
Rank (out of 18)
Australia 4.0 b 9 — — 3.2 b 2 Australia 19.9 a 10 5.4 b 7 — —
Austria 11.4 w 23 90.2 10 5.2 a 12 Austria 18.4 b 8 6.1 b 11 — —
Belgium 3.4 b 7 87.0 14 6.4 a 16 Belgium 26.4 w 23 7.9 a 19 0.06 a 12
Canada 6.9 w 19 93.1 6 4.6 b 9 Canada 23.6 a 17 7.5 a 17 0.06 a 12
Czech Republic — — 80.9 16 7 w 20 Czech Republic 25.8 w 22 10.3 w 24 0.00 b 1
Denmark 6.6 a 18 97.6 1 4.5 b 8 Denmark 23.9 a 18 4.8 b 5 0.08 a 15
Finland 5.3 a 12 86.8 15 6.8 a 19 Finland 23.4 a 16 8.4 w 20 0.05 a 11
France 4.3 b 11 — — 5.6 a 15 France 22.4 a 14 7.1 a 16 — —
Germany 7.9 w 21 92.1 7 8.3 w 22 Germany 22.0 a 13 6.2 b 12 — —
Greece — — — — — — Greece — — — — — —
Iceland 1.2 b 1 95.2 4 2.0 b 1 Iceland 8.7 b 1 3.9 b 4 0.14 a 17
Ireland 3.1 b 5 87.5 13 4.7 b 10 Ireland 23.0 a 15 6.7 a 15 — —
Israel 17.6 w 24 88.1 12 5.3 a 13 Israel 20.4 a 11 5.8 b 10 0.08 a 15
Italy 2.4 b 3 69.7 18 5.4 b 14 Italy 19.8 b 9 6.3 b 13 — —
Japan — — — — 9.7 w 26 Japan 11.9 b 2 3.0 b 1 — —
Korea 2.2 b 2 — — 8.9 w 24 Korea 15.4 b 4 3.5 b 2 — —
Latvia 5.5 a 14 35.0 22 14.4 w 27 Latvia 40.0 w 27 19.6 w 27 0.00 b 1
Lithuania 6.3 a 17 64.9 19 9.3 w 25 Lithuania 32.3 w 26 12.4 w 26 0.01 b 4
Luxembourg 5.7 a 15 — — 8.5 a 23 Luxembourg 17.8 a 7 7.5 a 17 — —
Netherlands 4.1 b 10 96.0 3 3.5 b 4 Netherlands 24.6 a 19 5.3 b 6 0.03 a 9
New Zealand 5.9 a 16 92.0 8 4.3 b 7 New Zealand 20.9 a 12 6.5 a 14 0.03 a 9
Norway 5.4 a 13 96.6 2 3.2 b 2 Norway 15.8 b 6 3.8 b 3 0.02 b 7
Portugal 11.2 w 22 41.5 21 7.3 w 21 Portugal 24.6 a 19 9.8 w 23 0.01 b 4
Slovenia — — 70.9 17 4.2 b 6 Slovenia 25.1 a 21 10.8 w 25 0.06 a 12
Spain 7.0 w 20 55.6 20 6.5 a 17 Spain 27.7 w 25 9.3 w 22 0.02 b 7
Sweden 3.7 b 8 93.7 5 3.5 b 4 Sweden 15.3 b 3 5.4 b 7 0.36 w 18
Switzerland 3.1 b 5 90.8 9 5.1 b 11 Switzerland 15.4 b 4 5.4 b 7 0.01 b 4
United Kingdom 3.0 b 4 88.7 11 6.6 a 18 United Kingdom 27.5 w 24 9.0 w 21 0.00 b 1
OECD Average 5.7 81.5 6.1 OECD Average 21.9 7.3 0.06
Note: w = statistically worse than average; b = statistically better than average; a = not statistically different from average. Calculations by authors based on the upper and lower confidence intervals of each country in relation to the average upper and lower confidence intervals of all countries in each group.
Source: OECD, 2021; calculations by authors.

Comparing Performance of Universal Health Care Countries, 2021 • Moir and Barua • 29
fraserinstitute.org
Table 8a: Clinical performance and quality, 2019: primary care, acute care, mental health care Table 8a, continued
Diabetes lower extremity amputation
Hip-fracture surgery initiated within 48 hours after admission
to the hospital
Admission-based AMI 30-day in-hospital mortality
Admission-based hemorrhagic stroke
30-day in-hospital mortality
Admission-based ischemic stroke
30-day in-hospital mortality
In-patient suicide among patients diagnosed
with a mental disorder Age-sex standardized
rate per 100,000; 15 years and older
Rank (out of 24)
Crude rate per 100 patients;
65 years and older
Rank (out of 22)
Age-sex standardized rate per 100 patients;
45 years and older
Rank (out of 27)
Age-sex standardized rate per 100 patients;
45 years and older
Rank (out of 27)
Age-sex standardized rate per 100 patients;
45 years and older
Rank (out of 27)
Age-sex standardized rate per 100 patients;
15 years and older
Rank (out of 18)
Australia 4.0 b 9 — — 3.2 b 2 Australia 19.9 a 10 5.4 b 7 — —
Austria 11.4 w 23 90.2 10 5.2 a 12 Austria 18.4 b 8 6.1 b 11 — —
Belgium 3.4 b 7 87.0 14 6.4 a 16 Belgium 26.4 w 23 7.9 a 19 0.06 a 12
Canada 6.9 w 19 93.1 6 4.6 b 9 Canada 23.6 a 17 7.5 a 17 0.06 a 12
Czech Republic — — 80.9 16 7 w 20 Czech Republic 25.8 w 22 10.3 w 24 0.00 b 1
Denmark 6.6 a 18 97.6 1 4.5 b 8 Denmark 23.9 a 18 4.8 b 5 0.08 a 15
Finland 5.3 a 12 86.8 15 6.8 a 19 Finland 23.4 a 16 8.4 w 20 0.05 a 11
France 4.3 b 11 — — 5.6 a 15 France 22.4 a 14 7.1 a 16 — —
Germany 7.9 w 21 92.1 7 8.3 w 22 Germany 22.0 a 13 6.2 b 12 — —
Greece — — — — — — Greece — — — — — —
Iceland 1.2 b 1 95.2 4 2.0 b 1 Iceland 8.7 b 1 3.9 b 4 0.14 a 17
Ireland 3.1 b 5 87.5 13 4.7 b 10 Ireland 23.0 a 15 6.7 a 15 — —
Israel 17.6 w 24 88.1 12 5.3 a 13 Israel 20.4 a 11 5.8 b 10 0.08 a 15
Italy 2.4 b 3 69.7 18 5.4 b 14 Italy 19.8 b 9 6.3 b 13 — —
Japan — — — — 9.7 w 26 Japan 11.9 b 2 3.0 b 1 — —
Korea 2.2 b 2 — — 8.9 w 24 Korea 15.4 b 4 3.5 b 2 — —
Latvia 5.5 a 14 35.0 22 14.4 w 27 Latvia 40.0 w 27 19.6 w 27 0.00 b 1
Lithuania 6.3 a 17 64.9 19 9.3 w 25 Lithuania 32.3 w 26 12.4 w 26 0.01 b 4
Luxembourg 5.7 a 15 — — 8.5 a 23 Luxembourg 17.8 a 7 7.5 a 17 — —
Netherlands 4.1 b 10 96.0 3 3.5 b 4 Netherlands 24.6 a 19 5.3 b 6 0.03 a 9
New Zealand 5.9 a 16 92.0 8 4.3 b 7 New Zealand 20.9 a 12 6.5 a 14 0.03 a 9
Norway 5.4 a 13 96.6 2 3.2 b 2 Norway 15.8 b 6 3.8 b 3 0.02 b 7
Portugal 11.2 w 22 41.5 21 7.3 w 21 Portugal 24.6 a 19 9.8 w 23 0.01 b 4
Slovenia — — 70.9 17 4.2 b 6 Slovenia 25.1 a 21 10.8 w 25 0.06 a 12
Spain 7.0 w 20 55.6 20 6.5 a 17 Spain 27.7 w 25 9.3 w 22 0.02 b 7
Sweden 3.7 b 8 93.7 5 3.5 b 4 Sweden 15.3 b 3 5.4 b 7 0.36 w 18
Switzerland 3.1 b 5 90.8 9 5.1 b 11 Switzerland 15.4 b 4 5.4 b 7 0.01 b 4
United Kingdom 3.0 b 4 88.7 11 6.6 a 18 United Kingdom 27.5 w 24 9.0 w 21 0.00 b 1
OECD Average 5.7 81.5 6.1 OECD Average 21.9 7.3 0.06
Note: w = statistically worse than average; b = statistically better than average; a = not statistically different from average. Calculations by authors based on the upper and lower confidence intervals of each country in relation to the average upper and lower confidence intervals of all countries in each group.
Source: OECD, 2021; calculations by authors.

30 • Comparing Performance of Universal Health Care Countries, 2021 • Moir and Barua
fraserinstitute.org
Table 8b: Clinical performance and quality: cancer care and patient safety Table 8b, continued
Breast cancer Cervical cancer Colon cancer Rectal cancer Obstetric trauma, vaginal delivery with instrument
Obstetric trauma, vaginal delivery without instrument
Five-year net survival, 2010–2014, female, 15 years old and over, age-standardized survival, %
Rank (out of 26)
Five-year net survival, 2010–2014, female, 15 years old and over, age-standardized survival, %
Rank (out of 26)
Five-year net survival, 2010–2014, 15 years
old and over, age-standardized survival, %
Rank (out of 26)
Five-year net survival, 2010–2014, 15 years
old and over, age-standardized survival, %
Rank (out of 26)
Crude rate per 100, 2019, vaginal deliveries;
female; 15 years and older
Rank (out of 20)
Crude rate per 100, 2019, vaginal deliveries;
female; 15 years and older
Rank (out of 20)
Australia 89.5 b 1 66.4 a 14 70.7 b 3 Australia 71.0 b 2 6.2 14 2.4 16
Austria 84.8 a 21 63.9 a 21 63.7 a 15 Austria 64.2 a 14 — — — —
Belgium 86.4 a 14 65.4 a 17 67.9 b 5 Belgium 66.6 b 7 3.4 9 0.7 5
Canada 88.6 b 5 67.3 a 11 67.0 b 8 Canada 67.1 b 6 16.3 20 3.4 20
Czech Republic 81.4 w 24 61.0 w 24 56.1 w 25 Czech Republic 52.3 w 25 — — — —
Denmark 86.1 a 16 69.5 a 6 61.6 a 20 Denmark 64.8 a 10 12.7 19 2.9 19
Finland 88.5 b 6 67.4 a 9 64.9 a 9 Finland 64.4 a 13 2.9 6 1 9
France 86.7 a 11 65.0 a 19 63.7 a 15 France 60.9 a 20 — — — —
Germany 86.0 a 17 65.2 a 18 64.8 a 12 Germany 62.3 a 17 6.4 15 1.5 11
Greece — — — — — — Greece — — — — — —
Iceland 89.1 a 3 80.1 b 1 68.2 a 4 Iceland 63.0 a 15 — — — —
Ireland 82.0 w 23 63.6 a 23 60.5 w 22 Ireland 61.7 a 18 3.7 11 1.5 11
Israel 88.0 b 7 66.6 a 13 71.7 b 2 Israel 67.8 b 4 1.9 2 0.5 3
Italy 86.0 a 17 66.8 a 12 64.2 a 13 Italy 61.3 a 19 2.4 3 0.8 6
Japan 89.4 b 2 71.4 b 4 67.8 b 6 Japan 64.8 a 10 — — — —
Korea 86.6 a 12 77.3 b 2 71.8 b 1 Korea 71.1 b 1 — — — —
Latvia 76.9 w 25 53.9 w 26 48.8 w 26 Latvia 49.5 w 26 3.3 8 0.4 1
Lithuania 73.5 w 26 59.2 w 25 56.9 w 24 Lithuania 52.7 w 24 1.0 1 0.4 1
Luxembourg — — — — — — Luxembourg — — — — — —
Netherlands 86.6 a 12 67.5 a 8 63.1 a 18 Netherlands 65.3 a 9 2.9 6 2.4 16
New Zealand 87.6 a 8 67.4 a 9 64.0 a 14 New Zealand 66.0 a 8 9.3 17 1.8 13
Norway 87.2 a 10 73.2 b 3 64.9 a 9 Norway 68.3 b 3 2.7 4 1.3 10
Portugal 87.6 a 8 66.2 a 15 60.9 w 21 Portugal 59.6 a 22 2.7 4 0.5 3
Slovenia 83.5 a 22 65.5 a 16 61.9 a 19 Slovenia 60.3 a 21 3.4 9 0.8 6
Spain 85.3 a 20 64.6 a 20 63.3 a 17 Spain 59.5 a 23 4.6 12 0.9 8
Sweden 88.8 b 4 68.3 a 7 64.9 a 9 Sweden 64.7 a 12 9.9 18 2.1 14
Switzerland 86.2 a 15 71.4 a 4 67.3 b 7 Switzerland 67.3 b 5 7.3 16 2.1 14
United Kingdom 85.6 a 19 63.8 a 22 60.0 w 23 United Kingdom 62.5 a 16 5.8 13 2.4 16
OECD Average 85.7 66.8 63.9 OECD Average 63.0 5.4 1.5
Note: w = statistically worse than average; b = statistically better than average; a = not statistically different from average. Calculations by authors based on the upper and lower confidence intervals of each country in relation to the average upper and lower confidence intervals of all countries in each group.
Sources: OECD, 2021; calculations by authors.

Comparing Performance of Universal Health Care Countries, 2021 • Moir and Barua • 31
fraserinstitute.org
Table 8b: Clinical performance and quality: cancer care and patient safety Table 8b, continued
Breast cancer Cervical cancer Colon cancer Rectal cancer Obstetric trauma, vaginal delivery with instrument
Obstetric trauma, vaginal delivery without instrument
Five-year net survival, 2010–2014, female, 15 years old and over, age-standardized survival, %
Rank (out of 26)
Five-year net survival, 2010–2014, female, 15 years old and over, age-standardized survival, %
Rank (out of 26)
Five-year net survival, 2010–2014, 15 years
old and over, age-standardized survival, %
Rank (out of 26)
Five-year net survival, 2010–2014, 15 years
old and over, age-standardized survival, %
Rank (out of 26)
Crude rate per 100, 2019, vaginal deliveries;
female; 15 years and older
Rank (out of 20)
Crude rate per 100, 2019, vaginal deliveries;
female; 15 years and older
Rank (out of 20)
Australia 89.5 b 1 66.4 a 14 70.7 b 3 Australia 71.0 b 2 6.2 14 2.4 16
Austria 84.8 a 21 63.9 a 21 63.7 a 15 Austria 64.2 a 14 — — — —
Belgium 86.4 a 14 65.4 a 17 67.9 b 5 Belgium 66.6 b 7 3.4 9 0.7 5
Canada 88.6 b 5 67.3 a 11 67.0 b 8 Canada 67.1 b 6 16.3 20 3.4 20
Czech Republic 81.4 w 24 61.0 w 24 56.1 w 25 Czech Republic 52.3 w 25 — — — —
Denmark 86.1 a 16 69.5 a 6 61.6 a 20 Denmark 64.8 a 10 12.7 19 2.9 19
Finland 88.5 b 6 67.4 a 9 64.9 a 9 Finland 64.4 a 13 2.9 6 1 9
France 86.7 a 11 65.0 a 19 63.7 a 15 France 60.9 a 20 — — — —
Germany 86.0 a 17 65.2 a 18 64.8 a 12 Germany 62.3 a 17 6.4 15 1.5 11
Greece — — — — — — Greece — — — — — —
Iceland 89.1 a 3 80.1 b 1 68.2 a 4 Iceland 63.0 a 15 — — — —
Ireland 82.0 w 23 63.6 a 23 60.5 w 22 Ireland 61.7 a 18 3.7 11 1.5 11
Israel 88.0 b 7 66.6 a 13 71.7 b 2 Israel 67.8 b 4 1.9 2 0.5 3
Italy 86.0 a 17 66.8 a 12 64.2 a 13 Italy 61.3 a 19 2.4 3 0.8 6
Japan 89.4 b 2 71.4 b 4 67.8 b 6 Japan 64.8 a 10 — — — —
Korea 86.6 a 12 77.3 b 2 71.8 b 1 Korea 71.1 b 1 — — — —
Latvia 76.9 w 25 53.9 w 26 48.8 w 26 Latvia 49.5 w 26 3.3 8 0.4 1
Lithuania 73.5 w 26 59.2 w 25 56.9 w 24 Lithuania 52.7 w 24 1.0 1 0.4 1
Luxembourg — — — — — — Luxembourg — — — — — —
Netherlands 86.6 a 12 67.5 a 8 63.1 a 18 Netherlands 65.3 a 9 2.9 6 2.4 16
New Zealand 87.6 a 8 67.4 a 9 64.0 a 14 New Zealand 66.0 a 8 9.3 17 1.8 13
Norway 87.2 a 10 73.2 b 3 64.9 a 9 Norway 68.3 b 3 2.7 4 1.3 10
Portugal 87.6 a 8 66.2 a 15 60.9 w 21 Portugal 59.6 a 22 2.7 4 0.5 3
Slovenia 83.5 a 22 65.5 a 16 61.9 a 19 Slovenia 60.3 a 21 3.4 9 0.8 6
Spain 85.3 a 20 64.6 a 20 63.3 a 17 Spain 59.5 a 23 4.6 12 0.9 8
Sweden 88.8 b 4 68.3 a 7 64.9 a 9 Sweden 64.7 a 12 9.9 18 2.1 14
Switzerland 86.2 a 15 71.4 a 4 67.3 b 7 Switzerland 67.3 b 5 7.3 16 2.1 14
United Kingdom 85.6 a 19 63.8 a 22 60.0 w 23 United Kingdom 62.5 a 16 5.8 13 2.4 16
OECD Average 85.7 66.8 63.9 OECD Average 63.0 5.4 1.5
Note: w = statistically worse than average; b = statistically better than average; a = not statistically different from average. Calculations by authors based on the upper and lower confidence intervals of each country in relation to the average upper and lower confidence intervals of all countries in each group.
Sources: OECD, 2021; calculations by authors.

32 • Comparing Performance of Universal Health Care Countries, 2021 • Moir and Barua
fraserinstitute.org
Cancer careCanada ranks 5th (out of 26) on the indicator measuring the rate of 5-year sur-vival after treatment for breast cancer (statistically better than average), 11th (out of 26) for the rate of 5-year survival after treatment for cervical cancer (not statistically different from the average), 8th (out of 26) for the rate of 5-year survival after treatment for colon cancer (statistically better than average), and 6th (out of 26) for the rate of 5-year survival after treatment for rectal cancer (statistically better than average) (table 8b).
Patient safetyCanada ranks 20th (out of 20) for its performance on the indicator measuring obstetric trauma during a vaginal delivery with an instrument, and 20th (out of 20) for its performance on the indicator measuring obstetric trauma during a vaginal delivery without an instrument (table 8b).
While Canada does well on five indicators of clinical performance and quality, its performance on the other seven is either average or poor.

Comparing Performance of Universal Health Care Countries, 2021 • Moir and Barua • 33
fraserinstitute.org
4 Health status and outcomes
As can be seen in figure 1 (p. 3), the literature suggests that achieving a cer-tain health status—the health outcome for a population—, though of great interest and importance, is a product of both medical and non-medical determinants of health and is thus not necessarily a good measure of the performance of a health system (Arah, Westert, Hurst, and Klazinga, 2006; Rovere and Skinner, 2012; Skinner, 2009). In fact, much research seems to indicate that the health outcomes for a population are not correlated to spending on medical care or the type of health-insurance system (Centre for International Statistics, 1998). Indeed, “factors such as clean water, proper sanitation, and good nutrition, along with additional environmental, eco-nomic, and lifestyle dimensions, are considerably more important in deter-mining the outcomes a country experiences … The actual contribution of medical and clinical services is usually considered to be in the range of 10 up to 25 per cent of observed outcome” (Figueras, Saltman, Busse, and Dubois, 2004: 83, citing Bunker, Frazier, and Mosteller, 1995; McKeown, 1976; Or, 1997).
However, such indicators (for example, life expectancy, mortality rates) are nevertheless widely used to provide a related view of how well a health-care system may be performing its objectives. Further, while it is clear that life expectancy is not completely determined by access to high-quality health care, it is also true that longer life spans would not be as likely without these services (Esmail and Walker, 2008). Therefore, in order to provide a more complete (if only related) picture of how well each country’s health-care system performs, we include five indicators of health status and outcomes: 1. life expectancy (LE) at birth; 2. healthy-age life expectancy (HALE); 3. infant mortality; 4. perinatal mortality; and 5. treatable mortality. Four of these indicators were previously used by Esmail and Walker (2008).
Measures of longevityPerhaps the most commonly used measure of health status is life expectancy at birth, that is, the average number of years a person can be expected to live assuming age-specific mortality levels remain constant (OECD, 2015). Canada ranks 15th (out of 28) for its performance on the indicator measuring life expectancy at birth (calculated by the OECD) (table 9). The WHO calcu-lates a related measure called healthy life expectancy (HALE) that reflects

34 • Comparing Performance of Universal Health Care Countries, 2021 • Moir and Barua
fraserinstitute.org
Table 9: Health Status— life expectancy at birth, healthy life expectancy, infant and perinatal mortality, and treatable mortality
Life expectancy at birth (LE),
2019
Healthy life expectancy (HALE),
2019
Infant mortality rate, 2019
Perinatal mortality rate, 2019
Treatable mortality rate, 2017
Years Rank (out of 28)
Years Rank (out of 28)
Deaths per 1,000 live
births
Rank (out of 28)
Deaths per 1,000 total
births
Rank (out of 28)
* SDRs per 100,000
Rank (out of 28)
Australia 83.0 8 70.9 18 3.3 17 7.8 25 48.0 5
Austria 82.0 19 70.9 18 2.9 13 5 14 57.0 16
Belgium 82.1 15 70.6 23 3.7 22 6.9 24 54.0 13
Canada 82.1 15 71.3 13 4.4 26 5.7 20 56.0 14
Czech Republic 79.3 26 68.8 26 2.6 8 3.6 8 95.0 26
Denmark 81.5 23 71.0 15 3.0 14 4.1 9 56.0 14
Finland 82.1 15 71.0 15 2.1 4 3.3 6 57.0 16
France 82.9 10 72.1 5 3.8 25 10.4 27 48.0 5
Germany 81.4 24 70.9 18 3.2 16 5.9 21 64.0 21
Greece 81.7 21 70.9 18 3.7 22 5.1 15 73.0 25
Iceland 83.2 6 72.0 7 1.1 1 2.9 4 44.0 2
Ireland 82.8 12 71.1 14 2.8 11 5.5 19 65.0 22
Israel 82.9 10 72.4 4 3.1 15 5.1 15 59.0 19
Italy 83.6 4 71.9 8 2.4 7 4.1 9 52.0 11
Japan 84.4 1 74.1 1 1.9 2 2.3 1 48.0 5
Korea 83.3 5 73.1 2 2.7 10 2.7 2 45.0 3
Latvia 75.5 28 66.2 28 3.4 20 4.1 9 151.0 28
Lithuania 76.4 27 66.7 27 3.3 17 5.4 18 141.0 27
Luxembourg 82.7 13 71.6 10 4.7 27 11.6 28 53.0 12
Netherlands 82.2 14 71.4 11 3.6 21 5.1 15 49.0 8
New Zealand 82.1 15 70.2 24 4.7 27 9.1 26 62.0 20
Norway 83.0 8 71.4 11 2.0 3 3 5 47.0 4
Portugal 81.8 20 71.0 15 2.8 11 3.5 7 66.0 23
Slovenia 81.6 22 70.7 22 2.1 4 2.7 2 57.0 16
Spain 83.9 3 72.1 5 2.6 8 4.4 13 51.0 9
Sweden 83.2 6 71.9 8 2.1 4 4.2 12 51.0 9
Switzerland 84.0 2 72.5 3 3.3 17 6.3 23 39.0 1
United Kingdom 81.3 25 70.1 25 3.7 22 6.1 22 69.0 24
OECD Average 82.0 71.0 3.0 5.2 62.8
Note: * SDR = Age-standardized death rates.Source: OECD, 2021; WHO, 2021; calculations by authors

Comparing Performance of Universal Health Care Countries, 2021 • Moir and Barua • 35
fraserinstitute.org
how long individuals in a country will live in a good state of health (or not in a poor state of health). [25] Canada ranks 13th (out of 28) for its performance on this indicator.
These two measures can be combined to determine the number of years lost to illness or the percentage of expected lifetime that individuals can expect to live in full health. This measure (HALE⁄LE) may allow some additional insight into the ability of the health-care system to provide care for individuals who may as a result of their illnesses soon endure a significantly negative effect on their standard of living. Canada ranks 10th (out of 28) on this measure.
Measures of mortalityThe diametric opposite of measures of the length of life and the proportion of that lifetime that can be enjoyed in full health are measures of mortality. The most basic measures of mortality commonly used to compare health status are infant and perinatal mortality rates. Though these mortality statistics can be affected by immigration from poor countries, unhealthy outlier populations, and other population demographics (Seeman, 2003), they can also serve as indicators of a well-functioning health-care system. Zeynep Or notes that these mortality statistics are a useful way to gauge the performance of a health-care system since “the performance of a health system is often judged by its cap-acity to prevent deaths at the youngest ages” and notes that perinatal mortality is an important indicator of “effectiveness of health care interventions during pregnancy and childbirth” (2001: 8). Canada ranks 26th (out of 28) for its per-formance on the indicator measuring infant mortality (figure 7a), and 20th (out of 28 for perinatal mortality (table 9).
Adjusted measures of mortalityUnfortunately, the use of HALE, LE, and infant and perinatal mortality as measures of the effectiveness of a health system includes a number of effects that are not related to the health system. Measures such as crime rates, pol-lution, water quality, and public sanitation systems affect life expectancy in addition to those directly related to the health-care systems that have been compared in this report. A potentially finer way of breaking down mortality is to use the treatable-mortality measure recently adopted by the OECD. In 2018, the OECD and other partners developed a new list of treatable and prevent-able mortality. These lists were built on the work of Nolte and Mckee (2004,
[25] Since the publication of last year’s report (2020), the WHO has made retrospective changes in how HALE data from previous years has been reported. As a result, readers should exercise caution when interpreting these result and rankings, particularly when comparing them to previous iterations of this report.

36 • Comparing Performance of Universal Health Care Countries, 2021 • Moir and Barua
fraserinstitute.org
2011); these two studies formed the basis of the measure, Mortality Amenable to Health Care, found in previous versions of this report. According to the OECD, the measure of treatable mortality focuses on “[c]auses of death that can be mainly avoided through timely and effective health care interventions, including secondary prevention such as screening, and treatment (i.e., after the onset of diseases, to reduce case-fatality)” (OECD, 2020: 1). The list of dis-eases included, their corresponding ICD-10 codes, their age thresholds, and the rationale for their inclusion are available in the OECD’s documentation (OECD, 2019a). The OECD draws data from the WHO Mortality Database when making this calculation, and reports these data as both “absolute num-bers and as standardized death rates according to age” (OECD, 2020: 1). While the measure used in previous versions of this report (mortality amenable to health care) included codes with a variety of age ranges for specific illnesses, the list used for this measure (treatable mortality) uses a single age band of 0–74 for all included ICD-10 codes.
Table 9 presents the available data for Treatable Mortality for the cat-egories of illness presented in table 10. Canada ranked 14th for its perform-ance on the indicator measuring treatable mortality among the 28 countries ranked (figure 7b).
Figure 7a: Infant mortality per thousand live births, 2019 or most recent
Sources: OECD, 2021; calculations by authors.
0 1 2 3 4 5New ZealandLuxembourg
CanadaFrance
United KingdomGreece
BelgiumNetherlands
LatviaSwitzerland
LithuaniaAustraliaGermany
IsraelOECD average
DenmarkAustria
PortugalIrelandKoreaSpain
Czech RepublicItaly
SwedenSloveniaFinlandNorway
JapanIceland
Per thousand live births

Comparing Performance of Universal Health Care Countries, 2021 • Moir and Barua • 37
fraserinstitute.org
Table 10: Cause of death considered treatable by health care
Infectious diseases Diseases of the digestive systemTuberculosis (50%) Gastric and duodenal ulcerScarlet fever AppendicitisSepsis Abdominal herniaCellulitis Cholelithiasis and cholecystitisLegionnaires disease Other diseases of gallbladder or biliary tractStreptococcal and enterococci infection Diseases of the digestive systemOther meningitis Gastric and duodenal ulcerMeningitis due to other and unspecified causes Appendicitis
Cancer Abdominal hernia
Cervical cancer (50%) Cholelithiasis and cholecystitisColorectal cancer Other diseases of gallbladder or biliary tractBreast cancer (female only) Acute pancreatitisUterus cancer Other diseases of pancreasTesticular cancer Diseases of the genitourinary systemThyroid cancer Nephritis and nephrosisHodgkin's disease Obstructive uropathyLymphoid leukaemia Renal failureBenign neoplasm Renal colic
Endocrine and metabolic diseases Disorders resulting from renal tubular dysfunction
Diabetes mellitus (50%) Unspecified contracted kidney, small kidney of unknown causeThyroid disorders Inflammatory diseases of genitourinary systemAdrenal disorders Prostatic hyperplasia
Diseases of the nervous system Pregnancy, childbirth, and pernatal periodEpilepsy Pregnancy, childbirth and the puerperium
Diseases of the circulatory system Certain conditions originating in the perinatal period
Aortic aneurysm (50%) Congenital malformationsHypertensive diseases (50%) Congenital malformations of the circulatory system (heart defects)Ischaemic heart diseases (50%) Adverse effects of medical and surgical careCerebrovascular diseases (50%) Drugs, medicaments and biological substances causing
adverse effects in therapeutic use*Other atherosclerosis (50%)Rheumatic and other heart disease Misadventures to patients during surgical and medical care*Venous thromboembolism* Medical devices associated with adverse incidents in
diagnostic and therapeutic use*Diseases of the respiratory systemUpper respiratory infectionsPneumonia, not elsewhere classified or organism unspecifiedAcute lower respiratory infectionsAsthma and bronchiectasisAdult respiratory distress syndromePulmonary oedemaAbscess of lung and mediastinum pyothoraxOther pleural disorders
Note *: Some of these conditions that are mainly acquired when people are hospitalized or in contact with health services might also be considered to be preventable, in the sense that the incidence of these health-care-associated infections or health problems might be re-duced through greater prevention in health-care facilities.Source: adapted from OECD, 2019a.

38 • Comparing Performance of Universal Health Care Countries, 2021 • Moir and Barua
fraserinstitute.org
Figure 7b: Treatable mortality, 2017
Sources: OECD, 2021; calculations by authors.
0 40 80 120 160Latvia
LithuaniaCzech Republic
GreeceUnited Kingdom
PortugalIreland
GermanyOECD average
New ZealandIsrael
SloveniaFinlandAustria
DenmarkCanadaBelgium
LuxembourgItaly
SwedenSpain
NetherlandsJapan
FranceAustraliaNorway
KoreaIceland
Switzerland
Deaths per 100,000 population (standardized rates)

Comparing Performance of Universal Health Care Countries, 2021 • Moir and Barua • 39
fraserinstitute.org
Conclusion
Canada spends more on health care than the majority of high-income OECD countries with universal health-care systems. After adjustment for age, Canada’s expenditure on health care as a percentage of GDP ranks as 2nd highest and its health-care expenditure per capita (out of 28), 8th highest. Despite this level of spending, Canada has significantly fewer physicians, acute-care beds, and psychiatric beds per thousand compared to the average OECD country—though it ranks close to the average for nurses and above average for long-term care beds per thousand over the age of 65. Further, while Canada performs well on Gamma-camera density (per million population), it has fewer other med-ical technologies than the average high-income OECD country with universal health care for which comparable inventory data is available.
Canada’s performance is mixed for use of resources, performing higher rates than the average OECD country on less than half the indicators exam-ined (for example, cataract surgeries and knee replacements), and average to lower rates on the rest. Canada reports the least hospital activity (as measured by curative-care discharge rates) in the group of countries studied.
Canada ranked last (or close to last) on four of the four indicators of timeliness of care; and ranked seventh (out of ten) on the indicator measur-ing the percentage of patients who reported that cost was a barrier to access.
Finally, while Canada does well on five indicators of clinical perform-ance and quality (such as rates of survival for breast, colon, and rectal can-cers), its performance on the seven others are either no different from the average or in some cases—particularly obstetric trauma and diabetes related amputations—worse.
Canada ranks among the most expensive universal health-care systems in the OECD. However, its performance for availability and access to resources is generally below that of the average OECD country, while its performance for use of resources and quality and clinical performance is mixed. Clearly, there is an imbalance between the value Canadians receive and the relatively high amount of money they spend on their health-care system.

40 / fraserinstitute.org

Comparing Performance of Universal Health Care Countries, 2021 • Moir and Barua • 41
fraserinstitute.org
Appendix—additional tables and data
Table A1. Health-care spending, 2019 / 42
Table A2. Availability of human and capital resources, per thousand population, 2019 / 43
Table A3. Availability of technological and diagnostic imaging resources, per million population, 2019 / 44
Table A4. Use of resources, 2019 / 45
Table A5. Use of resources, by specialty, per 100,000 population, age-adjusted, 2019 / 46–47
Table A6. Use of resources, by specialty, per 100,000 population, 2019 / 48–49

42 • Comparing Performance of Universal Health Care Countries, 2021 • Moir and Barua
fraserinstitute.org
Table A1: Health-care spending, 2019
Spending as percentage of GDP Spending per capita
Percentage Rank (out of 28) US$ PPP Rank (out of 28)
Australia 9.4 14 4,919.2 13
Austria 10.4 9 5,705.1 5
Belgium 10.7 7 5,458.4 8
Canada 10.8 6 5,370.4 10
Czech Republic 7.8 23 3,417.5 21
Denmark 10.0 12 5,477.6 7
Finland 9.2 15 4,561.5 15
France 11.1 3 5,274.3 11
Germany 11.7 1 6,518.0 3
Greece 7.8 22 2,319.0 27
Iceland 8.6 19 4,540.8 16
Ireland 6.7 27 5,083.2 12
Israel 7.5 24 2,903.4 25
Italy 8.7 18 3,653.4 19
Japan 11.0 4 4,691.5 14
Korea 8.2 21 3,406.3 22
Latvia 6.7 26 2,074.0 28
Lithuania 7.0 25 2,727.2 26
Luxembourg 5.4 28 5,414.5 9
Netherlands 10.2 10 5,739.2 4
New Zealand 9.1 17 4,211.9 18
Norway 10.5 8 6,744.6 2
Portugal 9.5 13 3,347.4 23
Slovenia 8.5 20 3,303.5 24
Spain 9.1 16 3,600.3 20
Sweden 10.9 5 5,551.9 6
Switzerland 11.3 2 7,138.1 1
United Kingdom 10.2 11 4,500.1 17
OECD average 9.2 4,559.0
Source: OECD, 2021; calculations by authors.

Comparing Performance of Universal Health Care Countries, 2021 • Moir and Barua • 43
fraserinstitute.org
Table A2: Availability of human and capital resources per thousand population, 2019
Physicians Nurses Acute beds Psychiatric beds Long-term care beds
per ’000 Rank (out of 28)
per ’000 Rank (out of 28)
per ’000 Rank (out of 26)
per ’000 Rank (out of 28)
per ’000* Rank (out of 24)
Australia 3.83 14 12.22 7 — — 0.4 19 — —
Austria 5.32 2 10.37 14 5.3 4 0.7 14 9.2 11
Belgium 3.16 23 11.07 10 5.0 6 1.4 2 13.0 2
Canada 2.74 26 9.98 18 2.0 25 0.4 22 9.5 10
Czech Republic 4.07 11 8.56 19 4.0 8 0.9 9 8.9 13
Denmark 4.19 10 10.10 17 2.5 21 0.5 18 7.4 19
Finland 3.21 21 14.26 4 2.6 18 0.6 17 12.5 3
France 3.17 22 11.07 10 3.0 15 0.8 10 10.3 8
Germany 4.39 7 13.95 5 6.0 3 1.3 3 11.7 5
Greece 6.16 1 3.38 28 3.6 9 0.7 13 0.9 24
Iceland 3.89 13 15.36 3 2.3 23 0.4 22 7.8 17
Ireland 3.32 17 12.88 6 2.7 16 0.3 26 6.7 20
Israel 3.29 18 5.01 26 2.2 24 0.4 21 2.4 23
Italy 4.05 12 6.16 24 2.6 19 0.1 28 4.5 21
Japan 2.49 27 11.76 8 7.7 1 2.6 1 10.0 9
Korea 2.46 28 7.94 21 7.1 2 1.2 4 9.0 12
Latvia 3.27 19 4.39 27 3.1 14 1.2 5 3.5 22
Lithuania 4.57 5 7.74 22 5.2 5 1.0 7 8.2 15
Luxembourg 2.98 24 11.72 9 3.3 12 0.8 11 11.6 6
Netherlands 3.72 15 10.69 13 2.6 17 0.8 12 14.1 1
New Zealand 3.38 16 10.24 16 2.5 20 0.3 27 8.0 16
Norway 4.97 4 17.88 2 3.1 13 1.0 6 7.5 18
Portugal 5.32 2 7.09 23 3.3 11 0.6 16 — —
Slovenia 3.26 20 10.28 15 4.1 7 0.7 15 10.4 7
Spain 4.40 6 5.89 25 2.5 22 0.4 22 8.9 14
Sweden 4.32 9 10.85 12 1.9 26 0.4 20 — —
Switzerland 4.35 8 17.96 1 3.6 10 0.9 8 11.9 4
United Kingdom 2.95 25 8.20 20 — — 0.4 25 — —
OECD Average 3.83 10.25 3.61 0.8 8.7
Note: This measure takes the raw number of long-term care beds in hospitals and residential facilities in each country, divides each figure by the country’s population in 000’s, and then adds them together.Sources: OECD, 2020/21; calculations by authors.

44 • Comparing Performance of Universal Health Care Countries, 2021 • Moir and Barua
fraserinstitute.org
Table A3: Availability of technological and diagnostic imaging resources, per million population, 2019
MRI Units CT Scanners PET Scanners Gamma Cameras MammographsPer
millionRank
(out of 24)Per
millionRank
(out of 26)Per
millionRank
(out of 24)Per
millionRank
(out of 23)Per
millionRank
(out of 21)
Australia 14.8 15 69.7 2 3.8 5 18.6 2 23.3 9
Austria 25.0 7 28.7 11 2.7 11 10.3 9 21.7 10
Belgium 11.5 20 24.1 14 2.9 9 25.7 1 36.6 3
Canada 10.1 22 14.6 24 1.5 19 15.3 3 17.9 12
Czech Republic 10.4 21 16.4 19 1.6 16 11.4 7 11.5 20
Denmark — — 40.6 5 8.3 1 14.6 4 15.1 17
Finland 28.8 6 16.3 20 3.3 8 7.6 14 28.6 7
France 15.4 12 18.2 18 2.5 12 6.9 16 — —
Germany 34.5 2 35.3 10 — — — — — —
Greece 31.9 4 42.5 4 1.3 21 12.6 5 66.8 1
Iceland 19.4 8 47.2 3 2.8 10 8.3 11 16.6 14
Ireland 16.0 11 21.3 15 1.8 13 5.9 18 16.9 13
Israel 5.1 24 9.7 25 1.6 18 9.2 10 — —
Italy 30.2 5 36.5 9 3.6 7 7.9 13 34.5 4
Japan 55.2 1 111.5 1 4.6 2 11.5 6 34.3 5
Korea 32.0 3 39.6 6 3.7 6 5.9 19 63.4 2
Latvia 15.2 14 37.1 8 1.6 17 3.7 20 27.7 8
Lithuania 14.0 17 26.5 12 0.7 24 2.9 23 15.8 16
Luxembourg 14.5 16 16.1 21 1.6 15 11.3 8 11.3 21
Netherlands 13.8 18 14.9 23 4.5 3 7.4 15 — —
New Zealand 15.3 13 15.3 22 1.0 23 3.6 21 19.5 11
Norway 17.4 10 26.4 13 1.1 22 3.6 22 12.3 19
Portugal — — — — — — — — — —
Slovenia 12.5 19 18.2 17 1.4 20 8.1 12 14.8 18
Spain 17.6 9 19.2 16 1.8 14 6.7 17 16.5 15
Sweden — — — — — — — — — —
Switzerland — — 38.7 7 3.9 4 — — 29.3 6
United Kingdom 7.2 23 9.5 26 — — — — — —
OECD Average 19.5 30.5 2.6 9.5 25.4
Source: OECD 2021; calculations by authors

Comparing Performance of Universal Health Care Countries, 2021 • Moir and Barua • 45
fraserinstitute.org
Table A4: Use of resources, 2019
Doctor consultations Curative-care discharge rates
MRI exams CT exams
Per capita
Rank (out of 26)
Per 100,000
Rank (out of 27)
Per 1,000
Rank (out of 22)
Per 1,000
Rank (out of 22)
Australia 7.3 9 17,315.2 5 51.3 21 140.9 14
Austria 6.6 13 22,425.3 2 148.0 1 196.2 7
Belgium 7.3 9 16,389.9 6 98.1 8 204.9 5
Canada 6.6 13 8,195.1 27 62.0 17 144.2 13
Czech Republic 8.2 7 17,653.2 4 60.1 18 114.1 17
Denmark 4.0 23 — — 89.1 10 184.6 9
Finland 4.4 20 15,469.1 11 53.1 20 67.2 22
France 5.9 16 15,990.0 8 123.1 3 199.0 6
Germany 9.8 4 23,236.3 1 145.1 2 144.7 12
Greece 3.2 25 13,534.7 16 87.4 11 195.4 8
Iceland 5.9 16 10,657.6 23 108.3 6 232.1 2
Ireland 5.8 18 13,297.2 17 — — — —
Israel 8.2 7 14,795.5 13 47.5 22 158.9 11
Italy 10.4 3 10,084.3 25 75.4 13 97.3 19
Japan 12.5 2 12,214.7 20 112.3 5 230.8 3
Korea 17.2 1 16,289.6 7 73.9 14 248.8 1
Latvia 6.1 15 14,015.6 14 69.2 15 184.2 10
Lithuania 9.5 5 21,673.7 3 67.0 16 132.5 15
Luxembourg 5.5 19 13,716.2 15 90.0 9 222.6 4
Netherlands 8.8 6 8,978.3 26 59.5 19 110.9 18
New Zealand 3.8 24 12,749.4 19 — — — —
Norway 4.4 20 15,308.9 12 116.6 4 85.9 20
Portugal — — 10,650.6 24 — — — —
Slovenia 6.7 12 15,725.8 9 80.1 12 84.0 21
Spain 7.3 9 11,371.3 22 99.1 7 124.3 16
Sweden 2.6 26 13,289.1 18 — — — —
Switzerland 4.3 22 15,536.1 10 — — — —
United Kingdom — — 12,164.2 21 — — — —
OECD Average 7.0 14,545.4 87.1 159.3
Source: OECD 2021; calculations by authors
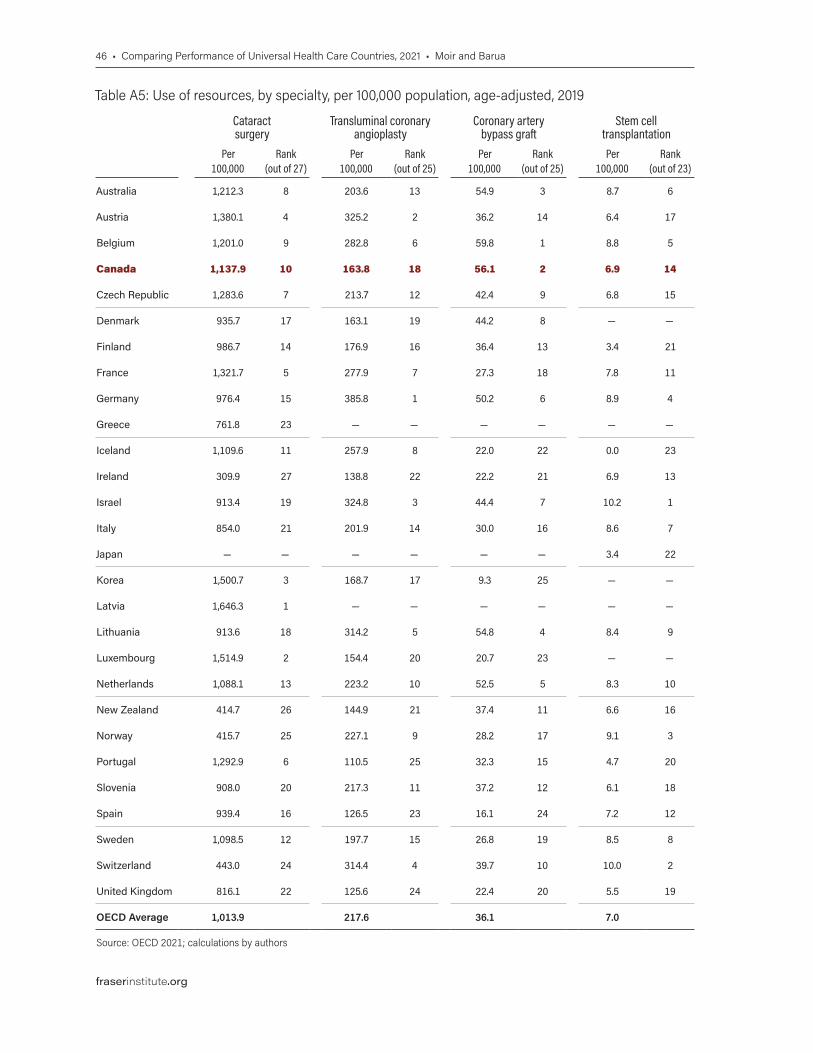
46 • Comparing Performance of Universal Health Care Countries, 2021 • Moir and Barua
fraserinstitute.org
Table A5: Use of resources, by specialty, per 100,000 population, age-adjusted, 2019 Table A5, continued
Cataract surgery
Transluminal coronary angioplasty
Coronary artery bypass graft
Stem cell transplantation
Appendectomy Cholecystectomy Repair of inguinal hernia
Hip replacement
Knee replacement
Per 100,000
Rank (out of 27)
Per 100,000
Rank (out of 25)
Per 100,000
Rank (out of 25)
Per 100,000
Rank (out of 23)
Per 100,000
Rank (out of 26)
Per 100,000
Rank (out of 26)
Per 100,000
Rank (out of 26)
Per 100,000
Rank (out of 26)
Per 100,000
Rank (out of 24
Australia 1,212.3 8 203.6 13 54.9 3 8.7 6 180.9 2 244.8 4 196.3 10 213.9 13 229.9 2
Austria 1,380.1 4 325.2 2 36.2 14 6.4 17 146.4 7 208.3 8 287.4 1 294.5 2 228.3 3
Belgium 1,201.0 9 282.8 6 59.8 1 8.8 5 139.5 9 227.6 5 221.4 7 282.9 4 211.8 6
Canada 1,137.9 10 163.8 18 56.1 2 6.9 14 115.4 18 205.9 10 174.8 15 174.8 19 206.1 8
Czech Republic 1,283.6 7 213.7 12 42.4 9 6.8 15 131.0 14 200.6 11 166.1 17 202.1 14 145.6 13
Denmark 935.7 17 163.1 19 44.2 8 — — 108.9 20 129.0 24 153.3 19 223.3 11 177.2 10
Finland 986.7 14 176.9 16 36.4 13 3.4 21 134.2 11 153.8 19 164.6 18 265.3 6 226.4 4
France 1,321.7 5 277.9 7 27.3 18 7.8 11 102.4 21 183.1 14 224.1 6 242.6 9 178.5 9
Germany 976.4 15 385.8 1 50.2 6 8.9 4 132.5 13 225.1 6 196.0 11 289.6 3 209.1 7
Greece 761.8 23 — — — — — — 76.4 25 250.5 3 214.6 9 46.4 26 — —
Iceland 1,109.6 11 257.9 8 22.0 22 0.0 23 186.7 1 272.0 2 250.6 4 247.1 8 — —
Ireland 309.9 27 138.8 22 22.2 21 6.9 13 156.2 6 109.9 26 82.4 25 144.4 21 56.9 23
Israel 913.4 19 324.8 3 44.4 7 10.2 1 124.2 15 160.2 17 230.4 5 83.3 23 87.1 22
Italy 854.0 21 201.9 14 30.0 16 8.6 7 58.6 26 163.6 16 184.4 14 170.9 20 121.1 21
Japan — — — — — — 3.4 22 — — — — — — — — — —
Korea 1,500.7 3 168.7 17 9.3 25 — — 177.4 3 183.8 13 76.1 26 66.2 25 172.5 11
Latvia 1,646.3 1 — — — — — — — — — — — — — — — —
Lithuania 913.6 18 314.2 5 54.8 4 8.4 9 162.1 5 277.7 1 186.4 13 189.7 16 126.6 19
Luxembourg 1,514.9 2 154.4 20 20.7 23 — — 133.8 12 195.7 12 256.0 3 251.1 7 214.1 5
Netherlands 1,088.1 13 223.2 10 52.5 5 8.3 10 94.5 22 157.2 18 167.4 16 220.0 12 169.6 12
New Zealand 414.7 26 144.9 21 37.4 11 6.6 16 136.8 10 140.8 21 105.6 24 178.9 18 130.6 17
Norway 415.7 25 227.1 9 28.2 17 9.1 3 142.2 8 131.0 23 124.1 22 280.5 5 123.1 20
Portugal 1,292.9 6 110.5 25 32.3 15 4.7 20 83.8 24 142.6 20 142.1 21 82.6 24 56.7 24
Slovenia 908.0 20 217.3 11 37.2 12 6.1 18 116.6 17 221.4 7 188.9 12 193.1 15 132.9 16
Spain 939.4 16 126.5 23 16.1 24 7.2 12 111.5 19 169.8 15 214.8 8 126.3 22 136.3 15
Sweden 1,098.5 12 197.7 15 26.8 19 8.5 8 120.8 16 139.6 22 147.1 20 235.2 10 130.4 18
Switzerland 443.0 24 314.4 4 39.7 10 10.0 2 168.1 4 207.6 9 264.0 2 316.3 1 263.0 1
United Kingdom 816.1 22 125.6 24 22.4 20 5.5 19 84.9 23 126.5 25 114.2 23 183.8 17 143.3 14
OECD Average 1,013.9 217.6 36.1 7.0 127.9 185.7 182.0 200.2 161.5
Source: OECD 2021; calculations by authors

Comparing Performance of Universal Health Care Countries, 2021 • Moir and Barua • 47
fraserinstitute.org
Table A5: Use of resources, by specialty, per 100,000 population, age-adjusted, 2019 Table A5, continued
Cataract surgery
Transluminal coronary angioplasty
Coronary artery bypass graft
Stem cell transplantation
Appendectomy Cholecystectomy Repair of inguinal hernia
Hip replacement
Knee replacement
Per 100,000
Rank (out of 27)
Per 100,000
Rank (out of 25)
Per 100,000
Rank (out of 25)
Per 100,000
Rank (out of 23)
Per 100,000
Rank (out of 26)
Per 100,000
Rank (out of 26)
Per 100,000
Rank (out of 26)
Per 100,000
Rank (out of 26)
Per 100,000
Rank (out of 24
Australia 1,212.3 8 203.6 13 54.9 3 8.7 6 180.9 2 244.8 4 196.3 10 213.9 13 229.9 2
Austria 1,380.1 4 325.2 2 36.2 14 6.4 17 146.4 7 208.3 8 287.4 1 294.5 2 228.3 3
Belgium 1,201.0 9 282.8 6 59.8 1 8.8 5 139.5 9 227.6 5 221.4 7 282.9 4 211.8 6
Canada 1,137.9 10 163.8 18 56.1 2 6.9 14 115.4 18 205.9 10 174.8 15 174.8 19 206.1 8
Czech Republic 1,283.6 7 213.7 12 42.4 9 6.8 15 131.0 14 200.6 11 166.1 17 202.1 14 145.6 13
Denmark 935.7 17 163.1 19 44.2 8 — — 108.9 20 129.0 24 153.3 19 223.3 11 177.2 10
Finland 986.7 14 176.9 16 36.4 13 3.4 21 134.2 11 153.8 19 164.6 18 265.3 6 226.4 4
France 1,321.7 5 277.9 7 27.3 18 7.8 11 102.4 21 183.1 14 224.1 6 242.6 9 178.5 9
Germany 976.4 15 385.8 1 50.2 6 8.9 4 132.5 13 225.1 6 196.0 11 289.6 3 209.1 7
Greece 761.8 23 — — — — — — 76.4 25 250.5 3 214.6 9 46.4 26 — —
Iceland 1,109.6 11 257.9 8 22.0 22 0.0 23 186.7 1 272.0 2 250.6 4 247.1 8 — —
Ireland 309.9 27 138.8 22 22.2 21 6.9 13 156.2 6 109.9 26 82.4 25 144.4 21 56.9 23
Israel 913.4 19 324.8 3 44.4 7 10.2 1 124.2 15 160.2 17 230.4 5 83.3 23 87.1 22
Italy 854.0 21 201.9 14 30.0 16 8.6 7 58.6 26 163.6 16 184.4 14 170.9 20 121.1 21
Japan — — — — — — 3.4 22 — — — — — — — — — —
Korea 1,500.7 3 168.7 17 9.3 25 — — 177.4 3 183.8 13 76.1 26 66.2 25 172.5 11
Latvia 1,646.3 1 — — — — — — — — — — — — — — — —
Lithuania 913.6 18 314.2 5 54.8 4 8.4 9 162.1 5 277.7 1 186.4 13 189.7 16 126.6 19
Luxembourg 1,514.9 2 154.4 20 20.7 23 — — 133.8 12 195.7 12 256.0 3 251.1 7 214.1 5
Netherlands 1,088.1 13 223.2 10 52.5 5 8.3 10 94.5 22 157.2 18 167.4 16 220.0 12 169.6 12
New Zealand 414.7 26 144.9 21 37.4 11 6.6 16 136.8 10 140.8 21 105.6 24 178.9 18 130.6 17
Norway 415.7 25 227.1 9 28.2 17 9.1 3 142.2 8 131.0 23 124.1 22 280.5 5 123.1 20
Portugal 1,292.9 6 110.5 25 32.3 15 4.7 20 83.8 24 142.6 20 142.1 21 82.6 24 56.7 24
Slovenia 908.0 20 217.3 11 37.2 12 6.1 18 116.6 17 221.4 7 188.9 12 193.1 15 132.9 16
Spain 939.4 16 126.5 23 16.1 24 7.2 12 111.5 19 169.8 15 214.8 8 126.3 22 136.3 15
Sweden 1,098.5 12 197.7 15 26.8 19 8.5 8 120.8 16 139.6 22 147.1 20 235.2 10 130.4 18
Switzerland 443.0 24 314.4 4 39.7 10 10.0 2 168.1 4 207.6 9 264.0 2 316.3 1 263.0 1
United Kingdom 816.1 22 125.6 24 22.4 20 5.5 19 84.9 23 126.5 25 114.2 23 183.8 17 143.3 14
OECD Average 1,013.9 217.6 36.1 7.0 127.9 185.7 182.0 200.2 161.5
Source: OECD 2021; calculations by authors

48 • Comparing Performance of Universal Health Care Countries, 2021 • Moir and Barua
fraserinstitute.org
Table A6: Use of resources, by specialty, per 100,000 population, 2019 Table A6, continued
Cataract surgery
Transluminal coronary angioplasty
Coronary artery bypass graft
Stem cell transplantation
Appendectomy Cholecystectomy Repair of inguinal hernia
Hip replacement
Knee replacement
Per 100,000
Rank (out of 27)
Per 100,000
Rank (out of 25)
Per 100,000
Rank (out of 25)
Per 100,000
Rank (out of 23)
Per 100,000
Rank (out of 26)
Per 100,000
Rank (out of 26)
Per 100,000
Rank (out of 26)
Per 100,000
Rank (out of 26)
Per 100,000
Rank (out of 24)
Australia 1,111.2 10 186.6 16 50.3 6 8.0 11 165.8 3 224.4 7 179.9 15 196.1 15 210.7 6
Austria 1,382.1 3 325.7 2 36.3 12 6.4 15 146.6 7 208.6 8 287.8 1 294.9 3 228.6 3
Belgium 1,202.7 8 283.2 6 59.9 1 8.8 4 139.7 9 227.9 6 221.7 6 283.3 5 212.1 5
Canada 1,095.2 12 157.7 18 54.0 4 6.6 14 111.1 19 198.2 11 168.2 18 168.2 19 198.4 7
Czech Republic 1,317.2 7 219.3 12 43.5 8 7.0 13 134.4 12 205.8 9 170.4 16 207.4 13 149.4 13
Denmark 957.3 17 166.9 17 45.2 7 — — 111.4 18 132.0 21 156.8 19 228.4 9 181.3 10
Finland 1,082.8 13 194.1 15 39.9 9 3.7 22 147.3 6 168.8 16 180.6 14 291.1 4 248.5 2
France 1,372.9 4 288.7 5 28.4 17 8.1 10 106.4 20 190.2 12 232.8 4 252.0 7 185.4 9
Germany 1,061.8 14 419.5 1 54.6 3 9.7 3 144.1 8 244.8 3 213.1 9 314.9 1 227.4 4
Greece 841.1 21 — — — — — — 84.4 24 276.6 2 236.9 3 51.2 26 — —
Iceland 962.7 16 223.8 11 19.1 22 0.0 23 162.0 4 236.0 4 217.4 8 214.4 12 — —
Ireland 268.1 27 120.1 25 19.2 21 6.0 17 135.1 11 95.1 26 71.3 25 124.9 22 49.2 24
Israel 741.0 23 263.5 7 36.0 13 8.3 9 100.8 21 130.0 22 186.9 13 67.6 24 70.7 22
Italy 969.2 15 229.1 8 34.1 15 9.8 2 66.5 26 185.7 13 209.3 10 193.9 17 137.4 16
Japan — — — — — — 4.5 21 — — — — — — — — — —
Korea 1,334.2 5 150.0 19 8.3 25 — — 157.7 5 163.4 17 67.7 26 58.9 25 153.4 12
Latvia 1,725.8 1 — — — — — — — — — — — — — — — —
Lithuania 943.2 19 324.4 3 56.6 2 8.7 6 167.4 1 286.7 1 192.4 12 195.9 16 130.7 19
Luxembourg 1,318.4 6 134.4 20 18.0 23 — — 116.4 16 170.3 15 222.8 5 218.5 11 186.3 8
Netherlands 1,099.7 11 225.6 9 53.1 5 8.4 8 95.5 22 158.9 18 169.2 17 222.3 10 171.4 11
New Zealand 373.2 26 130.4 21 33.7 16 5.9 18 123.1 14 126.7 23 95.0 24 161.0 20 117.5 20
Norway 396.5 25 216.6 13 26.9 19 8.7 6 135.6 10 124.9 25 118.4 22 267.5 6 117.4 21
Portugal 1,418.8 2 121.3 24 35.4 14 5.2 20 92.0 23 156.5 19 155.9 20 90.6 23 62.2 23
Slovenia 937.5 20 224.4 10 38.4 11 6.3 16 120.4 15 228.6 5 195.0 11 199.4 14 137.2 17
Spain 955.2 18 128.6 22 16.4 24 7.3 12 113.4 17 172.7 14 218.4 7 128.4 21 138.6 15
Sweden 1,134.1 9 204.1 14 27.7 18 8.8 4 124.7 13 144.1 20 151.9 21 242.8 8 134.6 18
Switzerland 438.2 24 311.0 4 39.3 10 9.9 1 166.3 2 205.4 10 261.2 2 312.9 2 260.2 1
United Kingdom 809.8 22 124.6 23 22.2 20 5.5 19 84.2 25 125.5 24 113.3 23 182.4 18 142.2 14
OECD Average 1,009.3 214.9 35.9 7.0 125.1 184.1 180.6 198.8 160.5
Source: OECD 2021; calculations by authors

Comparing Performance of Universal Health Care Countries, 2021 • Moir and Barua • 49
fraserinstitute.org
Table A6: Use of resources, by specialty, per 100,000 population, 2019 Table A6, continued
Cataract surgery
Transluminal coronary angioplasty
Coronary artery bypass graft
Stem cell transplantation
Appendectomy Cholecystectomy Repair of inguinal hernia
Hip replacement
Knee replacement
Per 100,000
Rank (out of 27)
Per 100,000
Rank (out of 25)
Per 100,000
Rank (out of 25)
Per 100,000
Rank (out of 23)
Per 100,000
Rank (out of 26)
Per 100,000
Rank (out of 26)
Per 100,000
Rank (out of 26)
Per 100,000
Rank (out of 26)
Per 100,000
Rank (out of 24)
Australia 1,111.2 10 186.6 16 50.3 6 8.0 11 165.8 3 224.4 7 179.9 15 196.1 15 210.7 6
Austria 1,382.1 3 325.7 2 36.3 12 6.4 15 146.6 7 208.6 8 287.8 1 294.9 3 228.6 3
Belgium 1,202.7 8 283.2 6 59.9 1 8.8 4 139.7 9 227.9 6 221.7 6 283.3 5 212.1 5
Canada 1,095.2 12 157.7 18 54.0 4 6.6 14 111.1 19 198.2 11 168.2 18 168.2 19 198.4 7
Czech Republic 1,317.2 7 219.3 12 43.5 8 7.0 13 134.4 12 205.8 9 170.4 16 207.4 13 149.4 13
Denmark 957.3 17 166.9 17 45.2 7 — — 111.4 18 132.0 21 156.8 19 228.4 9 181.3 10
Finland 1,082.8 13 194.1 15 39.9 9 3.7 22 147.3 6 168.8 16 180.6 14 291.1 4 248.5 2
France 1,372.9 4 288.7 5 28.4 17 8.1 10 106.4 20 190.2 12 232.8 4 252.0 7 185.4 9
Germany 1,061.8 14 419.5 1 54.6 3 9.7 3 144.1 8 244.8 3 213.1 9 314.9 1 227.4 4
Greece 841.1 21 — — — — — — 84.4 24 276.6 2 236.9 3 51.2 26 — —
Iceland 962.7 16 223.8 11 19.1 22 0.0 23 162.0 4 236.0 4 217.4 8 214.4 12 — —
Ireland 268.1 27 120.1 25 19.2 21 6.0 17 135.1 11 95.1 26 71.3 25 124.9 22 49.2 24
Israel 741.0 23 263.5 7 36.0 13 8.3 9 100.8 21 130.0 22 186.9 13 67.6 24 70.7 22
Italy 969.2 15 229.1 8 34.1 15 9.8 2 66.5 26 185.7 13 209.3 10 193.9 17 137.4 16
Japan — — — — — — 4.5 21 — — — — — — — — — —
Korea 1,334.2 5 150.0 19 8.3 25 — — 157.7 5 163.4 17 67.7 26 58.9 25 153.4 12
Latvia 1,725.8 1 — — — — — — — — — — — — — — — —
Lithuania 943.2 19 324.4 3 56.6 2 8.7 6 167.4 1 286.7 1 192.4 12 195.9 16 130.7 19
Luxembourg 1,318.4 6 134.4 20 18.0 23 — — 116.4 16 170.3 15 222.8 5 218.5 11 186.3 8
Netherlands 1,099.7 11 225.6 9 53.1 5 8.4 8 95.5 22 158.9 18 169.2 17 222.3 10 171.4 11
New Zealand 373.2 26 130.4 21 33.7 16 5.9 18 123.1 14 126.7 23 95.0 24 161.0 20 117.5 20
Norway 396.5 25 216.6 13 26.9 19 8.7 6 135.6 10 124.9 25 118.4 22 267.5 6 117.4 21
Portugal 1,418.8 2 121.3 24 35.4 14 5.2 20 92.0 23 156.5 19 155.9 20 90.6 23 62.2 23
Slovenia 937.5 20 224.4 10 38.4 11 6.3 16 120.4 15 228.6 5 195.0 11 199.4 14 137.2 17
Spain 955.2 18 128.6 22 16.4 24 7.3 12 113.4 17 172.7 14 218.4 7 128.4 21 138.6 15
Sweden 1,134.1 9 204.1 14 27.7 18 8.8 4 124.7 13 144.1 20 151.9 21 242.8 8 134.6 18
Switzerland 438.2 24 311.0 4 39.3 10 9.9 1 166.3 2 205.4 10 261.2 2 312.9 2 260.2 1
United Kingdom 809.8 22 124.6 23 22.2 20 5.5 19 84.2 25 125.5 24 113.3 23 182.4 18 142.2 14
OECD Average 1,009.3 214.9 35.9 7.0 125.1 184.1 180.6 198.8 160.5
Source: OECD 2021; calculations by authors
50 • Comparing Performance of Universal Health Care Countries, 2021 • Moir and Barua
fraserinstitute.org
References
Arah, Onyebuchi A., Gert P. Westert, Jeremy Hurst, and Niek S. Klazinga (2006). A Conceptual Framework for the OECD Healthcare Quality Indi-cators Project. International Journal for Quality in Healthcare (September): 5–13.
Barua, Bacchus (2013). Provincial Healthcare Index 2013. Fraser Institute.
Barua, Bacchus (2015). Waiting Your Turn: Wait Times for Health Care in Canada, 2015 Report. Fraser Institute.
Barua, Bacchus, Milagros Palacios, and Joel Emes (2016). The Sustainability of Health Care Spending in Canada. Fraser Institute.
Barua, Bacchus, Ingrid Timmermans, Ian Nason, and Nadeem Esmail (2016). Comparing Performance of Universal Health Care Countries, 2016. Fraser Institute.
Barua, Bacchus, Sazid Hasan, and Ingrid Timmermans (2017). Comparing Performance of Universal Health Care Countries, 2017. Fraser Institute.
Björnberg, Arne (2012). Euro Health Consumer Index 2012 Report. Health Consumer Powerhouse.
Buckley, Claire M., Karen Kearns, Patricia M. Kearney, Ivan J. Perry, and Colin P. Bradley (2014). Lower Extremity Amputation in People with Dia-betes as a Marker of Quality of Diabetes Care. Clin Res Foot Ankle S3: 009; doi:10.4172/2329-910X.S3-009. <http://www.esciencecentral.org/journals/lower-extremity-amputation-in-people-with-diabetes-as-a-marker-of-quality-of-diabetes-care-2329-910X.S3-009.pdf>.
Bunker, J.P., H.S. Frazier, and F. Mosteller (1995). The Role of Medical Care in Determining Health: Creating an Inventory on Benefits. In B.J. Amick, S. Levine, A.R. Tarlov, and D. Chapman Walsh (eds.), Society and Health (Ox-ford University Press): 305–341.
Canadian Institute for Health Information [CIHI] (2011a). Health Care Cost Drivers: The Facts. Canadian Institute for Health Information.

Comparing Performance of Universal Health Care Countries, 2021 • Moir and Barua • 51
fraserinstitute.org
Canadian Institute for Health Information [CIHI] (2011b). Health Indicators 2011. Canadian Institute for Health Information.
Canadian Institute for Health Information [CIHI] (2011c). Learning from the Best: Benchmarking Canada’s Health System. CIHI.
Canadian Institute for Health Information [CIHI] (2018). National Health Expenditure Trends, 1975 to 2018. CIHI.
Canadian Institute for Health Information [CIHI] (2021). How Canada Com-pares Results from the Commonwealth Fund’s 2020 International Health Policy Survey of the General Population in 11 Countries. <https://www.cihi.ca/sites/default/files/document/how-canada-compares-cmwf-survey-2020-chartbook-en.pdf>, as of October 29, 2021.
Centre for International Statistics (1998). Health Spending and Health Status: An International Comparison. In Canada Health Action: Building on the Legacy, vol. 4 of papers commissioned by the National Forum on Health, Striking a Balance: Healthcare Systems in Canada and Elsewhere (National Forum on Health; Health Canada; Canadian Government Publishing, Public Works and Government Services Canada; Editions MultiMondes): 153–172.
Chamot, E., A. Charvet, and T.V. Perneger (2009). Overuse of Mammog-raphy during the First Round of an Organized Breast Cancer Screening Programme. Journal of Evaluation in Clinical Practice 15, 4 (August): 620–625.
Commonwealth Fund (2015). International Profiles of Health Care Systems 2014.
Commonwealth Fund (2017). International Profiles of Health Care Systems.
Cremieux, Pierre-Yves, Marie-Claude Meilleur, Pierre Ouellette, Patrick Petit, Martin Zelder, and Ken Potvin (2005). Public and Private Pharma-ceutical Spending as Determinants of Health Outcomes in Canada. Health Economics 14: 107–116.
Day, Brian (2013). The Consequences of Waiting. In Steven Globerman, ed., Reducing Wait Times for Health Care: What Canada Can Learn from Theory and International Experience (Fraser Institute): 43–75.
Esmail, Nadeem (2009). Waiting Your Turn. Hospital Waiting Lists in Canada (19th Edition). Fraser Institute.

52 • Comparing Performance of Universal Health Care Countries, 2021 • Moir and Barua
fraserinstitute.org
Esmail, Nadeem, and Michael Walker (2008). How Good Is Canadian Healthcare? 2008 Report: An International Comparison of Healthcare Systems. Fraser Institute.
Esmail, Nadeem, and Dominika Wrona (2008). Medical Technology in Canada. Fraser Institute.
Figueras, Josep, Richard B. Saltman, Reinhard Busse, and Hans F.W. Du-bois (2004). Patterns and Performance in Social Health Insurance Systems. In Saltman, Richard B., Reinhard Busse, and Josep Figueras (eds.), Social Health Insurance Systems in Western Europe (European Observatory on Health Systems and Policies Series, Open University Press): 81–140. <http://www.euro.who.int/__data/assets/pdf_file/0010/98443/E84968.pdf>.
Frech III, H.E., and Richard D. Miller, Jr. (1999). The Productivity of Healthcare and Drugs: An International Comparison. American Enterprise Institute Press.
Grenon, André (2001). Health Expenditure in Canada by Age and Sex: 1980-81 to 2000-01. Health Canada. <http://www.hc-sc.gc.ca/english/care/expenditures/exp_age_sex.html>.
Kelly, Edward, and Jeremy Hurst (2006). Healthcare Quality Indicators Project: Conceptual Framework Paper. OECD Health Working Papers No. 23. OECD.
Kleinke, J.D. (2001). The Price of Progress: Prescription Drugs in the Healthcare Market. Health Affairs 20, 5: 43–60.
Korenstein, Deborah, Raphael Falk, Elizabeth A. Howell, Tara Bishop, and Salomeh Keyhani (2012). Less Is More. Overuse of Healthcare Services in the United States. An Understudied Problem. Archives of Internal Medecine 172, 2: 171–178.
Lichtenberg, Frank R., and Suchin Virabhak (2002). Pharmaceutical-Em-bodied Technical Progress, Longevity, and Quality of Life: Drugs as “Equip-ment for Your Health”. NBER Working Paper W9351. National Bureau of Economic Research.
McKeown, T. (1976). The Role of Medicine—Dream, Mirage or Nemesis? Rock Carling Lecture, Nuffield Trust.

Comparing Performance of Universal Health Care Countries, 2021 • Moir and Barua • 53
fraserinstitute.org
Murray, C.J., and J. Frenk (2000). A Framework for Assessing the Per-formance of Health Systems. Bulletin of the World Health Organization 78, 6: 717–731.
Morgan, Steven, and Colleen Cunningham (2011). Population Aging and the Determinants of Healthcare Expenditures: The Case of Hospital, Medical and Pharmaceutical Care in British Columbia, 1996 to 2006. Healthcare Policy 7, 1: 2,011.
Nolte, Ellen, and Martin McKee (2004). Does Healthcare Save Lives? The Nuffield Trust, London. <http://www.nuffieldtrust.org.uk/sites/files/nuffield/publication/does-healthcare-save-lives-mar04.pdf>, as of March 10, 2016.
Nolte, Ellen, and Martin McKee (2011). Variations in Amenable Mortality—Trends in 16 High-Income Nations. Health Policy 103, 1: 47–52.
Or, Zeynep (1997). Determinants of Health Outcomes in Industrialized Coun-tries: A Pooled, Timeseries Analysis. OECD Working Party on Social Policy Ad Hoc Meeting of Experts in Health Statistics, Document No. 8. OECD.
Or, Zeynep (2001). Exploring the Effects of Health Care on Mortality across OECD Countries. Labour Market and Social Policy—Occasional Papers 46.
Or, Zeynep, Jia Wang, and Dean Jamison (2005). International Differences in the Impact of Doctors on Health: A Multilevel Analysis of OECD Coun-tries. Journal of Health Economics 24: 531–560.
Organisation for Economic Co-operation and Development [OECD] (2011). Health at a Glance 2011: OECD Indicators. OECD.
Organisation for Economic Co-operation and Development [OECD] (2015). Health at a Glance 2015: OECD Indicators. OECD.
Organisation for Economic Co-operation and Development [OECD] (2017). Health at a Glance 2017: OECD Indicators. OECD.
Organisation for Economic Co-operation and Development [OECD] (2019a). Avoidable Mortality: OECD/Eurostat Lists of Preventable and Treat-able Causes of Death (November 2019 version). <https://www.oecd.org/health/health-systems/Avoidable-mortality-2019-Joint-OECD-Eurostat-List-preventable-treatable-causes-of-death.pdf>, as of November 6, 2020

54 • Comparing Performance of Universal Health Care Countries, 2021 • Moir and Barua
fraserinstitute.org
Organisation for Economic Co-operation and Development [OECD] (2019b). Health at a Glance 2019. <http://www.oecd.org/health/health-systems/health-at-a-glance-19991312.htm>, as of November 6, 2020.
Organisation for Economic Co-operation and Development Definition Library (2020). Avoidable Mortality. <http://stats.oecd.org/wbos/fileview2.aspx?IDFile=45e44f0c-cc88-4a22-bc52-13114f8ba860>, as of November 6, 2020.
Organisation for Economic Co-operation and Development [OECD] (2021). OECD Health Statistics 2021. OECD.
Pinsonnault, Paul-Andre (2011). Effects of Population Aging on Healthcare Costs: Crunching Some Numbers. Weekly Economic Letter. Economy and Strategy Group and National Bank Financial Group.
Rovere, Mark, and Brett J. Skinner (2012). Value for Money from Health In-surance Systems in Canada and the OECD, 2012 edition. Fraser Institute.
Schneider, Eric C., Arnav Shah, Michelle M. Doty, Roosa Tikkanen, Kathar-ine Fields, and Reginald D. Williams II (2021). Mirror, Mirror 2021: Reflect-ing Poorly. The Commonwealth Fund. <https://doi.org/10.26099/01dv-h208>, as of October 29, 2021.
Seeman, Neil (2003). Canada’s Missing News—Part II: Lower Infant Mortal-ity Rankings. Fraser Forum (March): 20–21.
Skinner, Brett J. (2009). Canadian Health Policy Failures: What’s Wrong? Who Gets Hurt? Why Nothing Changes. Fraser Institute.
Skinner, Brett J., and Mark Rovere (2011). The Misguided War against Medi-cines 2011. Fraser Institute.
Statistics Canada (2006). Access to Healthcare Services in Canada: January to December 2005. Catalogue No. 82-575-XIE. Statistics Canada.
Tchouaket, Éric N., Paul A. Lamarche1, Lise Goulet, and André-Pierre Con-tandriopoulos (2012). Healthcare System Performance of 27 OECD Coun-tries. International Journal of Health Planning and Management 27, 2 (April/June): 104–129. <http://onlinelibrary.wiley.com/doi/10.1002/hpm.1110/full> (sub-scription required); <https://doi.org/10.1002/hpm.1110>.
Watson, Diane E., and Kimberlyn M. McGrail (2009). More Doctors or Better Care? Healthcare Policy 5, 1: 26–31.

Comparing Performance of Universal Health Care Countries, 2021 • Moir and Barua • 55
fraserinstitute.org
World Bank (2021). World Bank Country and Lending Groups. <https://datahelpdesk.worldbank.org/knowledgebase/articles/906519-world-bank-country-and-lending-groups>.
World Health Organization [WHO] (2000). The World Health Report: Health Systems: Improving Performance. <http://www.who.int/entity/whr/2000/en/whr00_en.pdf>.
World Health Organization [WHO] (2021). Global Health Observatory Data Repository. <http://apps.who.int/gho/data/view.main.HALEXv?lang=en>, as of August, 2021.

56 • Comparing Performance of Universal Health Care Countries, 2021 • Moir and Barua
fraserinstitute.org
About the Authors
Mackenzie MoirMackenzie Moir is a Policy Analyst at the Fraser Institute. He holds a Bachelor of Science in Nursing from York University and a Master of Science in Health Policy and Research from the University of Alberta. Mackenzie has extensive clinical experience and has provided direct care in general medicine, palliative care, cardiology, oncology, and neurology settings. In addition to several academic publications, his com-mentaries have appeared in University Affairs, the Financial Post, and Globe and Mail. His research focuses on the performance of health-care systems, patient choice, and health-related quality of life.
Bacchus BaruaBacchus Barua is the Director of the Fraser Institute’s Centre for Health Policy Studies. He completed his B.A. (Honours) in Economics at the University of Delhi (Ramjas College) and received an M.A. in Economics from Simon Fraser University. Mr. Barua has con-ducted research on a range of key health-care topics including hospital performance, access to new phar-maceuticals, the sustainability of health-care spending, the impact of aging on health-care expenditures, and international compari-sons of health-care systems. He also designed the Provincial Healthcare Index (2013) and is the lead author of Waiting Your Turn: Wait Times for Health Care in Canada (2010–2020). Mr. Barua is a frequent commentator on radio and television, and his articles have appeared in well-known news outlets including the National Post, Wall Street Journal, Globe and Mail, Maclean’s, and forbes.com.

Comparing Performance of Universal Health Care Countries, 2021 • Moir and Barua • 57
fraserinstitute.org
Acknowledgments
The authors wish to thank the Lotte & John Hecht Memorial Foundation for its generous support of this project. They would also like to acknowledge the contributions of Ian Nason, Nadeem Esmail, and Ingrid Timmermans to the original (2016) version of this report upon which this update is based, David Jacques and Sazid Hasan for their assistance with subsequent updates, as well as the helpful comments and insights of several anonymous reviewers.
Any re maining errors or oversights are the sole responsibility of the authors. As the researchers have worked independently, the views and conclu-sions expressed in this study do not necessarily reflect those of the Board of Directors of the Fraser Institute, the staff, or supporters.
About the Fraser Institute
Our mission is to improve the quality of life for Canadians, their families and future generations by studying, measuring and broadly communicating the ef-fects of government policies, entrepreneurship and choice on their well-being.
Notre mission consiste à améliorer la qualité de vie des Canadiens et des géné-rations à venir en étudiant, en mesurant et en diffusant les effets des politiques gouvernementales, de l’entrepreneuriat et des choix sur leur bien-être.

58 • Comparing Performance of Universal Health Care Countries, 2021 • Moir and Barua
fraserinstitute.org
Publishing Information
DistributionThese publications are available from <http://www.fraserinstitute.org> in Portable Document Format (PDF) and can be read with Adobe Acrobat® or Adobe Reader®, versions 7 or later. Adobe Acrobat Reader® DC, the most recent ver-sion, is available free of charge from Adobe Systems Inc. at <http://get.adobe.com/reader/>. Readers having trouble viewing or printing our PDF files using applications from other manufacturers (e.g., Apple’s Preview) should use Reader® or Acrobat®.
Ordering publicationsTo order printed publications from the Fraser Institute, please contact us via e-mail: [email protected]; telephone: 604.688.0221, ext. 580 or, toll free, 1.800.665.3558, ext. 580; or fax: 604.688.8539.
MediaFor media enquiries, please contact our communications department via e-mail: [email protected]; telephone: 604.714.4582.
CopyrightCopyright © 2021 by the Fraser Institute. All rights reserved. No part of this publication may be reproduced in any manner whatsoever without written permission except in the case of brief passages quoted in critical articles and reviews.
ISBN978-0-88975-670-0
CitationMackenzie Moir and Bacchus Barua (2021). Comparing Performance of Univer-sal Health Care Countries, 2021. Fraser Institute. <http://www.fraserinstitute.org>.
Supporting the Fraser InstituteTo learn how to support the Fraser Institute, please contact us via post: Development Department, Fraser Institute, Fourth Floor, 1770 Burrard Street, Vancouver, British Columbia, V6J 3G7, Canada; telephone: toll-free to 1.800.665.3558, ext. 548; e-mail: [email protected]; or visit our webpage: <http://www.fraserinstitute.org/support-us/overview.aspx>.

Comparing Performance of Universal Health Care Countries, 2021 • Moir and Barua • 59
fraserinstitute.org
Purpose, Funding, and Independence
The Fraser Institute provides a useful public service. We report objective infor-mation about the economic and social effects of current public policies, and we offer evidence-based research and education about policy options that can improve the quality of life.
The Institute is a non-profit organization. Our activities are funded by charitable donations, unrestricted grants, ticket sales, and sponsorships from events, the licensing of products for public distribution, and the sale of publications.
All research is subject to rigorous review by external experts, and is conducted and published separately from the Institute’s Board of Directors and its donors.
The opinions expressed by authors are their own, and do not necessarily reflect those of the Institute, its Board of Directors, its donors and supporters, or its staff. This publication in no way implies that the Fraser Institute, its dir-ectors, or staff are in favour of, or oppose the passage of, any bill; or that they support or oppose any particular political party or candidate.
As a healthy part of public discussion among fellow citizens who desire to improve the lives of people through better public policy, the Institute wel-comes evidence-focused scrutiny of the research we publish, including verifi-cation of data sources, replication of analytical methods, and intelligent debate about the practical effects of policy recommendations.
Peer review —validating the accuracy of our researchThe Fraser Institute maintains a rigorous peer review process for its research. New research, major research projects, and substantively modified research conducted by the Fraser Institute are reviewed by experts with a recognized expertise in the topic area being addressed. Whenever possible, external re-view is a blind process. Updates to previously reviewed research or new edi-tions of previously reviewed research are not reviewed unless the update in-cludes substantive or material changes in the methodology.
The review process is overseen by the directors of the Institute’s re-search departments who are responsible for ensuring all research published by the Institute passes through the appropriate peer review. If a dispute about the recommendations of the reviewers should arise during the Institute’s peer review process, the Institute has an Editorial Advisory Board, a panel of schol-ars from Canada, the United States, and Europe to whom it can turn for help in resolving the dispute.

60 • Comparing Performance of Universal Health Care Countries, 2021 • Moir and Barua
fraserinstitute.org
Members
Past members
Editorial Advisory Board
* deceased; † Nobel Laureate
Prof. Terry L. Anderson
Prof. Robert Barro
Prof. Jean-Pierre Centi
Prof. John Chant
Prof. Bev Dahlby
Prof. Erwin Diewert
Prof. Stephen Easton
Prof. J.C. Herbert Emery
Prof. Jack L. Granatstein
Prof. Herbert G. Grubel
Prof. James Gwartney
Prof. Ronald W. Jones
Dr. Jerry Jordan
Prof. Ross McKitrick
Prof. Michael Parkin
Prof. Friedrich Schneider
Prof. Lawrence B. Smith
Dr. Vito Tanzi
Prof. Armen Alchian*
Prof. Michael Bliss*
Prof. James M. Buchanan* †
Prof. Friedrich A. Hayek* †
Prof. H.G. Johnson*
Prof. F.G. Pennance*
Prof. George Stigler* †
Sir Alan Walters*
Prof. Edwin G. West*