comparing outcome measures derived from four research
TRANSCRIPT
APPROVED: Jeff M. Allen, Major Professor Michael Beyerlein, Minor Professor Jessica Li, Committee Member Robin K. Henson, Interim Chair of the Department
of Technology and Cognition M. Jean Keller, Dean of the College of Education Sandra L. Terrell, Dean of the Robert B. Toulouse
School of Graduate Studies
COMPARING OUTCOME MEASURES DERIVED FROM FOUR RESEARCH DESIGNS
INCORPORATING THE RETROSPECTIVE PRETEST
Kim Nimon
Dissertation Prepared for the Degree of
DOCTOR OF PHILOSOPHY
UNIVERSITY OF NORTH TEXAS
August 2007
Nimon, Kim, Comparing outcome measures derived from four research designs
incorporating the retrospective pretest. Doctor of Philosophy (Applied Technology and
Performance Improvement), August 2007, 80 pp., 11 tables, 2 illustrations, references, 82 titles.
Over the last 5 decades, the retrospective pretest has been used in behavioral science
research to battle key threats to the internal validity of posttest-only control-group and pretest-
posttest only designs. The purpose of this study was to compare outcome measures resulting
from four research design implementations incorporating the retrospective pretest: (a) pre-post-
then, (b) pre-post/then, (c) post-then, and (d) post/then. The study analyzed the interaction effect
of pretest sensitization and post-intervention survey order on two subjective measures: (a) a
control measure not related to the intervention and (b) an experimental measure consistent with
the intervention. Validity of subjective measurement outcomes were assessed by correlating
resulting to objective performance measurement outcomes.
A Situational Leadership® II (SLII) training workshop served as the intervention. The
Work Involvement Scale of the self version of the Survey of Management Practices Survey
served as the subjective control measure. The Clarification of Goals and Objectives Scale of the
self version of the Survey of Management Practices Survey served as the subjective experimental
measure. The Effectiveness Scale of the self version of the Leader Behavior Analysis II® served
as the objective performance measure.
This study detected differences in measurement outcomes from SLII participant
responses to an experimental and a control measure. In the case of the experimental measure,
differences were found in the magnitude and direction of the validity coefficients. In the case of
the control measure, differences were found in the magnitude of the treatment effect between
groups.

These differences indicate that, for this study, the pre-post-then design produced the most
valid results for the experimental measure. For the control measure in this study, the pre-
post/then design produced the most valid results. Across both measures, the post/then design
produced the least valid results.

ii
Copyright 2007
by
Kim Nimon
iii
TABLE OF CONTENTS
Page
LIST OF TABLES...........................................................................................................................v LIST OF ILLUSTRATIONS......................................................................................................... vi TRADEMARK ACKNOWLEDGEMENTS................................................................................ vii Chapter
1. INTRODUCTION ...................................................................................................1
Background
Need for the Study
Theoretical Framework
Purpose of the Study
Research Questions and Null Hypotheses
Limitations
Delimitations
Definition of Terms
Summary 2. LITERATURE REVIEW ......................................................................................14
Introduction
Retrospective Pretest in Pretest-Posttest Designs
Pretest Sensitization and Order Effects
Memory Distortion
Summary 3. METHODS ............................................................................................................27
Research Design
Population
Sample
Instrumentation
Data Collection
Data Analysis
iv
Summary 4. FINDINGS.............................................................................................................42
Overview
Data Assessment
Descriptive Statistics
Statistical Assumptions
Data Analyses
Summary 5. DISCUSSION........................................................................................................60
Overview
Synthesis of Findings
Conclusions
Recommendations for Future Research
Implications
Summary APPENDICES ..............................................................................................................................70 REFERENCES .............................................................................................................................75
v
LIST OF TABLES
Page
1. Research Design per Group ............................................................................................ 27
2. Group by Program Cross-tabulation ............................................................................... 29
3. Score Reliability Estimates ............................................................................................. 43
4. Analysis of Variance Between SMP-SCTL Thentest Scores by Group ......................... 44
5. SMP-SEXP Score Validity Estimates............................................................................. 45
6. Missing Values Analysis................................................................................................. 46
7. Descriptive Statistics for Study Variables ...................................................................... 47
8. Levene’s Test Results – SMP-SCTL Score Variance Between Groups......................... 48
9. Levene’s Test Results – SMP-SEXP Score Variance Between Groups......................... 49
10. Results of Split-plot ANOVA and Simple Effect Tests on SMP-SCTL Scores............. 51
11. Results of Split-plot ANOVA and Simple Effect Tests on SMP-SEXP Scores............. 56

vi
LIST OF ILLUSTRATIONS
Page
1. Estimated Marginal Means of SMP-SCTL..................................................................... 51
2. Estimated Marginal Means of SMP-SEXP..................................................................... 55
vii
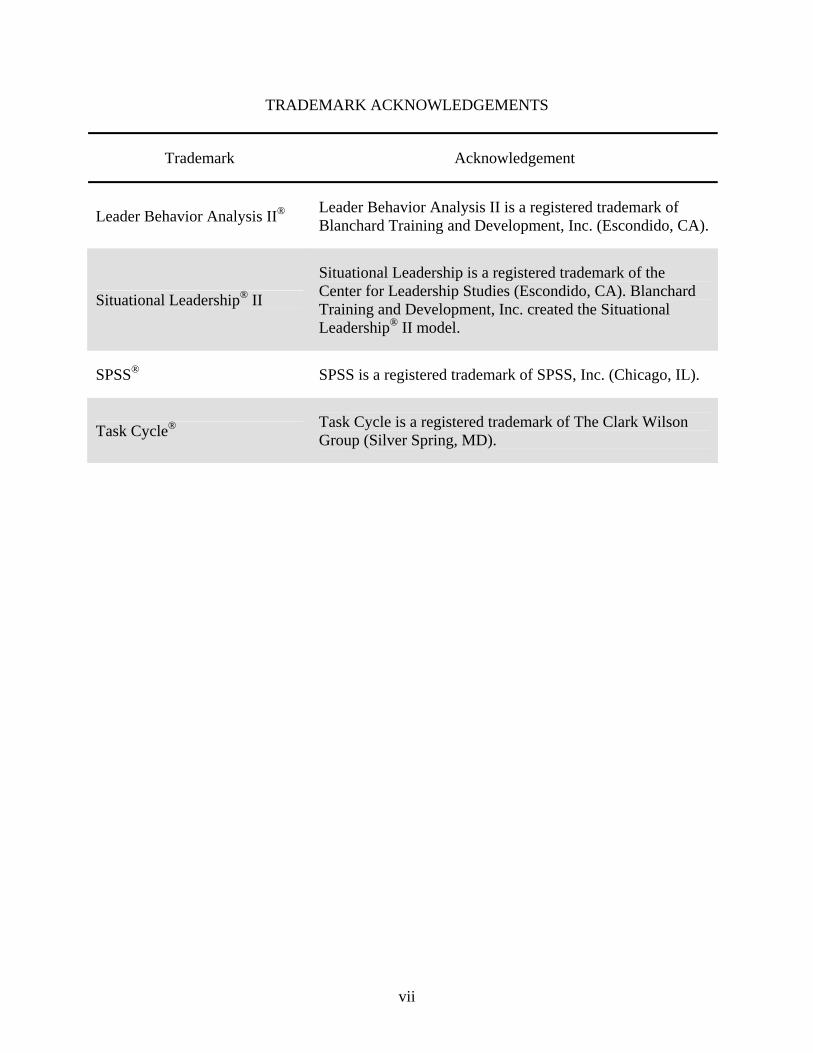
TRADEMARK ACKNOWLEDGEMENTS
Trademark Acknowledgement
Leader Behavior Analysis II® Leader Behavior Analysis II is a registered trademark of Blanchard Training and Development, Inc. (Escondido, CA).
Situational Leadership® II
Situational Leadership is a registered trademark of the Center for Leadership Studies (Escondido, CA). Blanchard Training and Development, Inc. created the Situational Leadership® II model.
SPSS® SPSS is a registered trademark of SPSS, Inc. (Chicago, IL).
Task Cycle® Task Cycle is a registered trademark of The Clark Wilson Group (Silver Spring, MD).
1
CHAPTER 1
INTRODUCTION
Background
Over the last 5 decades, the retrospective pretest has been used in behavioral science
research to battle key threats to the internal validity of posttest-only control-group and pretest-
posttest designs. Citing studies conducted by Deutsch and Collins (1951), Sears, Maccoby, and
Levin (1957), and Walk (1956), Campbell and Stanley (1963) recommended supplementing
posttest-only control-group designs with a retrospective pretest to validate pre-intervention
equivalence of experimental and control groups. Almost 2 decades later, Howard, Ralph, et al.
(1979) proposed extending pretest-posttest designs by adding the retrospective pretest to
moderate the confounding effect of experience limitation. Referencing segments of the Howard,
Ralph, et al. work 2 decades later, evaluators (e.g., Lamb & Tschillard, 2005; Martineua, 2004;
Raidl et al., 2004), suggested replacing the traditional pretest in pretest-posttest designs with the
retrospective pretest as a practical and valid means to determine program outcomes, mitigating
the effects of experience limitation, pretest sensitization, maturity, and mortality.
While the retrospective pretest is cited as a technique to moderate key threats to the
internal validity of research designs related to program evaluation (Klatt & Taylor-Powell,
2005), the validity of measurements based on the retrospective pretest is often questioned (e.g.,
Hill & Betz, 2005; Lamb, 2005; Schwarz, in press). The most common and encompassing issue
relating to participants’ retrospective accounts is memory distortion (Nimon & Allen, 2007).
This is of particular concern when retrospective accounts are used to measure changes in
knowledge, skills, or attitudes because individuals may distort their personal recall of pre-
intervention behavior to generate an impression of improvement even when no such change

2
occurs (Ross & Conway, 1986). Conversely, participants may generate an impression of stability
even when change occurs, particularly if it is socially desirable (Pearson, Ross, & Dawes, 1992).
To manage the error associated with memory distortion, a robust design incorporating the
thentest includes a control condition (Sprangers & Hoogstraten, 1989) or an external variant
(Umble, Upshaw, Orton, & Matthews, 2000) to provide concurrent validity of retrospective
measures. One of the most common techniques to provide concurrent validity of measures based
on retrospective accounts is to correlate resultant gain scores to an objective measure of change
(Nimon & Allen, 2007). However, the task of analyzing gain scores yields both a perceived and
potential threat to the external validity of related research designs. Because simplified formulas,
assuming parallelism in pretest and posttest measures, present the reliability of gain scores in
their most unfavorable light (Williams & Zimmerman, 1996), gain scores are perceived by some
psychometric traditionalists as being inherently unreliable (Zumbo, 1999). Therefore, robust
research designs examining the concurrent validity of retrospective measures using gain scores
should assess their reliability with formulas that consider the unique statistical properties (e.g.,
standard deviation, reliability) of both scores (e.g., pretest, posttest) contributing to the latent
measure of change.
Need for the Study
Consistent with demand for accountability, designs incorporating the retrospective pretest
have gained prominence as a method for measuring self-reporting change (Klatt & Taylor-
Powell, 2005). Although the tool has gained momentum in behavioral science practice and
research, there is a need to examine the relationship between research design choice and
measurement outcomes (Klatt & Taylor-Powell, 2005; Nimon & Allen, 2007).

3
Within the two distinct designs proposed by Howard, Ralph, et al. (1979) and
contemporary evaluators (e.g., Lamb & Tschillard, 2005; Martineua, 2004), there are various
ways in which the retrospective pretest is included and formatted. In particular, Klatt and Taylor-
Powell (2005) noted two retrospective pretest administration techniques: (a) in conjunction with
the posttest as a single questionnaire and (b) separately from the posttest with two
questionnaires. Users of the retrospective pretest must therefore determine whether or not to
include a traditional pretest in their designs as well as choose between administering one or two
post-intervention questionnaires. The fully nested combination of choices results in four research
designs: (a) pre-post-then, (b) pre-post/then, (c) post-then, (d) post/then (see Definition of
Terms).
While citing studies (Sprangers & Hoogstraten, 1989; Terborg & Davis, 1982) that
examined the effects of pretest sensitization and post-intervention survey order, literature
(Babcock, 1997; Klatt & Taylor-Powell, 2005; Nimon & Allen, 2007) provides limited
information to indicate how the research designs impact measurement outcomes. A critical
review of the studies cited also indicates that many studies focused on the results of statistical
significance analyses and did not report the results of power, practical significance, or concurrent
validity tests. Furthermore, the studies focused either on the main effect of pretest sensitization
or post-intervention survey order and thereby missed the opportunity to test for an interaction
effect. Therefore, there is a need to compare measurement outcomes from four designs
incorporating the retrospective pretest (pre-post-then, pre-post/then, post-then, post/then). This
study will not only inform researchers and practitioners who are considering how to incorporate
the retrospective pretest, but it will also fill a gap in the literature by examining the interaction
effect of pretest sensitization and post-intervention survey order.
4
Theoretical Framework
Five theories relating to the validity of post-intervention measurements in retrospective
pretest designs provided the framework for this study. The foundation of this study is response-
shift theory, because it argues for the validity of thentest measures. Opposing the theory of
response-shift are theories of personal recall and impression management. Contributing to the
theoretical validity of posttest and thentest measurements are Schwarz’s (1996, 1999) theory
based on Grice’s (1975) maxims of conversation and Sprangers and Hoogstraten’s (1989) theory
relating to pretest sensitization. All these theories relate to the validity of post-intervention
measurements in retrospective pretest designs. As such, it is not clear which theory is more valid
for a particular occasion of test (Norman, 2003). Therefore, they collectively provided the
theoretical framework for the questions posed in this study.
Response-Shift Theory
As a proponent of the theory, Howard (1980) suggested that response-shift occurs when
an experimental intervention changes the subject’s evaluation standard with regard to the
dimension measured by the self-report instrument. Golembiewski, Billingsley, and Yeager
(1976) extended Howard’s explanation by including changes in values or conceptualization.
Similarly, Sprangers and Schwartz (2000) suggested that response-shift results from a change in
the meaning of one’s self-evaluation of a target construct as a result of (a) a change in the
respondent’s internal standards of measurement (i.e., scale recalibration), (b) a change in the
respondent’s values (i.e., the importance of component domains constituting the target
construct), or (c) a redefinition of the target construct (i.e., reconceptualization). Howard’s
definition of response-shift theory serves as a foundational element for the present study because
5
the extent to which the three components of response-shift (i.e., standards, values,
conceptualization) are distinct or interconnected is still unknown (Sprangers & Schwartz, 2000).
Personal Recall Theory
The theory of personal recall opposes the theory of response-shift because it presumes
that retrospective measures of initial states are reconstructed in concert with individuals’ implicit
theories of stability or change (Pearson et al., 1992). For example, if individuals are expecting to
experience a change in knowledge, skills, or attitudes as a result of an intervention, personal
recall theory suggests that these individuals will reconstruct their initial state so as to indicate a
treatment effect (i.e., a practical difference between posttest and retrospective measures), even
when no such change occurs (Ross, 1989). Similarly, Ross noted that, if individuals are operating
under the theory of stability, personal recall theory suggests that these individuals will
reconstruct their initial state so as to indicate a lack of treatment effect (i.e., no practical
difference between posttest and retrospective measures), even when a change occurs.
Impression Management Theory
The theory behind impression management is similar to personal recall theory. The
difference is that, under the theory of impression management, participants reconstruct their
retrospective measures so as to present themselves in the most favorable manner (Pearson et al.,
1992). For example, subjects in attitude-change experiments may present a façade of consistency
by reporting past attitudes that are similar both to their present opinion and to the views
expressed in experimental communications designed to alter their attitudes. Similarly,
participants in improvement programs may believe that the appearance of improvement will
6
please the leader. In this case, they may moderate their initial states to generate an impression of
improvement.
Grice’s Maxims of Conversation
Grice (1975) theorized that cooperative conversation is guided by a set of tacit
assumptions that can be expressed in the form of four maxims: (a) maxim of manner, (b) maxim
of relation, (c) maxim of quantity, and (d) maxim of quality. The maxim of manner asks speakers
to make contributions such that they can be understood by their audience. The maxim of relation
enjoins speakers to make contributions relevant to the aims of the ongoing conversation. The
maxim of quantity charges speakers to make contributions as informative as is required, but not
more informative than is required. The maxim of quality requests speakers not to say anything
they believe to be false or for which they lack sufficient evidence.
Relating Grice’s (1975) maxims of conversation to research design, Schwarz (1996,
1999) theorized that respondents rely on the tacit assumptions that govern the conduct of
conversation in everyday life to infer the pragmatic meaning of a survey item. Of the
assumptions that govern conversation and survey item interpretation, the maxim of relation is
pertinent to this study.
Drawing from Grice’s (1975) maxim of relation, Schwarz (1996, 1999) argued that
subjects use contextual information in interpreting survey items, relating the item to the context
of an ongoing exchange. More specifically, Schwarz inferred that subjects consider the content
of adjacent items in the process of interpreting a question’s intended meaning. This study
extends Schwarz’s theory by suggesting that arranging thentest and posttest questions side-by-
7
side may signal to participants that change is expected to occur and thereby influence post-
intervention measurement outcomes.
Pretest Sensitization
The theory behind pretest sensitization is that for some types of knowledge, skills, or
attitudes, pretests change subjects’ responsiveness to the experimental variable (Campbell &
Stanley, 1963). As it relates to retrospective pretest designs, Sprangers and Hoogstraten (1989)
theorized that the pretest could have an influence on posttest and thentest measures.
Purpose of the Study
The purpose of this study was to compare outcome measures resulting from four research
design implementations incorporating the retrospective pretest: (a) pre-post-then, (b) pre-
post/then, (c) post-then, and (d) post/then.
The study analyzed the interaction effect of pretest sensitization and post-intervention
survey order on two subjective measures: (a) a control measure not related to the intervention
and (b) an experimental measure consistent with the intervention. Validity of subjective
measurement outcomes were assessed by correlating results to objective performance
measurement outcomes.
A Situational Leadership® II (SLII) training workshop served as the intervention. The
Work Involvement Scale of the self version of the Survey of Management Practices Survey
served as the subjective control measure (SMP-SCTL). The Clarification of Goals and Objectives
Scale of the self version of the Survey of Management Practices Survey served as the subjective
8
experimental measure (SMP-SEXP). The Effectiveness Scale of the self version of the Leader
Behavior Analysis II® (LBAII-SEF) served as the objective performance measure.
Research Questions and Null Hypotheses
1. Is there a difference in measurement outcomes, derived from SLII training participants’ responses to a control measure, among four retrospective pretest design groups?
Ho1A: There is no statistically significant interaction between group and occasion, as measured by posttest and thentest responses to the SMP-SCTL.
H o1B: There is no statistically significant simple effect of group at the posttest occasion, as measured by the SMP-SCTL.
H o1C: There is no statistically significant simple effect of group at the thentest occasion, as measured by the SMP-SCTL.
H o1D: There is no statistically significant simple effect of occasion at Group 1, as measured by posttest and thentest responses to the SMP-SCTL.
H o1E: There is no statistically significant simple effect of occasion at Group 2, as measured by posttest and thentest responses to the SMP-SCTL.
H o1F: There is no statistically significant simple effect of occasion at Group 3, as measured by posttest and thentest responses to the SMP-SCTL.
H o1G: There is no statistically significant simple effect of occasion at Group 4, as measured by posttest and thentest responses to the SMP-SCTL.
2. Is there a difference in measurement outcomes, derived from SLII training participants’ responses to an experimental measure, among four retrospective pretest design groups?
Ho2A: There is no statistically significant interaction between group and occasion, as measured by posttest and thentest responses to the SMP-SEXP.
H o2B: There is no statistically significant simple effect of group at the posttest occasion, as measured by the SMP-SEXP.
H o2C: There is no statistically significant simple effect of group at the thentest occasion, as measured by the SMP-SEXP.
H o2D: There is no statistically significant simple effect of occasion at Group 1, as measured by posttest and thentest responses to the SMP-SEXP.
9
H o2E: There is no statistically significant simple effect of occasion at Group 2, as measured by posttest and thentest responses to the SMP-SEXP.
H o2F: There is no statistically significant simple effect of occasion at Group 3, as measured by posttest and thentest responses to the SMP-SEXP.
H o2G: There is no statistically significant simple effect of occasion at Group 4, as measured by posttest and thentest responses to the SMP-SEXP.
Limitations
1. This research examined participants’ perceived leadership effectiveness and their ability
to apply SLII concepts to case study scenarios. This research makes no claim as to participants’
ability to transfer such skills to the workplace.
2. Although workshops were selected that provided the same training material and that were
facilitated by a certified trainer, the researcher did not control for differences that may have
occurred in the execution of the training program. These differences could have affected how
participants responded to post-intervention survey instrumentation.
3. Research design group may not be the only factor influencing differences in participants’
scores. Other factors, including distractions at home or work and measurement error, may have
influenced the results obtained.
Delimitations
1. Demographics were not considered as variables in this study beyond that of ensuring that
participants met the criteria of the workshop and served in a leadership role.
2. This study focused on individuals participating in a SLII training program conducted in
the United States.
10
3. This study tested two specific order effects: (a) posttest administered in conjunction with
a thentest according to the Howard, Ralph, et al. (1979) recommendations and (b) posttest
administered separate and before the thentest similar to Terborg and Davis’s (1992) study.
4. This study incorporated a control condition by conducting parallel analyses on control
and experimental measures, following the examples provided by Levinson, Gordon, and Skeff
(1990) and Skeff, Stratos, and Bergen (1992).
5. This study was limited to self-report measures and performance tests completed by
training workshop participants. The study did not incorporate surveys of leadership effectiveness
or performance from participants’ superiors, subordinate, or peers.
Definition of Terms
Between-subjects factor: An independent variable representing different groups of
subjects (Maxwell & Delaney, 2004).
Box M: A statistic used to test for homogeneity of covariance matrices (Maxwell &
Delaney, 2004).
Experience limitation: The phenomenon of subjects having only a partially developed
conceptualization of the dimensions along which they are asked to report about themselves
(Aiken & West, 1990).
Implicit theory: A set of individual beliefs regarding the inherent stability of an attribute
as well as a set of general principles concerning the conditions likely to promote personal change
(Ross & Conway, 1986).
Impression management: The phenomenon of subjects distorting self-report measures in
order to present themselves in the most favorable manner possible (Pearson et al., 1992).

11
Leader Behavior Analysis II® (LBAII): Set of instruments based on the SLII model
(Blanchard, Hambleton, et al., 2004). The LBAII Self (LBAII-S) provides self-report measures
of an individual’s leadership style, flexibility, and effectiveness. The LBAII Other (LBAII-O)
provides a measure of an individual’s leadership style, flexibility and effectiveness from the
perspective of the individual’s peer, subordinates, or superiors (Zigarmi, Edeburn, & Blanchard,
1997).
Pairwise comparison: All possible comparisons when testing the differences between
means for multiple groups (Hinkle, Wiersma, & Jurs, 2003).
Personal recall: The process of individuals noting their prior status on an attribute in
question by characterizing the past different from or the same as present. The process may also
involve an individual’s implicit theories in guiding the construction of past attributes (Ross &
Conway, 1986).
Post/then: A posttest design incorporating a retrospective pretest in which the posttest and
thentest are administered with a single questionnaire.
Posttest-pretest gain scores: Scores produced by subtracting pretest scores from posttest
scores.
Posttest-thentest gain scores: Scores produced by subtracting thentest scores from posttest
scores.
Post-then: A posttest design incorporating a retrospective pretest in which the posttest
and thentest are administered as two separate questionnaires.
Pre-post/then: A pre-post design supplemented by a retrospective pretest in which the
posttest and thentest are administered with a single questionnaire.

12
Pre-post-then: A pre-post design supplemented by a retrospective pretest in which the
posttest and thentest are administered as two separate questionnaires, with the posttest
administered before the thentest.
Pretest-posttest: A design that includes three phases: (a) administration of a pretest
measuring the dependent variable, (b) implementation of the experimental treatment, and (c)
administration of a posttest that measures the dependent variable again (Gall, Gall, & Borg,
2003).
Pre-then-post: A pre-post design supplemented by a retrospective pretest in which the
thentest and posttest are administered as two separate questionnaires, with the thentest
administered before the posttest.
Response-shift: A statistically significant difference between a traditional pretest and a
retrospective pretest (Norman, 2003).
Retrospective pretest design: A research design incorporating the retrospective pretest.
Encompasses pre-post-then, pre-post/then, post-then, and post/then designs.
Retrospective pretest: A pretest administered post-intervention, asking subjects to recall
their behavior prior to the intervention (or treatment) (Howard, Ralph, et al., 1979).
Self-presentation: A synonym for impression management (Aiken & West, 1990).
Simple effect: Individual effect of a factor at a single level of another factor (Maxwell &
Delaney, 2004).
Situational Leadership® II (SLII): A process for developing people based on a
relationship between an individual’s development level on a specific goal or task and the
leadership style that the leader provides (Blanchard, 1994, p. 3).
13
Sphericity: An assumption in repeated measures designs that the variance at each
measurement occasion is equal (K. Roberts, personal communication, July 5, 2004).
Split-plot ANOVA: A factorial design with at least one between-subjects and one within-
subjects factor (Maxwell & Delaney, 2004).
Survey of Management Practices (SMP): Set of scales that measure managerial
competencies on 11 skills and 12 attributes (Wilson, 2006). The set includes the self version
(SMP-S) and the other version (SMP-O). The self version and other version are identical except
for syntax (Morrison, McCall, & Devries, 1978).
Thentest: A synonym for retrospective pretest (Umble et al., 2000).
Within-subjects factor: An independent variable representing the occasion of repeatedly
measuring variable(s) across the same subjects (Maxwell & Delaney, 2004).
Summary
This chapter provided background on the evolution of the retrospective pretest and
identified a need to compare measurement outcomes derived from four research designs
incorporating the retrospective pretest. It also provided a theoretical framework and presented
the purpose of the proposed study. Finally, the chapter outlined research questions, hypotheses,
and assumptions that formed the basis of the proposal. Chapter 2 reviews existing literature
related to the study.
14
CHAPTER 2
LITERATURE REVIEW
Introduction
This literature review begins with an overview of the Howard, Ralph, et al. studies, as
they are often cited in contemporary retrospective pretest literature (e.g., Hill & Betz, 2005;
Lamb, 2005; Schwarz, in press). It also highlights the particulars of a compendium of studies
incorporating the retrospective pretest across a multitude of designs and variables. Finally, in
support of the research questions posed, the chapter describes research that examined the effects
of pretest sensitization, post-intervention survey order, and memory distortion in a retrospective
pretest design. This chapter does not cover the broader scope of literature relating retrospective
survey item design to participant response, because factors such as the specificity of questions,
length of recall periods, and question lengths were held constant across all four research design
groups.
Retrospective Pretest in Pretest-Posttest Designs
Howard, Ralph, et al. (1979) laid the foundation for the evolution of the retrospective
pretest when they observed paradoxical findings in a self-report evaluation of an Air Force
communication skills training program aimed at reducing dogmatism. After employing a
traditional pretest-posttest design (n = 704) and finding an apparent increase in dogmatism
following the workshop, Howard, Ralph, et al. interviewed workshop participants and found that,
as a result of attending the workshop, participants changed their perceptions of their initial levels
of dogmatism.
15
Subsequently, Howard, Ralph, et al. (1979) replicated the first study, employing a
thentest measure. In this second study (n = 247), participants were divided into two groups.
Group 1 completed a traditional pretest and posttest. Following the intervention, Group 2
members provided concurrent thentest and posttest responses to each item in the self-report
survey. Howard, Ralph, et al. found that a significantly greater number of Group 2 members
reported becoming less dogmatic following the workshop than Group 1 members. The
researchers suggested that for self-report measures, a post/then design might yield more accurate
changes scores than a pretest-posttest design.
In a third study, Howard, Ralph, et al. (1979) randomly assigned women (n = 51) who
scored “feminine” on the Bern Sex-Role Inventory (Bem, as cited in Howard, Ralph, et al., 1979)
to control or experimental groups. The experimental groups were designed to promote
androgyny by fostering the development of skills typically stereotyped as masculine. In order to
monitor the effectiveness of these groups, self-report and objective measures of assertiveness,
sex-role orientation, and attainment of individual goals were obtained. All groups completed
pretests, posttests, and thentests, thus allowing generation of post-pre and post-then change
scores to be compared to objective measures of change. The effects of response shift were
evident for treatment subjects but not for the control group. Similar to the prior studies described,
post-pre analyses demonstrated minimal treatment effects, whereas post-then analyses produced
statistically and practically significant treatment effects. Most important to the aim of the study,
objective measures of change correlated more highly with post-then self-report measures of
change than with the post-pre self-report index, adding concurrent validity to the claim that
retrospective judgment is more valid when treatment changes participants’ perception of their
prior state.

16
In the last study, Howard, Ralph, et al. (1979) analyzed changes in levels of helping skills
for students taking a semester-long course. In this study, participants (n = 51) where divided into
three groups: (a) pretest-posttest, (b) post/then, and (c) pre-post/then. In addition to participants
completing all testing required for the group to which they were assigned, they conducted half-
hour interviews with volunteer clients before and after the course. Judges’ ratings of the
interviews and post-then comparisons found significant treatment effects, whereas post-pre
comparisons failed to show overall treatment effects. After completing posttests and thentests,
subjects in the pre-post/then group recalled their pretest ratings. Mean memory ratings were
almost identical to pretest ratings, but statistically significantly different from thentest ratings,
suggesting that the response-shift effect reflected something more than mere systematic memory
distortions.
Based on the work of Howard, Ralph, et al. (1979), Howard (1980) suggested that
pretest-posttest designs be augmented with thentests to mitigate the effect of experience
limitation. In describing the post-intervention procedure, Howard, Ralph, et al. stated:
First, they were to report how they perceived themselves to be at present (Post). Immediately after answering each item in this manner, they were to answer the same item again, this time in reference to how they now perceived themselves to have been just before the workshop was conducted (Then). Subjects were instructed to make the Then response in relation to the corresponding Post response to insure that both responses would be made from the same perspective. (p. 5)
Since Howard’s (1980) recommendations, the retrospective pretest has been used to measure
bias in self-report measures involving a broad range of cognitive, attitudinal, and skill-based
variables (Nimon & Allen, 2007). However, not all studies have employed procedures
recommended by Howard, Ralph, et al. (1979). The appendix identifies a representative set of
studies employing the retrospective pretest, denoting the variables measured and the research
designs employed.
17
Pretest Sensitization and Order Effects
Babcock (1997) and Nimon and Allen (2007) cited two studies (Sprangers &
Hoogstraten, 1989; Terborg & Davis, 1982) that examined the effects of pretest sensitization and
post-intervention survey order in a research design incorporating the retrospective pretest.
Sprangers and Hoogstraten conducted two experiments: (a) the first to examine the effect of
pretest sensitization and (b) the second to examine the effect of differences in post-intervention
survey administration. Terborg and Davis’s study implemented multiple research designs to
examine pretest sensitization and order effects.
Pretest Sensitization
Using a sample of 37 hospital employees required to participate in a communication
skills training program, Sprangers and Hoogstraten (1989) conducted a Solomon four-group
design to test the effect of administering a self-report pretest. Groups 1 and 3 received treatment.
Groups 2 and 4 served as controls, receiving the intervention after the experiment. Groups 1 and
3 were administered a pretest, posttest, and thentest. Groups 2 and 4 were administered a posttest
and thentest. The study’s post-intervention procedures deviated from the Howard, Ralph, et al.
(1979) recommendations. Subjects first completed all posttest items conventionally, and then
while keeping the posttest in front of them, reported how they now perceived themselves to have
been prior to training. All four groups completed an objective measure, post-intervention.
Analyzing the treatment factor on the objective posttest and self-report posttest scores
indicated that the intervention was not successful. As it related to the research question, results
indicated that the pretest significantly affected the self-report posttest and thentest scores.
Conversely, the data indicated no pretest effect on objective posttest scores. Sprangers and

18
Hoogstraten (1989) concluded that administering a pretest produces specific effect and suggested
researchers not interested in detecting the occurrence of response-shift discard the pretest in
favor of the thentest. However, this conclusion was reached without the benefit of establishing
the concurrent validity of group posttest or thentest scores.
In Terborg and Davis’s (1982) study, two groups of subjects were compared to determine
whether a pretest impacted posttest or thentest scores. Both groups completed an unenriched
task. Following an unenriched task, Group 1 (n = 12) was administered the Job Diagnostic
Survey (JDS) to determine the overall motivating potential score (MPS) of their job. MPS pretest
scores were not collected from Group 2 (n = 8). Ten days later, both groups performed an
enriched task and then completed a posttest/thentest questionnaire. The posttest and thentest
items were administered according to the Howard, Ralph, et al. (1979) procedures as a single
questionnaire. Comparison of the two groups showed no difference in MPS scores for either the
posttest or thentest ratings. Terborg and Davis concluded that pretests did not prime subjects or
make certain aspects of an intervention more salient.
It is important to note that the results of the statistical significance tests may have been a
function of power. A posthoc power analysis indicates that, even if the standardized mean
difference between the groups was as great as .80, the researchers had less than a 50% chance of
detecting a statistically significant difference (see Cohen, 1988, Table 2.4.1). In addition to the
issue of sample size, the standard deviations of the MPS scores may have affected the power of
the ttests performed. Although Terborg and Davis (1982) noted that the means for Groups 1 and
2 were, respectively, 104.19 and 75.81 for the posttest measure and 31.57 and 12.66 for the
thentest measure, they did not report associated standard deviations. However, it is possible that
the standard deviations of the posttest and thentest MPS scores negatively impacted power,
19
because the mean and standard deviation of the pretest MPS score for Group 1 were,
respectively, 20.96 and 20.75. Of further note, the effectiveness of the intervention was not
reported nor were concurrent validities of group posttest or thentest scores established.
Post-Intervention Survey Order
To address the question of whether administration of the thentest independent of the
posttest affects ratings, Sprangers and Hoogstraten (1989) conducted a second experiment
involving 58 dental students who participated in the experiment as part of their university
training. Students were divided into six groups, with the first three groups receiving the
intervention and the remaining groups serving as no-treatment controls. All groups were
administered a self-report pretest and a behavioral posttest. With the exception of Groups 2 and
5, the posttest and thentest were administered according to the “test-after-test procedure.” While
the authors cited no reference for the test-after-test procedure, they contrasted their
administration to the recommendations set forth in Howard, Ralph, et al. (1979) as follows:
Subjects first completed all posttest items conventionally and, while keeping the posttest in front of them, reported how they now perceived themselves to have been prior to the training. The instruction stated, just as in Howard’s work, that subjects were to answer each retrospective item in relation to the corresponding posttest item, starting with Item 1. (p. 149)
The researchers, subsequently, indicated that participants in Groups 2 and 5 completed the
thentest prior to the posttest. However, they did not indicate whether the participants kept the
thentest in front of them while completing the posttest or completed the instruments separately.
Comparing the means of Groups 1 and 4 against the means of Groups 2 and 5 indicated
that order factor did not affect self-report posttest or thentest scores (Sprangers & Hoogstraten,
1989). Comparing the means of Groups 1, 2, 4, and 5 indicated that the interaction of the
20
treatment factor and the order factor did not affect self-report posttest or thentest scores. Based
on these comparisons, the researchers concluded that the administration order of the posttest and
thentest seems arbitrary.
It is important to note that Sprangers and Hoogstraten (1989) neglected to report their
findings within the context of the size of their sample or the effectiveness of the treatment. In
particular, they omitted reporting whether the treatment factor affected self-report posttest or
thentests scores. Of further note, concurrent validities of group posttest or thentest scores were
not established nor were descriptive statistics reported.
As part of Terborg and Davis’s (1982) study previously described, selected comparisons
between thentest and posttest scores were conducted as the researchers employed variations of
the retrospective pretest design: (a) pre-post/then, (b) pre-then-post, and (c) pre-post-then.
Comparing thentest scores between the pre-post/then (n = 12) and pre-post-then (n = 9) groups
yielded no statistical difference. Comparing posttest scores between the pre-post/then and pre-
then-post (n = 9) groups yielded no statistical difference. Comparing posttest scores between pre-
then-post and pre-post-then groups yielded no statistical difference. Comparing thentest scores
between pre-then-post and pre-post-then groups yielded no statistical difference. The researchers
concluded that the retrospective pretest design was not sensitive to order effects. In particular,
they noted that asking for posttest ratings did not significantly impact thentest ratings. Similarly,
they indicated that asking for thentest ratings did not significantly impact posttest ratings. While
these conclusions were presented in the context of an effective intervention, the researchers did
not establish concurrent validity of group posttest or thentest scores. It is also important to note
that the results of the statistical significance tests may have been a result of an insufficient
sample size and large standard deviations of MPS scores.
21
Memory Distortion
Irrespective of the work of Howard, Ralph, et al. (1979) indicating that response-shift
reflects something more than mere systematic memory distortions, the most commonly cited
threat to the validity of thentest measurements is the effect of memory on the retrospective
process (Nimon & Allen, 2007). While the term lacks consensus among investigators as to the
criteria that define memory distortion in retrospective pretests (Babcock, 1997), a review of the
literature reveals two theoretically and empirically tested interpretations: (a) personal recall and
(b) impression management.
Personal Recall
Norman (2003) presented two studies (Ross & Conway, 1986; Sprangers & Hoogstraten,
1989) to demonstrate how the process of interpreting personal recall can lead to opposite
conclusions regarding the validity of retrospective measures. In Sprangers and Hoogstraten’s
study, subjects’ retrospective accounts corresponded with an objective measure and are
presumed by Norman to be supported by implicit theories of change and stability. In Conway’s
study, subjects’ retrospective measures did not correspond to objective measures of change and
were presumed to be distorted by implicit theories of change. Note that the attachment of implicit
theory as being right or wrong required an external referent in both studies. These studies lend
support for the claim of Umble et al. (2000) that outcome measures based on retrospective
pretest designs should be validated by an objective measure.
Retrospective measures validated by implicit theories. In 1989, Sprangers and
Hoogstraten conducted two experiments. In both experiments, subjects enrolled in a
22
communication skills course were divided into experimental and control groups. The key
differences between the two experiments were the effectiveness of the intervention and its
impact on the retrospective measures (Norman, 2003). The program in the first experiment was
deemed ineffective because no statistically significant difference was found between the
experimental and control groups’ subjective and objective post-intervention measures. Similarly,
no response-shift was detected in the first experimental treatment subgroup because thentest and
pretest scores were not statistically or practically significantly different. The program in the
second experiment was deemed effective because no statistically and practically significant
differences were found between experimental and control groups’ behavioral and self-report
measures. Consistent with the effect of response-shift, the second experimental treatment
subgroup yielded thentest and pretest scores that were statistically and practically significantly
different.
Norman (2003) concluded that participants in the first experiment based their
retrospective accounts on an implicit theory of stability, whereas participants in the second
experiment based their accounts on an implicit theory of change. He inferred that in both cases,
participants applied implicit theories based on the perceived effectiveness of the intervention to
gauge how far off there initial estimates were. He further noted that the extrapolation back to the
initial state turned out to be as valid or better than the first estimate.
Retrospective measures invalidated by implicit theories. In Ross and Conway’s (1986)
study, students wishing to participate in a study skills program evaluated their current skills and
then were randomly assigned to either an experimental group or a wait–list control group. The
students in the experimental group participated in a training program that did not improve their
23
skills on any objective measure. Following the training, the experimental and control groups
returned, and both groups were asked to recall their initial evaluations of their skills.
Experimental program participants recalled their original evaluation of their study skills as being
worse than they had reported originally. Control subjects exhibited no system bias in recall.
Academic grades were not affected by the program for either experimental or control subjects.
Based on the results of the study, Ross and Conway (1986) concluded that participants in
the experimental group applied an implicit theory of change, because they reported their prior
skills as being much worse than they were after training. That is, they retrospectively reported
having poorer pretraining skills than they indicated before training, confirming their expectation
of the program’s success. These results were obtained despite incentives to respondents to recall
their earlier answers as accurately as possible (Schwarz, in press). Therefore, the researchers
further concluded that the respondents’ actions were consistent with an implicit theory of change
and distinct from the theoretical interpretation of impression management. In particular, Ross
and Conway stated:
Conceivably, to look good and to please the program leader, program participants could have intentionally derogated their past so as to glorify the present. But what is the point of purposely rewriting the past when the experimenters assert that they can and will assess the accuracy of the recall? (p. 137) It is important to note that while Ross and Conway’s (1986) study is cited as validation of
personal recall theory (e.g., Schwarz, in press), the thentest asked participants to recall their
earlier rating. However, in practice the thentest is used to recall conditions that exist before an
intervention and to assess these conditions from a new perspective (Sprangers & Hoogstraten,
1989). Therefore, although the study demonstrates the fallibility of retrospective measures, it
describes a situation different from the typical use of the thentest (Babcock, 1997).
24
Impression Management
A review of literature referencing Howard, Ralph, et al. (1979) and examining the effect
of impression management on retrospective measures yields three relevant studies: Howard,
Millham, Slaten, and O’Donnel, 1981; Sprangers, 1989; and Sprangers and Hoogstraten, 1991.
Howard et al. (1981) divided 40 students interested in assertiveness training into a control
and experimental group. Following Howard, Ralph, et al. (1979) procedural guidelines, both
groups completed a pretest, posttest, and thentest on two measures related to the intervention and
a control measure. Objective ratings of assertiveness and measures of social desirability were
also obtained prior to and after the intervention. Howard et al. (1981) found that there was no
evidence for the operation of impression management influencing the shifts in evaluation
obtained by employing the thentest. As evidence for their conclusion, they specified that the self-
report experimental measures’ then-post indices of change correlated more highly with objective
measures of change than post-pre self-report indices. They further noted that within the
experimental group, scores on thentest experimental measures shared less common variance with
social desirability scores than pretest scores. The researchers argued that the retrospective
measures appeared to be less socially desirable than traditional pretest measures. In contrast, the
relationship between social desirability responding and thentest experimental measures in the
control group did not differ from those obtained at pretest. Based on these results, the researchers
concluded that the intervention not only increased assertiveness, but also reduced social
desirability responding in retrospective measures of pretreatment assertiveness. They also noted
that the effect was specific, because the relationship between the control measure and social
desirability responding was not impacted by treatment effect or measurement occasion (pretest,
thentest).
25
Using the term subject bias in lieu of social desirability bias (Babcock, 1997), Sprangers
(1989) conducted research on the premise that a method for identifying subject-bias in pre-
post/then and related designs (e.g., pre-post-then, pre-then-post) was to include a placebo control
condition. She asserted that because placebo subjects devote the same amount of time and effort
to the placebo treatment as do experimental subjects to an experimental intervention, a
significant pre-then difference in the placebo condition can be attributed to subject bias, thus
invalidating experience limitation as a valid response-shift explanation. Of the studies she
reviewed, eight included a placebo control condition. Of the eight, one study reported significant
pre-then differences scores in both the experimental and placebo control conditions. While
subject bias was not proven to be a consistent alternative to experience limitation, Sprangers
advised that researchers be aware of this form of bias and incorporate a control condition to
differentiate between experience limitation and subject bias.
Sprangers and Hoogstraten (1991) conducted a follow-up study employing a
retrospective pretest design with an experimental, a placebo, and a no-treatment control
condition. The sample consisted of 64 psychology freshman enrolled in a study skills training. In
addition to completing a conventional pretest, participants provided posttest and thentest
responses to a self-report measure. Participants first completed all posttest items and then while
keeping the posttest in front of them, they indicated how they perceived themselves to have been
prior to training. The researchers found significant mean post-then and post-pre difference scores
in the experimental group, but not in the control group. In the placebo group, they found
significant mean post-then difference scores. They concluded that post-then difference scores
were not free from subject bias. Making recommendations similar to Sprangers’s (1989), they
26
advocated that retrospective pretest designs include a control condition and an independent
measure of change to mitigate the effect of subject bias.
Summary
This chapter included an overview of research that laid the foundation for the evolution
of the retrospective pretest and a review of representative studies employing its use. It also
described prior research that examined the effects of pretest sensitization, post-intervention
survey order, and memory distortion on retrospective pretest designs. Chapter 3 discusses the
methodology used to execute this study.
27
CHAPTER 3
METHODS
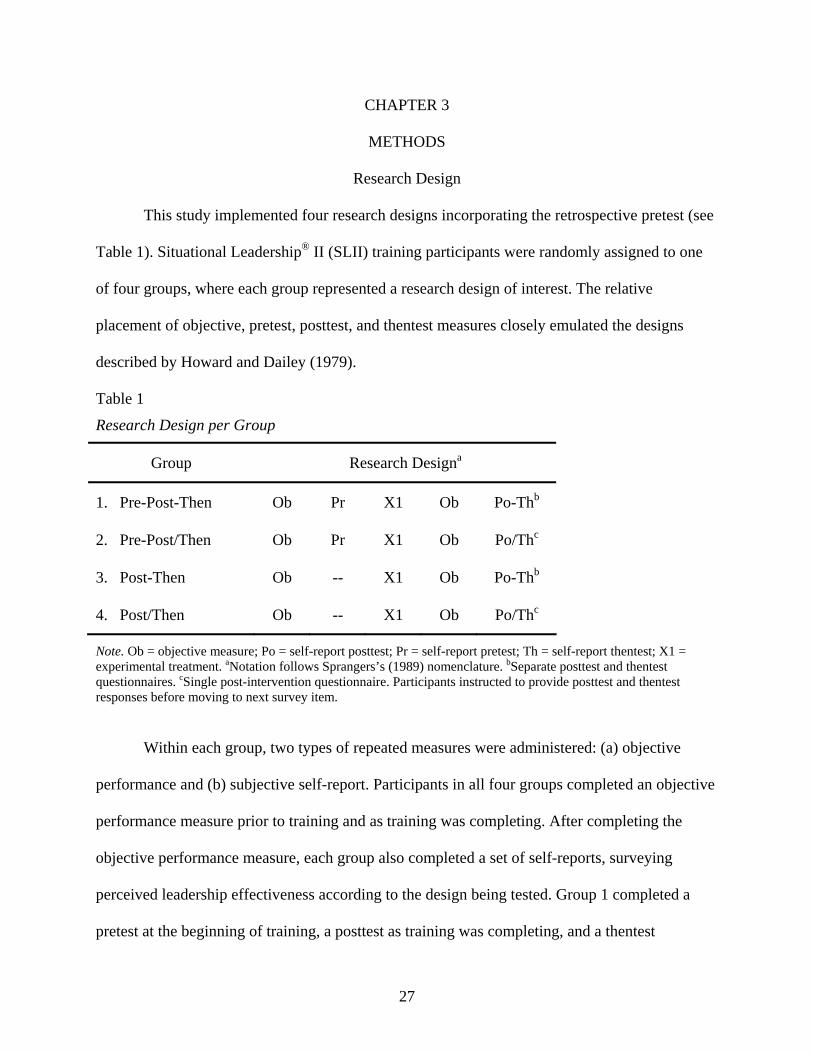
Research Design
This study implemented four research designs incorporating the retrospective pretest (see
Table 1). Situational Leadership® II (SLII) training participants were randomly assigned to one
of four groups, where each group represented a research design of interest. The relative
placement of objective, pretest, posttest, and thentest measures closely emulated the designs
described by Howard and Dailey (1979).
Table 1
Research Design per Group
Group Research Designa
1. Pre-Post-Then Ob Pr X1 Ob Po-Thb
2. Pre-Post/Then Ob Pr X1 Ob Po/Thc
3. Post-Then Ob -- X1 Ob Po-Thb
4. Post/Then Ob -- X1 Ob Po/Thc
Note. Ob = objective measure; Po = self-report posttest; Pr = self-report pretest; Th = self-report thentest; X1 = experimental treatment. aNotation follows Sprangers’s (1989) nomenclature. bSeparate posttest and thentest questionnaires. cSingle post-intervention questionnaire. Participants instructed to provide posttest and thentest responses before moving to next survey item.
Within each group, two types of repeated measures were administered: (a) objective
performance and (b) subjective self-report. Participants in all four groups completed an objective
performance measure prior to training and as training was completing. After completing the
objective performance measure, each group also completed a set of self-reports, surveying
perceived leadership effectiveness according to the design being tested. Group 1 completed a
pretest at the beginning of training, a posttest as training was completing, and a thentest

28
following the posttest. Group 2 completed a pretest at the beginning of training and a combined
posttest/thentest as training was completing. Group 3 completed a posttest as training was
completing and a thentest following the posttest. Group 4 completed a combined posttest/thentest
as training was completed.
Population
The target population for this study is situational leadership® training workshop
participants. Situational leadership training workshops target individuals in leadership positions
at multiple levels in the organizations, from executive to supervisor. The training has been used
to develop leaders across a wide variety of industry and organizational types.
There are three primary reasons for targeting this population. First, considering all levels
of leadership roles (e.g., executive, manager, supervisor), leadership training accounted for over
18% of the learning content proposed for 2005 (Sugrue & Rivera, 2005). Second, in a review of
leadership training evaluation programs, the W. K. Kellogg Foundation (2002) cited the
retrospective pretest as an important tool. Third, the situational leadership models are some of
the most widely used leadership models in the world today (Blanchard, Fowler, & Hawkins,
2005; Center for Leadership Studies, 2005). The Center for Leadership Studies indicated that the
situational leadership model serves as the basis for leadership systems in over 700 of the Fortune
1000 companies. Blanchard, Fowler, et al. reported that millions of managers in Fortune 500
companies and small businesses nationwide have been trained to follow the SLII model.
Sample
Participants from seven SLII training programs provided the data for this study. The SLII
29
training programs were all facilitated by certified trainers employed by the same international
training company. The SLII training program is based on the SLII model and is designed to teach
managers how to identify the needs of their employees and tailor their management style to each
situation. For a full description of the SLII model, see Blanchard (1994).
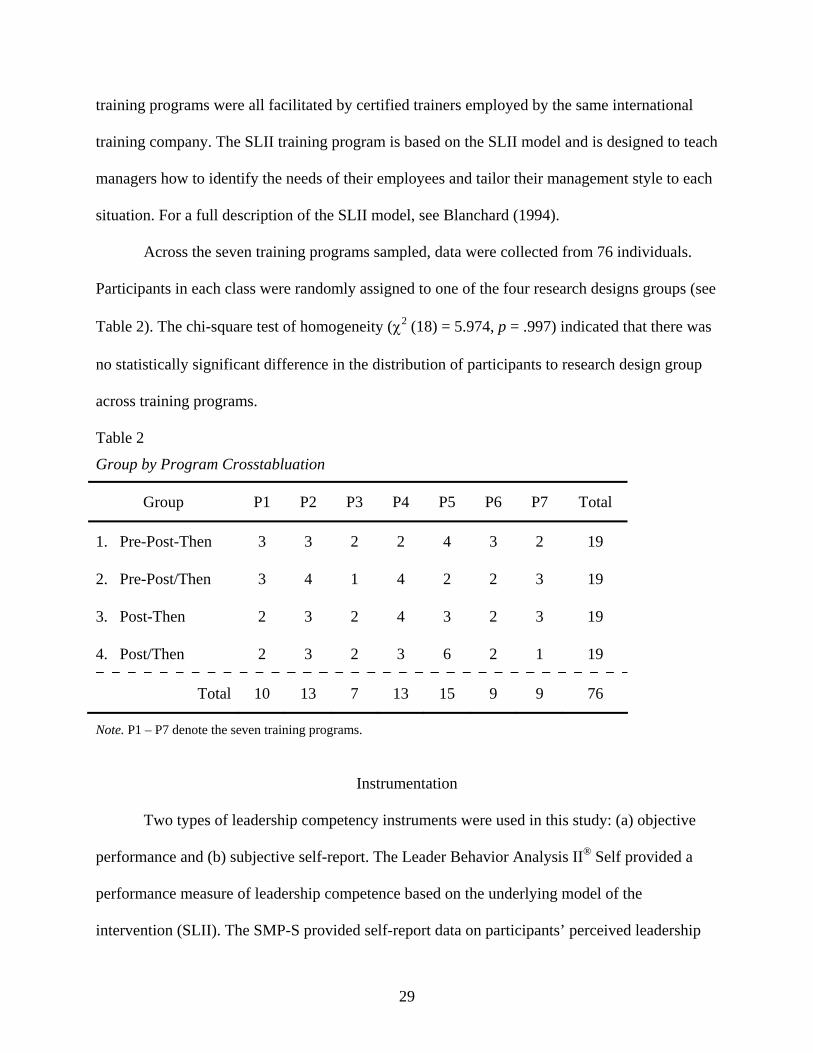
Across the seven training programs sampled, data were collected from 76 individuals.
Participants in each class were randomly assigned to one of the four research designs groups (see
Table 2). The chi-square test of homogeneity (χ2 (18) = 5.974, p = .997) indicated that there was
no statistically significant difference in the distribution of participants to research design group
across training programs.
Table 2
Group by Program Crosstabluation
Group P1 P2 P3 P4 P5 P6 P7 Total
1. Pre-Post-Then 3 3 2 2 4 3 2 19
2. Pre-Post/Then 3 4 1 4 2 2 3 19
3. Post-Then 2 3 2 4 3 2 3 19
4. Post/Then 2 3 2 3 6 2 1 19
Total 10 13 7 13 15 9 9 76
Note. P1 – P7 denote the seven training programs.
Instrumentation
Two types of leadership competency instruments were used in this study: (a) objective
performance and (b) subjective self-report. The Leader Behavior Analysis II® Self provided a
performance measure of leadership competence based on the underlying model of the
intervention (SLII). The SMP-S provided self-report data on participants’ perceived leadership
30
competence. Two subjective self-report constructs were analyzed − a construct consistent with
the intervention (SMP-SEXP) and a construct not covered in the training (SMP-SCTL). The
following sections provide a brief description of the instruments and their relevant scales,
techniques used to assess data reliability and validity, and instrument layout and directions.
Leader Behavior Analysis II
The Leader Behavior Analysis II Self is a 20-item instrument modeled after the SLII
model. The instrument portrays typical job situations and asks respondents to choose among four
leadership responses to each scenario posed. The items test respondents’ ability to correctly
match leadership styles to levels of follower readiness, according to the SLII model.
The construct validity of the LBAII contributes to this study’s nomological net of
measures and treatment. Describing the initial phase of establishing construct validity for the
LBAII, Zigarmi et al. (1997) noted that the structure of the instrument was based upon
characteristics of situational leadership defined in literature and was congruent with the SLII
model. This level of construct validity is relevant because the training on the SLII model served
as the treatment effect in this study.
Describing the empirical process of establishing construct validity of the LBAII, Zigarmi
et al. (1997) reported the results of a study based on a sample of 552 individuals completing the
LBAII-O and the SMP-O. The SMP was chosen because Zigarmi et al. expected that the skill of
matching leadership style to employee development level (operationalized by the LBAII) would
be statistically confirmed by the task cycle® of leadership advocated by Wilson (1988) and
operationalized by the SMP. Results from the study indicated that many of the subconstructs of
the LBAII-O and SMP-O were positively and highly correlated. Zigarmi et al. thereby made the
31
generalization that since many of the subconstructs were in concert, the LBAII and SMP were
measuring the same construct of leadership. Further, Zigarmi et al. indicated that the validity
results of the LBAII-O could be applied to the LBAII-S.
Although the LBAII-S yields six measures, the Effectiveness Scale is considered the
most important score because it is the “raison d’etre for the model” and is correlated to “key
managerial behavior researched by other authors of management” (Zigarmi et al., 1997, p. 28).
Therefore, it served as the objective measure of leadership competence in this study.
Effectiveness Scale. Effectiveness scores range from 20 to 80, with each item having a
maximum score of 4 and a minimum score of 1. Reliability of LBAII Effectiveness scores was
examined by Punch (as cited in Zigarmi et al., 1997). Punch conducted a Rasch analysis and
found that 15 of the 20 items fit the response model very well, 2 items overdiscriminated, and 3
items under discriminated. McDermot (as cited in Zigarmi et al., 1979) found that LBAII-SEF
scores discriminated between managers who attended a 3-day SLII training workshop and a
matched group of managers who did not. Zigarmi et al. found that, with the exception of other-
responses to the SMP Scales of Goal Pressure, Work Involvement, Co-Worker Competence,
Team Atmosphere, Climate, and Commitment, LBAII-OEF scores positively related to the
managerial dimensions measured by the SMP-O.
Survey of Management Practices
The SMP consists of 145 items designed to measure managerial competency on 11 skills
and 12 attributes (Wilson, 2006). The instrument incorporates a 7-item Likert scale with
appropriate anchors for a competency-based scale (Shipper, 1995). Successive versions of the
32
instrument have been judged to reflect accepted standards of instrument development and
psychometric properties (Morrison et al., 1978; Shipper, 1999; Val Velsor & Leslie, 1991;
Wilson, 1978). As it relates to this study, the SMP scales of Work Involvement and Clarification
of Goals and Objectives are relevant. Based on the validity analysis conducted by Zigarmi et al.
(1997) and communication with the author of the LBAII (D. Zigarmi, personal communication,
January 22, 2007), the Work Involvement Scale served as the study’s self-report control measure
(SMP-SCTL), and the Clarification of Goals and Objectives Scale served as the study’s self-report
experimental measure (SMP-SEXP).
Work Involvement Scale. The aim of the Work Involvement Scale was to appraise to what
extent work, as work, provided a level of interest, involvement, and challenge (Wilson, 1978).
The Work Involvement Scale contains 5 items, with each item having a maximum score of 7 and
a minimum score of 1. Item responses were averaged to obtain scale scores.
Based on a sample of 99 self-responses and 556 other-responses to Form G of the
instrument, reliability of Work Involvement scores was examined by Wilson in 1978. The self-
and other-responses to the scale, respectively, yielded coefficient alphas of .90 and .91.
Zigarmi et al. (1997) provided evidence of discriminate validity between SMP Work
Involvement Scale scores and LBAII Effectiveness Scale scores. In their study, scores were
compared by categorizing LBAII Effectiveness Scale scores. The top third scores were
categorized as high. The bottom third scores were categorized as low. A comparison between the
means of the two groups yielded no statistical difference in Work Involvement Scale scores.

33
Clarification of Goals and Objectives Scale. The aim of the Clarification of Goals and
Objectives Scale was to appraise to what extent managers set, clarify, and give goals a priority
(Wilson, 1978). The Clarification of Goals and Objectives Scale contains 7 items, with each item
having a maximum score of 7 and a minimum score of 1. Items marked not applicable (NA)
were assigned a score based on how the corresponding participant responded to the rest of the
scale. Item responses were averaged to obtain scale scores.
Based on a sample of 99 self-responses and 556 other-responses to Form G of the
instrument, the reliability of Clarification of Goals and Objectives Scale scores was examined by
Wilson in 1978. The self- and other-responses to the scale, respectively, yielded coefficient
alphas of .87 and .93.
Zigarmi et al. (1997) provided evidence of concurrent validity between SMP Clarification
of Goals and Objectives Scale scores and LBAII Effectiveness Scale scores, as other-responses
to the two scales shared a significant amount of common variance. Correlating scores from the
two scales across a sample of 552 respondents produced a correlation coefficient of .389.
Reliability
To assess the data reliability of observed variables, coefficient alphas were calculated
separately for group subsamples on each analyzed repeated measure of the SMP-SCTL, SMP-
SEXP, and LBAII-SEF. The data reliability of gain scores analyzed in the study was assessed via
the formula defined by Williams and Zimmerman (1996), which expresses reliability of a
difference as a function of the reliability of components using the ratio of the repeated measures’
standard deviations and the correlation between scores as parameters. The formula is:
[ ] [ ]XYXYYYXXDD ρλλρρλλρρ −+−+= −− 1'
1'' /2 (3.1)
34
where λ is the ratio of pretest (or thentest) standard deviation (SD) and posttest SD, 'XXρ is the
reliability of pretest (or thentest) scores, 'YYρ is the reliability of posttest scores, and XYρ is the
correlation between pretest (or thentest) and posttest scores.
Data reliability estimates were compared to internal consistency measurements of other
studies as well as measurements within the study. The similarity of reliability estimates was
analyzed by examining the confidence intervals around the reliability estimates (Fan &
Thompson, 2001).
Validity
Data validity was assessed by replicating analyses conducted by Zigarmi et al. (1997) and
Howard, Ralph, et al. (1979). The data validity of each group of SMP-SCTL scores was assessed
by comparing SMP-SCTL thentest scores between individuals who scored high on the LBAII-S
Effectiveness Scale to those who scored low. Data validity of each group of SMP-SEXP scores
was assessed by correlating thentest and posttest-thentest gain scores to like measures from the
LBAII-S. Data validity estimates were compared to results from other studies as well as
measurements within the study. The similarity of data validity estimates for SMP-SEXP scores
was analyzed using the z statistic, defined in Hinkle et al. (2003):
z =
31
31
21
'2
'1
−+
−
−
nn
rr (3.2)
where r equals the standard transformation of correlation coefficients as defined by Cohen (1988,
p. 110) (see Formula 3.3) and n equals group size.
⎟⎠⎞
⎜⎝⎛−+
=rrr
11log
21' (3.3)

35
where r equals the correlation between measures.
Administration
Across all participants and measurement occasions, the LBAII-S was administered in its
original form. The layout of and the participant directions for the set of SMP-S scales differed
according to measurement occasion and retrospective pretest design group.
The layout of the pretest, posttest, and thentest self-report measures modeled the layout
of the original SMP. The layout of the combined posttest/thentest measure modeled the
instrument layout illustrated in Taylor-Pownell and Renner (2000). The SMP items, posttest
responses, and thentest responses were laid out adjacently with posttest responses to the right of
SMP items, and thentest responses to the right of posttest responses.
The directions for the pretest and posttest instruments modeled the directions of the
original SMP. Across all groups, directions for instrumentation involving thentest items followed
guidelines established by Howard, Ralph, et al. (1979) and asked participants to reassess their
pre-intervention behavior. In addition, the directions for instrumentation involving thentest items
differed by research design group. Directions for thentest and posttest/thentest instrumentation
for participants in Groups 1 and 2, who had completed a pretest, followed guidelines established
by Mezoff (1981a) and asked participants not to recall their prior answers or worry whether their
reevaluated ratings agreed or disagreed with prior ratings. Thentest directions for participants in
Groups 2 and 4, which were combined with posttest directions, followed guidelines established
by Mezoff (1981b) and indicated that there might be no differences between posttest and thentest
ratings. Appendix B contains figures illustrating the instructions for instrumentation involving
thentest items for each of the four groups.
36
Data Collection
Data were collected from SLII participants at two different times. The data collection was
administered by the facilitator conducting the training and managed by a set of prepared
envelopes individually addressed to each participant. As training was beginning, participants
received a pre-assessment envelope containing a set of surveys to collect pretest data. As training
was completing, participants received a post-assessment envelope containing a set of surveys to
collect posttest and thentest data.
Pre-Assessment
In the pre-assessment packet, participants received a cover letter asking them to complete
a set of assessments. Because the assessment packets for Groups 1 and 2 contained two surveys
(each enclosed in its own envelope), the cover letter for participants in Groups 1 and 2 also asked
that they complete the surveys in the order indicated on the outer envelopes. Additionally, the
cover letter for Groups 1 and 2 asked participants to place each completed survey back into its
respective envelope before moving on to the next form.
For all participants, the first survey asked participants to copy their answers, from the
LBAII-S they took prior to attending training, to an evaluation form. This prevented participants
from having to give up their copy of the LBAII-S. The second survey asked participants to
provide pretest responses to the SMP-S. Only the pre-assessment packets for participants in
Groups 1 and 2 contained the second survey.
Post-Assessment
In the post-assessment packet, participants received a cover letter asking them to
37
complete a set of assessments. The cover letter asked participants to complete the surveys in the
order indicated and place each completed survey back in its respective envelope before moving
on to the next form.
The post-assessment packets for participants in Groups 1 and 3 contained three surveys.
The post-assessment packets for participants in Group 2 and 4 contained two surveys. For all
participants, the first survey in the post-assessment packet was the LBAII-S. For participants in
Group 1 and 3, the second survey asked participants to provide posttest responses to the set of
SMP-S scales. For participants in Groups 2 and 4, the second survey asked participants to
provide posttest and thentest responses to the set of SMP-S scales. For participants in Groups 1
and 3, the third survey asked participants to provide thentest responses to the set of SMP-S
scales.
Data Analysis
The data were analyzed using SPSS® version 14.0 and R version 2.3.1. Subsequent to
examining data reliability and validity, analyses were conducted specific to each research
question.
Research Questions 1-2
Research Questions 1 and 2 considered the statistical and practical significance of
measurement outcomes derived from SLII training participants’ responses to a control and an
experimental measure. For each measure, parallel analyses were conducted to test the (a)
interaction effect between retrospective pretest design group (i.e., pre-post-then, pre-post/then,
post-then, and post/then) and measurement occasion (i.e., posttest, thentest); (b) simple effects of

38
retrospective pretest design group at each measurement occasion; and (c) simple effects of
measurement occasion at each retrospective pretest design group. For these analyses, alpha was
maintained at .05 following Winer’s guidelines (as cited in Huck & McLean, 1975).
Research questions 1 and 2 are as follows:
1. Is there a difference in measurement outcomes, derived from SLII training participants’ responses to a subjective control measure, among four retrospective pretest design groups?
2. Is there a difference in measurement outcomes, derived from SLII training participants’ responses to a subjective experimental measure, among four retrospective pretest design groups?
Interaction effects - Ho1A and Ho2A. To determine the statistical significance of
differences in posttest-thentest gain scores between groups, two split-plot ANOVAs were
conducted. Each of the two split-plot ANOVAs had one within-subjects factor (occasion) and
one between-subjects factor (group). The within-subjects factor for research question 1 had two
levels: posttest and thentest responses to the SMP-SCTL. The within-subjects factor for research
question 2 had two levels: posttest and thentest responses to the SMP-SCTL. The between-
subjects factor for the two split-plot ANOVAs was identical, representing the four research
designs under study. The null hypotheses are as follows:
Ho1A: There is no statistically significant interaction between group and occasion, as measured by posttest and thentest responses to the SMP-SCTL.
Ho2A: There is no statistically significant interaction between group and occasion, as measured by posttest and thentest responses to the SMP-SEXP.
The interaction effect of each of the split-plot ANOVAs identified whether the
differences in repeated measures between groups were statistically significant. To determine the
practical effect of the interaction between group and occasion, eta squared was calculated as
defined by Tabachnick and Fidell (2001, p. 338):
39
Λ−= 12η (3.4)
where Λis the ratio of the determinant error matrix of the error cross-products matrix to the
determinant of the sum of the error and effect cross-products matrices. Eta squared values of .01,
.09, and .25 were respectively interpreted as small, medium, and large effects, following Cohen’s
(1988) general guidelines.
Simple effects of group at occasion – Ho1B, C and Ho2B, C. To determine the statistical
significance of differences in posttest and thentest scores between groups, two tests of simple
effects were conducted for each research question. For research question 1, the simple effects of
group at the SMP-SCTL posttest occasion and group at the SMP-SCTL thentest occasion were
tested. For research question 2, the simple effects of group at the SMP-SEXP posttest occasion
and group at the SMP-SEXP thentest occasion were tested. The null hypotheses are as follows:
H o1B: There is no statistically significant simple effect of group at the posttest occasion, as measured by the SMP-SCTL.
H o1C: There is no statistically significant simple effect of group at the thentest occasion, as measured by the SMP-SCTL.
H o2B: There is no statistically significant simple effect of group at the posttest occasion, as measured by the SMP-SEXP.
H o2C: There is no statistically significant simple effect of group at the thentest occasion, as measured by the SMP-SEXP.
To determine the practical significance of the simple effect of group at each occasion, eta
squared was calculated as defined by Hinkle et al. (2003, p. 540):
T
B
SSSS
=2η (3.5)
where SSB denotes sums of squares between and SST denotes sums of squares total. Eta squared
values of .01, .09, and .25 were respectively interpreted as small, medium, and large effects,
40
following Cohen’s (1988) general guidelines.
Simple effects of occasion at group - Ho1D, E, F, G and Ho2 D, E, F, G. To determine whether
the posttest and thentest scores within each group were statistically significantly different from
each other, four tests of simple effects were conducted for each research question. For research
question 1, the simple effects of occasion (SMP-SCTL posttest, SMP-SCTL thentest) at each group
were tested. For research question 2, the simple effects of occasion (SMP-SEXP posttest, SMP-
SEXP thentest) at each group were tested. The null hypotheses are as follows:
H o1D: There is no statistically significant simple effect of occasion at Group 1, as measured by posttest and thentest responses to the SMP-SCTL.
H o1E: There is no statistically significant simple effect of occasion at Group 2, as measured by posttest and thentest responses to the SMP-SCTL.
H o1F: There is no statistically significant simple effect of occasion at Group 3, as measured by posttest and thentest responses to the SMP-SCTL.
H o1G: There is no statistically significant simple effect of occasion at Group 4, as measured by posttest and thentest responses to the SMP-SCTL.
H o2D: There is no statistically significant simple effect of occasion at Group 1, as measured by posttest and thentest responses to the SMP-SEXP.
H o2E: There is no statistically significant simple effect of occasion at Group 2, as measured by posttest and thentest responses to the SMP-SEXP.
H o2F: There is no statistically significant simple effect of occasion at Group 3, as measured by posttest and thentest responses to the SMP-SEXP.
H o2G: There is no statistically significant simple effect of occasion at Group 4, as measured by posttest and thentest responses to the SMP-SEXP.
To determine the practical significance of the simple effects of occasion at each group, d
was calculated as defined by Dunlap, Cortina, Vaslow, and Burke (1996, p. 171):
2/1]/)1(2[ nrtd c −= (3.6)
41
where tc is t for correlated measures, r is the correlation between measures, and n is the sample
size per group. Cohen d values of .20, .50, and .80 were respectively interpreted as small,
medium, and large effects, following Cohen’s (1988) general guidelines.
Summary
This chapter discussed the research design, population, sample, instrumentation, data
collection, and data analysis procedures required to answer the study’s research questions.
Chapter 4 contains the findings from this study.
42
CHAPTER 4
FINDINGS
Overview
The purpose of this study was to compare outcome measures resulting from four research
design implementations incorporating the retrospective pretest: (1) pre-post-then, (2) pre-
post/then, (3) post-then, and (4) post/then. The study analyzed the interaction effect of pretest
sensitization and post-intervention survey order on two subjective measures: (a) a control
measure not related to the intervention (SMP-SCTL) and (b) an experimental measure consistent
with the intervention (SMP-SEXP). The Effectiveness Scale of the self version of the Leader
Behavior Analysis II® (LBAII-SEF) provided an objective measure of performance, used to
estimate data validity of the subjective measures.
This chapter reports the study’s findings. The Data Assessment section outlines results
from reliability, validity, and missing values analyses. The Descriptive Statistics section outlines
the mean, standard deviation, normality, and kurtosis values for key variables. The Statistical
Assumptions section describes how the data met the necessary statistical assumptions associated
with the study’s null hypotheses. The Data Analyses section reviews the results of the null
hypotheses testing. The chapter concludes with a Summary section.
Data Assessment
Key data collected from Situational Leadership® II (SLII) training participants were
assessed for reliability, validity, and missing values. Data reliability was assessed by computing
coefficient alphas on groups of observed scores and applying Formula 3.1 to groups of gain
scores. Data validity was assessed by replicating analyses conducted by Zigarmi et al. (1997) and
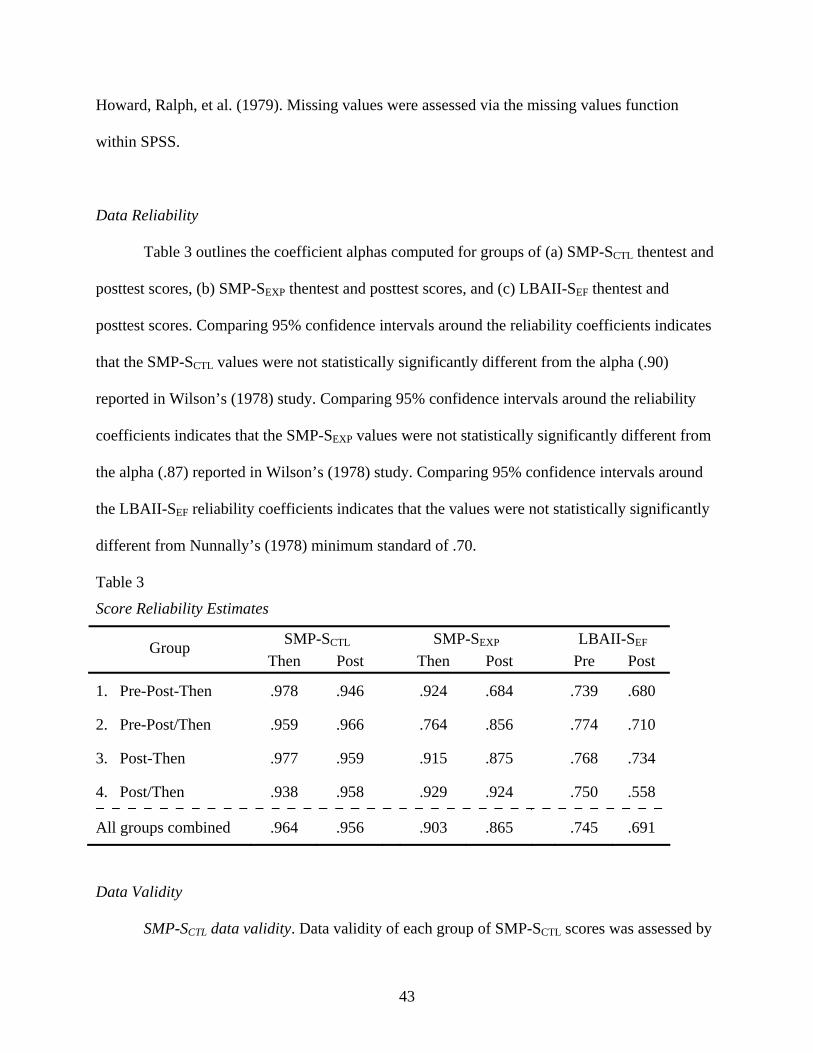
43
Howard, Ralph, et al. (1979). Missing values were assessed via the missing values function
within SPSS.
Data Reliability
Table 3 outlines the coefficient alphas computed for groups of (a) SMP-SCTL thentest and
posttest scores, (b) SMP-SEXP thentest and posttest scores, and (c) LBAII-SEF thentest and
posttest scores. Comparing 95% confidence intervals around the reliability coefficients indicates
that the SMP-SCTL values were not statistically significantly different from the alpha (.90)
reported in Wilson’s (1978) study. Comparing 95% confidence intervals around the reliability
coefficients indicates that the SMP-SEXP values were not statistically significantly different from
the alpha (.87) reported in Wilson’s (1978) study. Comparing 95% confidence intervals around
the LBAII-SEF reliability coefficients indicates that the values were not statistically significantly
different from Nunnally’s (1978) minimum standard of .70.
Table 3
Score Reliability Estimates
Data Validity
SMP-SCTL data validity. Data validity of each group of SMP-SCTL scores was assessed by
SMP-SCTL SMP-SEXP LBAII-SEF Group Then Post Then Post Pre Post
1. Pre-Post-Then .978 .946 .924 .684 .739 .680
2. Pre-Post/Then .959 .966 .764 .856 .774 .710
3. Post-Then .977 .959 .915 .875 .768 .734
4. Post/Then .938 .958 .929 .924 .750 .558
All groups combined .964 .956 .903 .865 .745 .691
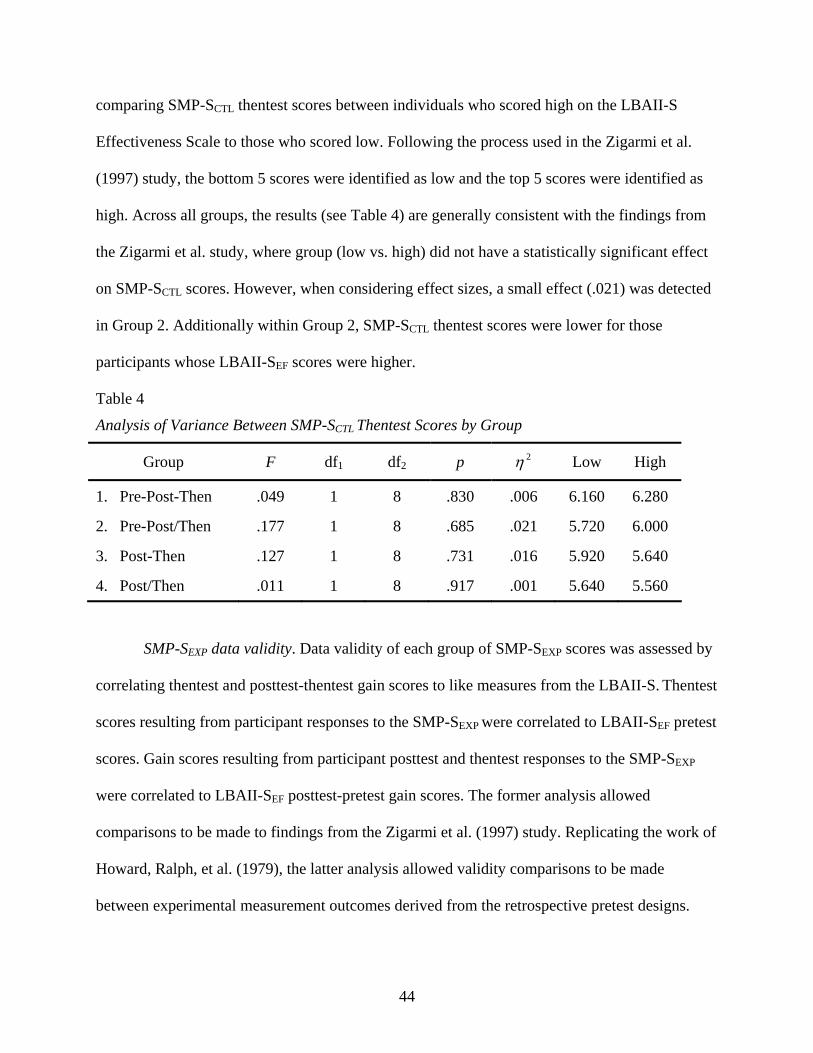
44
comparing SMP-SCTL thentest scores between individuals who scored high on the LBAII-S
Effectiveness Scale to those who scored low. Following the process used in the Zigarmi et al.
(1997) study, the bottom 5 scores were identified as low and the top 5 scores were identified as
high. Across all groups, the results (see Table 4) are generally consistent with the findings from
the Zigarmi et al. study, where group (low vs. high) did not have a statistically significant effect
on SMP-SCTL scores. However, when considering effect sizes, a small effect (.021) was detected
in Group 2. Additionally within Group 2, SMP-SCTL thentest scores were lower for those
participants whose LBAII-SEF scores were higher.
Table 4
Analysis of Variance Between SMP-SCTL Thentest Scores by Group
Group F df1 df2 p 2η Low High
1. Pre-Post-Then .049 1 8 .830 .006 6.160 6.280
2. Pre-Post/Then .177 1 8 .685 .021 5.720 6.000
3. Post-Then .127 1 8 .731 .016 5.920 5.640
4. Post/Then .011 1 8 .917 .001 5.640 5.560
SMP-SEXP data validity. Data validity of each group of SMP-SEXP scores was assessed by
correlating thentest and posttest-thentest gain scores to like measures from the LBAII-S. Thentest
scores resulting from participant responses to the SMP-SEXP were correlated to LBAII-SEF pretest
scores. Gain scores resulting from participant posttest and thentest responses to the SMP-SEXP
were correlated to LBAII-SEF posttest-pretest gain scores. The former analysis allowed
comparisons to be made to findings from the Zigarmi et al. (1997) study. Replicating the work of
Howard, Ralph, et al. (1979), the latter analysis allowed validity comparisons to be made
between experimental measurement outcomes derived from the retrospective pretest designs.
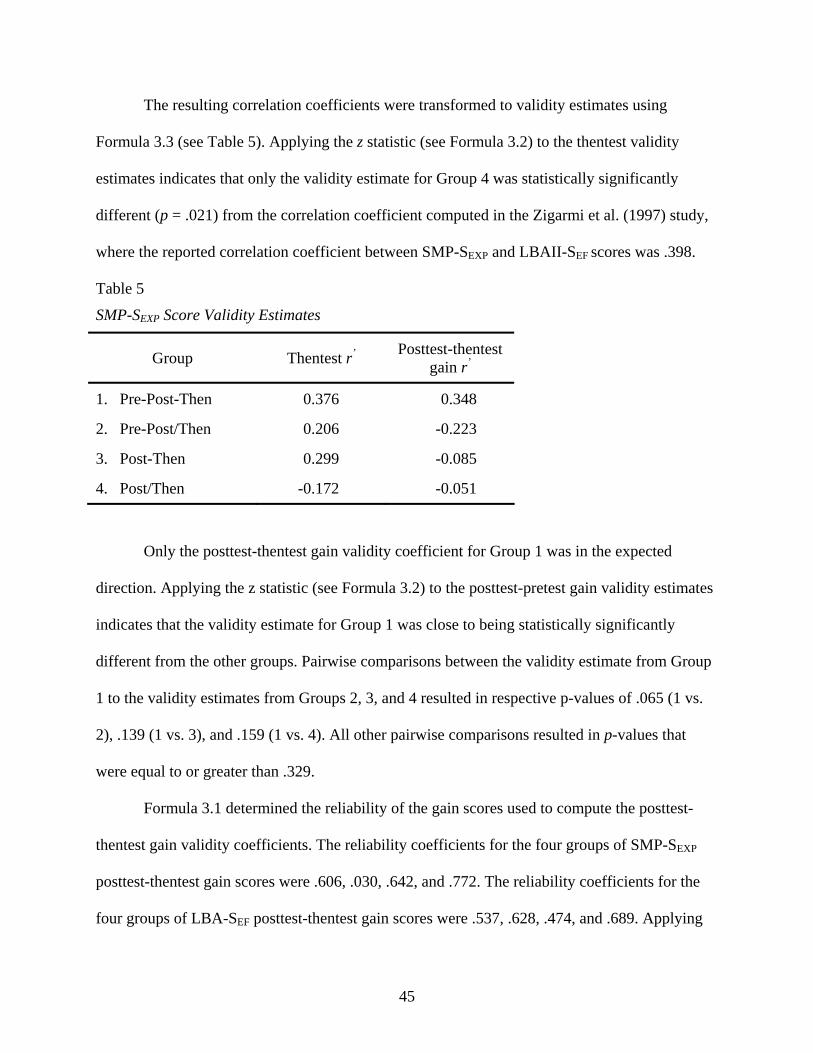
45
The resulting correlation coefficients were transformed to validity estimates using
Formula 3.3 (see Table 5). Applying the z statistic (see Formula 3.2) to the thentest validity
estimates indicates that only the validity estimate for Group 4 was statistically significantly
different (p = .021) from the correlation coefficient computed in the Zigarmi et al. (1997) study,
where the reported correlation coefficient between SMP-SEXP and LBAII-SEF scores was .398.
Table 5
SMP-SEXP Score Validity Estimates
Group Thentest r’ Posttest-thentest gain r’
1. Pre-Post-Then 0.376 0.348
2. Pre-Post/Then 0.206 -0.223
3. Post-Then 0.299 -0.085
4. Post/Then -0.172 -0.051
Only the posttest-thentest gain validity coefficient for Group 1 was in the expected
direction. Applying the z statistic (see Formula 3.2) to the posttest-pretest gain validity estimates
indicates that the validity estimate for Group 1 was close to being statistically significantly
different from the other groups. Pairwise comparisons between the validity estimate from Group
1 to the validity estimates from Groups 2, 3, and 4 resulted in respective p-values of .065 (1 vs.
2), .139 (1 vs. 3), and .159 (1 vs. 4). All other pairwise comparisons resulted in p-values that
were equal to or greater than .329.
Formula 3.1 determined the reliability of the gain scores used to compute the posttest-
thentest gain validity coefficients. The reliability coefficients for the four groups of SMP-SEXP
posttest-thentest gain scores were .606, .030, .642, and .772. The reliability coefficients for the
four groups of LBA-SEF posttest-thentest gain scores were .537, .628, .474, and .689. Applying
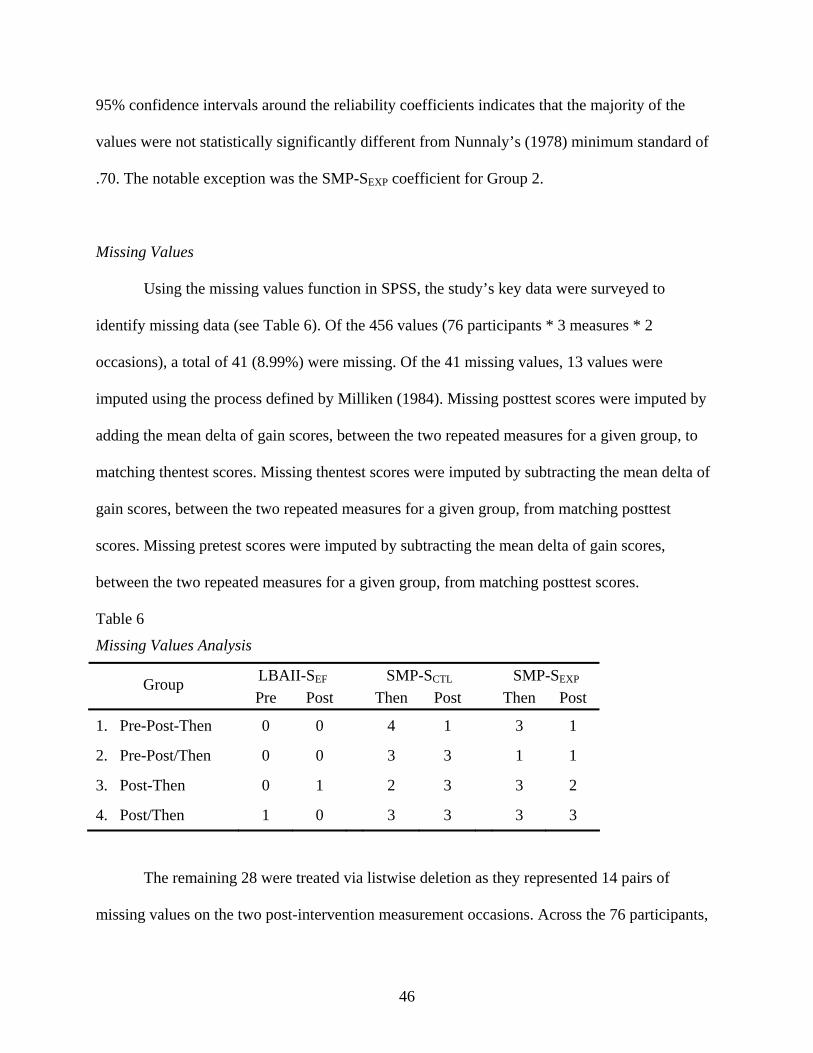
46
95% confidence intervals around the reliability coefficients indicates that the majority of the
values were not statistically significantly different from Nunnaly’s (1978) minimum standard of
.70. The notable exception was the SMP-SEXP coefficient for Group 2.
Missing Values
Using the missing values function in SPSS, the study’s key data were surveyed to
identify missing data (see Table 6). Of the 456 values (76 participants * 3 measures * 2
occasions), a total of 41 (8.99%) were missing. Of the 41 missing values, 13 values were
imputed using the process defined by Milliken (1984). Missing posttest scores were imputed by
adding the mean delta of gain scores, between the two repeated measures for a given group, to
matching thentest scores. Missing thentest scores were imputed by subtracting the mean delta of
gain scores, between the two repeated measures for a given group, from matching posttest
scores. Missing pretest scores were imputed by subtracting the mean delta of gain scores,
between the two repeated measures for a given group, from matching posttest scores.
Table 6
Missing Values Analysis
LBAII-SEF SMP-SCTL SMP-SEXP Group Pre Post Then Post Then Post
1. Pre-Post-Then 0 0 4 1 3 1
2. Pre-Post/Then 0 0 3 3 1 1
3. Post-Then 0 1 2 3 3 2
4. Post/Then 1 0 3 3 3 3
The remaining 28 were treated via listwise deletion as they represented 14 pairs of
missing values on the two post-intervention measurement occasions. Across the 76 participants,
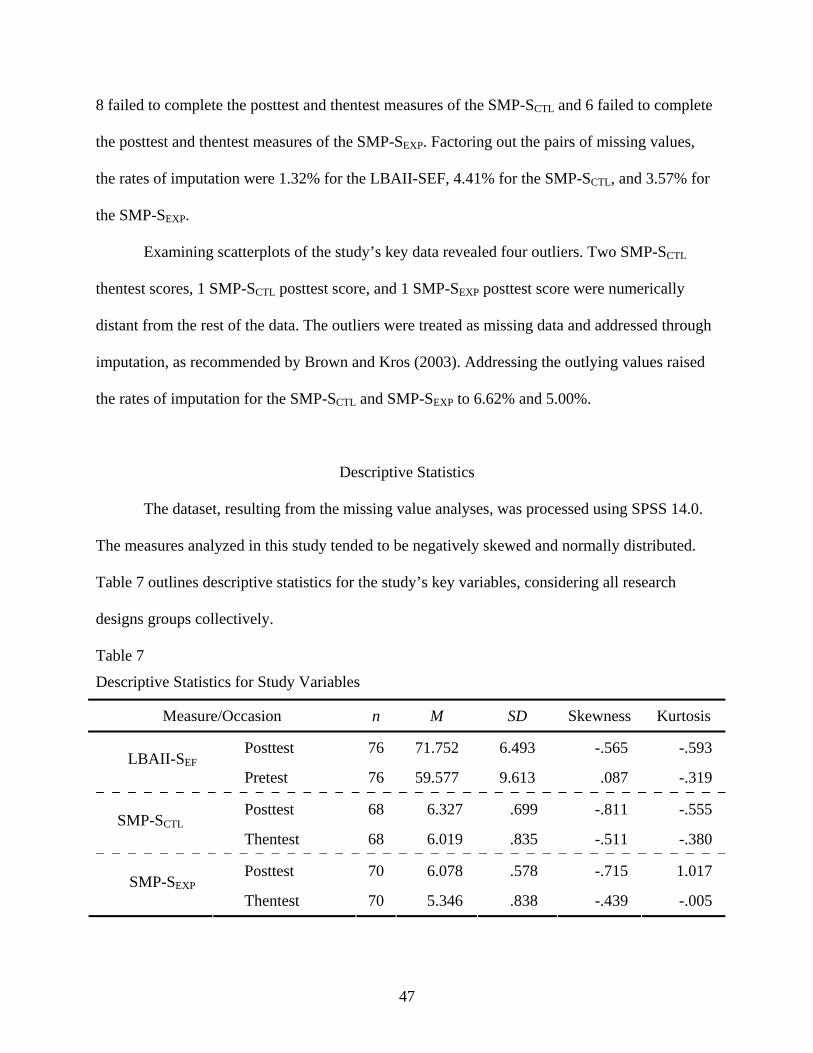
47
8 failed to complete the posttest and thentest measures of the SMP-SCTL and 6 failed to complete
the posttest and thentest measures of the SMP-SEXP. Factoring out the pairs of missing values,
the rates of imputation were 1.32% for the LBAII-SEF, 4.41% for the SMP-SCTL, and 3.57% for
the SMP-SEXP.
Examining scatterplots of the study’s key data revealed four outliers. Two SMP-SCTL
thentest scores, 1 SMP-SCTL posttest score, and 1 SMP-SEXP posttest score were numerically
distant from the rest of the data. The outliers were treated as missing data and addressed through
imputation, as recommended by Brown and Kros (2003). Addressing the outlying values raised
the rates of imputation for the SMP-SCTL and SMP-SEXP to 6.62% and 5.00%.
Descriptive Statistics
The dataset, resulting from the missing value analyses, was processed using SPSS 14.0.
The measures analyzed in this study tended to be negatively skewed and normally distributed.
Table 7 outlines descriptive statistics for the study’s key variables, considering all research
designs groups collectively.
Table 7
Descriptive Statistics for Study Variables
Measure/Occasion n M SD Skewness Kurtosis
Posttest 76 71.752 6.493 -.565 -.593 LBAII-SEF
Pretest 76 59.577 9.613 .087 -.319
Posttest 68 6.327 .699 -.811 -.555 SMP-SCTL
Thentest 68 6.019 .835 -.511 -.380
Posttest 70 6.078 .578 -.715 1.017 SMP-SEXP
Thentest 70 5.346 .838 -.439 -.005
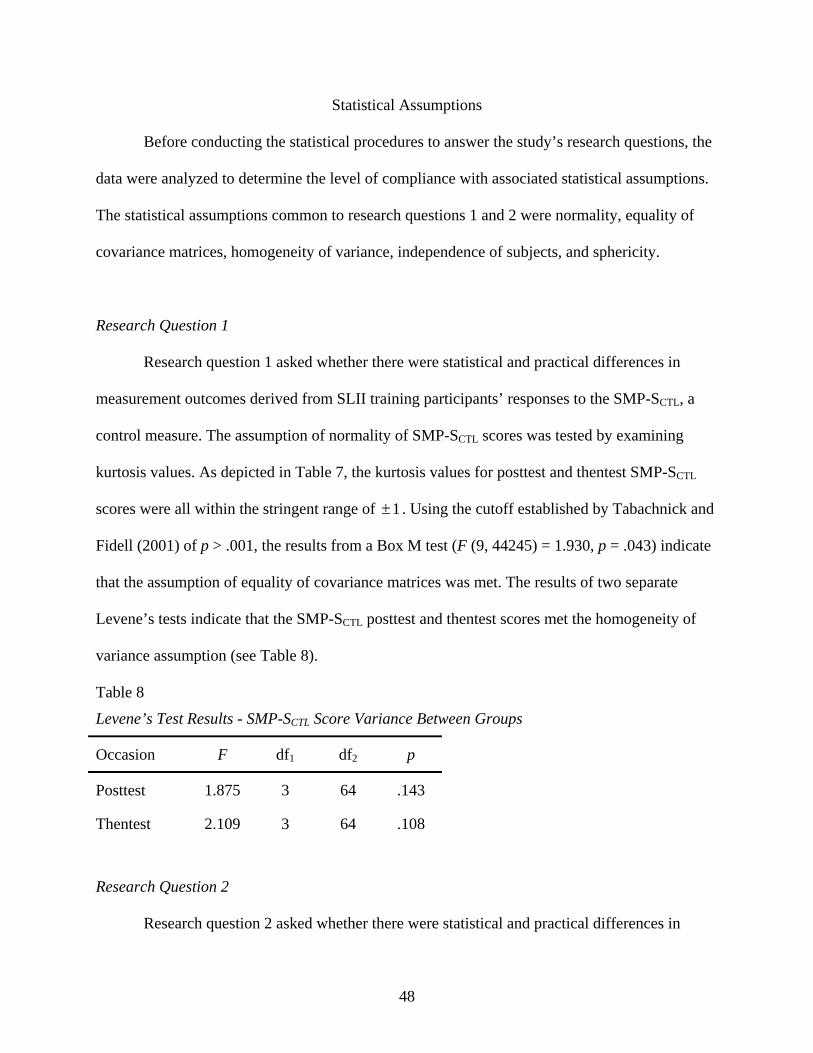
48
Statistical Assumptions
Before conducting the statistical procedures to answer the study’s research questions, the
data were analyzed to determine the level of compliance with associated statistical assumptions.
The statistical assumptions common to research questions 1 and 2 were normality, equality of
covariance matrices, homogeneity of variance, independence of subjects, and sphericity.
Research Question 1
Research question 1 asked whether there were statistical and practical differences in
measurement outcomes derived from SLII training participants’ responses to the SMP-SCTL, a
control measure. The assumption of normality of SMP-SCTL scores was tested by examining
kurtosis values. As depicted in Table 7, the kurtosis values for posttest and thentest SMP-SCTL
scores were all within the stringent range of 1± . Using the cutoff established by Tabachnick and
Fidell (2001) of p > .001, the results from a Box M test (F (9, 44245) = 1.930, p = .043) indicate
that the assumption of equality of covariance matrices was met. The results of two separate
Levene’s tests indicate that the SMP-SCTL posttest and thentest scores met the homogeneity of
variance assumption (see Table 8).
Table 8
Levene’s Test Results - SMP-SCTL Score Variance Between Groups
Occasion F df1 df2 p
Posttest 1.875 3 64 .143
Thentest 2.109 3 64 .108
Research Question 2
Research question 2 asked whether there were statistical and practical differences in
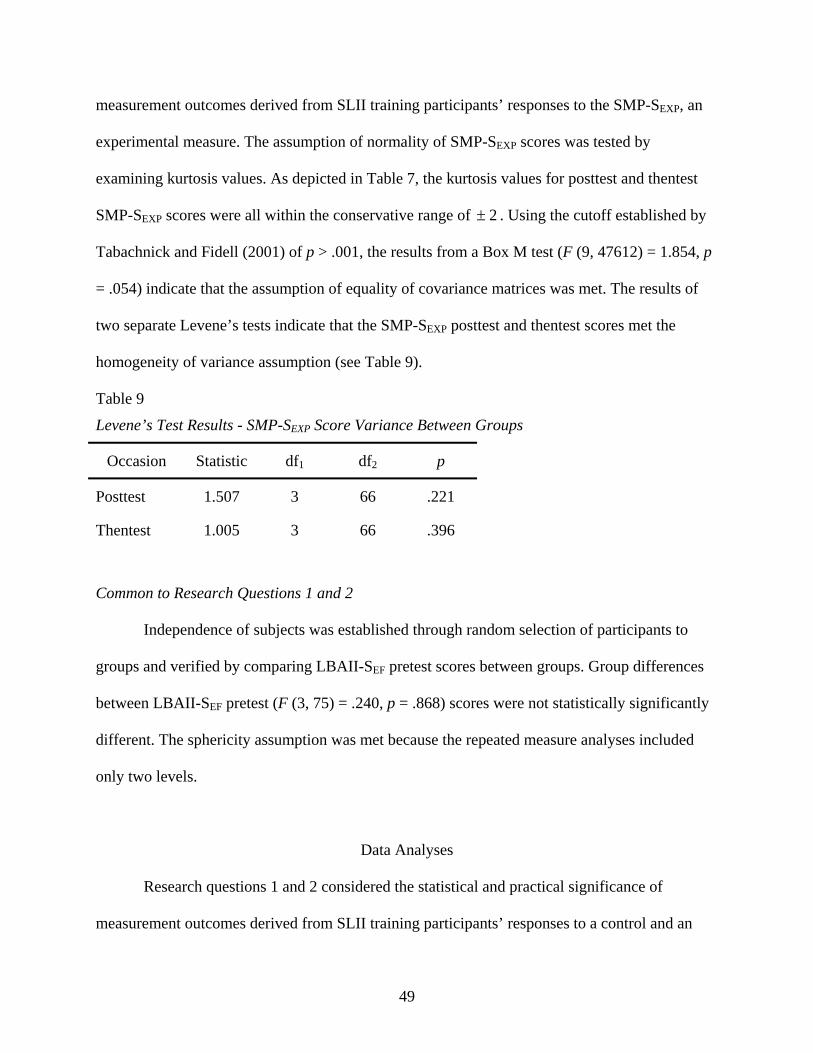
49
measurement outcomes derived from SLII training participants’ responses to the SMP-SEXP, an
experimental measure. The assumption of normality of SMP-SEXP scores was tested by
examining kurtosis values. As depicted in Table 7, the kurtosis values for posttest and thentest
SMP-SEXP scores were all within the conservative range of 2± . Using the cutoff established by
Tabachnick and Fidell (2001) of p > .001, the results from a Box M test (F (9, 47612) = 1.854, p
= .054) indicate that the assumption of equality of covariance matrices was met. The results of
two separate Levene’s tests indicate that the SMP-SEXP posttest and thentest scores met the
homogeneity of variance assumption (see Table 9).
Table 9
Levene’s Test Results - SMP-SEXP Score Variance Between Groups
Occasion Statistic df1 df2 p
Posttest 1.507 3 66 .221
Thentest 1.005 3 66 .396
Common to Research Questions 1 and 2
Independence of subjects was established through random selection of participants to
groups and verified by comparing LBAII-SEF pretest scores between groups. Group differences
between LBAII-SEF pretest (F (3, 75) = .240, p = .868) scores were not statistically significantly
different. The sphericity assumption was met because the repeated measure analyses included
only two levels.
Data Analyses
Research questions 1 and 2 considered the statistical and practical significance of
measurement outcomes derived from SLII training participants’ responses to a control and an

50
experimental measure. For each measure, parallel analyses were conducted to test the (a)
interaction effect between retrospective pretest design group (i.e., pre-post-then, pre-post/then,
post-then, and post/then) and measurement occasion (i.e., posttest, thentest); (b) simple effects of
retrospective pretest design group at each measurement occasion; and (c) simple effects of
measurement occasion at each retrospective pretest design group.
Research Question 1
Research question 1 asked whether there were statistical and practical differences in
measurement outcomes derived from SLII training participants’ responses to the SMP-SCTL, a
control measure. A split-plot ANOVA with simple effect tests on associated estimated means on
SMP-SCTL posttest and thentest scores tested the null hypotheses associated with research
question 1. The within-subjects factor was identified as occasion and had two levels: posttest and
thentest responses to the SMP-SCTL. The between-subjects factor was identified as group and
represented the four research designs under study: (a) pre-post-then, (b) pre-post/then, (c) post-
then, and (d) post/then. To test for practical significance, an effect size was computed for each
hypothesis.
The results from the split-plot ANOVA indicate that there were differences in
measurement outcomes, derived from SLII training participants’ responses to a subjective
control measure, between retrospective pretest design groups. Figure 1 graphically represents the
relationships between the estimated marginal means produced by the split-plot ANOVA.
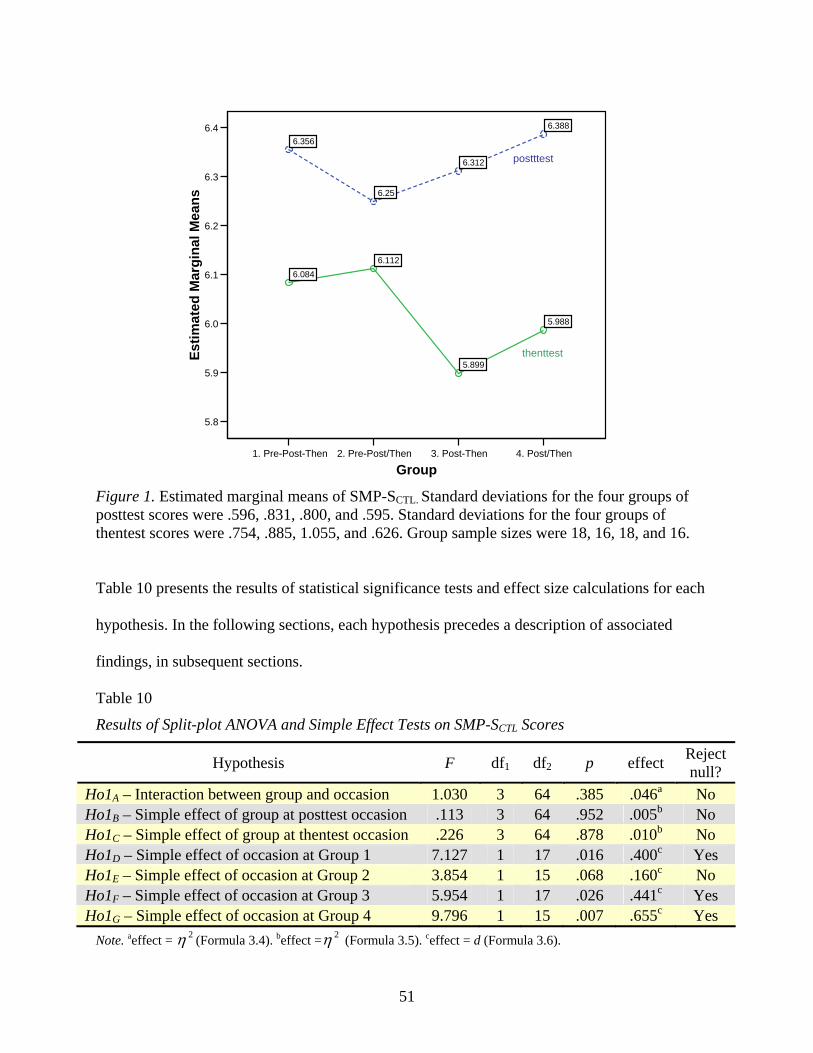
51
1. Pre-Post-Then 2. Pre-Post/Then 3. Post-Then 4. Post/Then
Group
5.8
5.9
6.0
6.1
6.2
6.3
6.4
Estim
ated
Mar
gina
l Mea
ns
6.356
6.25
6.312
6.388
6.0846.112
5.899
5.988
Figure 1. Estimated marginal means of SMP-SCTL. Standard deviations for the four groups of posttest scores were .596, .831, .800, and .595. Standard deviations for the four groups of thentest scores were .754, .885, 1.055, and .626. Group sample sizes were 18, 16, 18, and 16.
Table 10 presents the results of statistical significance tests and effect size calculations for each
hypothesis. In the following sections, each hypothesis precedes a description of associated
findings, in subsequent sections.
Table 10
Results of Split-plot ANOVA and Simple Effect Tests on SMP-SCTL Scores
Hypothesis F df1 df2 p effect Reject null?
Ho1A – Interaction between group and occasion 1.030 3 64 .385 .046a No Ho1B – Simple effect of group at posttest occasion .113 3 64 .952 .005b No Ho1C – Simple effect of group at thentest occasion .226 3 64 .878 .010b No Ho1D – Simple effect of occasion at Group 1 7.127 1 17 .016 .400c Yes Ho1E – Simple effect of occasion at Group 2 3.854 1 15 .068 .160c No Ho1F – Simple effect of occasion at Group 3 5.954 1 17 .026 .441c Yes Ho1G – Simple effect of occasion at Group 4 9.796 1 15 .007 .655c Yes
Note. aeffect = 2η (Formula 3.4). beffect = 2η (Formula 3.5). ceffect = d (Formula 3.6).
postttest
thenttest
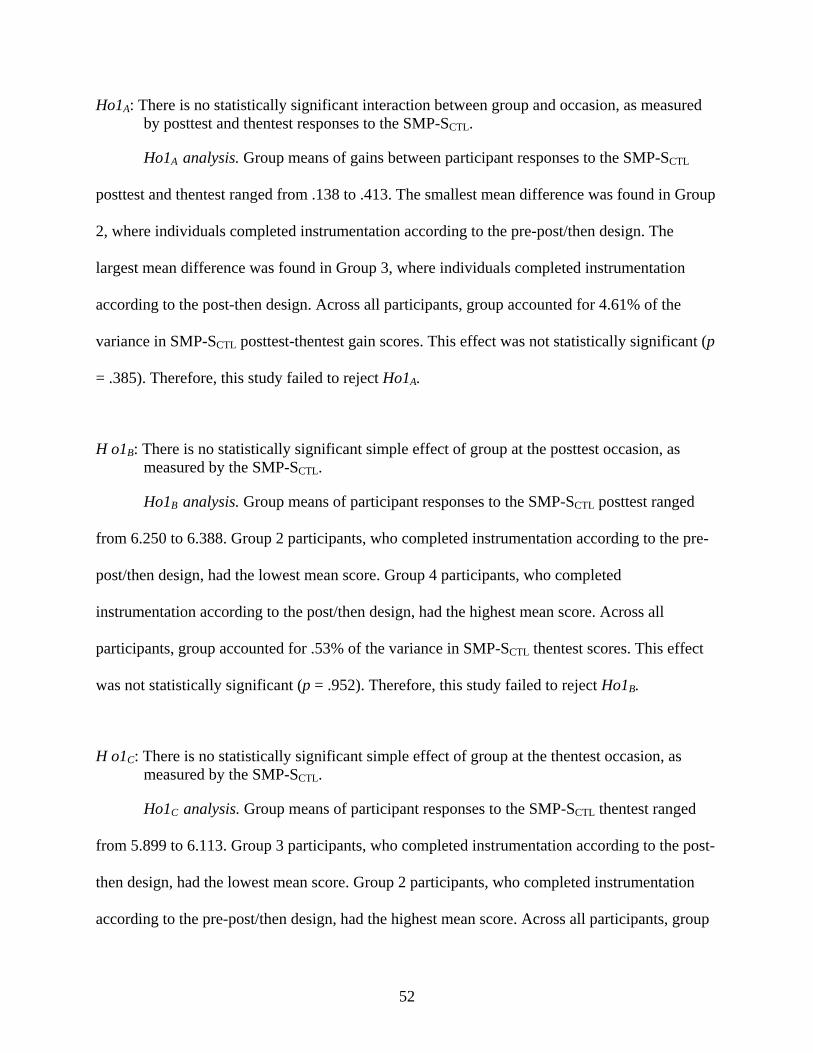
52
Ho1A: There is no statistically significant interaction between group and occasion, as measured by posttest and thentest responses to the SMP-SCTL.
Ho1A analysis. Group means of gains between participant responses to the SMP-SCTL
posttest and thentest ranged from .138 to .413. The smallest mean difference was found in Group
2, where individuals completed instrumentation according to the pre-post/then design. The
largest mean difference was found in Group 3, where individuals completed instrumentation
according to the post-then design. Across all participants, group accounted for 4.61% of the
variance in SMP-SCTL posttest-thentest gain scores. This effect was not statistically significant (p
= .385). Therefore, this study failed to reject Ho1A.
H o1B: There is no statistically significant simple effect of group at the posttest occasion, as measured by the SMP-SCTL.
Ho1B analysis. Group means of participant responses to the SMP-SCTL posttest ranged
from 6.250 to 6.388. Group 2 participants, who completed instrumentation according to the pre-
post/then design, had the lowest mean score. Group 4 participants, who completed
instrumentation according to the post/then design, had the highest mean score. Across all
participants, group accounted for .53% of the variance in SMP-SCTL thentest scores. This effect
was not statistically significant (p = .952). Therefore, this study failed to reject Ho1B.
H o1C: There is no statistically significant simple effect of group at the thentest occasion, as measured by the SMP-SCTL.
Ho1C analysis. Group means of participant responses to the SMP-SCTL thentest ranged
from 5.899 to 6.113. Group 3 participants, who completed instrumentation according to the post-
then design, had the lowest mean score. Group 2 participants, who completed instrumentation
according to the pre-post/then design, had the highest mean score. Across all participants, group
53
accounted for 1.05% of the variance in SMP-SCTL thentest scores. This effect was not statistically
significant (p = .878). Therefore, this study failed to reject Ho1C.
H o1D: There is no statistically significant simple effect of occasion at Group 1, as measured by posttest and thentest responses to the SMP-SCTL.
Ho1D analysis. For participants in Group 1, who completed instrumentation according to
the pre-post-then design, the intervention did have a measured effect on posttest responses to the
SMP-SCTL. The mean delta between posttest and thentest responses was .272. This difference,
when divided by the pooled standard deviation of the two repeated measures, yielded a Cohen’s
d of .400. This standardized mean difference was statistically significant (p = .016). Therefore,
this study rejected Ho1D.
H o1E: There is no statistically significant simple effect of occasion at Group 2, as measured by posttest and thentest responses to the SMP-SCTL.
Ho1E analysis. For participants in Group 2, who completed instrumentation according to
the pre-post/then design, the intervention did not have a measured effect on posttest responses to
the SMP-SCTL. The mean delta between posttest and thentest responses was .138. This difference,
when divided by the pooled standard deviation of the two repeated measures, yielded a Cohen’s
d of .160. This standardized mean difference was not statistically significant (p = .068).
Therefore, this study failed to reject the null hypothesis H o1E.
H o1F: There is no statistically significant simple effect of occasion at Group 3, as measured by posttest and thentest responses to the SMP-SCTL.
Ho1F analysis. For participants in Group 3, who completed instrumentation according to
the post-then design, the intervention did have a measured effect on posttest responses to the
54
SMP-SCTL. The mean delta between posttest and thentest responses was .413. This difference,
when divided by the pooled standard deviation of the two repeated measures, yielded a Cohen’s
d of .441. This standardized mean difference was statistically significant (p = .026). Therefore,
this study rejected Ho1F.
H o1G: There is no statistically significant simple effect of occasion at Group 4, as measured by posttest and thentest responses to the SMP-SCTL.
Ho1G analysis. For participants in Group 4, who completed instrumentation according to
the post/then design, the intervention had a measured effect on posttest responses to the SMP-
SCTL. The mean delta between posttest and thentest responses was .400. This difference, when
divided by the pooled standard deviation of the two repeated measures yielded, a Cohen’s d of
.655. This standardized mean difference was statistically significant (p = .007). Therefore, this
study rejected Ho1G.
Research Question 2
Research Question 2 asked whether there were statistical and practical differences in
measurement outcomes derived from SLII training participants’ responses to the SMP-SEXP, an
experimental measure. A split-plot ANOVA with simple effect tests on associated estimated
means on SMP-SEXP posttest and thentest scores tested the null hypotheses associated with
research question 2. The within-subjects factor was identified as occasion and had two levels:
posttest and thentest responses to the SMP-SEXP. The between-subjects factor was identified as
group and represented the four research designs under study: (a) pre-post-then, (b) pre-post/then,
(c) post-then, and (d) post/then. To test for practical significance, an effect size was computed for
each hypothesis.
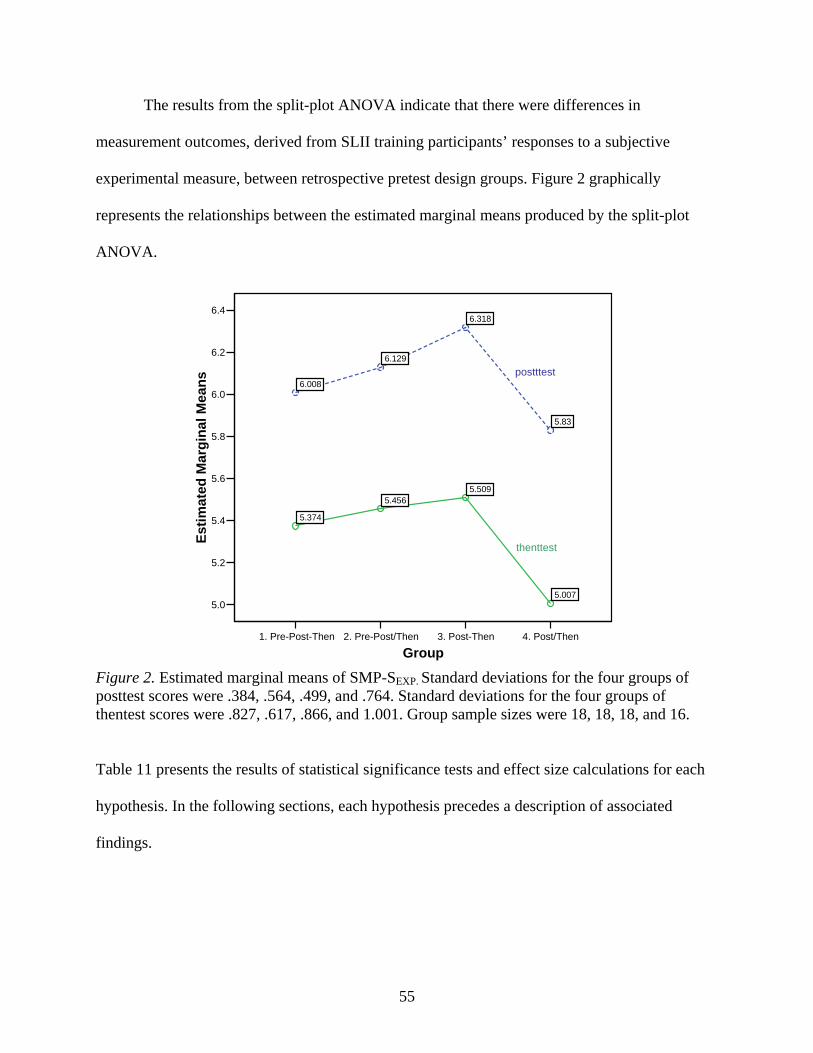
55
The results from the split-plot ANOVA indicate that there were differences in
measurement outcomes, derived from SLII training participants’ responses to a subjective
experimental measure, between retrospective pretest design groups. Figure 2 graphically
represents the relationships between the estimated marginal means produced by the split-plot
ANOVA.
1. Pre-Post-Then 2. Pre-Post/Then 3. Post-Then 4. Post/Then
Group
5.0
5.2
5.4
5.6
5.8
6.0
6.2
6.4
Estim
ated
Mar
gina
l Mea
ns 6.008
6.129
6.318
5.83
5.374
5.4565.509
5.007
Figure 2. Estimated marginal means of SMP-SEXP. Standard deviations for the four groups of posttest scores were .384, .564, .499, and .764. Standard deviations for the four groups of thentest scores were .827, .617, .866, and 1.001. Group sample sizes were 18, 18, 18, and 16. Table 11 presents the results of statistical significance tests and effect size calculations for each
hypothesis. In the following sections, each hypothesis precedes a description of associated
findings.
postttest
thenttest
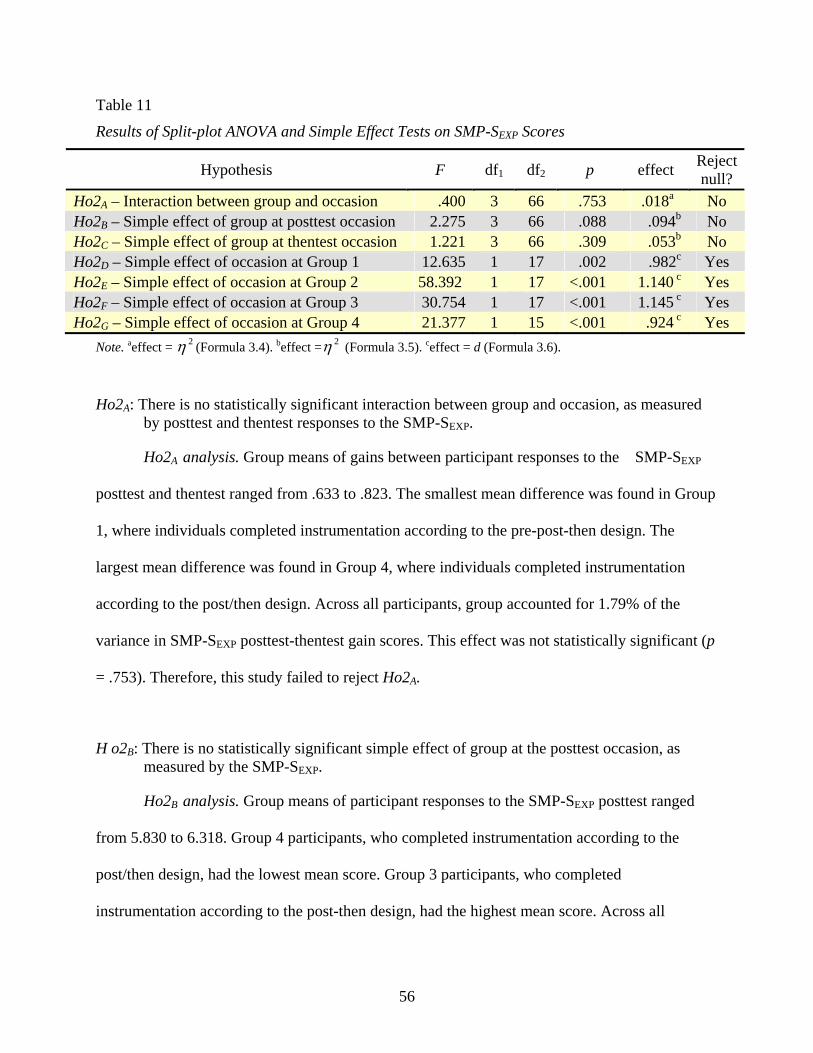
56
Table 11
Results of Split-plot ANOVA and Simple Effect Tests on SMP-SEXP Scores
Hypothesis F df1 df2 p effect Reject null?
Ho2A – Interaction between group and occasion .400 3 66 .753 .018a No Ho2B – Simple effect of group at posttest occasion 2.275 3 66 .088 .094b No Ho2C – Simple effect of group at thentest occasion 1.221 3 66 .309 .053b No Ho2D – Simple effect of occasion at Group 1 12.635 1 17 .002 .982c Yes Ho2E – Simple effect of occasion at Group 2 58.392 1 17 <.001 1.140 c Yes Ho2F – Simple effect of occasion at Group 3 30.754 1 17 <.001 1.145 c Yes Ho2G – Simple effect of occasion at Group 4 21.377 1 15 <.001 .924 c Yes
Note. aeffect = 2η (Formula 3.4). beffect = 2η (Formula 3.5). ceffect = d (Formula 3.6).
Ho2A: There is no statistically significant interaction between group and occasion, as measured by posttest and thentest responses to the SMP-SEXP.
Ho2A analysis. Group means of gains between participant responses to the SMP-SEXP
posttest and thentest ranged from .633 to .823. The smallest mean difference was found in Group
1, where individuals completed instrumentation according to the pre-post-then design. The
largest mean difference was found in Group 4, where individuals completed instrumentation
according to the post/then design. Across all participants, group accounted for 1.79% of the
variance in SMP-SEXP posttest-thentest gain scores. This effect was not statistically significant (p
= .753). Therefore, this study failed to reject Ho2A.
H o2B: There is no statistically significant simple effect of group at the posttest occasion, as measured by the SMP-SEXP.
Ho2B analysis. Group means of participant responses to the SMP-SEXP posttest ranged
from 5.830 to 6.318. Group 4 participants, who completed instrumentation according to the
post/then design, had the lowest mean score. Group 3 participants, who completed
instrumentation according to the post-then design, had the highest mean score. Across all
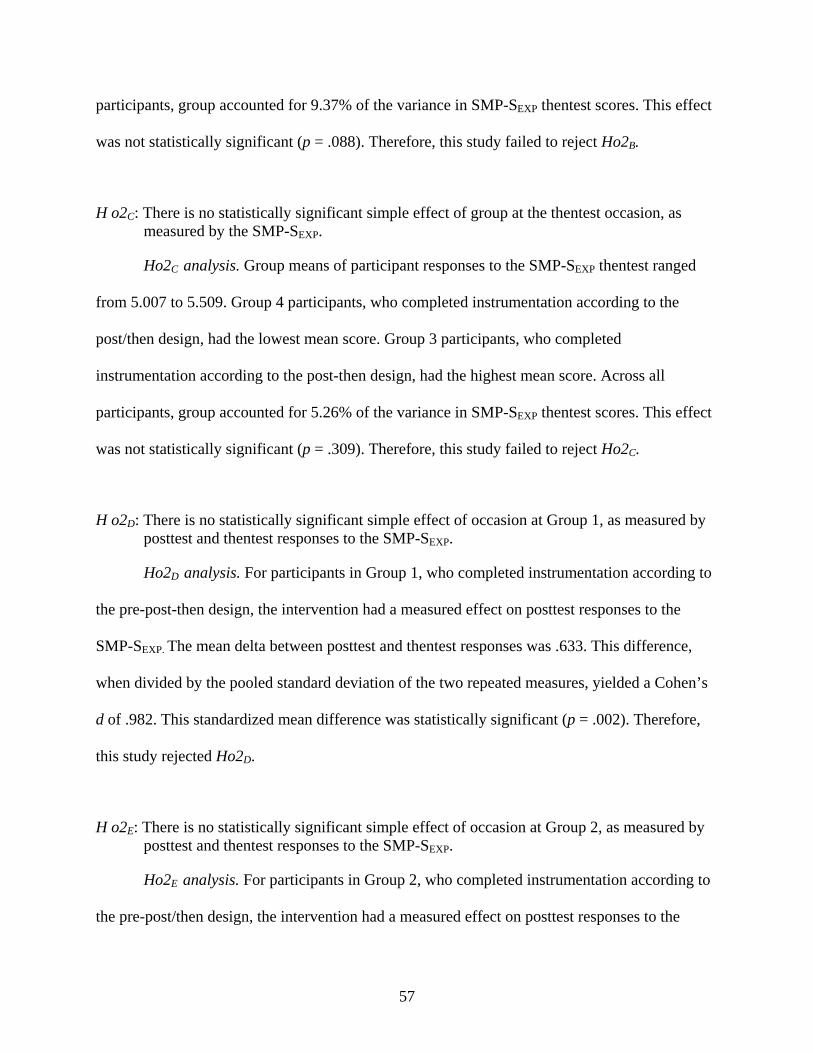
57
participants, group accounted for 9.37% of the variance in SMP-SEXP thentest scores. This effect
was not statistically significant (p = .088). Therefore, this study failed to reject Ho2B.
H o2C: There is no statistically significant simple effect of group at the thentest occasion, as measured by the SMP-SEXP.
Ho2C analysis. Group means of participant responses to the SMP-SEXP thentest ranged
from 5.007 to 5.509. Group 4 participants, who completed instrumentation according to the
post/then design, had the lowest mean score. Group 3 participants, who completed
instrumentation according to the post-then design, had the highest mean score. Across all
participants, group accounted for 5.26% of the variance in SMP-SEXP thentest scores. This effect
was not statistically significant (p = .309). Therefore, this study failed to reject Ho2C.
H o2D: There is no statistically significant simple effect of occasion at Group 1, as measured by posttest and thentest responses to the SMP-SEXP.
Ho2D analysis. For participants in Group 1, who completed instrumentation according to
the pre-post-then design, the intervention had a measured effect on posttest responses to the
SMP-SEXP. The mean delta between posttest and thentest responses was .633. This difference,
when divided by the pooled standard deviation of the two repeated measures, yielded a Cohen’s
d of .982. This standardized mean difference was statistically significant (p = .002). Therefore,
this study rejected Ho2D.
H o2E: There is no statistically significant simple effect of occasion at Group 2, as measured by posttest and thentest responses to the SMP-SEXP.
Ho2E analysis. For participants in Group 2, who completed instrumentation according to
the pre-post/then design, the intervention had a measured effect on posttest responses to the
58
SMP-SEXP. The mean delta between posttest and thentest responses was .674. This difference,
when divided by the pooled standard deviation of the two repeated measures, yielded a Cohen’s
d of 1.140. This standardized mean difference was statistically significant (p < .001). Therefore,
this study rejected Ho2E.
H o2F: There is no statistically significant simple effect of occasion at Group 3, as measured by posttest and thentest responses to the SMP-SEXP.
Ho2F analysis. For participants in Group 3, who completed instrumentation according to
the post-then design, the intervention had a measured effect on posttest responses to the SMP-
SEXP. The mean delta between posttest and thentest responses was .809. This difference, when
divided by the pooled standard deviation of the two repeated measures, yielded a Cohen’s d of
1.145. This standardized mean difference was statistically significant (p < .001). Therefore, this
study rejected Ho2F.
H o2G: There is no statistically significant simple effect of occasion at Group 4, as measured by posttest and thentest responses to the SMP-SEXP.
Ho2G analysis. For participants in Group 4, who completed instrumentation according to
the post/then design, the intervention had a measured effect on posttest responses to the SMP-
SEXP. The mean delta between posttest and thentest responses was .823. This difference, when
divided by the pooled standard deviation of the two repeated measures, yielded a Cohen’s d of
.924. This standardized mean difference was statistically significant (p < .001). Therefore, this
study rejected Ho2F.
Summary
This chapter reported the study’s findings. The Data Assessment section outlined results
59
from reliability, validity, and missing values analyses. The Descriptive Statistics section outlined
the mean, standard deviation, normality, and kurtosis values for key variables. The Statistical
Assumptions section described how the data met the necessary statistical assumptions associated
with the study’s null hypotheses. The Data Analyses section reviewed the results of null
hypotheses testing. The study rejected three of the null hypotheses associated with research
question 1 and also rejected four of the null hypotheses associated with research question 2.
Chapter 5 synthesizes the study’s findings and presents conclusions, recommendations, and
implications.

60
CHAPTER 5
DISCUSSION
Overview
This chapter includes four sections: (a) Synthesis of Findings, (b) Conclusions, and (c)
Recommendations and (d) Implications. In the Synthesis of Findings, the researcher collates the
results of the hypotheses findings to answer the study’s two research questions. The Conclusion
section draws inferences from the results and relates the findings to existing literature. The
Recommendations section provides areas for further research. The Implications section relates
the study’s findings to the field of performance improvement.
Synthesis of Findings
This study considered two related research questions to determine whether the interaction
effect of pretest sensitization and post-intervention survey order impacted how participants
responded to two self-report measures. Research question 1 asked: Are there differences in
measurement outcomes, derived from Situational Leadership® II training participants’ responses
to a subjective control measure, among four retrospective pretest design groups? Research
question 2 asked: Are there differences in measurement outcomes, derived from Situational
Leadership® II training participants’ responses to a subjective experimental measure, among four
retrospective pretest design groups?
For each measure, parallel analyses were conducted to test the (a) interaction effect
between retrospective pretest design group (i.e., pre-post-then, pre-post/then, post-then, and
post/then) and measurement occasion (i.e., posttest, thentest); (b) simple effects of retrospective
61
pretest design group at each measurement occasion; and (c) simple effects of measurement
occasion at each retrospective pretest design group.
Across both research questions, the first two set of effects were found to be statistically
insignificant: (a) interaction effect between retrospective pretest design group (i.e., pre-post-then,
pre-post/then, post-then, and post/then) and measurement occasion (i.e., posttest, thentest) and
(b) simple effects of retrospective pretest design group at each measurement occasion. However,
when considering effect sizes, some practical significance was detected. In the control measure,
the interaction effect between group and occasion produced a small effect, accounting for 4.61%
of the variance in SMP-SCTL posttest-thentest gain scores. In the experimental measure, the
simple effect of group at the posttest measurement occasion produced a medium effect,
accounting for 9.37% of the variance in SMP-SEXP posttest scores. Also in the experimental
measure, the simple effect of group at the thentest measurement occasion produced a small
effect, accounting for 5.26% of the variance in SMP-SEXP thentest scores.
These results provide preliminary evidence to answer the study’s two research questions,
indicating that there were differences in measurement outcomes among the four retrospective
pretest designs implemented. In both the control and experimental measure, differences were
found between groups of participant responses. The magnitude of these differences is further
synthesized and discussed by examining the simple effects of measurement occasion at each
retrospective pretest design group.
Control Measure
In the control measure, a significant treatment effect was detected in Groups 1 (pre-post-
then), 3 (post-then), and 4 (post/then). In Group 2 (pre-post/then), the intervention did not appear
62
to have an effect on the difference between posttest and thentest scores. In Groups 1 and 3, the
effect sizes were nearly identical (d = .400 and .441). In Group 2, the effect between posttest and
thentest scores (d = .160) was approximately 1/3 the size found in Groups 1 and 3. In Group 4,
the effect (d = .655) was 1.5 times as large as the effects found in Groups 1 and 3, and over 4
times as large as the effect found in Group 2.
It appears that taking a pretest had no effect when participants where given the post-
intervention self-report measures (posttest, thentest) in separate forms. However, in the case
when participants were given the post-intervention self-report measures in a combined form, the
difference between taking a pretest or not substantially affected how participants responded.
Participants who did not take a pretest reported 4 times the gain between posttest and thentest
score than participants who did not take the pretest.
The differences in measurement outcomes between Groups 2 and 4 suggest that the
combination of taking a pretest and a single post-intervention self-report survey (combining
posttest and thentest responses) may have signaled an implicit theory of stability to participants.
Conversely, taking a single post-intervention self-report survey without the benefit of a prior
pretest may have signaled an implicit theory of change to participants.
However, it is important to note that the intervention was not designed or expected to
induce a treatment effect on the control measure (D. Zigarmi, personal communication,
December 8, 2006). This suggests that, for the control measure, the post/then design produced
the least valid results and the pre-post/then design produced the most valid results. Considering
the validity analyses presented in chapter 4 weakens the validity of the pre-post/then design just
slightly, because a small effect ( 2η = .021) was found between LBAII-SEF effectiveness group
and SMP-SCTL scores.
63
Experimental Measure
In the experimental measure, a significant treatment effect was detected in all four
groups. Additionally, the effect sizes were large and nearly identical (d = .982, 1.140, 1.145, and
.924) in all four groups. The largest difference between effect size was found between Groups 3
(post-then) and 4 (post/then). However, the effect size for Group 4 was only 20% less than the
effect size for Group 3. This indicates that even though retrospective pretest group accounted for
9.37% of the variance in SMP-SEXP posttest scores and 5.26% of the variance in SMP-SEXP
thentest scores, the impact of these differences was negligible when considered collectively.
The validity data present a slightly different picture. While the validity coefficients for
Groups 1, 2, and 3 were consistent with prior literature (Zigarmi et al., 1997), the validity
coefficient for Group 4 was statistically significantly different (p = .021). Additionally, when
correlating SMP-SEXP posttest-thentest gain scores to LBAII-SEF posttest-pretest gain scores,
only Group 1 produced a validity coefficient that was in the expected direction (r’= .348). These
findings suggest that for the experimental measure, the post/then design produced the least valid
results and the pre-post-then design produced the most valid results.
Conclusions
Considering all the analyses performed in this study, findings indicate that there were
differences in measurement outcomes among the four retrospective pretest designs implemented.
In both the control and experimental measure, differences were found between groups of
participant responses. In the case of the control measure, the differences were evident in the
magnitude of the treatment effect between groups. These differences suggest that the post/then
design produced the least valid results and the pre-post/then design produced the most valid
64
results. In the case of the experimental measure, the differences were evident in the direction and
magnitude of the validity coefficients. These differences suggest that for the experimental
measure, the post/then design produced the least valid results and the pre-post-then design
produced the most valid results. Considering the results of both research questions, the post/then
design appeared to produce the least valid results. The findings from this study support the
recommendation of Umble et al. (2000) to examine the concurrent validity of measures derived
from retrospective pretest designs.
These findings also add to the literature surrounding the validity of retrospective pretest
designs as they consider the interaction effect of pretest sensitization and post-intervention
survey order on two self-report measures. Data from this study suggest that differences between
retrospective pretest design groups may be sensitive to the type of measure administered. This
indicates that following Sprangers and Hoogstraten’s (1989) advice to include a control
condition is not as easy as it may seem. Depending on the design used, participant responses
could indicate a treatment effect where none is expected.
When considering how the findings relate to similar studies conducted on retrospective
pretest designs, it is difficult to make direct comparisons due to differences in the levels of
reporting and the aims of the studies considered. However, by taking into account the higher
order findings from this study, some comparisons can be made relating to pretest sensitization,
survey administration, and control measures.
Pretest Sensitization
Although this study did not specifically analyze the main effect of pretest, findings
indicate that, in the case of the control measure, the administration of a pretest had a practical

65
effect on the magnitude of the treatment effect when the post-intervention measures were
administered via a single survey. However, in the case of the experimental measure, this study
found no evidence of a pretest effect. The former finding supports the conclusions of Sprangers
and Hoogstraten (1989), who observed a pretest effect. The latter finding supports the
conclusions of Terborg and Davis (1982), who did not observe a pretest effect.
Survey Administration
Although this study did not specifically analyze the main effect of post-intervention
survey order, findings indicate that post-survey administration order had no observed effect on
either the control or experimental measure. These findings support the conclusions of Sprangers
and Hoogstraten (1989) and Terborg and Davis (1982).
Control Measure
This study found a statistically significant difference in the control measures in three of
the four research designs tested. For participants in the pre-post-then, post/then, and post-then
groups, a statistically significant difference was found between the two repeated measures of the
control variable. For participants in the pre-post/then group, no statistically significant difference
was found between the two repeated measures of the control variable. The former is consistent
with the Sprangers and Hoogstraten (1991) study and one of the eight studies referenced in the
Sprangers and Hoogstraten (1989) meta-analysis. The latter is consistent with the findings from
seven of the eight studies referenced in the Sprangers and Hoogstraten (1989) meta-analysis.
66
Recommendations for Future Research
Recommendations for future research were derived by considering the limitations of this
study’s results. The findings from this study are limited when considering (a) sample size, (b)
measurement invariance, (c) number of measures, and (d) intended population. Resultant
recommendations are presented in order of importance.
Sample Size
Although the sample was representative of the intended population, the size of the sample
limits the generalization of the study’s results. Considering the number of participants who failed
to complete the posttest and thentest measures resulted in an effective sample size of 68 for the
control measure and 70 for the experimental measure. Consequently, some group sizes were as
low as 16. Although this group size was sufficient to detect statistically significant differences in
repeated measures at the group level, it was not sufficient to detect statistically significant
differences in posttest scores, thentest scores, or their derivatives across groups. Therefore, this
study should be replicated to determine whether the results hold in a larger sample. Detecting a
statistically significant medium effect would require approximately another 19 participants per
group (see Cohen, 1988, Table 8.4.1).
Measurement Invariance
Because of the limited sample size, this study did not test for measurement invariance. To
determine whether the factor structures of the experimental and control measure are invariant
across retrospective pretest design groups, either confirmatory or exploratory factor analyses
should be conducted. Using general factor analysis guidelines (Stevens, 2002) would require a
67
5:1 ratio of participants to survey item to conduct an exploratory factor analysis and a 10:1 ratio
for confirmatory factor analysis.
Number of Measures
This study focused on two measures of the SMP-S: (a) Work Involvement Scale and (b)
Clarification of Goals and Objectives Scale. Considering that the two measures produced
different results, it is recommended that future research investigate additional measures of the
SMP-S. For the experimental measure, Zigarmi (D. Zigarmi, personal communication,
December 8, 2006) suggested that future research should consider the following SMP scales: (a)
Upward Communication, (b) Orderly Work Planning, and (c) Building Trust. For the control
measure Zigarmi suggested the following SMP scales: (a) Organization Climate and (b)
Commitment.
Intended Population
This focused on the self-perceptions of individuals attending a Situational Leadership II
workshop. Because the opportunity for evaluation extends across many domains, it is
recommended that this study be replicated for other populations. This would require selecting a
set of self-report measures that could be validated via an external referent. It would also be
prudent for future researchers, replicating this study, to select a complement of measures with
established psychometric properties.
Implications
If this study’s findings generalize to other populations and measures, outcome
68
measurements derived from retrospective pretest designs may be viewed with even greater
caution than they are today. It seems likely that nomological nets weakened by nonconforming
validity coefficients will be used to substantiate inherent concerns regarding the use of the
retrospective pretest (i.e., subject acquiescence and memory distortion). An unfortunate side
effect may be that all designs involving the retrospective pretest may fall victim to these
concerns, not just the studies in which there are problems in establishing concurrent validity
evidence.
Regardless of the validity problems encountered in this study, it is the researcher’s
opinion that the retrospective pretest is a viable tool. Especially because the demand for
accountability in the field of performance improvement is high, the retrospective pretest provides
a practical means to garner pretest data that might otherwise be confounded by pretest
sensitization, experience limitation, or participant access. The problem is that not all literature
promoting retrospective pretest designs informs readers of the need to validate resulting outcome
measures and the importance of employing multiple methods to access change.
Just as reliability is a property of obtained scores, validity can change from sample to
sample. Therefore, researchers incorporating the retrospective pretest must consider how the
validity of self-report measures will be established. In fact, this requirement is not limited to self-
report measures or retrospective pretest designs. Validity is a property inured to scores and
cannot be generalized to an instrument.
When accessing change, it is a well-established principle to employ multiple methods.
When considering the need to provide concurrent validity of outcome measures with the
importance of incorporating multiple methods to access change, one sees that the issues are
reciprocal. By incorporating concurrent methods to assess change, a researcher can establish a

69
nomological net of the study’s measures. Therefore, a sound design incorporating the
retrospective pretest should incorporate multiple measures, within an established nomological
net, in order to adequately assess changes in performance. Although such a design goal should be
considered for any performance improvement study, it is a must for studies incorporating the
retrospective pretest less they fall victim to inherent concerns related to retrospective accounts.
Summary
This study detected differences in measurement outcomes from SLII participant
responses to an experimental and a control measure. In the case of the experimental measure,
differences were found in the magnitude and direction of the validity coefficients. In the case of
the control measure, differences were found in the magnitude of the treatment effect between
groups.
These differences indicate that, for this study, the pre-post-then design produced the most
valid results for the experimental measure. For the control measure in this study, the pre-
post/then design produced the most valid results. Across both measures, the post/then design
produced the least valid results.
Researchers and practitioners embracing retrospective pretest designs are encouraged to
follow the recommendation of Umble et al. (2000) to examine the concurrent validity of
measures derived from retrospective pretest designs. Researchers and practitioners considering
Sprangers and Hoogstraten’s (1989) advice to include a control measure are cautioned that
derivative results may be sensitive to the choice of research design.
70
APPENDIX A
REPRESENTATIVE STUDIES INCORPORATING
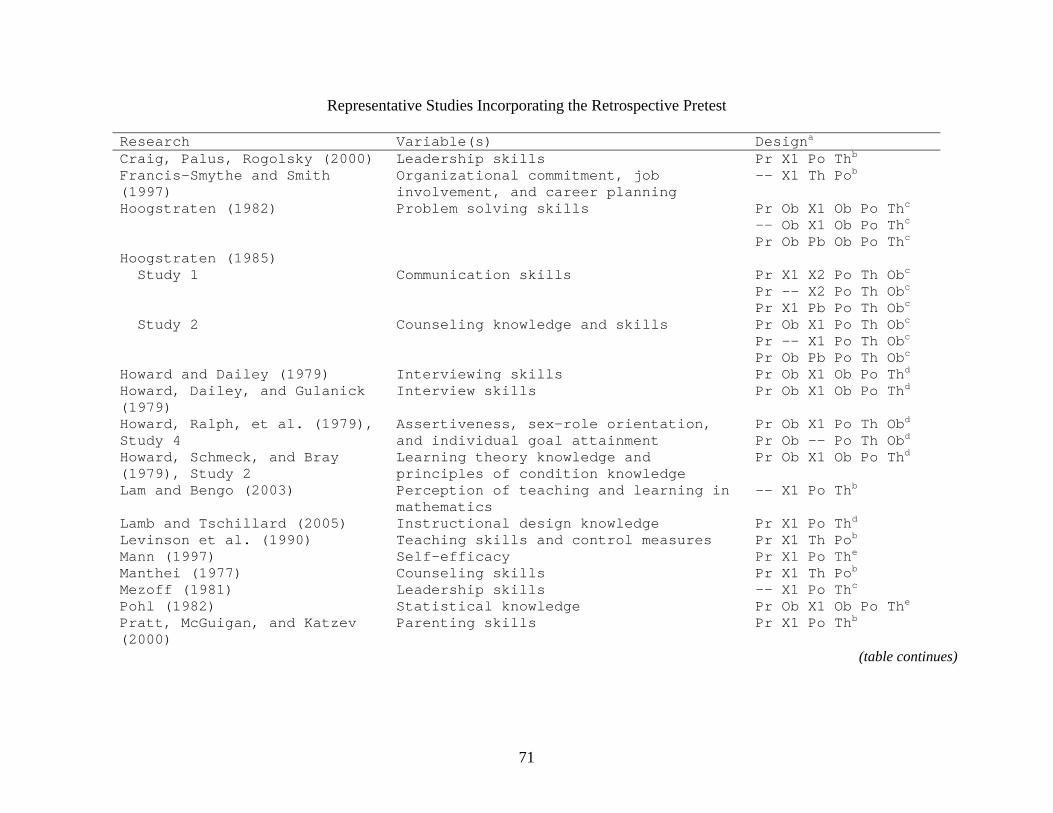
71
Representative Studies Incorporating the Retrospective Pretest
Research Variable(s) Designa Craig, Palus, Rogolsky (2000) Leadership skills Pr X1 Po Thb Francis-Smythe and Smith (1997)
Organizational commitment, job involvement, and career planning
-- X1 Th Pob
Hoogstraten (1982) Problem solving skills Pr Ob X1 Ob Po Thc -- Ob X1 Ob Po Thc Pr Ob Pb Ob Po Thc
Hoogstraten (1985) Study 1 Study 2
Communication skills Counseling knowledge and skills
Pr X1 X2 Po Th Obc Pr -- X2 Po Th Obc Pr X1 Pb Po Th Obc Pr Ob X1 Po Th Obc Pr -- X1 Po Th Obc Pr Ob Pb Po Th Obc
Howard and Dailey (1979) Interviewing skills Pr Ob X1 Ob Po Thd Howard, Dailey, and Gulanick (1979)
Interview skills Pr Ob X1 Ob Po Thd
Howard, Ralph, et al. (1979), Study 4
Assertiveness, sex-role orientation, and individual goal attainment
Pr Ob X1 Po Th Obd Pr Ob -- Po Th Obd
Howard, Schmeck, and Bray (1979), Study 2
Learning theory knowledge and principles of condition knowledge
Pr Ob X1 Ob Po Thd
Lam and Bengo (2003) Perception of teaching and learning in mathematics
-- X1 Po Thb
Lamb and Tschillard (2005) Instructional design knowledge Pr X1 Po Thd Levinson et al. (1990) Teaching skills and control measures Pr X1 Th Pob Mann (1997) Self-efficacy Pr X1 Po The Manthei (1977) Counseling skills Pr X1 Th Pob Mezoff (1981) Leadership skills -- X1 Po Thc Pohl (1982) Statistical knowledge Pr Ob X1 Ob Po The Pratt, McGuigan, and Katzev (2000)
Parenting skills Pr X1 Po Thb
(table continues)
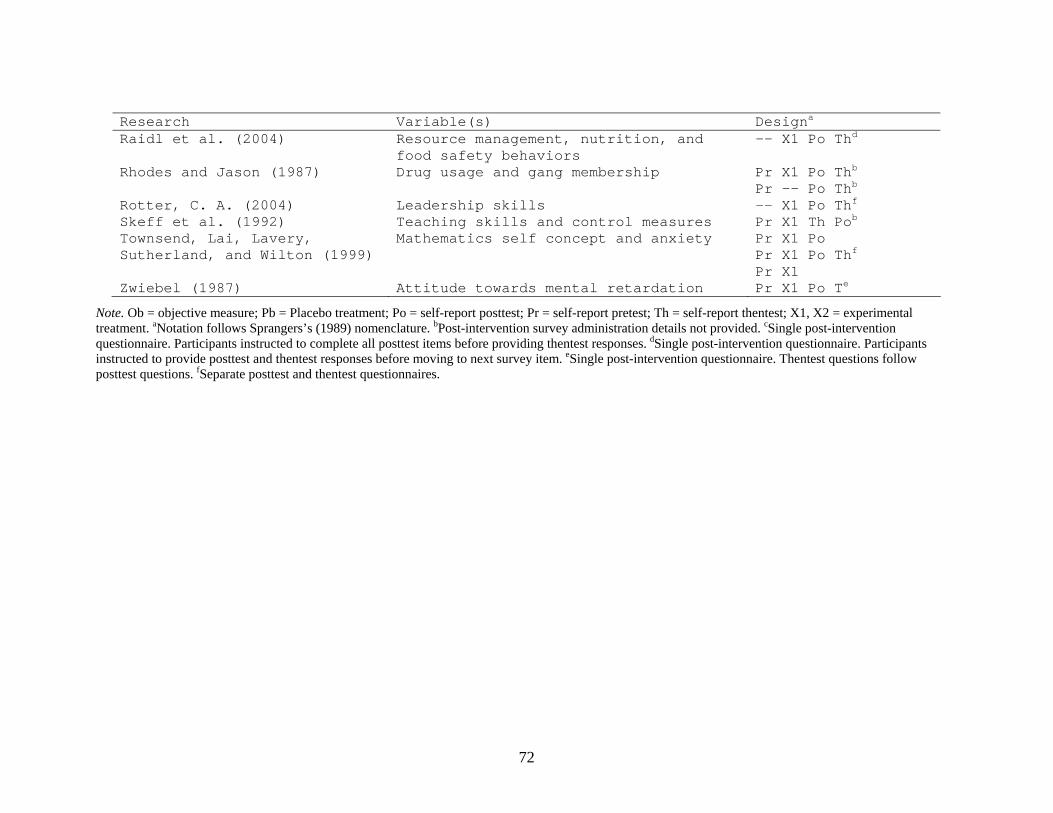
72
Research Variable(s) Designa Raidl et al. (2004) Resource management, nutrition, and
food safety behaviors -- X1 Po Thd
Rhodes and Jason (1987) Drug usage and gang membership Pr X1 Po Thb Pr -- Po Thb
Rotter, C. A. (2004) Leadership skills -- X1 Po Thf Skeff et al. (1992) Teaching skills and control measures Pr X1 Th Pob Townsend, Lai, Lavery, Sutherland, and Wilton (1999)
Mathematics self concept and anxiety Pr X1 Po Pr X1 Po Thf Pr X1
Zwiebel (1987) Attitude towards mental retardation Pr X1 Po Te
Note. Ob = objective measure; Pb = Placebo treatment; Po = self-report posttest; Pr = self-report pretest; Th = self-report thentest; X1, X2 = experimental treatment. aNotation follows Sprangers’s (1989) nomenclature. bPost-intervention survey administration details not provided. cSingle post-intervention questionnaire. Participants instructed to complete all posttest items before providing thentest responses. dSingle post-intervention questionnaire. Participants instructed to provide posttest and thentest responses before moving to next survey item. eSingle post-intervention questionnaire. Thentest questions follow posttest questions. fSeparate posttest and thentest questionnaires.
73
APPENDIX B
DIRECTIONS FOR INSTRUMENTATION INVOLVING THENTEST ITEMS
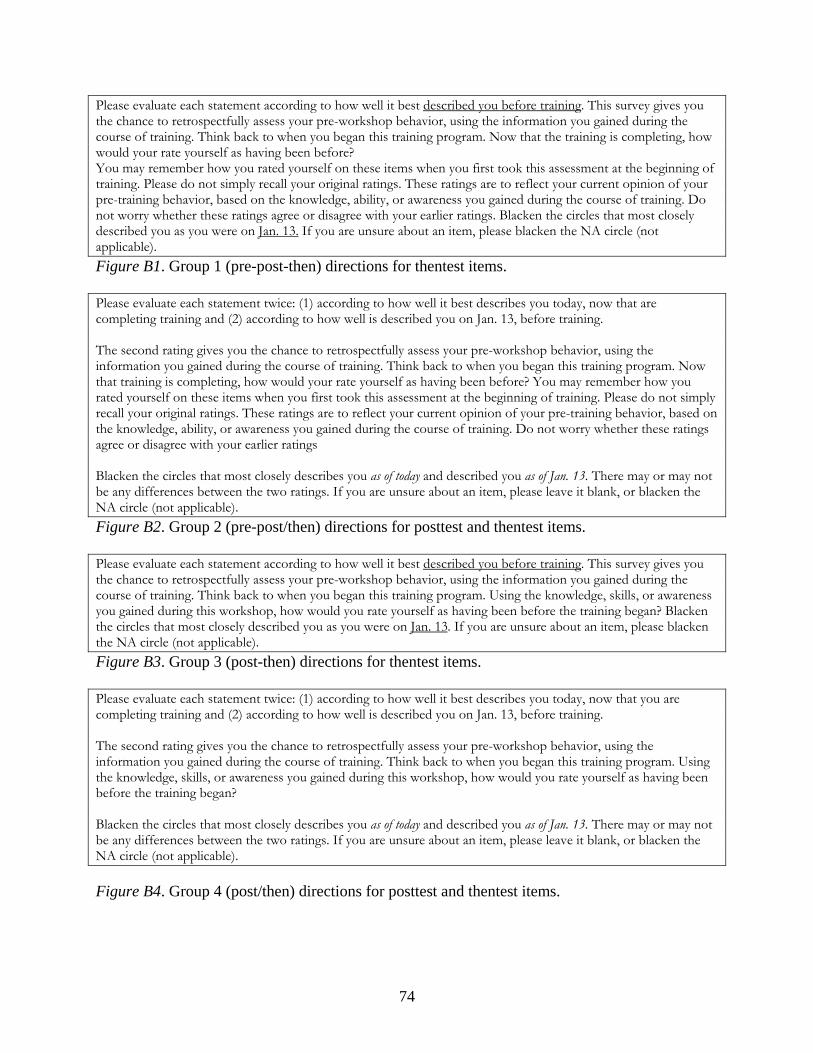
74
Please evaluate each statement according to how well it best described you before training. This survey gives you the chance to retrospectfully assess your pre-workshop behavior, using the information you gained during the course of training. Think back to when you began this training program. Now that the training is completing, how would your rate yourself as having been before? You may remember how you rated yourself on these items when you first took this assessment at the beginning of training. Please do not simply recall your original ratings. These ratings are to reflect your current opinion of your pre-training behavior, based on the knowledge, ability, or awareness you gained during the course of training. Do not worry whether these ratings agree or disagree with your earlier ratings. Blacken the circles that most closely described you as you were on Jan. 13. If you are unsure about an item, please blacken the NA circle (not applicable). Figure B1. Group 1 (pre-post-then) directions for thentest items.
Please evaluate each statement twice: (1) according to how well it best describes you today, now that are completing training and (2) according to how well is described you on Jan. 13, before training. The second rating gives you the chance to retrospectfully assess your pre-workshop behavior, using the information you gained during the course of training. Think back to when you began this training program. Now that training is completing, how would your rate yourself as having been before? You may remember how you rated yourself on these items when you first took this assessment at the beginning of training. Please do not simply recall your original ratings. These ratings are to reflect your current opinion of your pre-training behavior, based on the knowledge, ability, or awareness you gained during the course of training. Do not worry whether these ratings agree or disagree with your earlier ratings Blacken the circles that most closely describes you as of today and described you as of Jan. 13. There may or may not be any differences between the two ratings. If you are unsure about an item, please leave it blank, or blacken the NA circle (not applicable). Figure B2. Group 2 (pre-post/then) directions for posttest and thentest items.
Please evaluate each statement according to how well it best described you before training. This survey gives you the chance to retrospectfully assess your pre-workshop behavior, using the information you gained during the course of training. Think back to when you began this training program. Using the knowledge, skills, or awareness you gained during this workshop, how would you rate yourself as having been before the training began? Blacken the circles that most closely described you as you were on Jan. 13. If you are unsure about an item, please blacken the NA circle (not applicable). Figure B3. Group 3 (post-then) directions for thentest items.
Please evaluate each statement twice: (1) according to how well it best describes you today, now that you are completing training and (2) according to how well is described you on Jan. 13, before training. The second rating gives you the chance to retrospectfully assess your pre-workshop behavior, using the information you gained during the course of training. Think back to when you began this training program. Using the knowledge, skills, or awareness you gained during this workshop, how would you rate yourself as having been before the training began? Blacken the circles that most closely describes you as of today and described you as of Jan. 13. There may or may not be any differences between the two ratings. If you are unsure about an item, please leave it blank, or blacken the NA circle (not applicable).
Figure B4. Group 4 (post/then) directions for posttest and thentest items.
75
REFERENCES
Aiken, L., S., & West, S. G. (1990). Invalidity of true experiments: Self-report pretest biases. Evaluation Review, 14, 374-390.
Babcock, J. L. (1997). Retrospective pretests: Conceptualization and methodological issues (Doctoral dissertation, University of Arizona, 1997). Dissertation Abstracts International, 58, 4513.
Blanchard, K. H. (1994). Ken Blanchard’s Situational Leadership® II: The article. Unpublished, The Ken Blanchard Companies.
Blanchard, K., Fowler, S., & Hawkins, L. (2005). Self leadership and the one minute manager: Increasing effectiveness through situational self leadership. New York: HarperCollins.
Blanchard, K., Hambleton, R., Zigarmi, D., & Forsyth, D. (2004). Leader behavior analysis II. Escondido, CA: The Ken Blanchard Companies.
Brown, M. L., & Kros, J. F. (2003). Data mining and the impact of missing data. Industrial Management & Data Systems, 103, 611-621.
Campbell, D. T., & Stanley, J. C. (1963). Experimental and quasi-experimental designs for research on teaching. In N. L. Gage (Ed.), Handbook of research on teaching. Chicago: RandMcNally.
Center for Leadership Studies. (2005). Situational Leadership® Programs. Retrieved July 27 2006 from http://www.situational.com/leadership.htm
Cohen, J. (1988). Statistical power analysis for the behavioral sciences (2nd ed.). Hillsdale, NJ: Erlbaum.
Craig, S. B., Palus, C. J., & Rogolsky, S. (2000). Measuring change retrospectively: An examination based on item response theory. In J. Martineua (Chair), Measuring behavioral change: Methodological considerations. Paper presented at the annual conference of the Society for Industrial and Organizational Psychology, New Orleans, LA.
Deutsch, M., & Collins, M. E. (1951). Interracial housing: A psychological evaluation of a social experiment. Minneapolis: University of Minnesota Press.
Dunlap, W. P., Cortina, J. M., Vaslow, J. B., & Burke, M. J. (1996). Meta-analysis of experiments with matched groups or repeated measures. Psychological Methods, 1, 170-177.
Fan, X., & Thompson, B. (2001). Confidence intervals about score reliability coefficients, please: An EPM guidelines editorial. Educational and Psychological Measurement, 61, 517-531.
76
Francis-Smythe, J., & Smith, P. M. (1997). The psychological impact of assessment in a development center. Human Relations, 50, 149-168.
Gall, M. D., Gall, J. P., & Borg, W. R. (2003). Educational research: An introduction (7th ed.). New York: Allyn and Bacon.
Golembiewski, R. T., Billingsley, K., & Yeager, S. (1976). Measuring change and persistence in human affairs: Type of change generated by OD designs. Journal of Applied Behavioral Science, 12, 133-157.
Grice, H. P. (1975). Logic and conversation. In P. Cole & J. L. Morgan (Eds.), Syntax and semantics (pp. 41-48). New York: Academic Press.
Hill, L. G., & Betz, D. L. (2005). Revisiting the retrospective pretest. American Journal of Evaluation, 26, 501-507.
Hinkle, D. E., Wiersma, W., & Jurs, S. G. (2003). Applied statistics for the behavioral sciences (5th ed.). Boston: Houghton Mifflin.
Hoogstraten, J. (1982). The retrospective pretest in an educational training context. Journal of Experimental Education, 50, 200-204.
Hoogstraten, J. (1985). Influence of objective measures on self-reports in a retrospective pretest-posttest design. Journal of Experimental Education, 53, 207-210.
Howard, G. S. (1980). Response-shift bias: A problem in evaluating interventions with pre/post self-reports. Evaluation Review, 4, 93-106.
Howard, G. S., & Dailey, P. R. (1979). Response-shift bias: A source of contamination of self-report measures. Journal of Applied Psychology, 64, 144-150.
Howard, G. S., Dailey, P. R., & Gulanick, N. A. (1979). The feasibility of informed pretests in attenuating response-shift bias. Applied Psychological Measurement, 3, 481-494.
Howard, G. S., Millham, J., Slaten, S., & O’Donnel, L. (1981). Influence of subject response style effects on retrospective measures. Applied Psychological Measurement, 5, 89-100.
Howard, G. S, Ralph, K. M., Gulanick, N. A., Maxwell, S. E., Nance, D. W., & Gerber, S. K. (1979). Internal validity in pretest-posttest self-report evaluations and a re-evaluation of retrospective pretests. Applied Psychological Measurement, 3, 1-23.
Howard, G. S., Schmeck, R. R., & Bray, J. H. (1979). Internal validity in studies employing self-report instruments: A suggested remedy. Journal of Educational Measurement, 16, 129-135.
Huck, S. W., & McLean, R. A. (1975). Using a repeated meaures ANOVA to analyze the data from a pretest-posttest design: A potentially confusing task. Psychological Bulletin, 82, 511-518.
77
Klatt, J., & Taylor-Powell, E. (2005, October). Synthesis of literature relative to the retrospective pretest design. Paper presented at the 2005 Joint CES/AEA Conference, Toronto, Canada.
Koele, P., & Hoogstraten, J. (1988). A method for analyzing retrospective pretest/posttest designs: I. Theory. Bulletin of the Psychonomic Society, 26, 51-54.
Lam, T. C. M., & Bengo, P. (2003). A comparison of three retrospective self-reporting methods of measuring change in instructional practice. American Journal of Evaluation 24, 65-80.
Lamb, T. (2005). The retrospective pretest: An imperfect but useful tool. Evaluation Exchange 11(2). Retrieved October, 19, 2005 http://www.gse.harvard.edu/hfrp/eval/issue30/spotlight.html
Lamb, T. A., & Tschillard, R. (2005, Spring). Evaluating learning in professional development workshops: Using the retrospective pretest. Journal of Research in Professional Learning. Retrieved October 19, 20005, from http://www.nsdc.org/library/publications/research/lamb.pdf
Levinson, W., Gordon, G., & Skeff, K. (1990). Retrospective versus actual pre-course self-assessments. Evaluation & the Health Professions, 13, 445-452.
Mann, S. (1997). Implication of the response-shift bias for management. Journal of Management Development, 16, 328.
Manthei, R. J. (1997). The response-shift bias in a counselors education programme. British Journal of Guidance & Counselling, 25, 229-238.
Martineua, J. (2004). Evaluating leadership development programs: A professional guide. Greensboro, NC: Center for Creative Leadership.
Maxwell, S. E., & Delany, H. D. (2004). Designing experiments and analyzing data: A model comparison perspective (2nd ed.). Mahwah, NJ: Erlbaum.
Mezoff, B. (1981a). How to get accurate self-reports of training outcomes. Training and Development Journal, 35(9), 56-61.
Mezoff, B. (1981b). Pre-then-post testing: A tool to improve the accuracy of management training program evaluation. Performance and Instruction, 20(8), 10-11.
Milliken, G. A. (1984). Analysis of messy data. Belmont, CA: Lifetime Learning Publications.
Morrison, A. M., McCall, J. W., Jr., & DeVries, D. L. (1978). Feedback to managers: A comprehensive review of twenty-four instruments. Greensboro, NC: Center for Creative Leadership.
78
Nimon, K., & Allen, J. (2007). A review of the retrospective pretest: Implications for performance improvement evaluation and research. Workforce Education Forum, 44, 36-55.
Norman, G. (2003). Hi! How are you? Response-shift, implicit theories and differing epistemologies. Quality of Life Research, 12, 239-249.
Nunnally, J. C. (1978). Psychometric theory (2nd ed.). New York: McGraw-Hill.
Pearson, R. W., Ross, M., & Dawes, R. M. (1992). Personal recall and the limits of retrospective questions in survey’s In J. M. Tanur (Ed.), Questions and survey questions: Meaning, memory, expression, and social interactions in survey (pp. 65-94). New York: Russell Sage.
Pohl, N. F. (1982). Using retrospective pre-ratings to counteract response-shift confounding. Journal of Experimental Education, 50, 211-214.
Pratt, C. C., McGuigan, W. M., & Katzev, A. R. (2000). Measuring program outcomes: Using retrospective pretest methodology. American Journal of Evaluation, 21, 341-349.
Raidl, M., Johnson, S., Gardiner, K., Denham, M, Spain, K., & Lanting, R. (2004). Use retrospective surveys to obtain complete data sets and measure impact in extension programs. Journal of Extension, 42(2). Retrieved October 19, 2005, from http://www.joe.org/joe/2004april/rb2.shtml
Rhodes, J. E., & Jason, L. A. (1987). The retrospective pretest: An alternative approach in evaluating drug prevention programs. Journal of Drug Education, 17, 345-356.
Ross, M. (1989). Relation of implicit theories to the construction of personal histories. Psychological Review, 96, 341-357.
Ross, M., & Conway, M. (1986). Remembering one’s own past: The construction of personal histories. In R. M. Sorrentino & E. T. Higgins (Eds.), Handbook of motivation and cognition (pp. 122-144). New York: Guilford Press.
Schwarz, N. (1996). Cognition and communication: Judgmental biases, research methods, and the logic of conversation. Mahwah, NJ: Erlbaum.
Schwarz, N. (1999). Self-reports: How the questions shape the answers. American Psychologist, 54(2), 93-105.
Schwarz, N. (in press). Retrospective and concurrent self-reports: The rationale for real-time data capture. In A. A. Stone, S. S. Shiffman, A. Atienza, & L. Nebeling (Eds.), The science of real-time data capture. New York: Oxford University Press.
Sears, R. R., Maccoby, E. E., & Levin, H. (1957). Patterns of child rearing. Evanston, IL: Row, Peterson.

79
Shipper, F. (1995). A study of the psychometric properties of the managerial skill scales of the survey of management practices. Educational and Psychological Measurement, 55, 468-479.
Shipper, F. (1999). A comparison of managerial skills of middle mangers with MBAs, with other masters’ and undergraduate degree ten year after the Porter and McKibbin report. Journal of Managerial Psychology, 14, 150-159.
Skeff, K. M., Stratos, G. A., & Bergen, M. R. (1992). Evaluation of a medical faculty development program: A comparison of traditional pre/post and retrospective pre/post self-assessment ratings. Evaluation & the Health Professions, 15, 350-366.
Sprangers, M. (1989). Subject bias and the retrospective pretest in retrospect. Bulletin of Psychonomic Society, 27, 11-14.
Sprangers, M., & Hoogstraten, J. (1989). Pretesting effects in retrospective pretest-posttest designs. Journal of Applied Psychology, 74, 265-272.
Sprangers, M., & Hoogstraten, J. (1991). Subject bias in three self-report measure of change. Methodika, 5, 1-13.
Sprangers, M. A. G., & Schwartz, C. E. (2000). Integrating response-shift into health-related quality-of-life research: A theoretical model. In C. E. Schwartz & M. A. G. Sprangers (Eds.), Adaptation to changing health: Response-shift in quality-of-life research (pp. 25-36). Washington, DC: American Psychological Association.
SPSS for Windows 14.0 (Graduate Student Version) [Computer software]. (2005). Chicago: SPSS Inc.
Stevens, J. P. (2002). Applied multivariate statistics for the social sciences (4th ed.). Mahwah, NJ: Erlbaum.
Sugrue, B., & Rivera, R. J. (2005). State of the industry: ASTD’s annual review of trends in workplace learning and performance. Alexandria, VA: American Society for Training & Development.
Tabachnick, B. G., & Fidell, L. S. (2001). Using multivariate statistics (4th ed.). Boston: Allyn and Bacon.
Taylor-Powell, E., & Renner, M. (2000). Collecting evaluation data: End-of-session questionnaires. Madison: University of Wisconsin Extension.
Terborg, J. R., & Davis, G. A. (1982). Evaluation of a new method for assessing change to planned job redesign as applied to Hackman and Oldham’s job characteristic model. Organizational Behavior and Human Performance, 29, 112-128.
80
Townsend, M., Lai, M. K., Lavery, L., Sutherland, C., & Wilton, K. (1999, December). Mathematic anxiety and self-concept: Evaluation change using the “then-now” procedure. Paper presented at the combined meeting of the Australian Association for Research in Education, Melbourne, Australia.
Umble, K., Upshaw, V., Orton, S., & Matthews, K. (2000, June). Using the post-then method to assess learner change. Presentation at the AAHE Assessment Conference, Charlotte, NC.
Van Velsor, E., & Leslie, J. B. (1991). Feedback to managers, volume II: A review and comparison of sixteen multi-rater feedback instruments. Greensboro, NC: Center for Creative Leadership.
W. K. Kellogg Foundation. (2002). Evaluating outcomes and impacts: A scan of 55 leadership development programs. Battle Creek, MI: W. K. Kellogg Foundation.
Walk, R. D. (1956). Self-ratings of fear in a fear-invoking situation. Journal of Abnormal and Social Psychology, 52, 171-178.
Wilson, C. L. (1978). The Wilson multi-level management surveys: Refinement and replication of the scales. JSAS: Catalog of Selected Documents in Psychology, 8, 1707. Washington, DC: American Psychology Association.
Wilson, C. L. (1988). Task cycle theory: A learning-based view of organization behavior. In R. O. Whitney (Ed.), Psychology and productivity (pp. 159-177). New York: Plenum Books.
Wilson, C. L. (2006). The Clark Wilson group surveys: Management practices. Silver Spring, MD: The Clark Wilson Group.
Williams, R. H., & Zimmerman, D. W. (1996). Are simple gain scores obsolete? Applied Psychological Measurement, 20, 59-69.
Zigarmi, D., Edeburn, C., & Blanchard, K. (1997). Getting to know the LBAII®: Research, validity and reliability of the self and other forms (4th ed.). Escondido, CA: Blanchard Training and Development, Inc.
Zumbo, B. (1999). The simple difference score as an inherently poor measure of change: Some reality, much mythology. In B. Thompson (Ed.), Advances in social science methodology (pp. 269-304). Stanford, CT: JAI Press.
Zwiebel, A. (1987). Changing educational counselors’ attitudes toward mental retardation: Comparison of two measurement techniques. International Journal of Rehabilitation Research, 10, 383-389.