comparing nonlinear static analysis methods in … · 2020-01-13 · performance, non-linear static...
TRANSCRIPT
Canadian Journal of Pure and Applied Sciences Vol. 9, No. 3, pp. 3655-3671, October 2015 Online ISSN: 1920-3853; Print ISSN: 1715-9997 Available online at www.cjpas.net
COMPARING NONLINEAR STATIC ANALYSIS METHODS IN PREDICTING THE SEISMIC RESPONSE OF STRUCTURES ISOLATED BY
SLIDING BASE ISOLATORS
Ali Yeganehfar1 and *Behnam Mehrparvar2 Department of Civil Engineering, Islamic Azad University, West Tehran Branch, Tehran, Iran
ABSTRACT
In this paper the performance of different nonlinear static analysis methods and their accuracy in predicting the seismic response of structures isolated by sliding base isolators has been compared. For this purpose, first,5 and 10-story isolated steel structures with special moment frames located in LA, US were designed according to AISC 360, AISC 341, and ASCE 7 design requirements. In this study, friction pendulum system (FPS) has been used as isolation system. Results of non-linear static pushover analyses of the models with triangular, uniform, and PSC (Protective Systems Committee) load patterns, modal pushover analysis (MPA), and N2 method were compared with the results obtained by nonlinear dynamic time history analysis as a criterion for accuracy in this study. According to the results, it was concluded that in predicting the story shear responses, pushover analysis with triangular load pattern had accurate response compared to other studied methods. Also in predicting floor displacement responses and story drifts, pushover analysis under uniform load pattern, N2, and MPA methods resulted in more accurate responses regarding the other methods. Overall, N2 method had the most accuracy with respect to nonlinear dynamic analysis in predicting story shears, story drifts, floor displacements and maximum hinge rotations in structures isolated by sliding base isolators. Keywords: Nonlinear dynamic analysis methods, pushover analysis, load patterns, seismic response, sliding base isolators.
INTRODUCTION In recent years, the design and construction methods for earthquake resistant structures of buildings, bridges, and other structures in earthquake-prone areas, have been greatly improved. New methods are mainly based on structural control. In seismic isolation, structure is placed on isolators that can have substantial lateral deformations. In the event of an earthquake, a major translation occurs at the isolation level(usually at the base), and the structure moves like a rigid body with small deformations within the super-structure. Installing an isolator increases the period and damping ratio in structures, so instead of increasing the seismic resistance of structures, seismic demand is reduced (Ozdemir and Constantinou, 2010). In other words, rather than entering earthquake energy into a structure and taking measures to deal with it, earthquake energy is prevented from entering the structure, and is attenuated in isolation level. Despite significant reduction in incoming forces and according to economic considerations, structural response can be somewhat beyond elastic behavior; therefore, it is necessary to study the structural behavior beyond its
elastic limit. Nonlinear analysis of structures is done using both static and dynamic methods. Between these two, nonlinear dynamic time history analysis is a better method to evaluate structural behavior compared to nonlinear static analysis; however, due to greater complexity and the high dependency on input ground motions, it is less used. Recently, nonlinear static analysis methods have become popular tools in the evaluation of structures. The amount of computation required is very less for these methods compared to the non-linear dynamic analysis ones, which has led to the increasing use of this method of analysis. In this paper we try to study the performance of nonlinear static analysis methods in examining structural behavior with sliding base isolators. In other words, we want to estimate seismic response of structures isolated by sliding base isolators using nonlinear static analysis methods. MATERIALS AND METHODS Base isolators Base Isolation devices are commonly classified into two types: rubber bearings, and sliding bearings. Although rubber bearings have been used extensively, but sliding bearings have also had wide applications, because they have good performance in a wide range of frequencies, *Corresponding author e-mail: [email protected]
Canadian Journal of Pure and Applied Sciences
3656
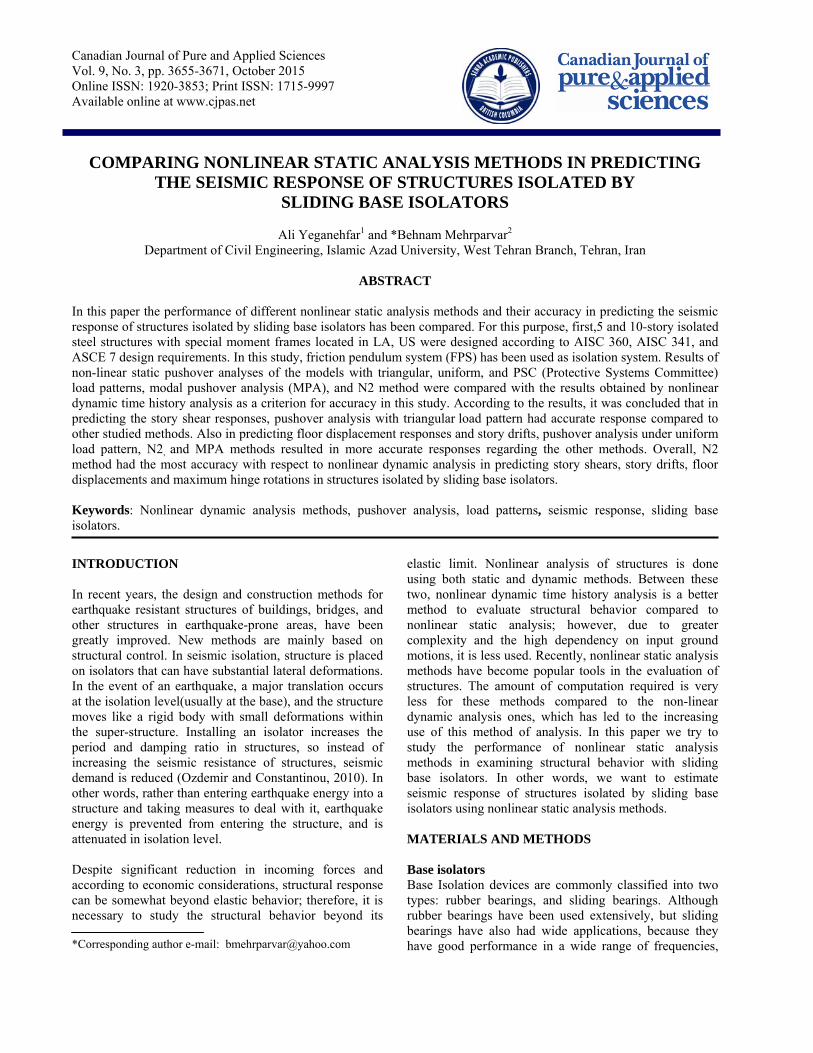
and they can considerably limit the transmitted shear force (Krishnamoorty and Saumil, 2005). One of the important features of these bearings is that they are not sensitive to frequency content of earthquake vibrations. In this study we focus on a type of sliding system called Friction pendulum system. Friction pendulum system In frictional isolation system, superstructure slide on a spherical surface at the time of occurrence of large earthquakes. Structure, once the shear force in the isolated story exceeds the frictional force intended for the isolators, begin to slide on them, and thus a large seismic forces to the structure is avoided. Figure 1 shows the scheme of a Friction pendulum system (FPS) isolator. In this isolator, restoring force is generated by gravity and the weight of the structure or by high-tension springs. In the center of this isolator there is a stainless steel spherical surface with a high resistance and low friction steel ball on it. The radius of curvature of the concave surface determines the effective stiffness of the isolator and the isolation period of the structure (Naeim and Kelly, 1999). Determinant factors for the design of FPS isolator are: radius of curvature of the concave surface (RFPS), friction coefficient of spherical surface (µ), and dimensions of the isolator: (Chen and Scawthorn, 2003) RFPS is obtained as:
(1) Where g is the gravity, D is design displacement, and is design target point. In this regard, effective damping ratio is computed as follow:
ζeff =2/π×µ/(µ+D/RFPS ) (2)
Also effective stiffness of the isolator is design displacement is written as:
(3) Where, represents the weight of superstructure. Non-linear static analysis Perhaps the study of non-linear behavior of structures began by studies of Leibnitzon plastic behavior of fixed and continuous beams (Baker, 1956), but the use of non-linear static analysis methods in earthquake engineering first was developed by Gulkan and Sozen (1974) where they used single degree-of-freedom(SDOF) system to study the structural behavior of a multi-degrees of freedom systems. Later, non-linear static analysis method was divided into three methods: capacity spectrum (Freeman et al., 1975), displacement coefficient method (DCM) (FEMA 273, 1997), and N2 method (Fajfar and Fishinger, 1988). In all of these methods, structural capacity is determined by force-displacement relationship or capacity curve obtained from non-linear static analysis with an assumed load pattern. For this purpose, base shear forces and story displacement sturn into spectral acceleration and spectral displacement of a single degree of freedom, respectively to compare spectrum demand. Their difference is mainly related to spectrum demand. We also have examples of simple non-linear static analysis methods developed by FEMA-356. Non-linear static analysis methods have great application. Some of these applications include validation of the design of new buildings, seismic rehabilitation of existing structures, and performance based design. With regard to the
Fig. 1. Scheme of an FPS isolator.

Yeganehfar and Mehrparvar
3657
development of regulations for loading and seismic design for the next generation based on structural performance, non-linear static analysis will become more important over time. Pushover analysis and its load patterns Pushover analysis as the first and simplest method of nonlinear static analysis has won a good position in the last few years among different related methods. Pushover analysis is used to estimate seismic structural deformations. It is an analysis used to record seismic responses of a structure and evaluate the performance of it. By this method we can present pushover curve or force-displacement relationship for a structure. In this method first step is to select lateral load pattern. (1). Inverted triangle distribution (modal pattern); (2). Uniform distribution; (3). Load distribution based on linear elastic dynamic
analysis or response spectrum analysis of the building (Tso and Moghadam,1997)
(4). The adaptive distribution, which is varied as the inter story resistance changes in each load step (Bracci et al., 1997)
(5). Distribution proportional to the product of the mass and fundamental mode shape, which is used initially until the first yielding takes place. Then the lateral forces are determined based on the product of the current floor displacement and mass at each step (Fajfar and Fishinger, 1988).
(6). A distribution based on mode shapes derived from secant stiffness at each load step (Eberhard and Sozwn, 1993).
According to FEMA-356, there should be at least two lateral load distribution patterns to bound the range of
design actions that may occur during actual dynamic response. Uniform and triangular load distributions are obtained according to equations (4) and (5) and their patterns are shown in figures 2 and 3. Uniform load distribution:
(4) Triangle load distribution:
(5) Where, wx and wi areweights of stories, hx and hi represents the heights of stories, and V is base shear force. Pushover analyses with PSC load pattern The inaccuracy resulted by neglecting inertia at the base level was investigated by Protective Systems Committee (PSC) of SEAONC. They proposed the use of an inverted triangular load pattern over the height of the superstructure with an additional concentrated force at the base level proportional to base mass:
(6)
Where, and In above equation, Fb is additional concentrated force at the base level, Vb is base shear ratio, Wb is base mass, Db represents actual base displacement, Keff = effective stiffness of the selected isolator, and the coefficient k introduced by ASCE is equal to 1. (Kilar and Koren, 2009).
(a) (b)
Fig. 2. Lateral load distribution patterns (a) uniform and (b) triangle.
Canadian Journal of Pure and Applied Sciences
3658
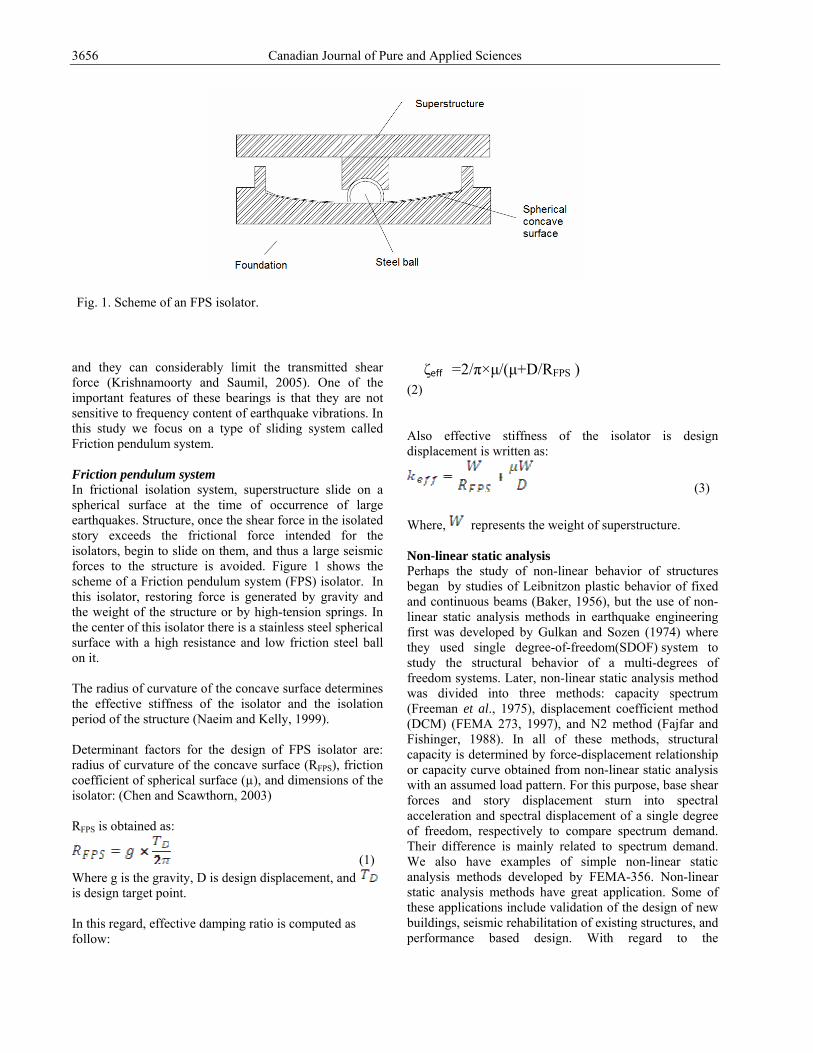
N2 method N2 method is a new non-linear static analysis method first proposed by Fajfar and Fishinger in 1988, and later developed by Fajfar (1999) in a displacement-acceleration format. The basic idea of this method came from the Q-model of Saiidi and Sozen (1981). It is similar to capacity spectrum method which has been included in ATC-40. Their difference is that N2 method uses inelastic spectra, while capacity spectrum method employs inelastic spectra. In N2 method, inelastic demand spectra are determined by finding reduction factors, and using them in typical smooth elastic design spectrum. Fajfar (2000) described the steps of N2 method. First we depict elastic acceleration (Sae) and displacement (Sde) spectrum corresponding to Period T. Then to plot both spectra we use acceleration- displacement (AD) format. For elastic SDOF system we have:
(7) For inelastic SDOF system we have:
(8)
(9) Where, Sa is acceleration spectrum, Sd is displacement spectrum, µ is ductility factor, and Rµ represents reduction factor because of ductility.To obtain Rµ , we can use the formula proposed by Miranda and Bertero (1994) :
(10) (11)
where Tc is the transition period from constant acceleration segment of the response spectrum to the constant velocity segment of the spectrum. In N2 method, we use following lateral load distribution formula:
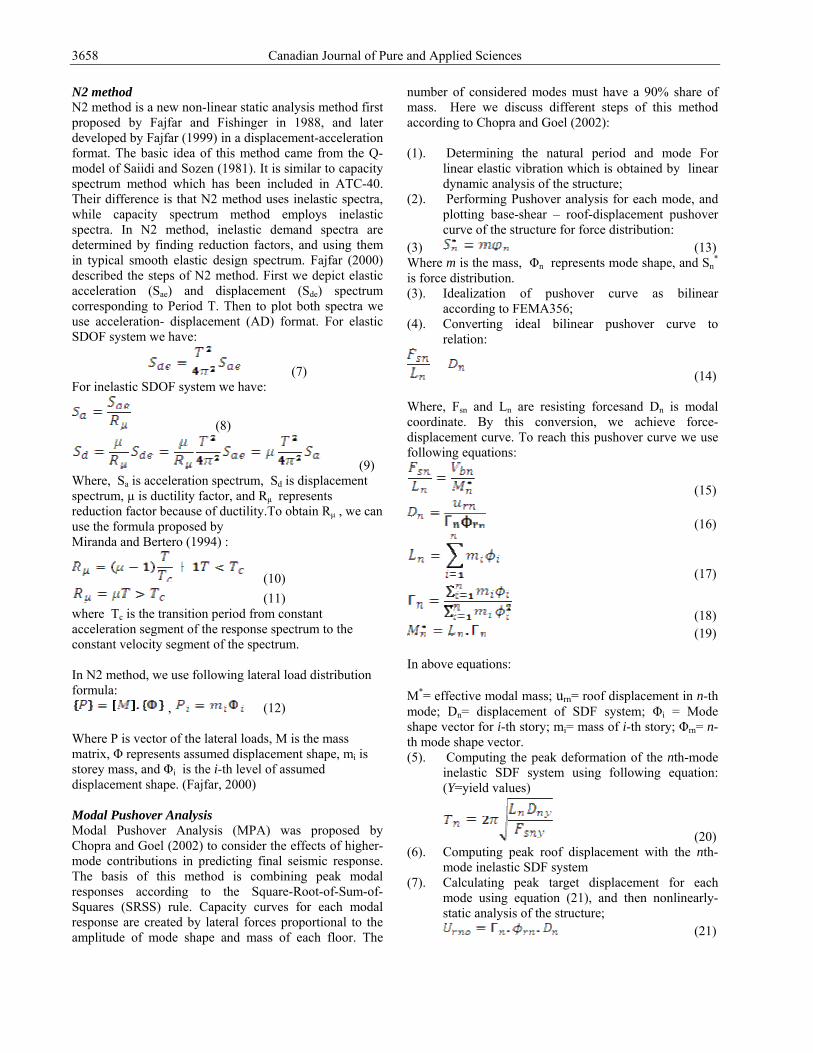
, (12) Where P is vector of the lateral loads, M is the mass matrix, Φ represents assumed displacement shape, mi is storey mass, and Φi is the i-th level of assumed displacement shape. (Fajfar, 2000) Modal Pushover Analysis Modal Pushover Analysis (MPA) was proposed by Chopra and Goel (2002) to consider the effects of higher-mode contributions in predicting final seismic response. The basis of this method is combining peak modal responses according to the Square-Root-of-Sum-of-Squares (SRSS) rule. Capacity curves for each modal response are created by lateral forces proportional to the amplitude of mode shape and mass of each floor. The
number of considered modes must have a 90% share of mass. Here we discuss different steps of this method according to Chopra and Goel (2002): (1). Determining the natural period and mode For
linear elastic vibration which is obtained by linear dynamic analysis of the structure;
(2). Performing Pushover analysis for each mode, and plotting base-shear – roof-displacement pushover curve of the structure for force distribution:
(3) (13) Where m is the mass, Φn represents mode shape, and Sn
* is force distribution. (3). Idealization of pushover curve as bilinear
according to FEMA356; (4). Converting ideal bilinear pushover curve to
relation:
(14) Where, Fsn and Ln are resisting forcesand Dn is modal coordinate. By this conversion, we achieve force-displacement curve. To reach this pushover curve we use following equations:
(15)
(16)
(17)
(18) (19)
In above equations: M*= effective modal mass; urn= roof displacement in n-th mode; Dn= displacement of SDF system; Φi = Mode shape vector for i-th story; mi= mass of i-th story; Φrn= n-th mode shape vector. (5). Computing the peak deformation of the nth-mode
inelastic SDF system using following equation: (Y=yield values)
(20) (6). Computing peak roof displacement with the nth-
mode inelastic SDF system (7). Calculating peak target displacement for each
mode using equation (21), and then nonlinearly- static analysis of the structure;
(21)
Yeganehfar and Mehrparvar
3659
(8). Determining the total response by combining the peak modal responses using the SRSS combination rule:
(22) Where rMPA represents peak value of the total response, rno is value of nth-mode contribution, and j=number of modes. After discussing base isolation, base isolators, and different nonlinear static analysis methods, in next section we review previous related studies conducted in the world. Previous studies In this section we have a look at the conducted studies on nonlinear static and dynamic procedures for seismic response analysis of buildings. Lew and Kunnath (2001) examined the effectiveness of nonlinear static procedures for seismic response analysis of buildings. Nonlinear static procedures were recommended by FEMA 273 document in assessing the seismic performance of buildings for a given earthquake hazard representation. Three nonlinear static procedures specified in FEMA 273 were evaluated for their ability to predict deformation demands in terms of inter-story drifts and potential failure mechanisms. Their study showed that nonlinear static procedures are not effective in predicting inter-story drift demands compared to nonlinear dynamic procedures. Providakis (2008) investigated the seismic behavior of steel–concrete composite structures isolated by base-isolation devices under near-fault earthquake excitations. The seismic analysis was performed by means of the static non-linear pushover analysis procedure conducted on two five-story 3-D buildings with steel columns and steel–concrete composite slabs. The results of this study allowed the verification of the adequacy of the attachment isolation system as well as the comparison of the behavior of the seismic-protected building with or without bracings to the unprotected buildings with or without bracings and beams. Kilar and Koren (2008) examined the usage of a simplified nonlinear method for seismic analysis and performance evaluation (N2 method) for analysis of base isolated structures. They applied the N2 method for analysis of a fixed base and base isolated simple 4-storey frame building designed according to EC8. Two investigated different sets of base isolation devices were a simple rubber (RB) and a similar lead rubber bearing (LRB) base isolation system. For each system a Soft, Normal and Hard rubber stiffness and three different damping values were used. Kilar and Koren (2011) also conducted another study on the applicability of N2 method to base-isolated plan-asymmetric building structures. First some modifications implemented into N2 method such as the new three-linear idealization and
inclusion of isolator damping by reduction factor. They used the proposed procedure for the seismic analysis of a base-isolated 4-storey RC asymmetric building isolated with lead rubber bearings (LRBs).They compared the results of nonlinear dynamic time-history analyses with the results of the N2 method in terms of obtained top, base and relative displacements. Comparisons of the results of the simplified method with the exact results of the nonlinear dynamic analyses showed a very good agreement. According to their findings, the presented simplified approach might be a valuable tool for design, analysis and verification of the behavior of symmetric as well as moderately asymmetric base-isolated structures. In another study conducted by Fragiadakis et al. (2014), the applicability of nonlinear static procedures for estimating the seismic demands of typical regular RC moment-resisting frames were evaluated. This work, conducted within the framework of the ATC-76-6 project, shows the degree to which nonlinear static methods can characterize global and local response demands vis-à-vis those determined by nonlinear dynamic analysis for three RC moment-frame buildings. The response quantities (engineering demand parameters) considered are peak floor displacement, story drifts, story shears, and floor overturning moments. The single-mode pushover methods evaluated include the N2 and the ASCE-41 coefficient methods. Multi-modal pushover methods, such as MPA and the consecutive MPA, were also evaluated. The results indicated that the relatively good performance of the single-mode methods observed for low-rise buildings rapidly deteriorates as the number of stories increases. The multi-modal techniques generally extend the range of applicability of pushover methods, but at the cost of additional computation and without ensuring the reliability of the results. Modelling structures In this study we present a comparison between nonlinear static analysis (NSA) methods in predicting the seismic response of structures isolated by FPS base isolator. These methods are: (1) pushover analysis with uniform, (2) triangular, and (3) PSC load patterns, (4) N2 method, and (5) MPA. Also dynamic time history analysis was conducted on 5 and 10 story structures whose results is a criterion for accuracy of our study in comparing NSA methods. It should be noted that in N2 and MPA methods which use structural modes, we used only the first mode due to its higher impact. 5 and 10 story buildings with a symmetric and regular plan, five 5-meter spans in X and Y direction, and equal story heights of 3.2 meters located in Los Angeles city, US were designed based on seismic loading of ASCE 7-10 code given soil type B. Design of steel structures is based on Load and Resistance Factor Design (LRFD) method of AISC 360-10 specifications. Assumed design loads are presented in table 1. Analysis
Canadian Journal of Pure and Applied Sciences
3660
and design of the models were performed using SAP2000 v.16 software. Table 1. Gravity dead and live loads inputs.
Type of Load Loading (kg/m2)
Story live load 200 Story dead load 600 Roof live load 150 Roof dead load 600 Staircase live load 350 Staircase dead load 700 Wall dead load 210
Capacity ratio in all elements was at the range of 0.7 to 1. Box and IPE sections were used to design columns and beams, respectively. Also the response modification factor(R) of the structures, given that the building was isolated with sliding base isolators, was considered equal to 2. In table 2, dimensions of the beams and columns in both buildings are presented. Table 2. Specification of beams and columns used in the structures.
5-story building 10-story building
IPE 180 IPE 200 IPE 200 IPE 220 IPE 220 IPE 240 IPE 240 IPE 270 IPE 270 IPE 300 IPE 300 IPE 330 IPE 330 IPE 360 IPE 360 IPE 400
TUBO 100X100X8 IPE 450 TUBO 100X100X10 IPE 500 TUBO 160X160X10 TUBO140X140X10 TUBO 160X160X16 TUBO140X140X20 TUBO 180X180X10 TUBO140X140X25 TUBO 180X180X16 TUBO160X160X20 TUBO 200X200X16 TUBO160X160X25 TUBO 220X220X16 TUBO160X160X28 TUBO 240X240X16 TUBO180X180X25
TUBO180X180X30 TUBO180X180X35 TUBO200X200X25 TUBO200X200X35 TUBO220X220X25 TUBO220X220X30 TUBO220X220X35 TUBO220X220X40 TUBO240X240X30 TUBO240X240X35 TUBO260X260X30 TUBO260X260X35 TUBO260X260X40
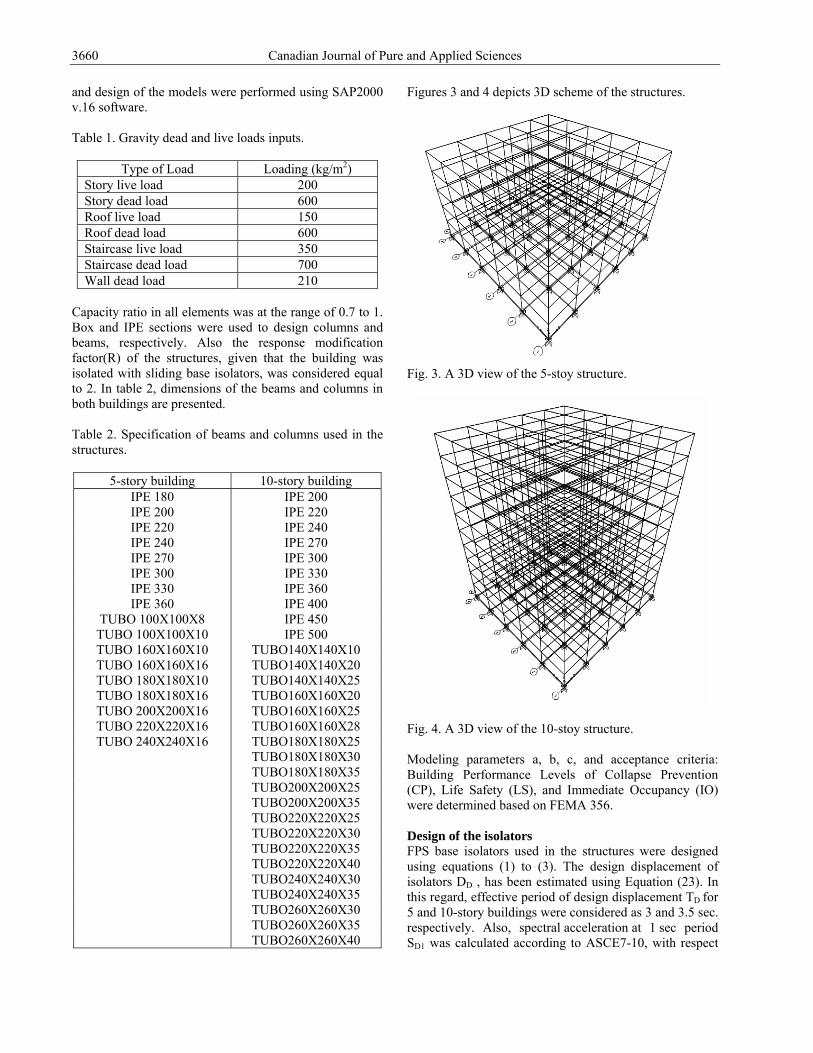
Figures 3 and 4 depicts 3D scheme of the structures.
Fig. 3. A 3D view of the 5-stoy structure.
Fig. 4. A 3D view of the 10-stoy structure. Modeling parameters a, b, c, and acceptance criteria: Building Performance Levels of Collapse Prevention (CP), Life Safety (LS), and Immediate Occupancy (IO) were determined based on FEMA 356. Design of the isolators FPS base isolators used in the structures were designed using equations (1) to (3). The design displacement of isolators DD , has been estimated using Equation (23). In this regard, effective period of design displacement TD for 5 and 10-story buildings were considered as 3 and 3.5 sec. respectively. Also, spectral acceleration at 1 sec period SD1 was calculated according to ASCE7-10, with respect

Yeganehfar and Mehrparvar
3661
to the location of structures in LA and given soil type, whose result was 0.67 g. Also, BD numerical coefficient relative to effective damping of the isolation system, given friction factor for the isolators (mu=0.06), was determined as 1.7.
(23) Table 3 shows the results for both models.
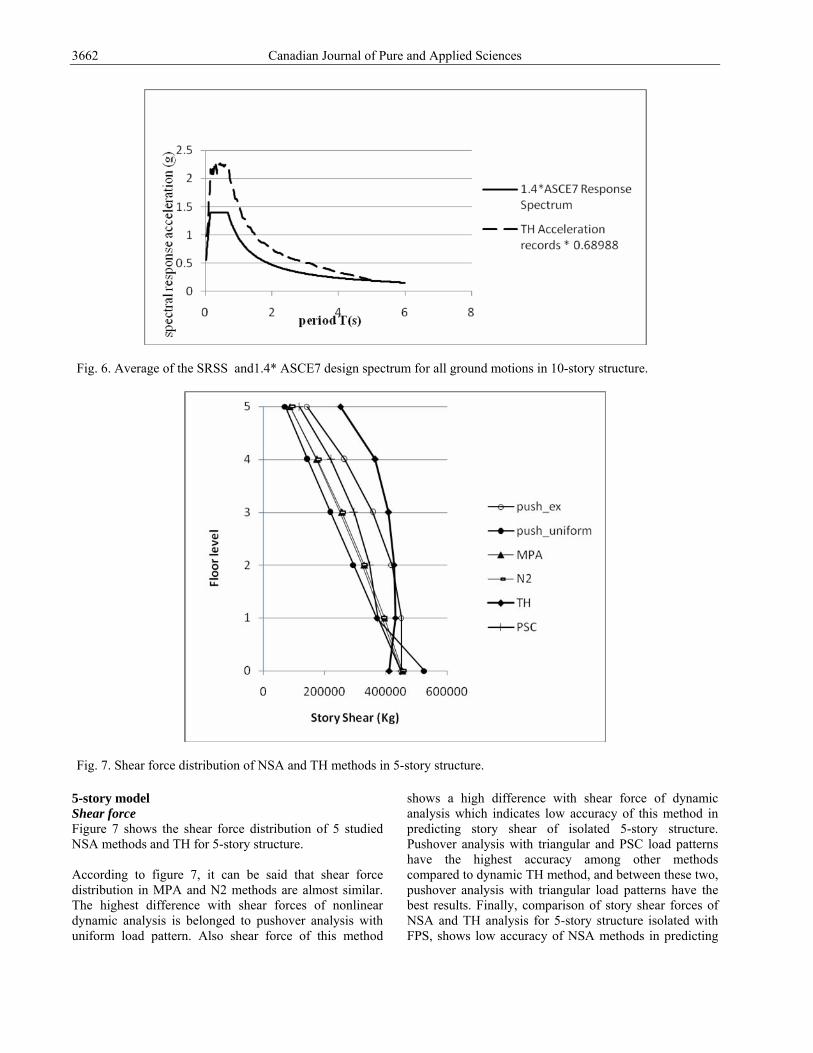
Time history analysis For time history analysis, seven pairs of far-field ground motions were selected. The ground motion records were obtained from Pacific Earthquake Engineering Research Center (PEER)strong motion database. The average of the SRSS spectra for all ground motions is calculated and scaled to 1.4 times of ASCE7designspectrum for periods between 0.2TD and 1.5TD . For each structure are shown in table 4. Figures 5 and 6 show a comparison between
the scaled average of SRSS spectra for seven pairs of ground motions and 1.4times the design spectrum in both studied structures. Comparison of NSA methods In order to compare NSA methods, we used the average value of peak base displacement obtained from time history analyses using the scaled ground motions as a target displacement in base level for all NSA methods. Accordingly, we can evaluate the accuracy of lateral load distribution in predicting seismic response of structures in NSA methods with target displacement including story shear and story drift. Results and Discussion According to nonlinear static (NSA) and dynamic time history (TH) analyses performed on 5 and 10storymodels, in this section the comparison of the results related to shear forces, floor displacements, story drifts, hinge rotations, and location of plastic hinges are presented.
Table 3. Properties of selected isolators.
FPS isolator parameters mu TD (s) R FPS (m) DD (m) Keff (KN/m) 5-story model 0.06 3 4.2 0.29 348.7 10-story model 0.06 3.8 8.6 0.37 383.65
Table 4. Earthquake Records.
No. Earthquake station Year PGA 1 LOMA PRIETA 1 SAGO SOUTH SURFACE 1989 0.2089 2 Northridge 1 LA_Centinela St 1994 0.3686 3 Taiwan SMART SMART 1 1986 0.1707 4 PALM SPRINGS INDIO 1986 0.1245 5 LOMA PRIETA 2 PALO ALTO 1989 0.2089 6 Landers San Bernardino -E & Hospitality 1992 0.0838 7 Northridge 2 LA-Pico & Sentous 1994 0.1412
Fig. 5. Average of the SRSS and1.4* ASCE7 design spectrum for all ground motions in 5-story structure.
Canadian Journal of Pure and Applied Sciences
3662
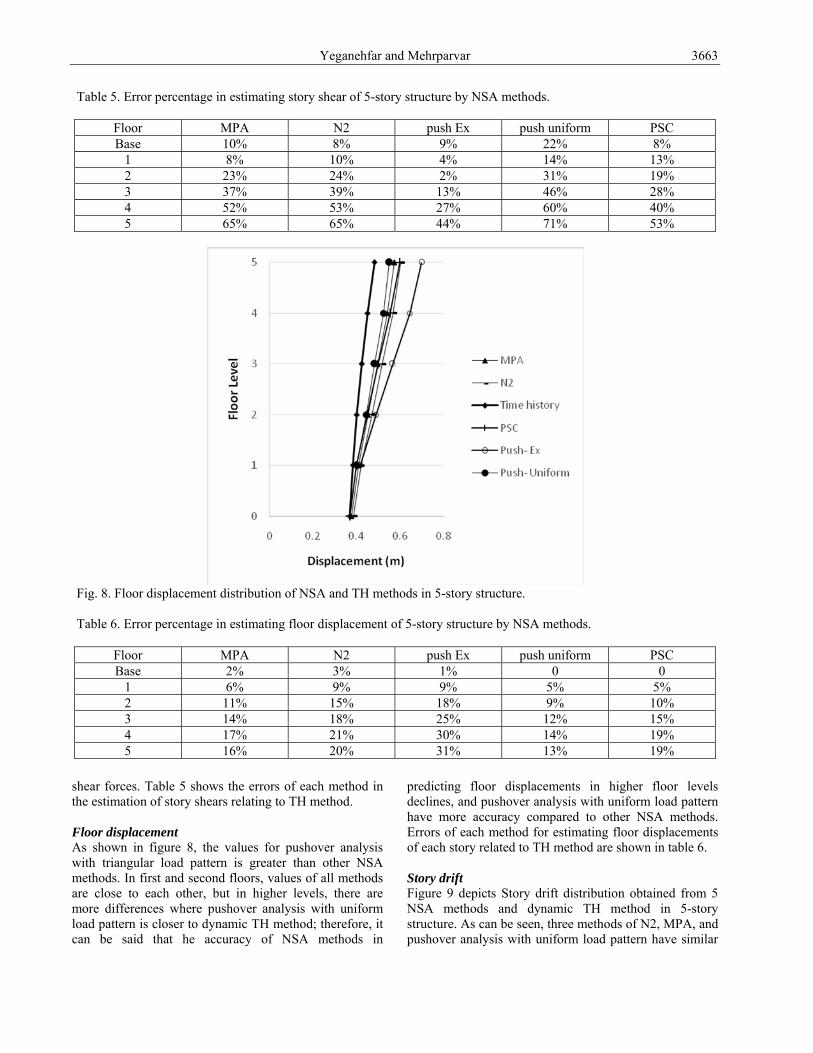
5-story model Shear force Figure 7 shows the shear force distribution of 5 studied NSA methods and TH for 5-story structure. According to figure 7, it can be said that shear force distribution in MPA and N2 methods are almost similar. The highest difference with shear forces of nonlinear dynamic analysis is belonged to pushover analysis with uniform load pattern. Also shear force of this method
shows a high difference with shear force of dynamic analysis which indicates low accuracy of this method in predicting story shear of isolated 5-story structure. Pushover analysis with triangular and PSC load patterns have the highest accuracy among other methods compared to dynamic TH method, and between these two, pushover analysis with triangular load patterns have the best results. Finally, comparison of story shear forces of NSA and TH analysis for 5-story structure isolated with FPS, shows low accuracy of NSA methods in predicting
Fig. 6. Average of the SRSS and1.4* ASCE7 design spectrum for all ground motions in 10-story structure.
Fig. 7. Shear force distribution of NSA and TH methods in 5-story structure.
Yeganehfar and Mehrparvar
3663
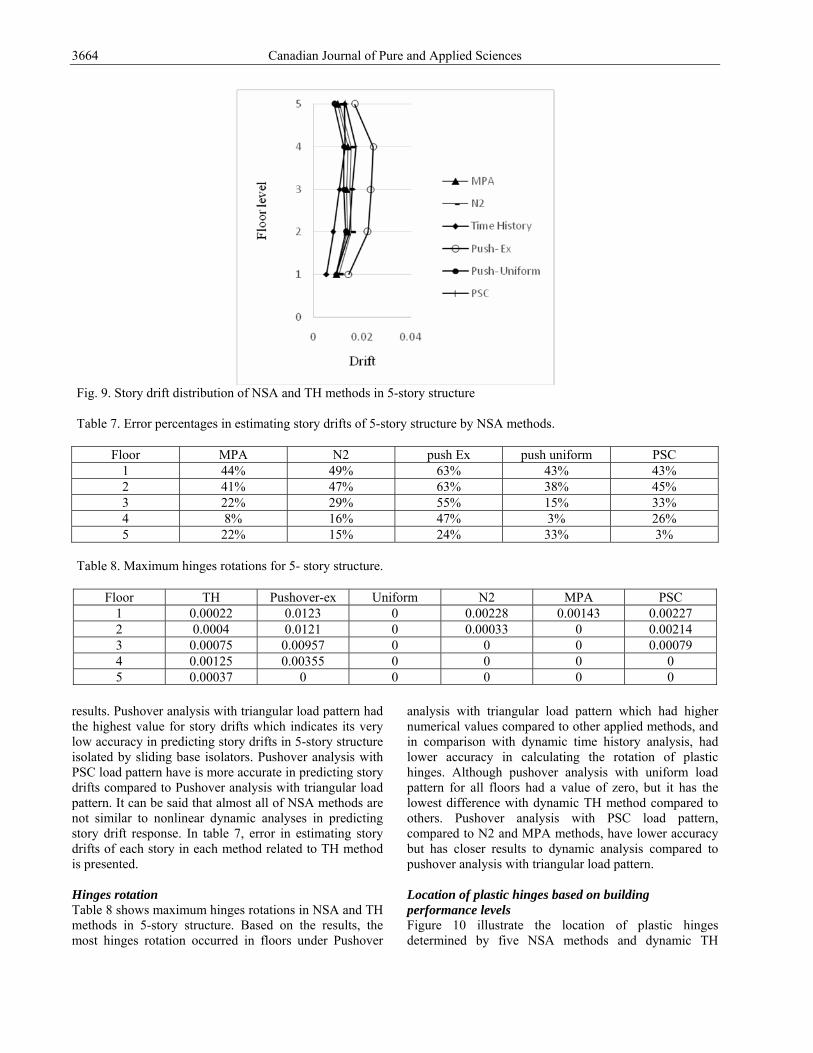
shear forces. Table 5 shows the errors of each method in the estimation of story shears relating to TH method. Floor displacement As shown in figure 8, the values for pushover analysis with triangular load pattern is greater than other NSA methods. In first and second floors, values of all methods are close to each other, but in higher levels, there are more differences where pushover analysis with uniform load pattern is closer to dynamic TH method; therefore, it can be said that he accuracy of NSA methods in
predicting floor displacements in higher floor levels declines, and pushover analysis with uniform load pattern have more accuracy compared to other NSA methods. Errors of each method for estimating floor displacements of each story related to TH method are shown in table 6. Story drift Figure 9 depicts Story drift distribution obtained from 5 NSA methods and dynamic TH method in 5-story structure. As can be seen, three methods of N2, MPA, and pushover analysis with uniform load pattern have similar
Table 5. Error percentage in estimating story shear of 5-story structure by NSA methods.
Floor MPA N2 push Ex push uniform PSC Base 10% 8% 9% 22% 8%
1 8% 10% 4% 14% 13% 2 23% 24% 2% 31% 19% 3 37% 39% 13% 46% 28% 4 52% 53% 27% 60% 40% 5 65% 65% 44% 71% 53%
Fig. 8. Floor displacement distribution of NSA and TH methods in 5-story structure.
Table 6. Error percentage in estimating floor displacement of 5-story structure by NSA methods.
Floor MPA N2 push Ex push uniform PSC Base 2% 3% 1% 0 0
1 6% 9% 9% 5% 5% 2 11% 15% 18% 9% 10% 3 14% 18% 25% 12% 15% 4 17% 21% 30% 14% 19% 5 16% 20% 31% 13% 19%
Canadian Journal of Pure and Applied Sciences
3664
results. Pushover analysis with triangular load pattern had the highest value for story drifts which indicates its very low accuracy in predicting story drifts in 5-story structure isolated by sliding base isolators. Pushover analysis with PSC load pattern have is more accurate in predicting story drifts compared to Pushover analysis with triangular load pattern. It can be said that almost all of NSA methods are not similar to nonlinear dynamic analyses in predicting story drift response. In table 7, error in estimating story drifts of each story in each method related to TH method is presented. Hinges rotation Table 8 shows maximum hinges rotations in NSA and TH methods in 5-story structure. Based on the results, the most hinges rotation occurred in floors under Pushover
analysis with triangular load pattern which had higher numerical values compared to other applied methods, and in comparison with dynamic time history analysis, had lower accuracy in calculating the rotation of plastic hinges. Although pushover analysis with uniform load pattern for all floors had a value of zero, but it has the lowest difference with dynamic TH method compared to others. Pushover analysis with PSC load pattern, compared to N2 and MPA methods, have lower accuracy but has closer results to dynamic analysis compared to pushover analysis with triangular load pattern. Location of plastic hinges based on building performance levels Figure 10 illustrate the location of plastic hinges determined by five NSA methods and dynamic TH
Fig. 9. Story drift distribution of NSA and TH methods in 5-story structure
Table 7. Error percentages in estimating story drifts of 5-story structure by NSA methods.
Floor MPA N2 push Ex push uniform PSC 1 44% 49% 63% 43% 43% 2 41% 47% 63% 38% 45% 3 22% 29% 55% 15% 33% 4 8% 16% 47% 3% 26% 5 22% 15% 24% 33% 3%
Table 8. Maximum hinges rotations for 5- story structure.
Floor TH Pushover-ex Uniform N2 MPA PSC 1 0.00022 0.0123 0 0.00228 0.00143 0.00227 2 0.0004 0.0121 0 0.00033 0 0.00214 3 0.00075 0.00957 0 0 0 0.00079 4 0.00125 0.00355 0 0 0 0 5 0.00037 0 0 0 0 0

Yeganehfar and Mehrparvar
3665
method based on building performance levels: Operational (1-A),Immediate Occupancy (1-B), Life
Safety (3-C), and Collapse Prevention (5-E).
Fig. 10. Locations of plastic hinges determined by studied methods in 5-story structure.
Canadian Journal of Pure and Applied Sciences
3666
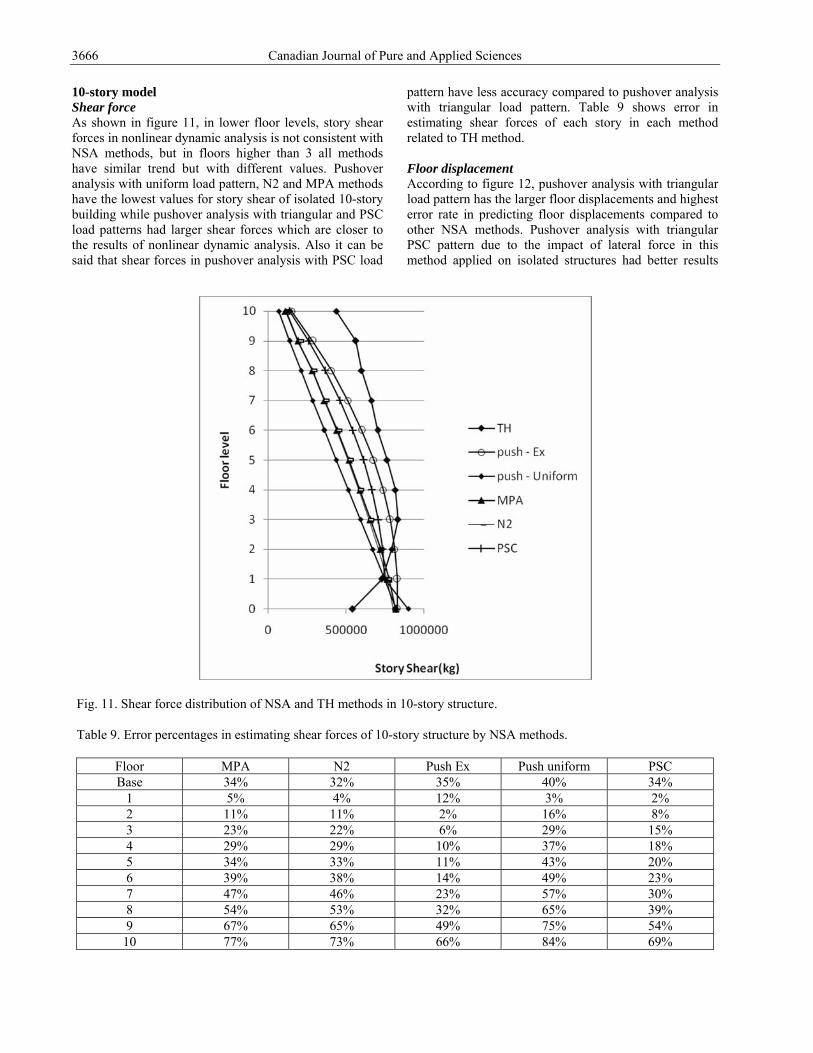
10-story model Shear force As shown in figure 11, in lower floor levels, story shear forces in nonlinear dynamic analysis is not consistent with NSA methods, but in floors higher than 3 all methods have similar trend but with different values. Pushover analysis with uniform load pattern, N2 and MPA methods have the lowest values for story shear of isolated 10-story building while pushover analysis with triangular and PSC load patterns had larger shear forces which are closer to the results of nonlinear dynamic analysis. Also it can be said that shear forces in pushover analysis with PSC load
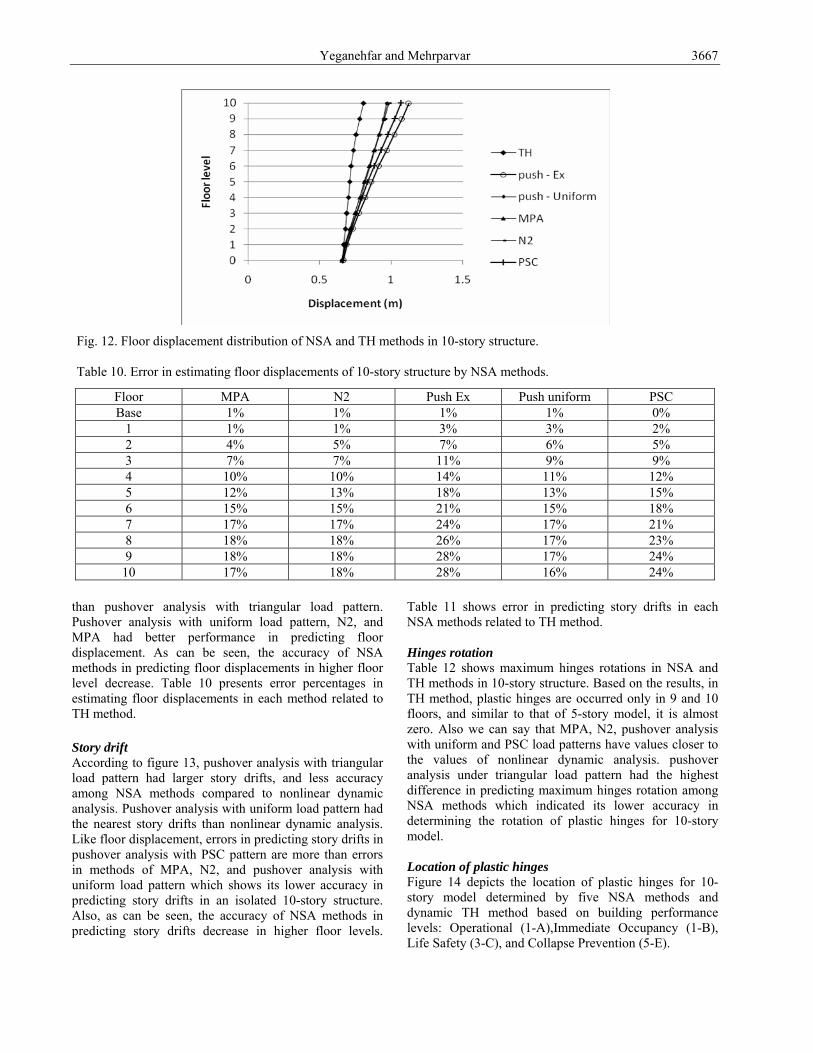
pattern have less accuracy compared to pushover analysis with triangular load pattern. Table 9 shows error in estimating shear forces of each story in each method related to TH method. Floor displacement According to figure 12, pushover analysis with triangular load pattern has the larger floor displacements and highest error rate in predicting floor displacements compared to other NSA methods. Pushover analysis with triangular PSC pattern due to the impact of lateral force in this method applied on isolated structures had better results
Fig. 11. Shear force distribution of NSA and TH methods in 10-story structure.
Table 9. Error percentages in estimating shear forces of 10-story structure by NSA methods.
Floor MPA N2 Push Ex Push uniform PSC Base 34% 32% 35% 40% 34%
1 5% 4% 12% 3% 2% 2 11% 11% 2% 16% 8% 3 23% 22% 6% 29% 15% 4 29% 29% 10% 37% 18% 5 34% 33% 11% 43% 20% 6 39% 38% 14% 49% 23% 7 47% 46% 23% 57% 30% 8 54% 53% 32% 65% 39% 9 67% 65% 49% 75% 54%
10 77% 73% 66% 84% 69%
Yeganehfar and Mehrparvar
3667
than pushover analysis with triangular load pattern. Pushover analysis with uniform load pattern, N2, and MPA had better performance in predicting floor displacement. As can be seen, the accuracy of NSA methods in predicting floor displacements in higher floor level decrease. Table 10 presents error percentages in estimating floor displacements in each method related to TH method. Story drift According to figure 13, pushover analysis with triangular load pattern had larger story drifts, and less accuracy among NSA methods compared to nonlinear dynamic analysis. Pushover analysis with uniform load pattern had the nearest story drifts than nonlinear dynamic analysis. Like floor displacement, errors in predicting story drifts in pushover analysis with PSC pattern are more than errors in methods of MPA, N2, and pushover analysis with uniform load pattern which shows its lower accuracy in predicting story drifts in an isolated 10-story structure. Also, as can be seen, the accuracy of NSA methods in predicting story drifts decrease in higher floor levels.
Table 11 shows error in predicting story drifts in each NSA methods related to TH method.
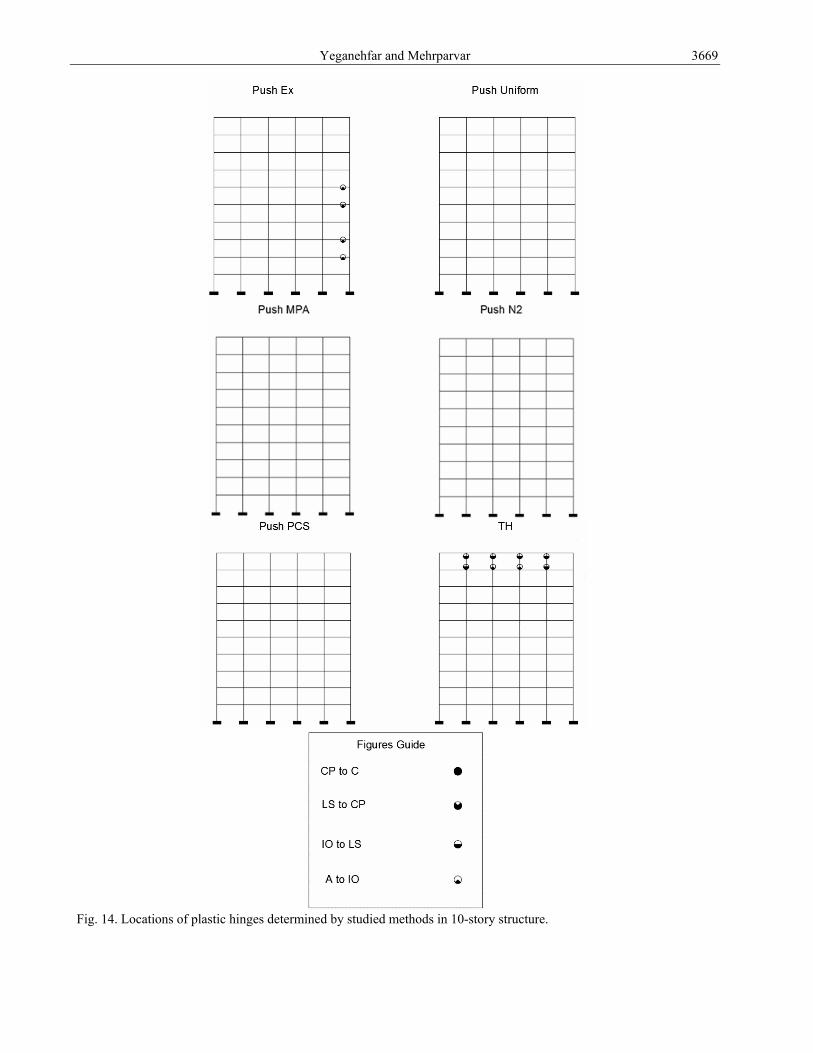
Hinges rotation Table 12 shows maximum hinges rotations in NSA and TH methods in 10-story structure. Based on the results, in TH method, plastic hinges are occurred only in 9 and 10 floors, and similar to that of 5-story model, it is almost zero. Also we can say that MPA, N2, pushover analysis with uniform and PSC load patterns have values closer to the values of nonlinear dynamic analysis. pushover analysis under triangular load pattern had the highest difference in predicting maximum hinges rotation among NSA methods which indicated its lower accuracy in determining the rotation of plastic hinges for 10-story model. Location of plastic hinges Figure 14 depicts the location of plastic hinges for 10-story model determined by five NSA methods and dynamic TH method based on building performance levels: Operational (1-A),Immediate Occupancy (1-B), Life Safety (3-C), and Collapse Prevention (5-E).
Fig. 12. Floor displacement distribution of NSA and TH methods in 10-story structure. Table 10. Error in estimating floor displacements of 10-story structure by NSA methods.
Floor MPA N2 Push Ex Push uniform PSC Base 1% 1% 1% 1% 0%
1 1% 1% 3% 3% 2% 2 4% 5% 7% 6% 5% 3 7% 7% 11% 9% 9% 4 10% 10% 14% 11% 12% 5 12% 13% 18% 13% 15% 6 15% 15% 21% 15% 18% 7 17% 17% 24% 17% 21% 8 18% 18% 26% 17% 23% 9 18% 18% 28% 17% 24%
10 17% 18% 28% 16% 24%

Canadian Journal of Pure and Applied Sciences
3668
Fig. 13. Story drifts distribution of NSA and TH methods in 10-story structure. Table 11. Error in estimating story drifts of 10-story structure by NSA methods.
Floor MPA N2 Push Ex Push uniform PSC 1 62% 62% 66% 64% 62% 2 71% 62% 68% 63% 64% 3 62% 62% 70% 62% 66% 4 61% 61% 70% 60% 67% 5 56% 56% 68% 53% 64% 6 48% 49% 64% 44% 60% 7 45% 46% 64% 39% 60% 8 37% 38% 60% 28% 55% 9 17% 20% 49% 3% 44%
10 20% 15% 29% 31% 21% Table 12. Maximum hinges rotations for 10- story structure.
Floor TH Pushover-ex Uniform N2 MPA PSC 1 0 0 0 0 0 0 2 0 0.00085 0 0 0 0 3 0 0.00032 0 0 0 0 4 0 0 0 0 0 0 5 0 0.00096 0 0 0 0 6 0 0 0 0 0 0 7 0 0 0 0 0 0 8 0 0 0 0 0 0 9 0.0007 0 0 0 0 0
10 0.00693 0 0 0 0 0
Yeganehfar and Mehrparvar
3669
Fig. 14. Locations of plastic hinges determined by studied methods in 10-story structure.

Canadian Journal of Pure and Applied Sciences
3670
CONCLUSION In this study we attempted to compare nonlinear static analysis methods including pushover analysis with triangular, uniform, and PSC load patterns, modal pushover analysis (MPA), and N2 method in predicting the seismic response of structures isolated by FPS base isolators. The studied structures were 5 and 10-story buildings in LA, US. Nonlinear dynamic time history analysis was applied as a criterion for the accuracy level of five studied methods. According the force and displacement distributions plotted for each method in 5 and 10-story models, we concluded that: The most accurate methods in predicting the story shears were pushover analysis with triangular and PSC load pattern, and in predicting floor displacements and story drifts, the most accurate methods were pushover analysis with uniform load pattern, MPA and N2 methods. According to the results of maximum hinges rotation, pushover analysis with triangular load pattern had the highest error compared to other NSA methods. Since the maximum hinges rotation determined by nonlinear static and dynamic methods are insignificant, we can realize the effect of base isolators on structures in reducing seismic demand. In determining the location of plastic hinges based on performance levels, all NSA methods had good accuracy. On average, we can say that N2 and MPA methods have better performance than other methods in predicting the seismic response of structures isolated by sliding base isolators where N2 is more accurate than MPA. REFERENCES Baker, J., Horne, MR. and Heyman, J. 1956. The Steel Skeleton; Plastic Behaviour and Design. (vol. 2). Cambridge University Press, Cambridge. Bracci, JM., Kunnath, SK. and Reinhorn, AM. 1997. Seismic Performance and Retrofit Evaluation of Reinforced Concrete Structures. Journal of Structural Engineering- ASCE. 123(1):3-10. Chopra, AK. and Goel, RK. 2002. A Modal Pushover Analysis Procedure for Estimating Seismic Demands for Buildings. Earthquake Engineering and Structural Dynamics. 31(3):561-582. Chen, WF. and Scawthorn, C. 2003. Earthquake Engineering Handbook. CRC Press. Boca Raton, FL., USA. Eberhard, MO. and Sozwn, MA. 1993. Behavior-Based Method to Determine Design Shear in Earthquake-Resistant Walls. Journal of Structural Division. 119 (2):619-640.
Fajfar, P. 1999. Capacity Spectrum Method Based On Inelastic Demand Spectra. Earthquake Engineering and Structural Dynamics. 28:979-993. Fajfar, P. 2000. A Nonlinear Analysis Method For Performance Based Seismic Design. Earthquake Spectra. 16(3):573-592. Fajfar, P. and Fishinger, M. 1988. N2- A Method For Nonlinear Seismic Analysis of Regular Structures. In: Pro. of 9th World Conference on Earthquake Engineering, Tokyo-Kyoto, Japan. 111-116. FEMA-356. 2000. Pre-Standard and Commentary for the Seismic Rehabilitation of Buildings. Federal Emergency Management Agency, Washington, DC, USA. Fragiadakis, M., Vamvatsikos, D. and Aschheim, M. 2014. Application of Nonlinear Static Procedures for Seismic Assessment of Regular RC Moment Frame Buildings. Earthquake Spectra. 30(2):767-794. Freeman, SA., Nicoletti, JP. and Tyrell, JV. 1975. Evaluations of Existing Buildings for Seismic Risk - A Case Study of Puget Sound Naval Shipyard, Bremerton, Washington. In: Proc of US National Conference on Earthquake Engineering, Berkeley, USA. 113-122. Gulkan, P. and Sozen, MA. 1974. Inelastic Response of Reinforced Concrete Structures to Earthquake Motions. ACI Journal. 71(2):604-610. Kilar, V. and Koren, D. 2008. Usage of Simplified N2 Method for Analysis of Base Isolated Structures. In: Proc of The 14th World Conference on Earthquake Engineering (14WCEE), Beijing, China. Kilar, V. and Koren, D. 2009. Simplified Inelastic Seismic Analysis of Base‐Isolated Structures Using theN2 Method. Earthquake Engineering and Structural Dynamics. 39(9):967-989. Kilar, V. and Koren, D. 2011. Usability of Pushover Analysis for Asymmetric Base isolated Buildings. 3rd
ECCOMAS Thematic Conference on Computational Methods in Structural Dynamics and Earthquake Engineering. Corfu, Greece. 3349-3357. Krishnamoorty, A. and Saumil, P. 2005. In-Plane Response of a Symmetric Space Frame with Sliding Supports. International Journal of Applied Science and Engineering. 3(1):1-11. Lew, HS. and Kunnath, SK. 2001. Evaluation of Nonlinear Static Procedures for Seismic Design of Buildings. In: 33rd Joint Meeting of the UJNR Panel on Wind and Seismic Effects. Tsukuba, Japan. 43-70. Miranda, E. and Bertero, VV. 1994. Evaluation of the Strength Reduction Factors for Earthquake Resistant Design. Earthquake Spectra. 10:357-379. Naeim, F. and Kelly, JM. 1999. Design of Seismic Isolated Structures: From Theory of Practice. John Wiley and Sons Ltd., New York, USA.

Yeganehfar and Mehrparvar
3671
Ozdemir, GC. and Constantinou, M. 2010. Evaluation of Equivalent Lateral Force Procedure In Estimating Seismic Isolator Displacements. Soil Dynamics and Earthquake Engineering. 30:1036-1042. Providakis, CP. 2008. Pushover Analysis of Base-Isolated Steel–Concrete Composite Structures Under Near-Fault Excitations. Soil Dynamics and Earthquake Engineering. 28(4):293-304. Structural Engineers Association of Northern California (SEAONC). 1986. Tentative Seismic Isolation Design Requirements. San Francisco, SEAONC, CA, USA. Saiidi, M. and Sozen, MA. 1981. Simple Nonlinear Seismic Analysis of R/C Structures. Journal of Structural Division, ASCE. 107:937-952. Tso, WK. and Moghadam, AS. 1997. Seismic Response of Asymmetric Buildings Using Pushover Analysis. Proceedings Workshop on Seismic Design Methodologies for the Next Generation of Codes, Bled, Slovenia, Rotterdam, Balkema.
Received: July 22, 2015; Accepted: Sept 12, 2015