comparing crime rates between undocumented immigrants
TRANSCRIPT

Comparing crime rates between undocumentedimmigrants, legal immigrants, and native-born UScitizens in TexasMichael T. Lighta,1, Jingying Hea,2, and Jason P. Robeya,2
aDepartment of Sociology, University of Wisconsin–Madison, Madison, WI 53705
Edited by Douglas S. Massey, Princeton University, Princeton, NJ, and approved October 5, 2020 (received for review July 13, 2020)
We make use of uniquely comprehensive arrest data from theTexas Department of Public Safety to compare the criminality ofundocumented immigrants to legal immigrants and native-bornUS citizens between 2012 and 2018. We find that undocumentedimmigrants have substantially lower crime rates than native-borncitizens and legal immigrants across a range of felony offenses.Relative to undocumented immigrants, US-born citizens are over2 times more likely to be arrested for violent crimes, 2.5 timesmore likely to be arrested for drug crimes, and over 4 times morelikely to be arrested for property crimes. In addition, the propor-tion of arrests involving undocumented immigrants in Texas wasrelatively stable or decreasing over this period. The differencesbetween US-born citizens and undocumented immigrants are ro-bust to using alternative estimates of the broader undocumentedpopulation, alternate classifications of those counted as “undocu-mented” at arrest and substituting misdemeanors or convictionsas measures of crime.
undocumented immigration | crime | violence
The tripling of the undocumented population in recent de-cades is one of the most consequential and controversial
social trends in the United States (1). Backlash regarding thecriminality of undocumented immigrants is at the fore of thiscontroversy and has led to immigration reforms and public pol-icies intended to reduce the crimes associated with undocu-mented immigration (2). As recently as June of 2020, the debateon undocumented criminality made its way to the US SupremeCourt, where the US solicitor general sought to invalidate Cal-ifornia’s “sanctuary” policies because “[w]hen officers are unableto arrest aliens—often criminal aliens—who are in removalproceedings or have been ordered removed from the UnitedStates, those aliens instead return to the community, wherecriminal aliens are disproportionately likely to commit crimes”(3, p. 13).Indeed, concerns over illegal immigration have arguably been
the government’s chief criminal law enforcement priority foryears, to the point where the federal government now spendsmore on immigration enforcement than all other principlecriminal law enforcement agencies combined (4, 5). These pol-icies, practices, and pronouncements, however, have far out-paced our empirical understanding of undocumented criminality.That is, while research suggests that immigrants generally tend tobe less crime prone than their native peers (6), we still lack basicinformation on fundamental questions specific to undocumentedimmigrants and crime. How does the criminality of undocu-mented immigrants compare to legal immigrants or native-borncitizens? Does this differ by the type offense, such as property,violent, or drug crimes? And how has undocumented immigrantcriminality changed over time?Each of these questions represents remarkable gaps in our
scientific and policy understanding of undocumented immigra-tion. This dearth is largely due to data limitations. Calculatinggroup-specific crime rates is straightforward: It is the number of
arrests within a particular group divided by its population(expressed per 100,000). In the case of undocumented immi-grants, however, for years we lacked reliable estimates for boththe numerator and the denominator required for such calcula-tions. Regarding the number of undocumented immigrants (thedenominator), data quality has improved in recent years as theCenter for Migration Studies and the Pew Research Center nowproduce annual state- and national-level estimates of the un-documented population, ranging from 10.5 to 10.7 million in2017 (1, 7).* Data on undocumented criminality (the numera-tor), however, have actually gotten worse over time. Despite theincreasing centrality of local police in immigration enforcement(9), information on immigration status is remarkably scarce inmost crime databases. Among the most widely utilized crimedata sources, neither the Uniform Crime Reports, the NationalCrime Victimization Survey, nor the National Incident-BasedReporting System record information about immigration sta-tus. In addition, California stopped reporting the number ofnoncitizens in their custody to the Bureau of Justice Statistics(BJS) in 2013 and in 2017 became a “sanctuary state” by limitinginformation sharing between local criminal justice officials andfederal immigration authorities (10). In 2016, they along withNevada, New Hampshire, North Dakota, and Oregon did not
Significance
Despite its centrality to public and political discourse, we lackeven basic information on fundamental questions regardingundocumented immigrants and crime. This stems largely fromdata constraints. Going beyond existing research, we utilizedata from the Texas Department of Public Safety, which checksand records the immigration status of all arrestees throughoutthe state. Contrary to public perception, we observe consider-ably lower felony arrest rates among undocumented immi-grants compared to legal immigrants and native-born UScitizens and find no evidence that undocumented criminalityhas increased in recent years. Our findings help us understandwhy the most aggressive immigrant removal programs havenot delivered on their crime reduction promises and are un-likely to do so in the future.
Author contributions: M.T.L. designed research; J.H. and J.P.R. analyzed data; and M.T.L.,J.H., and J.P.R. wrote the paper.
The authors declare no competing interest.
This article is a PNAS Direct Submission.
This open access article is distributed under Creative Commons Attribution-NonCommercial-NoDerivatives License 4.0 (CC BY-NC-ND).1To whom correspondence may be addressed. Email: [email protected]. and J.P.R. contributed equally to this work.
This article contains supporting information online at https://www.pnas.org/lookup/suppl/doi:10.1073/pnas.2014704117/-/DCSupplemental.
First published December 7, 2020.
*The Department of Homeland Security also produces estimates of the undocumentedimmigrant population, but these figures have not been updated since 2015 (8).
32340–32347 | PNAS | December 22, 2020 | vol. 117 | no. 51 www.pnas.org/cgi/doi/10.1073/pnas.2014704117
Dow
nloa
ded
by g
uest
on
Feb
ruar
y 2,
202
2

report information on citizenship in their prison populations,and the BJS speculates that other states “likely provided un-dercounts” (11, p. 13).This article is a notable exception to this trend in that, after
review for scientific merit, the Texas Department of PublicSafety (DPS) granted our research team access to case pro-cessing information for all arrests recorded between 2012 and2018. The DPS data are unique in that they fully cooperate withthe Department of Homeland Security (DHS) to check and re-cord the immigration status of all arrestees throughout the state,including their legal status (21). Using these data, we address theempirical shortcomings that have hampered prior work in thisarea by accomplishing three interrelated objectives.First, we offer a detailed contemporary assessment of the
comparative criminality between native-born US citizens, legalimmigrants, and undocumented immigrants. The limited infor-mation we do have about undocumented criminality is not onlyconspicuously scant but also highly inconsistent. A 2018 reportfrom the Cato Institute found that arrest and conviction rates forundocumented immigrants are lower than those of native-bornindividuals (12). Research by the Crime Prevention ResearchCenter in that same year, however, reached the exact oppositeconclusion (13). Neither of these studies was peer-reviewed, andthus, their data and methodologies have not been subject toscientific scrutiny. Given the salience of this research forinforming contemporary public and political dialogue, the timehas come for a thorough inquiry into the nexus betweenundocumented immigrants and crime.Second, going beyond general differences in crime, we calcu-
late comparative crime rates across multiple offense types. Thesedistinctions are essential for both theoretical and empiricalreasons. Though the evidence linking immigrants (generally) toviolent crime is markedly thin (14), there are compelling theo-retical reasons to think that undocumented immigrants may havedivergent effects on violent and nonviolent crime. Most notably,lacking legal status limits their legitimate economic opportuni-ties, and thus, undocumented immigrants may turn to illegiti-mate economic pursuits (15). From an empirical perspective, thefederal government’s increasing reliance on collaborations withstate and local law enforcement complicates the picture of im-migrant criminality because many immigrants held in local jailsare booked on federal immigration charges, not local criminalcharges. A focus on the overall rates of crime obscures thiscritical distinction.Last, we examine the overall and relative crime trends among
the undocumented. The fact that we currently cannot answerhow undocumented criminality has changed in recent years witheven a directional statement (increasing or decreasing) is highlyproblematic, particularly in light of the substantial enforcementinitiatives implemented under Presidents Obama and Trump todecrease the burden of immigrant crime (4, 5). Using visualplots, linear regressions, and time series techniques (augmentedDickey–Fuller [ADF] tests), we provide a longitudinal assess-ment of the relative involvement of undocumented immigrantsin crime.Foreshadowing our results, we find that undocumented im-
migrants have considerably lower crime rates than native-borncitizens and legal immigrants across a range of criminal offenses,including violent, property, drug, and traffic crimes. We alsoreport no evidence that undocumented criminality has becomemore prevalent in recent years across any crime category.
Materials and MethodsThe primary data source for this analysis is the Texas Computerized CriminalHistory (CCH) database provided by the Texas Department of Public Safety.The focus on Texas is warranted for several reasons. First, Texas has thesecond-largest immigrant population in the United States, with roughly 4.8million foreign-born individuals (∼17% of the population), of which an
estimated 1.6 million are undocumented (16). Second, Texas processes largenumbers of immigrants through their criminal justice system. In 2012, Texashad the third-highest number of reported noncitizens in their prison systems(17), and the DHS estimates that there were more noncitizens arrested inrecent years by local police in Texas than any other criminal justice system inthe United States, save California (18).‡ Third, Texas is a site of intensefederal immigration enforcement as evidenced by the fact that the federalgovernment paid more to house criminal aliens in local jails in Texas than allother states except New York and California (19).
Unlike the voluntary nature of the Uniform Crime Reports collected by theFBI, the CCH reporting system is statutorily mandated for every jurisdiction inthe state of Texas. By law, all arresting agencies in Texas must report in-formation to the DPS within 7 d of the arrest for all class B misdemeanors orgreater.§ The only arrests that are not required in the CCH data are misde-meanor class C offenses, which are ineligible for jail or prison sanctions inTexas and often handled with citations rather than arrests.
The requirements for the CCH data also specify that agencies must reportseveral key variables, including the criminal statute, the level of the offense(e.g., first-degree felony, second-degree felony, etc.), the date of arrest, thearresting agency, and demographic information for the individual. Criticalfor our purposes, the booking process mandates inquiries into an arrestee’splace of birth and citizenship, and the Texas Commission on Law Enforce-ment (TCOLE) requires training on conducting intake interviews to be a li-censed jailer in the state of Texas.{
The consequence of these strict training and reporting requirements is theextremely low rate of missingness in the dataset. According to the DPS, thecompliance rate for these CCH data from 2011 through 2015 was 96%, andcitizenship information ismissing in only 3%of felony arrests. In sum, the CCHdatabase contains case processing information for every jailable arrest in thestate of Texas, with detailed information on both the criminal conduct andthe arrested individuals.
One key variable missing from the CCH database is the individuals’ im-migration status, which requires the use of a second data source. In 2011, theTexas DPS started participating in the Secure Communities Program(S-COMM). As part of S-COMM, starting in June of 2011 the DPS sends thefingerprints of every arrested individual to the Department of HomelandSecurity’s Automated Biometric Identification System (IDENT) database,where Immigration and Customs Enforcement (ICE) determines their immi-gration status.# The DHS reports the immigration status back to the TexasDPS for all individuals with a known immigration status (reported as either“legal” or “illegal”). While the cross-referencing of criminal records with theIDENT database is common practice across state and local jurisdictions (20),the DPS is unique in that they retain the immigration status informationfrom the DHS in their records. We obtained this immigration status datasetfrom the Texas DPS as part of our request for the CCH database.
We combine data from the DHS on immigration status with the citizenshipand place of birth data in the CCH to record felony arrestees into one of thethree categories: 1) native-born US citizens, 2) legal immigrants, and 3) un-documented immigrants. Any individual deemed “illegal” by the DHS isconsidered to be an undocumented immigrant. Legal immigrants comprisethree groups: those identified as “legal” immigrants in the IDENT database,non-US citizens who were not designated “illegal,” and foreign-born UScitizens (i.e., naturalized citizens). We examine the crime patterns of
‡According to DHS’s Criminal Alien Population Projection Analysis, between 2011 and2014 there were an estimated 749,554 noncitizens arrested in California by local police,428,566 noncitizen arrests in Texas, and only 374,222 noncitizen arrests by the federalgovernment.
§A class B misdemeanor in Texas is punishable up to 180 d in county jail and a $2,000 fine.{Section 6.7.2 of the TCOLE “Basic County Corrections Course” and section 2.2.3 of theTCOLE “Basic Jail Certification Course for Sworn Texas Peace Officers” deal specificallywith the “processing of persons of foreign nationality.” The following relevant text isfound in both courses: 1) It is imperative that the determination of citizenship be on yourdepartment’s record. 2) Determine the defendant’s citizenship. This can be establishedby asking place of birth of the defendant, whether the defendant was born out of theUnited States, or whether the defendant has been naturalized under the Constitutionand laws of the United States. In the absence of other information to the contrary,assume this is the country on whose passport or other travel document the foreignnational travels.
#S-COMM was suspended in November 2014 and replaced by the Priority EnforcementProgram. S-COMM was since reactivated in January 2017 by an executive order fromPresident Trump to “ensure the public safety of the American people in communitiesacross the United States.” Critical for our purposes, these program changes did not affectthe collection of information on immigration status for the Texas Department ofPublic Safety.
Light et al. PNAS | December 22, 2020 | vol. 117 | no. 51 | 32341
SOCIALSC
IENCE
S
Dow
nloa
ded
by g
uest
on
Feb
ruar
y 2,
202
2

naturalized citizens separately in SI Appendix, section VII. Our coding of thelegal immigrant population merits attention. Prior work examining thedifferences between legal and undocumented immigrants in Texas reliedsolely on the DHS information to determine legal status (12). However, theDHS variable is incomplete because many legal noncitizen and foreign-bornarrestees are not recorded in the IDENT database. In 2018, for example,there were nearly 60,000 legal immigrant arrests in the CCH data based onour coding, compared to about 37,000 legal immigrant arrests when usingonly the DHS data. Thus, the exclusive reliance on the DHS information inNowrasteh’s (12) report almost certainly undercounted the number of legalimmigrant arrests and misclassified many legal immigrants as “native born.”In our analysis, the category of native-born citizens comprises all individualswho were born in the United States, are US citizens, and are not recorded asa “legal” or “illegal” immigrant by the DHS. We return to this issue ofmisclassification in the IDENT database in Sensitivity Analyses.
To our knowledge, Texas is the only state that requires the determinationand documentation of immigration status as part of its standard criminaljustice records practice. Combined with the fact that we have complete in-formation for every jailable arrest in Texas, our dataset is ideal for comparingthe criminality between undocumented immigrants, legal immigrants, andnative-born citizens. Simply put, no other data source in the United Statescould accomplish this task with the same degree of breadth, rigor,and detail.
Our crime rate analysis focuses on all felonies in the years 2012 to 2018 (ananalysis of misdemeanors is shown SI Appendix, section VI); 2012 was the firstfull year immigration information was recorded by the DPS, and the mostcurrent estimates of the undocumented population are from 2018. In cal-culating the number of crimes, we count each arrest charge as a separatecrime incident, which is common practice in the calculation of crime rates(often referred to as incident-based reporting). Most arrests in Texas (83%)have only one arrest charge. To ensure consistency with published reports,we report offense categories using the same arrest offense codes as thosereported by the DPS (21). Given the relevance of both status offenses andincome-generating crimes for our inquiry, we also supplement the DPScoding by further examining drug and traffic offenses. Detailed descriptionsfor all offense categories are shown in SI Appendix, section I.
It is important to note how we dealt with the nexus between state andfederal authorities. More than 39,000 individuals in the CCH data werebooked for “federal offenses,” the majority of whom (70%) were undocu-mented immigrants.|| Based on conversations with local authorities, we de-termined that these individuals were temporarily held in local facilities forvarious federal agencies, including ICE, the Bureau of Prisons, and the USMarshalls. Because these individuals are not held on local criminal charges,but rather as an administrative accounting for local jails, we exclude themfrom our analysis.
Our population data come from two sources. Annual information on thetotal population, the population of US-born citizens, the foreign-bornpopulation, and the number of naturalized citizens in Texas come fromthe US Census Bureau’s American Community Survey (ACS) 1-y estimates.Estimates of the undocumented population come from the Center for Mi-gration Studies (CMS), one of the most reliable, respected, and peer-reviewed sources on the undocumented immigrant population (22, 23).Stated briefly, the CMS uses a residual methodology based on Census Bureaudata, whereby the number of authorized immigrants is subtracted from theforeign-born population. The remainder, or residual, is then the estimatednumber of potentially undocumented immigrants. Several features of theCMS estimates are noteworthy. First, the CMS applies logical edits whencalculating residuals (22) that serve as tools to identify as many legal resi-dents as possible. These edits are derived from survey responses that areunlikely to apply to someone who is undocumented, such as occupationsthat require legal status or those that receive public benefits restricted tolegal residents. Second, the CMS adjusts for factors that influence yearlyfluctuations in the immigrant population such as emigration and mortalityand calculates independent population controls by country of origin (22, p.308). This is important because the percentage of undocumented immi-grants among the foreign-born population can vary considerably based onnational origin. Third, utilizing the population controls from step 2, finalselections are made of individual respondents to be classified as undocu-mented. Last, these estimates are adjusted for underenumeration, wherebythe undercount rate decreases with length of residence (i.e., the most recent
entrants are assumed to have the highest undercount rates) (22, 23). Thesedata serve as the undocumented denominator for the main analysis. In linewith previous research, the legal immigrant population is calculated as thetotal foreign-born population minus the undocumented population (24).
All data and replication materials for this analysis are available onopenICPSR (https://www.openicpsr.org/openicpsr/project/124923/version/V1/view).
ResultsExamining Crime Rates. We begin by presenting aggregate crimerates from 2012 to 2018. Fig. 1 presents violent, property, drug,and traffic arrest rates of native-born citizens, legal immigrants,and undocumented immigrants. The consistency of the com-parative rates is notable. Relative to native-born citizens andlegal immigrants, undocumented immigrants have the lowestfelony arrest rates across all four crime types. For violent,property, and drug offenses, legal immigrants occupy a middleposition between undocumented immigrants and US-born citi-zens. The gaps between native-born citizens and undocumentedimmigrants are substantial: US-born citizens are over 2 timesmore likely to be arrested for violent crimes, 2.5 times morelikely to be arrested for drug crimes, and over 4 times more likelyto be arrested for property crimes. These latter two findings arenoteworthy. Previous research suggests that immigrants withmarginal economic prospects are more heavily involved inproperty crime (25–27), and it is plausible that drug markets mayoffer undocumented immigrants opportunities denied in the le-gitimate labor market. However, we find no evidence that un-documented immigrants are more heavily involved in property or
Fig. 1. Felony arrest rates, Texas (2012 to 2018).
jjThe literal disposition code for these offenses is “Transferred for Federal Prosecution.”Legal immigrants accounted for an additional 22% of these offenses. Only 9% of indi-viduals booked on “federal offenses” were native citizens.
32342 | www.pnas.org/cgi/doi/10.1073/pnas.2014704117 Light et al.
Dow
nloa
ded
by g
uest
on
Feb
ruar
y 2,
202
2

drug offenses in Texas. It is possible, however, that these crimecategories may paint with too broad a brush and the picture ofundocumented criminality may look different when examiningspecific criminal offenses. We thus turn to our more detailedoffense categories in Fig. 2.Fig. 2 shows the rates for homicide, assault, robbery, sexual as-
sault, burglary, theft, and arson. Without exception, undocumentedimmigrants have the lowest crime rates. Compared to native-borncitizens, undocumented immigrants are roughly half as likely to bearrested for homicide, felonious assault, and sexual assault. Thegaps for robbery, burglary, theft, and arson are considerably larger,whereby native-born citizens are between 3 and 5 times more likelyto be arrested for these criminal offenses. For most crimes, thecriminality of legal immigrants tends to be less than that of native-born citizens. The exceptions to this pattern are homicide, wherethe rates are roughly equal, and sexual assault, where arrest rates forlegal immigrants are considerably higher.If a snapshot of undocumented criminality is scant, evidence
on undocumented crime trends is virtually nonexistent. Fig. 3shows the trends in felony arrest rates for each group (arrestcounts for each group are shown in SI Appendix, section I). Twopatterns are noteworthy. First, in line with the aggregate crimerates, we observe the same relative pattern in felony arrests overtime. That is, native-born citizens tend to have the highest rates,undocumented immigrants have the lowest, and legal immigrantsare in between. In general terms, the felony arrest rates were∼1,000 per 100,000 among US-born citizens, 800 per 100,000
among legal immigrants, and 400 per 100,000 among undocu-mented immigrants. Second, the comparative gaps betweennative-born citizens and immigrants have widened slightly overtime due to small increases among US-born citizens and relativestability among legal and undocumented immigrants.The patterns for violent felonies shown in Fig. 4 are remark-
ably similar. Compared to native-born citizens, legal immigrantsand, especially, undocumented immigrants have lower rates ofviolent crime, and the relative gaps between immigrants and US-born citizens have increased modestly. The trends for propertycrime observed in Fig. 5 are slightly different. While the relativeposition of each group is the same for property crime (e.g., legaland undocumented immigrants have lower rates), the gaps be-tween groups have shrunk somewhat as a result of larger abso-lute decreases in property crime among US-born citizens. Thetrends for more detailed felony classifications are shown in SIAppendix, section II and Figs. S1 and S12.Felony drug crimes are of particular interest given the focus in
public discourse and prior scholarly work on the potential rela-tionship between immigration and drug crimes (15). However, ouranalysis in Fig. 6 shows that the felony drug rate for undocumentedimmigrants is less than a half of the drug rate for US-born citizens.Moreover, during this time period the felony drug rate for undoc-umented immigrants appears stable, whereas the rate for US-borncitizens increases nearly 30%. Thus, not only do undocumentedimmigrants have substantially lower felony drug rates, but theirrelative contribution to drug crime rate appears to be decreasing.The same general trends are true of legal immigrants, who had aslightly lower rate of felony drug arrests in 2012 compared to US-born citizens. By 2018, however, this gap increased substantially dueto the increase in drug crime among native-born citizens.The last crime category we explore is felony traffic arrests, which
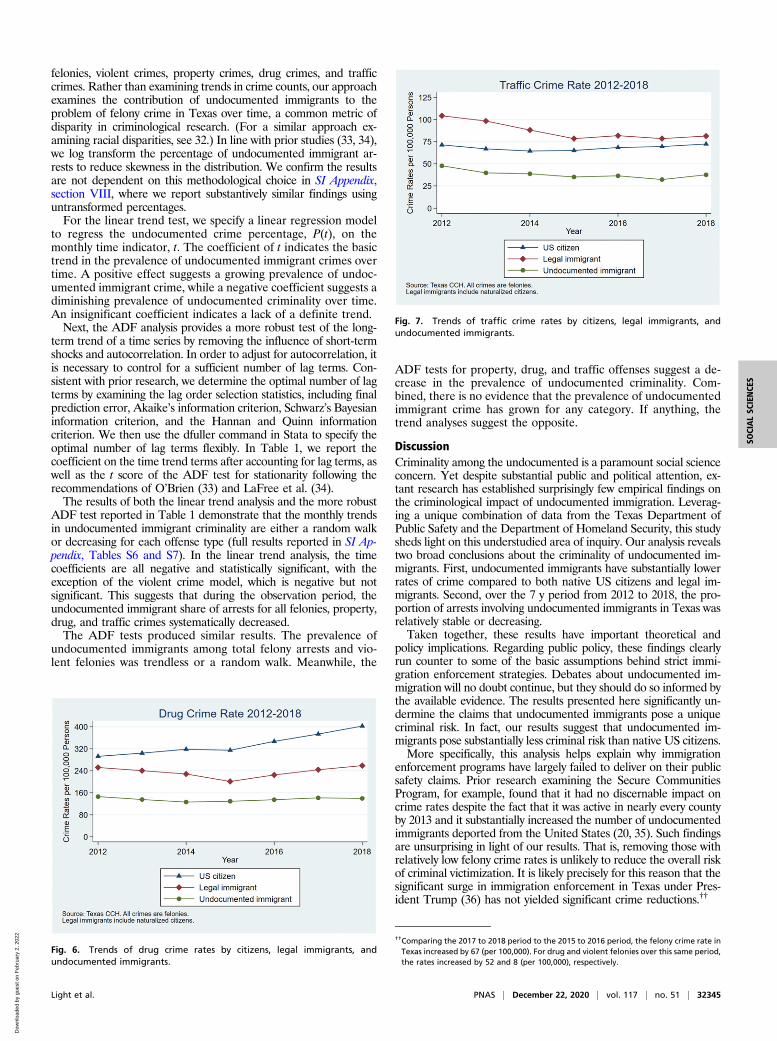
includes crimes such as driving while intoxicated, fleeing an accidentinvolving an injury, and undocumented use of a vehicle. It is worthnoting that these figures do not include the lesser traffic offensesthat are more prevalent for undocumented immigrants, such asdriving without a license. The analysis demonstrates, as with otherareas of crime, undocumented immigrants have substantially lowerrates compared to US-born citizens. Fig. 7 shows that the felonytraffic rates dropped for both undocumented immigrants and nativecitizens, while the rate for legal immigrants remained relativelystable from 2012 to 2018. The gap between legal immigrants andUS-born citizens decreased over this period, whereas the gap be-tween undocumented immigrants and citizens is relatively constantover time.
Fig. 2. Felony arrest rates by detailed measures of violent and propertycrime, Texas (2012 to 2018).
Fig. 3. Trends of total felony crime rates by citizens, legal immigrants, andundocumented immigrants.
Light et al. PNAS | December 22, 2020 | vol. 117 | no. 51 | 32343
SOCIALSC
IENCE
S
Dow
nloa
ded
by g
uest
on
Feb
ruar
y 2,
202
2

Sensitivity Analyses. Given the legitimate concerns regarding theaccuracy of the estimated size of the undocumented population,we undertake several additional sensitivity analyses. First, toensure our findings are not dependent on idiosyncrasies in theCMS estimation technique, we replicate our results in SI Ap-pendix, section III (SI Appendix, Figs. S13 and S14) using un-documented figures derived from the Pew Research Center. Theresults using this alternative data source are substantively un-changed. It bears mentioning, however, that both the Pew and CMSuse variants of the residual methodology. Although independentresearch using multiple methods of triangulation, including deathand birth records, have substantiated the general accuracy of theresidual methodology (28, 29), it is not without critics.A particular concern for our analysis would be if the Pew and
CMS overestimate the size of the undocumented population be-cause an inflated denominator would artificially decrease the ob-served crime rates. To examine this potential source of bias, wegauge the extent to which the undocumented population wouldhave to be reduced to change our findings. By our calculations, inorder to reach parity with US-born citizens for violent crimes, theactual undocumented population would have to be less than half(45%) the current estimate in Texas. To reach parity for propertycrimes, it would have to a quarter (23%) of the current estimate.In our assessment, these are highly implausible scenarios given
that extant research suggests that, if anything, the CMS and Pewproduce undercounts. In 2015, for instance, the Department ofHomeland Security’s estimate of the undocumented population washigher than the Pew and CMS by nearly 1 million, partially due todifferent assumptions regarding the degree of undercount in theACS (8). Recent research by Fazel-Zarandi et al. (30) suggests eachof these estimates is too low. They estimated the size of the un-documented population in 2016 to be more than double the CMSand Pew estimates, at 22.1 million. In sum, the available evidencesuggests that if our estimates of the undocumented population arebiased, they are biased in the direction of undercounting this pop-ulation. In the presence of such bias, the undocumented crime ratesreported in this article would represent substantial overestimates ofthe true scale of undocumented criminality.There is also the issue of misclassification in the IDENT da-
tabase. While the combination of CCH and DHS data substan-tially improves our picture of undocumented criminality, theintegrity of the IDENT database warrants discussion. InGonzalez v.ICE (31), the Central District of California ruled in 2019 that ICEcould not issue detainers based solely on electronic databases
(including IDENT) due to misclassification errors. The implicationsof such errors are important to consider. To the extent that UScitizens and legal immigrants are incorrectly classified as undocu-mented, our analysis would overestimate the arrest rates for un-documented immigrants. In other words, the gap between native-born US citizens and undocumented immigrants would actually belarger than reported here. However, given the concerns regardingundocumented criminality, it is also important to consider thepossibility that many undocumented immigrants were not flagged bythe IDENT system. In this scenario, our coding may misclassifysome undocumented immigrants as legal immigrants. We examinethe most extreme interpretation of this possibility by recalculatingthe crime rates assuming that all noncitizens who were not explicitlydesignated as “legal” by the DHS are undocumented. In this sce-nario, the crime rates for “undocumented immigrants” by definitionincrease, but they never reach parity with US-born citizens in vio-lent, property, or drug offenses.**Last, it is important to note that arrest rates represent only
one metric of criminality, and our results could be influenced bydifferential policing behavior. For example, the increasing reli-ance on local criminal justice officials to funnel immigrants tofederal immigration authorities (9) may alter arrest statistics inways that do not actually track shifts in underlying criminality.We thus repeat our main analysis in the SI Appendix, section IVusing conviction rates, rather than arrest rates. Without excep-tion, the core findings replicate using this alternative crimemeasure, thus bolstering our empirical inferences (SI Appendix,Figs. S15 and S16). Taken together, the battery of sensitivityanalyses buttresses the finding that criminality among the un-documented is considerably lower than that of US-born citizens.
Trend Analysis. Going beyond the visual inspection of criminalityover time, we provide formal statistical tests of the extent towhich the prevalence of undocumented crime has changed inrecent years. Specifically, we use both a linear trend analysis andthe augmented Dickey–Fuller (ADF) test to examine changes inthe percentage of undocumented arrest charges from 2012 to2018. To do so, we first calculate the undocumented proportionof crime by dividing the number of undocumented arrests by thenumber of total arrests (multiplied by 100) in a given month for all
Fig. 5. Trends of property crime rates by citizens, legal immigrants, andundocumented immigrants.
Fig. 4. Trends of violent crime rates by citizens, legal immigrants, andundocumented immigrants.
**In this hypothetical scenario, the felony crime rate from 2012 to 2018 is 761 (per 100,000) for “undocumented immigrants,” 607 (per 100,000) for legal immigrants, and1046 (per 100,000) for US-born citizens.
32344 | www.pnas.org/cgi/doi/10.1073/pnas.2014704117 Light et al.
Dow
nloa
ded
by g
uest
on
Feb
ruar
y 2,
202
2
felonies, violent crimes, property crimes, drug crimes, and trafficcrimes. Rather than examining trends in crime counts, our approachexamines the contribution of undocumented immigrants to theproblem of felony crime in Texas over time, a common metric ofdisparity in criminological research. (For a similar approach ex-amining racial disparities, see 32.) In line with prior studies (33, 34),we log transform the percentage of undocumented immigrant ar-rests to reduce skewness in the distribution. We confirm the resultsare not dependent on this methodological choice in SI Appendix,section VIII, where we report substantively similar findings usinguntransformed percentages.For the linear trend test, we specify a linear regression model
to regress the undocumented crime percentage, P(t), on themonthly time indicator, t. The coefficient of t indicates the basictrend in the prevalence of undocumented immigrant crimes overtime. A positive effect suggests a growing prevalence of undoc-umented immigrant crime, while a negative coefficient suggests adiminishing prevalence of undocumented criminality over time.An insignificant coefficient indicates a lack of a definite trend.Next, the ADF analysis provides a more robust test of the long-
term trend of a time series by removing the influence of short-termshocks and autocorrelation. In order to adjust for autocorrelation, itis necessary to control for a sufficient number of lag terms. Con-sistent with prior research, we determine the optimal number of lagterms by examining the lag order selection statistics, including finalprediction error, Akaike’s information criterion, Schwarz’s Bayesianinformation criterion, and the Hannan and Quinn informationcriterion. We then use the dfuller command in Stata to specify theoptimal number of lag terms flexibly. In Table 1, we report thecoefficient on the time trend terms after accounting for lag terms, aswell as the t score of the ADF test for stationarity following therecommendations of O’Brien (33) and LaFree et al. (34).The results of both the linear trend analysis and the more robust
ADF test reported in Table 1 demonstrate that the monthly trendsin undocumented immigrant criminality are either a random walkor decreasing for each offense type (full results reported in SI Ap-pendix, Tables S6 and S7). In the linear trend analysis, the timecoefficients are all negative and statistically significant, with theexception of the violent crime model, which is negative but notsignificant. This suggests that during the observation period, theundocumented immigrant share of arrests for all felonies, property,drug, and traffic crimes systematically decreased.The ADF tests produced similar results. The prevalence of
undocumented immigrants among total felony arrests and vio-lent felonies was trendless or a random walk. Meanwhile, the
ADF tests for property, drug, and traffic offenses suggest a de-crease in the prevalence of undocumented criminality. Com-bined, there is no evidence that the prevalence of undocumentedimmigrant crime has grown for any category. If anything, thetrend analyses suggest the opposite.
DiscussionCriminality among the undocumented is a paramount social scienceconcern. Yet despite substantial public and political attention, ex-tant research has established surprisingly few empirical findings onthe criminological impact of undocumented immigration. Leverag-ing a unique combination of data from the Texas Department ofPublic Safety and the Department of Homeland Security, this studysheds light on this understudied area of inquiry. Our analysis revealstwo broad conclusions about the criminality of undocumented im-migrants. First, undocumented immigrants have substantially lowerrates of crime compared to both native US citizens and legal im-migrants. Second, over the 7 y period from 2012 to 2018, the pro-portion of arrests involving undocumented immigrants in Texas wasrelatively stable or decreasing.Taken together, these results have important theoretical and
policy implications. Regarding public policy, these findings clearlyrun counter to some of the basic assumptions behind strict immi-gration enforcement strategies. Debates about undocumented im-migration will no doubt continue, but they should do so informed bythe available evidence. The results presented here significantly un-dermine the claims that undocumented immigrants pose a uniquecriminal risk. In fact, our results suggest that undocumented im-migrants pose substantially less criminal risk than native US citizens.More specifically, this analysis helps explain why immigration
enforcement programs have largely failed to deliver on their publicsafety claims. Prior research examining the Secure CommunitiesProgram, for example, found that it had no discernable impact oncrime rates despite the fact that it was active in nearly every countyby 2013 and it substantially increased the number of undocumentedimmigrants deported from the United States (20, 35). Such findingsare unsurprising in light of our results. That is, removing those withrelatively low felony crime rates is unlikely to reduce the overall riskof criminal victimization. It is likely precisely for this reason that thesignificant surge in immigration enforcement in Texas under Pres-ident Trump (36) has not yielded significant crime reductions.††
Fig. 6. Trends of drug crime rates by citizens, legal immigrants, andundocumented immigrants.
Fig. 7. Trends of traffic crime rates by citizens, legal immigrants, andundocumented immigrants.
††Comparing the 2017 to 2018 period to the 2015 to 2016 period, the felony crime rate inTexas increased by 67 (per 100,000). For drug and violent felonies over this same period,the rates increased by 52 and 8 (per 100,000), respectively.
Light et al. PNAS | December 22, 2020 | vol. 117 | no. 51 | 32345
SOCIALSC
IENCE
S
Dow
nloa
ded
by g
uest
on
Feb
ruar
y 2,
202
2

Despite substantial barriers to economic mobility coupled withconsiderable criminological risk factors such as low educationalattainment and high poverty, the fact that we observe lowercrimes rates among undocumented immigrants has importantimplications for current theorizing on immigration and crime.Although our data cannot identify the mechanisms driving thisrelationship, we think insights from theories of assimilation, se-lection, and deterrence are each potentially relevant.Regarding assimilation theory, assimilation often refers to the
tendency for immigrants to adopt the cultural and social valuesof their host country, particularly as their amount of exposure tothe country’s social and cultural context increases. The term“assimilation” has been critiqued in recent years, but the generalfindings regarding the tendency of immigrants to gradually lookmore like the native citizens of their host country over time re-main (37). In particular, one persistent finding in criminology isthat first-generation immigrants tend to be less crime prone thantheir native peers, whereas second- and third-generation immi-grants look more like their native peers in their criminal be-haviors (6). Another common finding in the literature is thatimmigrants brought to the United States as younger childrentend to have higher rates of adolescent and adult criminality thanthose brought as older children (38). In a criminological context,assimilation theory suggests that as immigrants become moreassimilated to the US culture, they adapt to the criminal be-haviors of native citizens. Since undocumented immigrants are,by definition, first generation and, on average, have fewer yearsof residence in the United States compared to legal immigrants,assimilation theory would predict lower crime rates for undocumentedimmigrants.Our findings are also consistent with research on the selective
nature of migration, which suggests that immigrants tend to fare
better on multiple social indicators than would be expected bytheir level of socioeconomic disadvantages (39). In addition,many undocumented immigrants are driven by economic andeducational opportunities for themselves and their families, andthe decision to migrate necessarily requires a considerableamount of motivation and planning. As such, undocumentedimmigrants may be selected on qualities such as motivation towork and ambition to achieve, attributes that are unlikely topredispose them toward criminality (40).The consequences of criminal sanctions due to their precari-
ous legal status may also be relevant. Far more than legal im-migrants, undocumented immigrants have strong incentives toavoid criminal involvement for fear of detection and deportation.In this regard, lower rates of crime for undocumented individualsare consistent with a deterrence-based argument, whereby un-documented immigrants face considerably harsher sanctions(mainly deportation) from criminal wrongdoing compared totheir citizen and legal immigrant counterparts.Taken together, these perspectives—assimilation, selection,
and deterrence—help us understand why the observed crimerates for undocumented immigrants were considerably lowerthan those for legal immigrants and native-born citizens. Each, inturn, offers a fruitful avenue for further research on undocumentedimmigration and crime.
Data Availability. Anonymized state data files and replicationmaterials have been deposited in OpenICPSR (https://www.openicpsr.org/openicpsr/project/124923/version/V1/view).
ACKNOWLEDGMENTS. Grants from the National Science Foundation (Award# 1849297) and the National Institute of Justice (Award # 2019-R2-CX-0058)supported this research.
1. J. Manuel Krogstad, J. S. Passel, D’Vera Cohn, “5 facts about illegal immigration in theUS” (Pew Research Center, Washington, DC, 2019).
2. S. Bohn, M. Lofstrom, S. Raphael, Did the 2007 Legal Arizona Workers Act reduce thestate’s unauthorized immigrant population. Rev. Econ. Stat. 96, 258–269 (2014).
3. Petition for writ of certiorari of petitioner United States of America, United States ofAmerica v. State of California, 590 U. S. _ 2020 (No. 19-532). https://www.supreme-court.gov/docket/docketfiles/html/public/19-532.html. (2020). Accessed 19 November2020.
4. R. Capps, M. Chishti, J. Gelatt, J. Bolter, A. G. Ruiz Soto, “Revving up the deportationmachinery: Enforcement and pushback under Trump” (Migration Policy Institute,Washington, DC, 2018).
5. D. Meissner, D. M. Kerwin, M. Chishti, C. Bergeron, Immigration Enforcement in theUnited States: The Rise of a Formidable Machinery (Migration Policy Institute,Washington, DC, 2013).
6. B. E. Bersani, An examination of first and second generation immigrant offendingtrajectories. Justice Q. 31, 315–343 (2014).
7. R. Warren, US undocumented population continued to fall from 2016 to 2017 andvisa overstays significantly exceeded illegal crossings for the seventh consecutive year.J. Migr. Hum. Secur. 7, 19–22(2019).
8. B. Baker, “Estimates of the illegal alien population residing in the United States:January 2015” (Department of Homeland Security, Washington, DC, 2018).
9. I. V. Eagly, Criminal justice for noncitizens: An analysis of variation in local enforce-ment. NYU Law Rev. 88, 1126–1223 (2013).
10. I. V. Eagly, Criminal justice in an era of mass deportation: Reforms from California.New Crim. Law Rev. 20, 12–38 (2017).
11. A. E. Carson, “Prisoners in 2016” in NCJ 251149 (Bureau of Justice Statistics, Wash-ington, DC, 2018).
12. A. Nowrasteh, “Criminal immigrants in Texas” in Immigration Research and PolicyBrief No. 4 (Cato Institute, Washington, DC, 2018).
13. J. Lott, R. John, Undocumented immigrants, U.S. citizens, convicted criminals in Ari-zona. https://www.ssrn.com/abstract=3099992 (10 February 2018).
14. G. C. Ousey, C. E. Kubrin, Immigration and crime: Assessing a contentious issue. Annu.Rev. Criminol. 1, 63–84 (2018).
15. G. C. Ousey, C. E. Kubrin, Exploring the connection between immigration and violentcrime rates in U.S. Cities, 1980-2000. Soc. Probl. 56, 447–473 (2009).
16. Pew Research Center, U.S. unauthorized immigrant population estimates by state,2016. https://www.pewresearch.org/hispanic/interactives/u-s-unauthorized-immigrants-by-state/. Accessed 1 April 2020.
Table 1. Trends in the log-transformed undocumented percentage of arrest charges:Augmented Dickey–Fuller time series test and linear trend test results
Test Type and Crime Category Estimated value Trend Type No. of lag terms
ADF testTotal felony −0.002 Trendless Random walk 3Violent −0.001 Trendless Stationary 0Property −0.002* Decrease Stationary 0Drug −0.003* Decrease Random walk 3Traffic −0.003** Decrease Stationary 1
Linear trend testTotal felony −0.002*** DecreaseViolent −0.001 TrendlessProperty −0.002** DecreaseDrug −0.004*** DecreaseTraffic −0.003*** Decrease
*P < 0.05; **P < 0.01; ***P < 0.001.
32346 | www.pnas.org/cgi/doi/10.1073/pnas.2014704117 Light et al.
Dow
nloa
ded
by g
uest
on
Feb
ruar
y 2,
202
2

17. A. E. Carson, D. Golinelli, “Prisoners in 2012” in NCJ 242467 (Bureau of Justice Sta-tistics, Washington, DC, 2013).
18. Department of Homeland Security, The Criminal Alien Population Projection Analysis(CAPPA) (2010). https://www.ice.gov/doclib/foia/reports/cappa-projected-arrests-re-leases-aor-level.xls. Accessed 10 March 2020.
19. Bureau of Justice Assistance, State Criminal Alien Assistance Program (SCAAP) (2016).https://bja.ojp.gov/redirect-legacy/funding/SCAAP-FY-2016-Award-Details.xlsx. Ac-cessed 10 March 2020.
20. T. J. Miles, A. B. Cox, Does immigration enforcement reduce crime: Evidence fromsecure communities. J. Law Econ. 57, 937–973 (2014).
21. Texas Department of Public Safety, Texas criminal illegal alien data (2020). https://www.dps.texas.gov/administration/crime_records/pages/txcriminalalienstatistics.htm.Accessed 3 June 2020.
22. R. Warren, Democratizing data about unauthorized residents in the United States:Estimates and public-use data, 2010 to 2013. J. Migr. Hum. Secur. 2, 305–328 (2014).
23. R. Warren, J. R. Warren, Unauthorized immigration to the United States: Annualestimates and components of change, by state, 1990 to 2010. Int. Migr. Rev. 47,296–329 (2013).
24. M. T. Light, T. Y. Miller, Does undocumented immigration increase violent crime?Criminology 56, 370–401 (2017).
25. B. Bell, S. Machin, “Crime and immigration: What do we know?” in Lessons from theEconomics of Crime: What Reduces Offending? P. J. Cook, S. Machin, O. Marie, G.Mastrobuoni, Eds. (MIT Press, Cambridge, MA, 2013), pp. 149–174.
26. J. L. Spenkuch, Understanding the impact of immigration on crime. Am. Law Econ.Rev. 16, 177–219 (2014).
27. S. R. Baker, Effects of immigrant legalization on crime. Am. Econ. Rev. 105, 210–213(2015).
28. J. D. Bachmeier, J. Van Hook, F. D. Bean, Can we measure immigrants’ legal status?Lessons from two U.S. Surveys. Int. Migr. Rev. 48, 538–566 (2014).
29. J. Van Hook, Counting 11 million undocumented immigrants is easier than you think.The Conversation (2016). http://theconversation.com/counting-11-million-undocu-mented-immigrants-is-easier-than-you-think-67921. Accessed 15 April 2020.
30. M. M. Fazel-Zarandi, J. S. Feinstein, E. H. Kaplan, The number of undocumentedimmigrants in the United States: Estimates based on demographic modeling withdata from 1990 to 2016. PLoS One 13, e0201193 (2018).
31. Gonzalez v. ICE, 416 F. Supp. 3d 995 (C.D. Cal. 2019).32. D. Steffensmeier, B. Feldmeyer, C. T. Harris, J. T. Ulmer, Reassessing trends in black
violent crime, 1980-2008: Sorting out the ‘Hispanic effect’ in Uniform Crime Reportsarrests, National Crime Victimization Survey offender estimates, and US prisonercounts. Criminology 49, 197–251 (2011).
33. R. O’Brien, Measuring the convergence/divergence of “serious crime” arrest rates formales and females: 1960–1995. J. Quant. Criminol. 15, 97–114 (1999).
34. G. LaFree, R. O’Brien, E. P. Baumer, “Is the gap between black and white arrest ratesnarrowing” in The Many Colors of Crime: Inequalities of Race, Ethnicity, and Crime inAmerica. R. Peterson, L. J. Krivo, J. Hagan, Eds. (New York University Press, New York,NY, 2006), pp. 179–198.
35. E. Treyger, A. Chalfin, C. Loeffler, Immigration enforcement, policing, and crime.Criminol. Public Policy 13, 285–322 (2014).
36. K. Bialik, “ICE arrests went up in 2017, with biggest increases in Florida, northernTexas, Oklahoma” (Pew Research Center, Washington, DC, 2018).
37. R. Alba, V. Nee, Remaking the American Mainstream: Assimilation and ContemporaryImmigration (Harvard University Press, Cambridge, MA, 2003).
38. L. Berardi, S. M. Bucerius, “Immigrants and their children: Evidence on generationaldifferences in crime” in The Oxford Handbook of Ethnicity, Crime, and Immigration.S. M. Bucerius, M. Tonry, Eds. (Oxford University Press, New York, 2014), pp. 551–583.
39. R. Sampson, Rethinking crime and immigration. Contexts 7, 28–33 (2008).40. K. F. Butcher, A. M. Piehl, “Why are immigrants’ incarceration rates so low? Evidence
on selective immigration, deterrence, and deportation” (Tech. Rep. w13229, NationalBureau of Economic Research, 2007).
Light et al. PNAS | December 22, 2020 | vol. 117 | no. 51 | 32347
SOCIALSC
IENCE
S
Dow
nloa
ded
by g
uest
on
Feb
ruar
y 2,
202
2