comparing cost, risk, and benefit trade-offs under uncertainty: cheatgrass case study lisa wainger...
TRANSCRIPT

Comparing Cost, Risk, and Benefit Trade-offs Under Uncertainty:
Cheatgrass Case Study
Lisa Wainger and Dennis King,
University of MarylandRichard Mack, Washington State University
Jim Opaluch, University of Rhode Island

Establish Management Priorities
Evaluate Risks of No Treatment Option
Estimate Costs and Risk-Adjusted Benefits of
Site/Treatment Options
Identify Options with highest Cost-Effectiveness
Select Portfolio of Options to Manage Risk
Test Assumptions
DecisionFramework

Decision analysis components to examine with case study
• Benefits of Treatment– How do measures of damage avoided vary with
location and scale of analysis?
• Probability of Successful Restoration– How do site, location and characteristics of invasion
influence whether ecosystem services will be restored?
• Costs of Treatment– How do costs vary by location and scale of treatment?

Columbia Basin Study Area

Bromus tectorum (cheatgrass) distribution through time
1930s - present

Federal Land Ownership
Source data: USGS

Risks created by cheatgrass invasion
Increasing scale
Impact Mechanism Potential scale of Impact
Loss of rangeland productivity Provides lower quality forage than displaced natives or forage species
On-site
Loss of habitat in grasslands Displaces native bird species On-site to local Loss of life Increased fire frequency Local to regional Damage to property (homes, businesses, roads, dams)
Fire, post-fire erosion Local to regional
Health/amenity impacts Fire creates particulates in air and diminishes visibility
Local to regional
Lost recreation (amenity) value and lost income
Fire reduces number of visitors and quality of experience
Regional
Instream resource impacts (salmon fisheries)
Erosion diminishes water quality, substrate quality
Regional

with projectwithout project
Measuring Benefits
Benefits
Timei = service, t = time period
i
it
itt DEZ
E
D
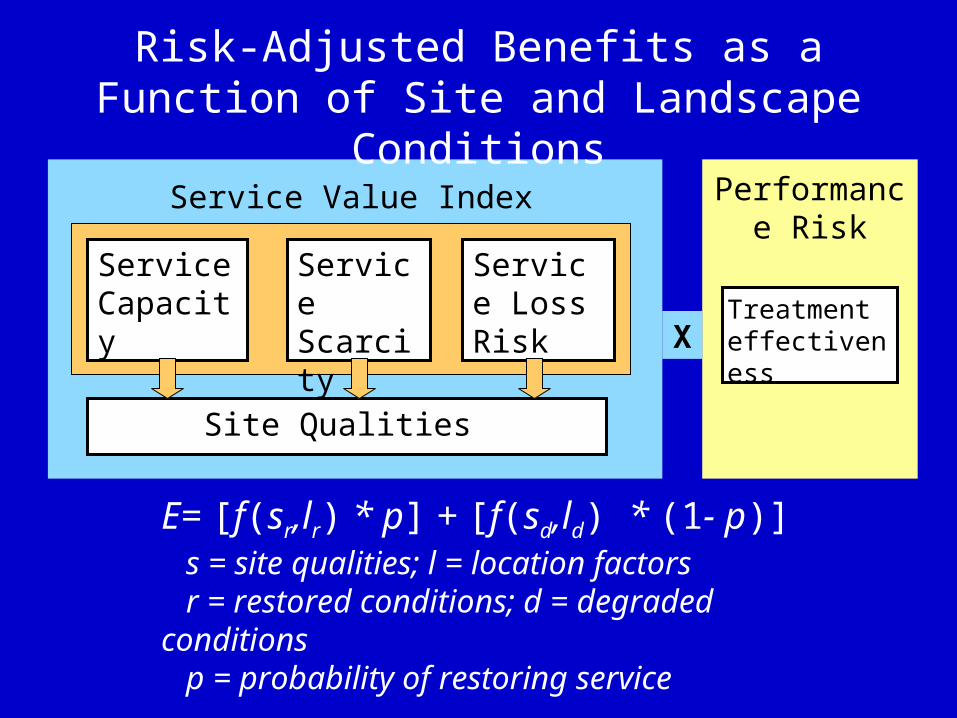
Risk-Adjusted Benefits as a Function of Site and Landscape Conditions
Service Capacity
Service Scarcity
Service Loss Risk
Site Qualities
Service Value Index
Treatment effectivenessX
Performance Risk
E= [f(sr,lr) * p] + [f(sd,ld) * (1- p)] s = site qualities; l = location factors r = restored conditions; d = degraded conditions p = probability of restoring service

Does the Site Provide a Valued Service?
Site has features necessary to produce serviceSite has capacity to produce service because
“users” have access and complementary inputs are available
Service value is enhanced because service is scarce and substitutes are unavailable or expensive
The risk that the stream of services will end due to factors beyond the control of restoration is low.

Fire Risk
Source data: USDA FS ICBEMP
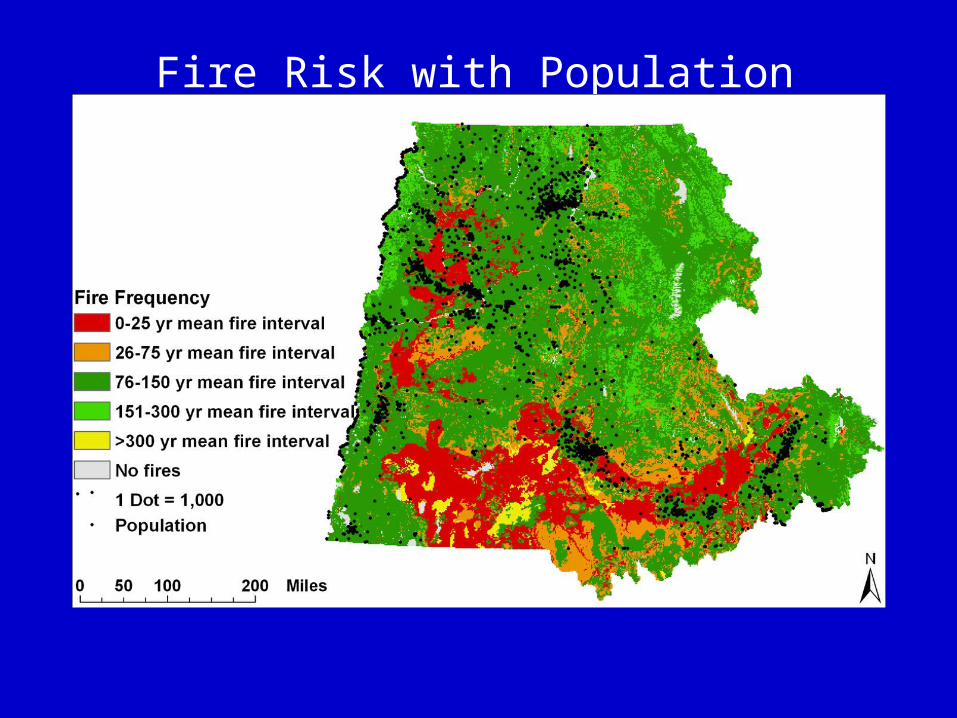
Fire Risk with Population

Treatment Scenarios
1. Preventive reseeding following fire– Apply to uninvaded sites
– Spread seeds aerially or use drill-seeding
– Sometimes follow aerial seeding with chaining
2. Herbicide treatment of existing stands– Applied to heavily invaded sites
– Multi-step process of burning, herbicide, seeding

Treatment Decision Tree
Type of Seed
B1
B3
Treat / No-treat
Cheatgrass Dominant
Natives Dominant
Forage Species Dominant
Cheatgrass Dominant
Cheatgrass Dominant
Natives Dominant
B1
B2
B1
B3
native
forage
No-treat
treat
(p = 0.90)
(p = 0.10)

Restorability Model
Probability of Success
Site Variables
Landscape Variables
Stochastic Variables
Cheatgrassregrowth
New cheatgrassinfestation
Native / Forage regrowth

Comparing Restorability
Contagion Index = 0.30 Contagion Index = 0.85
sparse dense

Evaluating Costs
• Trying to supply treatment effort to multiple sites for minimum cost– How do costs vary over infested area?– How many sites to treat?– How much area to treat in each location?
• Is it worth treating?

Site
Town
Road
Initial Costjk = Fixed Costk + Travel Costj*timej + Search Costj*area + Treatment Costjk*area j = location k=treatment method
SC = f(site factors); TC = g(site factors)
Minimum-Cost Network Flow

Equipment Sources and Treatment Destinations

Cost Per Unit Distance
low
high

Cumulative Travel Cost Map

Evaluating Marginal Costs of Treatment
Not Infested
High Cost
Avg. Cost
Low cost
Lowest costSource cell
MC = max {cell costjk | m}
Treated area m
Cell Costjk = Travel Cj*timej + Search Cj*area + Treat Cjk*area j = location k=treatment method

Marginal Cost Surface(time-dependent costs)

Sparse Infestation Dense Infestation
8.8 Total Cost 31.2
0.5 Marginal Cost 1.4
227.4 Total Treatment (m2) 6,628.0
73.1 Marginal Treatment 366.0
Comparing Costs and Kill Efficiencysparse dense

Intensity of Invasion
Ecosystem Service Benefits Site A
Risk of Treatment Failure
Uncertainty of Returns from Treatment
Reversibility of Decline
p

Transferring Results to Risk Analysis for Recent Invasions
• How well do GIS databases perform for doing this type of modeling?
• What were the main factors contributing to cost of control and degree of impact?
• How does an evaluation of cost-effectiveness change with the scale of analysis?
• How do costs of control and level of impact change through time?
• How have transitions in land uses (e.g., recreation vs. rangeland) changed our perception of the impacts of cheatgrass?
• Given our current values, when, in the progression of the cheatgrass invasion, would treatment have been the most cost-effective?