comparing automated shared taxis and conventional bus
TRANSCRIPT

Journal of Public Transportation, Vol. 20, No. 2, 2017 19
Comparing Automated Shared Taxis and Conventional Bus Transit
for a Small City
Dr. Louis A. Merlin, AICPFlorida Atlantic University
Abstract
This study compared two hypothetical transit scenarios with the current bus transit system for serving the transit passengers of Ann Arbor, Michigan, for a typical fall weekday in 2013. One scenario consists of an automated taxi system that allows only one rider at a time, and the other consists of a similar automated taxi system that allows ridesharing for up to four passengers. The two automated taxi scenarios were modeled on simulated transit passenger travel demand data via agent-based models. All three scenarios were then compared for their level of service, cost, greenhouse gas emissions, and congestion impacts. The automated shared-ride taxi transit service could provide a higher level of service at lower cost and lower carbon emissions than the current bus system. An automated taxi service without ridesharing would provide high levels of service at lower cost, but with higher levels of carbon emissions than the current bus system. Ridesharing is essential to obtaining the full cost savings and environmental benefits for an automated taxi system. Both automated taxi systems would likely increase peak-hour congestion by increasing peak-hour vehicle kilometers traveled.
Keywords: Automated vehicles, shared automated vehicles, shared mobility, greenhouse gas emissions, demand responsive transit
What Does Vehicle Automation Mean for Transit?
With a background of steady technological progress towards vehicle automation, several researchers have speculated that highly-automated vehicles will lead to the advent of new vehicular travel modes. Taxis have long been available as a convenient mode of semi-transit, but have been limited in their share of the transportation market to high costs and difficulties in hailing. Automated taxis, in concept, solve both these problems—they are easily hailed from any mobile phone, and, without the costs of a human driver, the per-kilometer costs of automated taxi travel are presumably

Journal of Public Transportation, Vol. 20, No. 2, 2017 20
Comparing Automated Shared Taxis and Conventional Bus Transit for a Small City
lower than for conventional, human-driven taxis. In comparison with private vehicle ownership, automated taxis offer the potential of point-to-point travel on demand without having to worry about parking, maintenance, or insurance issues. In comparison with public transit, automated taxis offer much greater flexibility in routing and scheduling, including the possibility of demand-responsive service.
Technological innovation and entrepreneurship in the transportation sector have led to a variety of new transportation services captured broadly under the name “shared mobility” (Shared-Use Mobility Center 2016; Shaheen et al. 2015). Services such as Uber and Lyft (known as “ridesourcing”), car-share services, bike-share services, and ride-matching services are increasingly available in large cities and offer flexible versions of transportation on demand in urban areas. As car-share services have become more pervasive, new models of one-way car-sharing have arisen, such as Car2Go (Ciari and Bock 2014; Shaheen et al. 2015). Vehicle automation is likely to build upon these already-existing trends by allowing vehicles to come to passengers upon demand, thereby further opening up the markets for shared mobility services. Several companies, such as Uber and Ford, are investing heavily in developing shared, automated, on-demand mobility services (Boudette 2016; Chafkin 2016).
There are several reasons to suspect that the population of current transit riders may be among the first to widely adopt the use of a new automated taxi mode. First, transit riders have a demonstrated willingness to travel by modes other than their own private vehicle and a willingness to use shared forms of transport. Therefore, the modal switch to shared taxis would be a less dramatic behavioral switch for frequent transit riders than for those who currently rely predominantly on private vehicles. Second, automated taxis (and taxis in general) operate most efficiently and cost-competitively in urban environments in which travel demand is concentrated. In other words, automated taxis will be most prevalent and affordable in the same dense urban environments served by transit. Third, automated taxis are likely to be able to provide a higher quality of service than current fixed-route transit services by allowing fewer transfers, shorter wait times, and shorter access and egress approaches to boarding and alighting areas.
The question that leaps immediately to mind is how will the spread of automated taxis impact public transit? There are three possible answers to this question. The first is that automated taxis would increase current transit ridership by serving as effective first-mile/last-mile service to existing transit (Levine et al. 2013; Liang et al. 2016; Shepherd and Muir 2011). The second is that automated taxis and similar shared automated modes will compete directly with transit and gradually erode its market share (Martinez and Viegas 2016b). The third is that automated taxis and transit will be integrated into a system that will play off the benefits of each (Maheo et al. 2016). This study explored the second of these alternatives—that automated taxis might outcompete and replace public transit in certain areas—and investigates the implications of this potential outcome.
In particular, this study compared the performance of the current bus transit system in Ann Arbor, Michigan, with two alternative automated taxi systems. One automated taxi system does not permit ridesharing, serving one person or party at a time (a “single-rider” system); the other requires ridesharing, subject to certain passenger convenience
Journal of Public Transportation, Vol. 20, No. 2, 2017 21
Comparing Automated Shared Taxis and Conventional Bus Transit for a Small City
constraints (a “shared-ride” system). Both taxi systems could be considered a type of transit, in that they are required to serve all transit passengers within their service area and that vehicle movements are centrally coordinated across the taxi fleet. Agent-based models were used to simulate these alternative automated taxi systems under the premise that they would serve all Ann Arbor transit riders for a typical weekday in 2013 and then their performance was compared to the current transit system with respect to wait times, travel times, costs, carbon emissions, and congestion impacts. It was expected that a fleet of many small automated taxis would be able to serve Ann Arbor’s transit demand with shorter wait and in-vehicle travel times. On the other hand, a switch to automated taxis likely would also increase vehicle mileage externalities, such as carbon emissions and congestion impacts. The purpose of this simulation was to estimate the size of these impacts and assist in formulating policy initiatives to mitigate these potential impacts.
Recent Simulation Research Regarding New Automated Modes
Most of the current simulation and modeling research into automated taxis examined their competitiveness with private vehicle ownership (Burns et al. 2013; Fagnant and Kockelman 2014; Spieser et al. 2014; Fagnant et al. 2015). For example, Burns et al. (2013) found that a fleet of 18,000 automated taxis could serve most of the urban area around Ann Arbor with average wait times under 1 minute and costs of about 25 cents per kilometer (41 cents per mile). This is cost-competitive with current average private vehicle ownership costs of 37 cents per kilometer (59 cents per mile). Fagnant and Kockelman (2014) assumed that automated taxis would obtain a modest 1–2% of current private vehicle trips in Austin, Texas. Under such a system, they found that each automated taxi replaced about 8.4 privately-owned vehicles, whereas the system as a whole required 10% additional vehicle kilometers traveled (VKT) to serve the same travel demand. On the other hand, with dynamic rideshare,1 the VKT increase could be as little as 1.5% over the present system (Fagnant and Kockelman 2014; Fagnant et al. 2015). The average wait time for their system was estimated at about 50 seconds, and 96.2% of travelers had a wait less than 5 minutes. Assuming a cost of $70,000 per vehicle, including automation costs, they found that a shared automated vehicle (SAV) fleet in Austin would provide a 19% return on investment if the system operators charged 62 cents per kilometer ($1 per trip mile) served. Bischoff and Maciejewski (2016) examined an automated taxi system serving 10% of private vehicle trips in Berlin and found that such a system would increase VKT by 14.6% with a 3-minute average wait time. In short, current models suggest that automated taxi systems could provide a high level of service with minimal wait times and competitive costs in moderately-dense urban environments.
A smaller body of research examined automated taxis as a first-mile/last-mile service feeding into existing transit (Levine et al. 2013; Liang et al. 2016; Shepherd and Muir 2011). Levine et al. (2013) found that private commute mode share decreases by
1 Placing multiple passengers in the same vehicle in real time without pre-planning the trip.

Journal of Public Transportation, Vol. 20, No. 2, 2017 22
Comparing Automated Shared Taxis and Conventional Bus Transit for a Small City
between 7–29% with automated shuttles feeding into existing Chicago-area train stations. Shepherd and Muir (2011) found that transit mode share could increase 1–8% across various European cities with automated shuttles feeding into existing train stations. These studies document some possible growth in the transit market by using automated vehicles to feed into high capacity transit.
Martinez and Viegas (2016a) examined what would happen if two new forms of automated transit, automated taxis and advance-scheduled automated shuttles, served Lisbon, Portugal, replacing both private vehicle trips and current bus trips. They assumed that people within close proximity to the subway continued to use that mode. With this massive mode shift, the transportation system would see a 34% reduction in carbon dioxide emissions. Wait times would be limited to 5 minutes for automated taxis and 10 minutes for automated shuttles, and costs would be affordable, at about 32 cents per kilometer.
Maheo et al. (2016) redesigned the existing bus system of Canberra, Australia, with a system of human-driven taxis feeding into high-frequency bus lines. They found that for the same total costs, wait times could be cut in half. Their hub-and-spoke design offered a promising precursor for how automated taxis and large vehicle transit might work together as part of an efficient integrated system.
Reviewing the current research, automated taxis offer the possibility of a convenient, cost-competitive mode that could replace a large segment of private vehicle travel; however, automated taxis may replace or compete with current bus services as well. Many researchers have anticipated that automated taxis or automated shuttles could feed into current high-capacity transit systems, but few have studied whether and how transit systems themselves should be redesigned to best integrate with this proposed new mode.
A large caveat on this body of research is aggressive assumptions about market share and affordable automation cost. Several of these studies assumed a very large market share—in some cases, a 100% share of the current travel market—which makes it much easier to obtain economies of scale and create an efficient system. In the real world, any new mode would have to compete with all existing modes and could not obtain these efficiencies in the short run, or perhaps ever. Also, the cost assumptions regarding the marginal cost of automating a vehicle often are quite favorable without substantiation. For example, Burns et al. (2013) assumed that the cost to convert a regular vehicle to an automated one is a one-time marginal cost of just $2,500 per vehicle, whereas Spieser et al. (2014) assumed a more reasonable but still speculative automation cost of $15,000 per vehicle.
In comparison with these other simulations, this study assumed that all transit riders in a small city could be served by an automated taxi system, which is a more modest and arguably reasonable assumption than full market capture. It is even conceivable that a transit agency could decide to launch an automated taxi system to replace its current bus service. Indeed, some cities that are spread out and not well served by conventional transit have engaged Uber as a kind of transit substitute (Woodman 2016). The implications of such a switch are investigated in the rest of the paper.

Journal of Public Transportation, Vol. 20, No. 2, 2017 23
Comparing Automated Shared Taxis and Conventional Bus Transit for a Small City
The following section discusses the data used for transit passenger travel demand and the workings of the agent-based model in NetLogo. This is followed by a section that examines the three scenarios of current bus, automated taxi, and automated shared taxi from the perspective of wait times, travel times, costs, VKT, and carbon emissions. The section after that returns to considerations of what such an automated taxi system might mean for the future of public transit and transit policy. The Conclusion summarizes and reiterates the main points from the proceeding sections.
Methodology: Agent-Based Models of Automated Taxi Fleets for Ann Arbor
This study compared three transit systems serving a typical weekday’s ridership for the Ann Arbor Area Transit Authority (AAATA) system from 2013 with measurements for wait time, travel time, cost, vehicle miles traveled, and carbon dioxide emissions. Data for the performance of the actual AAATA bus system were from the National Transit Database (NTD) for 2013. The two automated taxi systems were simulated in NetLogo, with separate models for a single-ride system and a shared-ride system.
AAATA Background
The AAATA system is a small-city bus system without a rail component, but with a relatively high ridership due to a major university and downtown employment core and a large student population. In comparison with the other 472 bus systems reporting operations to NTD in 2013, Ann Arbor offered 8,916 vehicle revenue miles on a typical weekday, similar to the mean for all systems of 11,861 (although there is a large standard deviation across systems of 25,711) (Federal Transit Administration 2014). Average weekday vehicle occupancy, calculated as passenger miles divided by vehicle revenue miles, was 8.1 persons per vehicle, which was, again, comparable to the average for all bus systems in the US at 7.3 (4.3 standard deviation). AAATA trips were shorter than the average for US bus systems, with the average trip length being 5.0 kilometers for AAATA vs. 8.5 kilometers for the average US system, presumably because Ann Arbor is a relatively small town. The volume of passengers, however, was quite high, with 32.6 passenger trips per vehicle-hour, in comparison with a national average of just 22.4 (12.5 standard deviation). In other words, in comparison with the “average” bus system in the US, AAATA has typical occupancies, high volumes, and shorter passenger trip lengths.
NetLogo
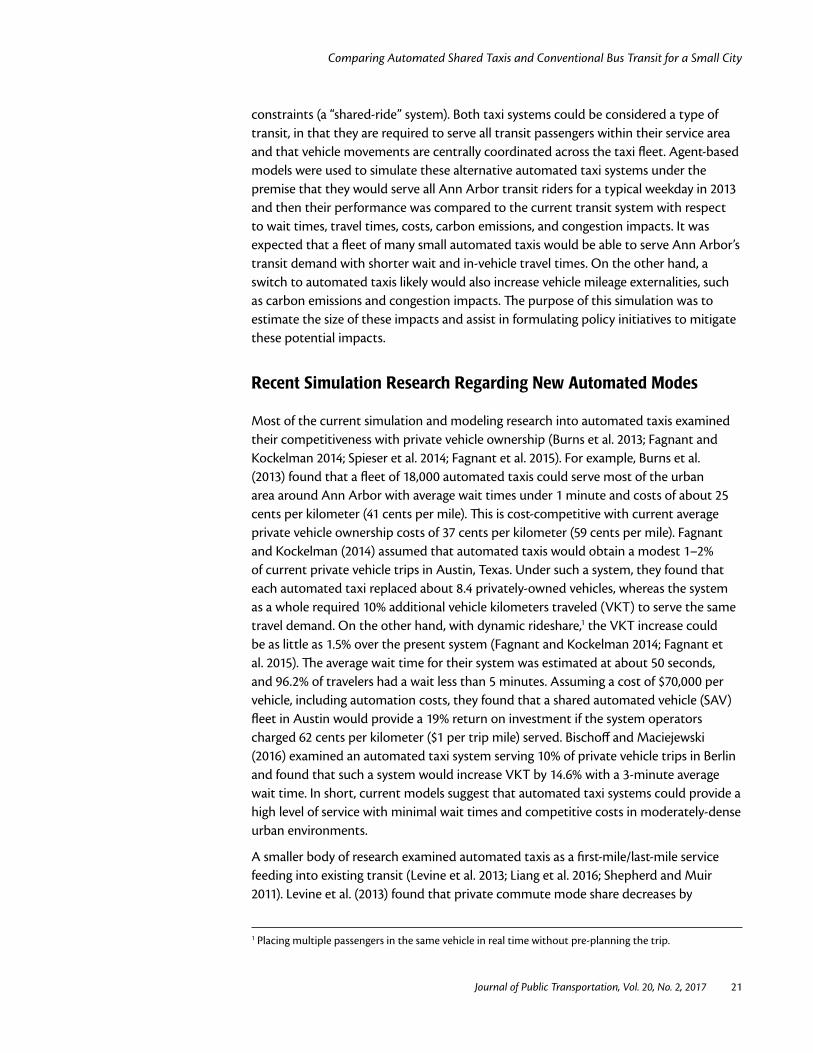
NetLogo is a graphical, agent-based modeling platform within which individual passengers and taxis are generated and follow prescribed sets of instructions or behaviors. Time itself is modeled, in this case, with one minute increments, and passengers and taxis move on a minute-by-minute basis. System-level patterns of travel emerge and are monitored both on the screen and through a number of aggregate metrics for passengers and vehicles. Within the NetLogo interface, the user can view
Journal of Public Transportation, Vol. 20, No. 2, 2017 24
Comparing Automated Shared Taxis and Conventional Bus Transit for a Small City
the movements of taxis and passengers in space as well as stop the simulation and monitor any of their internal variables (i.e., number of passengers for taxis, wait time for passengers) within the simulation in “real” time. That is, the user can watch the simulation unfold and observe the behavior of individual taxis and passengers to ensure that it comports with the intentions of the simulation logic.
Figure 1 shows a screenshot from NetLogo. Many small passengers are shown in white for passengers en route and in red for passengers who have completed their rides. Taxis are shown in yellow, but become darker as they are more fully occupied. White lines connect passengers with the taxis en route to picking them up.
FIGURE 1. Screenshot of automated taxi
model in NetLogo
Generating and Serving Transit Passengers
True transit origin-to-destination trip data were not available from AAATA or the regional planning agency, the Southeast Michigan Council of Governments (SEMCOG), so transit trips were simulated based on other available data. A transit rider survey from 2010 by SEMCOG provided a sample of passenger boarding locations and alighting locations by time of day. Origins were sampled randomly from boarding locations, and destinations were sampled randomly from alighting locations, with separate samples for each of four time-of-day periods: morning, midday, afternoon, and evening (Nustats 2012). Since origins and destinations were each sampled at random without any correspondence, the sample did not represent true origin-destination pairs. Boarding data for the AAATA system from a weekday in 2013 were used to simulate the generation of new passengers for each 15-minute interval (Ann Arbor Area Transportation Authority 2014a). The average total passengers per day for the simulation were calibrated to the NTD total of 23,152 (Federal Transit Administration 2014).
For a single-rider taxi system, passengers hail the closest available (empty) taxi. Passengers who have been waiting longer hail taxis first. The hailed taxi goes directly

Journal of Public Transportation, Vol. 20, No. 2, 2017 25
Comparing Automated Shared Taxis and Conventional Bus Transit for a Small City
to the passenger and picks him/her up, then goes uninterrupted to that passenger’s destination and drops him/her off. Passengers are assumed to have a boarding time of one minute and an alighting time of one minute, during which the taxi does not move.
For a shared-ride system, taxis en route divert to serve new passengers so long as no existing or committed passenger is inconvenienced by too great a degree. Specifically, for each passenger served by a shared-ride taxi, his/her wait time cannot exceed 10 minutes. In addition, for all existing, committed, and new passengers, their travel time may not exceed more than 10 minutes more than their direct travel time. Therefore, additional passengers are accommodated with a shared-ride only if existing passengers are still well-served. Also, each taxi has a maximum capacity of four passengers. If several taxis qualify to serve a new passenger, then the taxi that increases its VKT least is selected. This results in the smallest VKT increase for the fleet as a whole. To select the taxi that increases VKT least, a centralized system of taxi dispatch would be required. If each taxi was simply trying to maximize its own revenues, a different travel pattern outcome would result, presumably one with higher VKT.
Calibrating Taxi Speeds
The street network was not modeled, so all taxis traveled in a straight line to pick up and drop off their passengers. However, travel times from point to point were calibrated to real-world travel times to allow the queueing (waiting) aspects of the model as realistic as possible. The idea was that if travel times from each origin to each destination were realistic, then the time required for waiting and arriving at desired locations also would be representative.
Travel times were calibrated two ways. First, straight lines travel distances were multiplied by a network factor to make them more closely resemble network travel distances. Based on a random sample of origins and destinations, a network inflation factor of 1.238 was obtained. Second, network travel speeds for peak and off-peak travel times were determined from a random sampling of origins and destinations run through Google directions. Together, these calibrations allowed for a realistic simulation of point-to-point travel distances and speeds.
Calculating Wait Times and Determining Fleet Size
A brief literature review was conducted of typical wait times for buses, with a focus on literature that related wait times to service frequency. Estimating bus wait times depends upon traveler behavior, including whether travelers arrive at a random time between buses or whether they optimize their arrival time to minimize their expected wait. Bowman’s optimization model (Bowman and Turnquist 1981) has passengers optimize their wait time based upon service frequency and reliability and estimates a wait time of 2–3 minutes for 5-minute headways, 3–5 minutes for 10-minute headways, and 5–7 minutes for 20-minute headways. Fan and Machemel (2009) used empirical data on observed wait times and found that typical wait times can be reasonably estimated with a formula that is a function service frequency. This formula is wait time

Journal of Public Transportation, Vol. 20, No. 2, 2017 26
Comparing Automated Shared Taxis and Conventional Bus Transit for a Small City
= 2.28 minutes + 0.29 × service frequency. Based upon Fan’s formula, the expected wait time for the average AAATA rider was 9.5 minutes (see Table 1. Based upon an extrapolation of Bowman’s data, the expected wait time for the average AAATA rider was 6.2 minutes.
TABLE 1.Estimated Wait Times for
AAATA System
Route Route Name Average Ridership
AM Peak Headways
Estimated Wait Times*
Estimated Wait Times**
1 Pontiac Dhu Varren 810 30 11.0 7.0
2 Plymouth 2,463 15 6.6 5.0
3 Huron River 1,337 30 11.0 7.0
4 Washtenaw 3,052 10 5.2 4.0
5 Packard 2,319 30 11.0 7.0
6 Ellsworth 2,248 30 11.0 7.0
7 S. Main East 1,241 30 11.0 7.0
8 Pauline 746 15 6.6 5.0
9 Jackson-Dexter 708 30 11.0 7.0
10 Ypsilanti-NE 506 60 19.7 10.0
11 Ypsilanti-South 243 60 19.7 10.0
12 Miller-Liberty 834 30 11.0 7.0
13 Newport 211 60 19.7 10.0
14 Geddes-E. Stadium 196 30 11.0 7.0
15 Scio Church-W. Stadium 253 30 11.0 7.0
16 Ann Arbor Saline Rd. 468 30 11.0 7.0
17 Amtrak Depot ST. 46 30 11.0 7.0
18 Miller-University 435 25 9.5 7.0
20 Ypsilanti-Grove-Ecorse 544 60 19.7 10.0
22 North/South Connector 772 30 11.0 7.0
33 EMU Shuttle 611 20 8.1 6.0
36 Wolverine Tower Shuttle 1,697 9 4.9 4.0
601 Pontiac-University 128 0 0.0 7.0
609 Dexter-University 142 30 11.0 7.0
Estimated per-passenger average wait time 9.5 6.2
Headway data from Ann Arbor Area Transportation Authority, 2014b*Fan 2010**Bowman and Turnquist 1980
In the NetLogo model, wait times are tracked for each individual passenger. The size of the taxi fleet was calibrated to ensure that the average wait time for the system was less than the smaller of the two expected wait times for the average AAATA rider, i.e., 6.2 minutes. For the single-rider system, fleet sizes between 500 and 1000 were tested, with the finding that a fleet of 800 vehicles performed well on wait times and optimally on costs. Then, for the shared-ride system, fleet sizes between 300 and 750 were tested, based on the assumption that the shared-ride system of the same fleet size would

Journal of Public Transportation, Vol. 20, No. 2, 2017 27
Comparing Automated Shared Taxis and Conventional Bus Transit for a Small City
almost certainly perform at least as well as the single-rider system with respect to wait times. The optimal cost system with satisfactory wait time performance for a shared-ride fleet was found to be 400 vehicles.
Calculating Costs
To compare the three systems on an equitable basis, only vehicle-related costs were accounted for, including vehicle capital costs, vehicle maintenance costs, insurance and taxes, and fuel and tire costs. Administrative costs and non-vehicle capital costs were excluded from all cost calculations.
For the bus transit system, vehicle operations costs, vehicles maintenance costs, and vehicle-related capital associated with existing transit lines were included. NTD provides costs on an annualized basis, so these costs were converted to per-kilometer costs to assign them to a typical weekday (Federal Transit Administration 2014). Costs per passenger-kilometer also were provided.
For the taxi systems, the costs estimates were based assuming a taxi fleet of model 2014 Prius Cs with a per-vehicle cost of approximately $29,230. Vehicle automation costs were assumed to be $50,000 per vehicle in addition to regular vehicle purchase costs. Kilometers-per-liter for this vehicle in urban areas is 22.2 (53 MPG), and the cost of a liter of gas in the Midwest was $0.92 ($3.47 per gallon) in 2013, according to the Energy Information Administration. The American Automobile Association (AAA) provided an estimate of maintenance cost of 3.2 cents per kilometer (5.2 cents per mile) and insurance and tax costs of $3.98 per vehicle per day for small sedans (American Automobile Association 2013).
Vehicle depreciation was assumed to be based upon either time or distance, whichever usage was higher. This means that idle vehicles bear a depreciation cost even if not used. Vehicles were assumed to depreciate to their salvage value (10%) within 5 years or 400,000 kilometers, whichever comes first. Time-based depreciation is an important assumption because it drives the size of the minimum cost vehicle fleet; if vehicle fleet costs are assumed to vary only as a function of kilometers driven, then there is no performance disincentive for overly-large vehicle fleets.
Costs were reported as the sum total of all fleet vehicles costs per day, or total transit operator daily costs, as well as costs per passenger-vehicle kilometer.
Note that larger vehicle fleets have a number of ancillary benefits unrelated to costs. First, the larger the vehicle fleet, the smaller the wait time for passengers. Second, the larger the vehicle fleet, the lower the VKT because a nearby vehicle is more likely to be available for any given hailing passenger with a larger fleet. The only performance characteristic that declines with larger vehicle fleet size is system-level cost.
Calculating Vehicle Miles Traveled
The NTD provided the vehicle kilometers traveled for AAATA’s bus fleet on a typical weekday. Note that vehicle kilometers traveled includes mileage traveled while out of

Journal of Public Transportation, Vol. 20, No. 2, 2017 28
Comparing Automated Shared Taxis and Conventional Bus Transit for a Small City
service. Peak hour VKT for AAATA was estimated based upon the number of vehicles operating during the AM peak hour.
For the NetLogo simulations, every kilometer for each vehicle was tracked within the simulation. This straight-line distance total was then multiplied by the network inflation factor to derive an estimated total for network-based taxi VKT. Vehicle kilometers also were tracked by hour of the day.
Calculating Carbon Emissions
For AAATA, the annual fuel use reported to NTD was converted into a figure for a typical weekday. Since the AAATA system uses biodiesel, carbon emissions were estimated to be 85% of that typical for diesel fuel (US Department of Energy 2015). In fact, the carbon savings of using biofuels is controversial, and if previously unfarmed land is converted to the production of biofuels, significant increases in carbon emissions are possible (Searchinger et al. 2008; Gnansounou et al. 2009). However, the precise impacts of biodiesel on greenhouse gas (GHG) emissions are beyond the scope of this study, so the simplifying assumption from the US DOE was employed here.
Carbon emissions for the automated taxi system were calculated based upon total kilometers miles traveled per day and the fuel efficiency of the Toyota Prius fleet, multiplied by the carbon intensity of gasoline fuel. The carbon emissions associated with burning 1 liter of fuel was assumed to be 2.35 kilograms per liter (19.64 pounds per gallon) (US Energy Information Administration 2015).
In addition to in-use emissions, certain components of life-cycle emissions related to vehicle manufacture and use were included as well. Vehicle manufacture, tire use, maintenance, and insurance related GHG emissions were derived on a per-vehicle-kilometer basis from Chester and Horvath (2009). The more vehicles are driven per day, the more of the vehicle’s life-cycle of GHG emissions is consumed and accounted for.
Results: Performance Comparison of Conventional Bus Transit with Automated Taxi Fleets
The major results from the simulation and its comparison with the current Ann Arbor transit system are summarized in Table 2, including wait times, travel times, costs, VKT, and carbon emissions performance. Three systems were compared: the current Ann Arbor bus system, an automated single-rider taxi system, and an automated shared-ride taxi system.

Journal of Public Transportation, Vol. 20, No. 2, 2017 29
Comparing Automated Shared Taxis and Conventional Bus Transit for a Small City
Conventional Bus
Automated Taxis, Single-rider
Automated Taxis, Shared-ride
Service Performance
Fleet size 65 800 400
Average wait time 6.2–9.5 5.6 (0.11) 5.9 (0.04)
95th percentile wait time Unknown 16.1 (0.33) 13.9 (0.29)
Travel time 29.3* 9.1 (0.03) 16.1 (0.05)
Cost Performance
System cost per day $ 92,323 $ 73,777 ($ 175) $ 33,196 ($ 76)
% difference from bus system na -20.0% -64.0%
% difference from single-rider system na na -55.0%
Cost per passenger kilometer $ 0.794 $ 0.601 $0.271
Vehicle Miles Traveled Performance
Vehicle kilometers traveled 15,636 185,412 (1,784) 82,626 (773)
x difference from bus system na 11.9 5.3
% difference from single-rider system na na -54.5%
Peak-hour vehicle kilometers traveled 1,359 20,729 8,412
x difference from bus system na 15.3 6.2
Peak hour na 9–10 AM 9–10 AM
Greenhouse Gas Performance
Life-cycle carbon emissions per day (kg) 22,475 39,782 (383) 17,728 (166)
% difference from bus system na +77.0% -21.1%
Mean values are from 50 simulations. Standard deviations indicated in parentheses.*Total travel time including access and egress travel time from American Community Survey.
Wait and Travel Times
All of the automated taxi systems had wait time performance similar to the current Ann Arbor bus system, which was expected because fleet sizes were determined to match current average wait times. Both taxi systems had average wait times of around 6 minutes and 95th percentile wait times of around 15 minutes; the shared-ride taxi system had lower 95th percentile wait times because it could accommodate peak demand with greater flexibility via shared rides. Travel times for both automated taxi systems were shorter than the 29.3 minutes for the conventional bus system (US Census Bureau 2013), varying between a low of 9.1 minutes for the single-rider system and a higher 16.1 minutes for the shared-ride system. Passengers in a shared-ride system do not always travel directly to their destination and, thus, experience higher travel times than passengers in a single-rider system.
Daily System and Per-Kilometer Costs
The daily costs of automated taxi systems were lower than the current bus system, largely because of the removal of driver costs. The single-rider taxi system had 20.0%
TABLE 2.Performance Comparison of Transit System Alternatives

Journal of Public Transportation, Vol. 20, No. 2, 2017 30
Comparing Automated Shared Taxis and Conventional Bus Transit for a Small City
lower vehicle-associated costs, whereas the shared-ride system had 64.0% lower vehicle-associated costs. The shared-ride system obtained significant efficiencies in this model and had costs 55.0% lower than the single-rider system. Note that parking costs were not included in this analysis.
Assuming that the marginal costs of vehicle automation per vehicle is a one-time cost of $50,000/vehicle, the per-kilometer vehicular costs of an automated taxi system for the operator would be about 60.1 cents per kilometer for a single-rider system and about 27.1 cents per kilometer for a shared-ride system.
Vehicle Kilometers Traveled and Congestion Impacts
Automated taxi systems greatly multiply vehicle kilometers traveled relative to a transit system, especially for the peak period. For the single-rider taxi system, VKT were multiplied by 11.9 times over the course of a day and 15.3 times in a peak hour. The shared-ride system performed somewhat better, with a multiple of 5.3 for an entire day and of 6.2 for a peak hour. Link-specific congestion impacts were not obtainable from the current model because it did not incorporate the modeling of capacity and flows on individual network links. The shared-ride system reduced VKT over the single-rider system by 54.5%.
GHG Emissions
Although vehicle miles traveled were nearly 12 times greater for the single-rider automated taxi system, the carbon emissions were only 77.0% larger. This is due to the relative fuel efficiencies of the corresponding vehicle fleets—the taxi fleet obtained a fuel efficiency of 21.9 kilometers per liter (53 MPG) whereas the bus fleet obtained a fuel efficiency of 1.9 kilometers per liter (4.5 MPG).
Surprisingly, the shared-ride automated taxi system performed the best overall on carbon emissions, with 54.5% lower carbon emissions than the single-rider system and 21.1% lower life-cycle carbon emissions than the current bus system.
Sensitivity Analysis
To investigate the sensitivity of these results to specific assumptions, the impact of potential different vehicle types and different travel time diversion constraints were examined.
In addition to the Toyota Prius hybrid, other vehicles that were considered as potential fleet vehicles for the taxi system included other high-efficiency, compact, four-passenger vehicles from the 2013 vehicle cohort: 1) Honda Civic Hybrid, 2) Volkswagen Jetta Hybrid, and 3) Volkswagen Jetta Diesel. Analyzing alternative vehicles shed insight into how particular the results were to having a Toyota Prius vehicle fleet, especially for its GHG performance.

Journal of Public Transportation, Vol. 20, No. 2, 2017 31
Comparing Automated Shared Taxis and Conventional Bus Transit for a Small City
Daily system-level vehicle fleet costs varied little between vehicle types, as seen in Table 3. The least expensive costs were for the Honda Civic Hybrid, with daily costs of $73,993, and the most expensive costs were for the Volkswagen Jetta Diesel, for which costs were $80,764, a difference of 9.2%. Carbon emissions are much more sensitive to vehicle choice, as fuel efficiency is paramount to obtaining low GHG emission for such a high mileage system. Life-cycle carbon emissions per day were 16.0% greater for the Honda Civic Hybrid fleet, 36.3% higher for the Volkswagen Jetta Hybrid fleet, and 81.4% higher for the Volkswagen Jetta diesel fleet.
TABLE 3.Sensitivity Analysis for Fleet
Vehicle Types
Toyota Prius
Honda Civic Hybrid
Volkswagen Jetta Hybrid
Volkswagen Jetta Diesel
Daily cost,* single-rider $ 74,241 $ 73,993 $ 76,634 $ 80,764
Daily cost,* shared-ride $ 33,258 $ 33,147 $ 34,324 $ 36,174
Daily life-cycle carbon emissions** (kg), single-rider
39,782.9 46,157.6 54,238.3 72,163.9
Daily life-cycle carbon emissions** (kg), shared-ride
17,728.7 20,569.5 24,170.6 32,158.9
*Daily costs are sum of costs across entire vehicle fleet for typical weekday.*Daily Life-Cycle Carbon emissions are portion of life-cycle carbon emissions that can be attributed to one day of entire vehicle fleet’s operations.
Another key assumption in the analysis was the diversion travel time constraint. Shared-ride passengers must be prepared for a detour as long as 10 minutes beyond their direct-to-destination travel time under current assumptions. Alternative assumptions of a maximum 5-minute detour and a maximum 15-minute detour were tested to examine the sensitivity of the results to this assumption. As expected, as the potential travel time delay increased, mean travel times increased, vehicle occupancies increased, and total fleet vehicle kilometers traveled decreased. In particular, a limitation to a 5-minute detour reduced average vehicle occupancy from 1.95 to 1.55 and increased daily VKT by 21.2%, whereas increasing the potential detour time to 15 minutes increased average vehicle occupancy from 1.95 to 2.39 and decreased daily VKT by 8.9%.
TABLE 4.Sensitivity Analysis of Diversion Travel Time
Constraint
5-Minute Delay 10-Minute Delay 15-Minute Delay
Network VKT 100,328.4 82,805.8 75,400.0
Mean passenger travel time 13.7 16.1 18.2
Average vehicle occupancy* 1.55 1.95 2.39
Percent empty taxi distance 25.2% 20.1% 16.7%
Liters of gasoline used 7,165.7 5,914.2 5,385.3
In-use carbon emissions (kg) 16,863.8 13,918.5 12,673.7
Non-use carbon emissions (kg) 4,663.1 3,848.7 3,504.5
Total carbon emissions (kg) 21,526.9 17,767.2 16,178.1
*Average vehicle occupancy defined as total daily passenger minutes of movements divided by total daily vehicle minutes of movement.

Journal of Public Transportation, Vol. 20, No. 2, 2017 32
Comparing Automated Shared Taxis and Conventional Bus Transit for a Small City
Limitations
The shared-ride taxi system assumes that all passengers within the system must be willing to share rides. If such a system actually existed, there may be passengers who would be unwilling or uncomfortable with sharing rides or who would pay a premium to have a private travel experience (Zhang et al. 2015b). The willingness of passengers to share rides and their willingness to trade off the inconveniences of ridesharing for lower costs is both unknown and not well explored by current research.
The agent-based model was built on a simulated pattern of transit rider demand from bus stop to bus stop, not true origin-to-destination data. However, origin and destination locations were from actual bus boarding and alighting locations and were statistically representative of AAATA’s 2013 transit ridership. Since travel was modeled from bus stop to bus stop rather than from true origin to true destination, the opportunities for ridesharing were increased by this data generation method. On the other hand, a taxi-based transit system could also make use of official stops to efficiently aggregate rides. Also, the model does not account for the possibility that a convenient taxi-based transit system might attract additional passengers. In addition, both paratransit agencies and transportation network companies have to deal with a substantial share of no-shows, a factor not accounted for in this model. No-shows would, of course, increase vehicle miles traveled, costs, and system environmental impacts.
The model does not account for the University of Michigan bus system and its ridership due to differences in data availability between the two systems; however, the two systems have much cross-over ridership. In addition, University of Michigan buses typically have higher occupancy and so would be more costly and inefficient to replace entirely with a taxi-only system than the AAATA system. However, it is interesting to note that the University of Michigan transit system is currently exploring modifying its system to a combination of high-capacity buses and demand-responsive vehicles to more efficiently meet the dispersed spatial and temporal pattern of transit demand on campus.
Many current models of automated taxi systems assume that taxis rebalance to areas of high demand when not in use (Fagnant and Kockelman 2014; Zhang et al. 2015a; Spieser et al. 2014). This is a likely behavior that reduces average passenger wait times, but at the cost of increasing total system VKT (Zhang et al. 2015a). Since the focus of this study was on the environmental performance of such automated taxi systems relative to the current bus system, no vehicle repositioning was included in the model. This increased average and 95th percentile passenger wait times, but decreased system VKT, energy use, and carbon emissions.
The US Environmental Protection Agency (EPA) reported fuel efficiencies of vehicles often are not obtainable in real-world conditions. Consumer Reports indicated that the Toyota Prius obtains closer to 15.9 kilometers per liter (37 MPG) rather than the 22.5 kilometers per liter (KPL) reported by the EPA (Consumer Reports 2013). Under these more conservative assumptions, automated taxi systems would have 43% higher

Journal of Public Transportation, Vol. 20, No. 2, 2017 33
Comparing Automated Shared Taxis and Conventional Bus Transit for a Small City
carbon emissions than current projections. Once again, it should be noted that the fuel efficiency of a taxi fleet is crucial to obtaining the possibility of improved environmental performance. However, it is likely that automated taxis would be operated in a manner that maximized fuel efficiency to reduce operational costs.
Discussion: Automated Taxis Will Reshape How Transit Functions
Automated taxi systems performed better on several metrics and worse on a few in comparison with the conventional bus system for serving the transit riders of Ann Arbor. According to the agent-based models implemented here, automated taxi systems would provide similar wait times, superior travel times, and lower daily and per-passenger-kilometer costs than the current conventional bus system. On the other hand, automated taxi fleets would greatly increase the system’s VKT, especially during the peak period. Environmentally, the single-rider system would generate increased carbon emissions, but the shared-ride system would actually decrease carbon emissions relative to the current bus system, if EPA-reported fuel efficiencies are actually obtainable in operation.
The congestion impacts of a fleet of automated taxis are both uncertain and highly context-dependent. An increase in vehicle miles traveled does not necessarily lead to a major increase in congestion, unless a particular facility is operating at or near its capacity. An automated taxi fleet of 400 vehicles is small in comparison with the large number of private vehicles operating on Ann Arbor roadways, with more than 128,000 private vehicles used for commuting in Washtenaw County (US Census Bureau 2013). Nevertheless, only a few additional vehicles could greatly increase congestion during peak hours on near-capacity roadways. Further complicating matters, automated vehicle fleets could re-route themselves or otherwise coordinate in ways that might relieve congestion. Beyond the forecast for additional vehicle miles of travel, the location-specific congestion impacts are beyond the scope of this study.
The benefits of ridesharing, at least in concept, are substantial. With universal ridesharing, an automated taxi system could significantly reduce its costs and its environmental impacts, with both improving by slightly more than 50%. The energy efficiency of a shared-ride system is due to both its efficient vehicle fleet and the reduction in VKT due to high rates of ridesharing. The average occupancy over the course of a day for the shared-ride system was 1.95 passengers (although some of this occupancy was created by taking passengers on detours they would prefer not to take), whereas the average occupancy for the single-rider system was just 0.66. The advantages associated with ridesharing increase with urban intensity, because the opportunities for ridesharing occur in areas in which travel demand is concentrated. The cost of ridesharing, on the other hand, was an increase from about a 7-minute travel time, on average, for the single-rider system to a 16-minutes travel time for the shared-ride system, plus the inconvenience of having to share a vehicle. The ride-sharing opportunity was increased because origins and destinations were concentrated at existing bus stops, but a future taxi-based transit system might also have designated stops to efficiently serve passengers.

Journal of Public Transportation, Vol. 20, No. 2, 2017 34
Comparing Automated Shared Taxis and Conventional Bus Transit for a Small City
Current transit services are substantially subsidized. These subsidies are justified, in part, on the grounds of providing a reasonable level of mobility to those who cannot afford to or otherwise cannot drive automobiles. But under an automated taxi or other demand-responsive system, many of these same populations could be served potentially more cost-effectively and with improved levels of service. The service provided by such systems could be an improvement over current bus transit by being more point-to-point, by reducing wait times, and by providing reduced in-vehicle travel times.
These results suggest that once shared automated taxi or ride hailing services become viable technologically and economically (i.e., a per-vehicle automation cost of less than $50,000), the primary function of conventional, large-vehicle transit services will be on servicing large volumes of peak-hour demand and providing congestion relief. Although this study was for just one small city, the conclusions regarding the viability of automated taxis as a transit mode likely generalizes for many small and medium cities and suburbs in the United States in which densities are relatively low and current transit service is typically infrequent. Indeed, the city of Ann Arbor, with a large university campus and student population, has similar or better occupancy rates than many similar-size cities.
The regulatory and coordination implications of new automated taxi modes were beyond the scope of this study; however, it may be productive to start the discussion. Once automated taxi modes become prevalent, they may be required to provide universal service, including to those who are not technologically-savvy and/or have a disability. Even if automated taxi services are provided by the private sector, if these services become a substitute for current public transit, then they must be required to meet the transportation needs of the entire cross-section of the population.
Also, it may be desirable to limit the use of automated taxis or other ride-hailing services in certain times and places to maintain a viable ridership for high-capacity transit lines. Whereas automated taxis may be able to serve certain kinds of travel demand more flexibly than conventional transit, it would not make sense to have these systems competing directly with existing high-capacity transit lines. As seen in this study, the over-use of automated taxis has the potential to exacerbate peak-hour congestion; perhaps ridesharing could be required during peak hours, or perhaps automated taxis could be forbidden from using certain congested routes during peak periods. The policy questions surrounding this potential new mode are complex.
Conceptually, automated taxis and large-vehicle, high-capacity transit have the potential to work together in a coordinated fashion that takes advantage of the benefits of both. The possibility for such coordination is just beginning to be explored in the research literature (Maheo et al. 2016). Certainly, such coordination will involve new institutional relationships as well as new technical methods for managing passenger demand in real time.
As mentioned before, this simulation reflects how an automated taxi system might start in a small city. The first population to be served by such an automated taxi system likely would be those who currently use transit, because they have already demonstrated a willingness to use non-private modes. An automated taxi system theoretically could

Journal of Public Transportation, Vol. 20, No. 2, 2017 35
Comparing Automated Shared Taxis and Conventional Bus Transit for a Small City
serve this population with decreased costs and increased travel convenience. Once such a fleet was up and operating, it most likely would attract additional ridership, especially once its performance was demonstrated and its reliability proven. Those with destinations within the primary service area (under the assumption that such a system must serve a limited area to be efficient) might increasingly see such automated taxi systems as an attractive alternative to driving their own car and parking; some might even forego car ownership itself. Therefore, it is likely that once such an automated taxi transit system was established, it would grow its market share over time and eventually start to serve part of the market that currently relies upon privately-owned vehicles.
Conclusion
This study compared the performance of hypothetical automated taxi transit systems to the Ann Arbor Area Transportation Authority bus system with metrics for service performance, costs, vehicle kilometers traveled, and carbon emissions. A shared-ride automated taxi system performed favorably in comparison to the current bus transit system by providing comparable wait times, shorter travel times, significantly lower costs per day and per passenger kilometer, and somewhat lower carbon emissions. The bus transit system performed better on total vehicle kilometers traveled, which is significant because a switch from a bus system to an automated taxi system could generate new traffic congestion, with peak-hour vehicle kilometers traveled growing by a factor of 6 times. A single-rider automated taxi system performed better than the current transit system with regard to its travel times and costs, but worse with respect to carbon emissions and much worse with respect to peak-hour vehicle kilometers traveled.
These results suggest that a shared-ride automated taxi system could serve as a viable and efficient transit system for a small city, with a service areas similar to current transit service areas. Even if the cost of automation was as high as $50,000 per vehicle, the costs of such a system would be competitive with current bus transit services. A shared-ride automated taxi system could initially be set up to serve current transit ridership, with the expectation that when its service is proven, the ridership likely would grow and shift mode choice for some people who currently rely upon private vehicles for travel.
The main drawback to a shared-ride automated taxi system would be the increase in traffic congestion resulting from a growth in system peak-hour VKT. Potential solutions to this growth in peak-hour congestion might include coordination of automated taxi systems with large-vehicle transit to efficiently manage heavy peak-hour flows. Other solutions could involve high occupancy requirements for such taxis or limitation of certain critical roadway segments to higher-capacity modes during peak hours (i.e., HOV lanes).
If automated taxi systems become widespread, the role of conventional, large-vehicle transit is likely to shift. The advantage of conventional large-vehicle transit relative to automated taxis is its ability to manage peak-hour flows and limit congestion (or provide an alternative to congested travel) during peak periods. The best transit systems

Journal of Public Transportation, Vol. 20, No. 2, 2017 36
Comparing Automated Shared Taxis and Conventional Bus Transit for a Small City
of the future, it would seem, would take advantage of both the flexibility of automated taxis and the capacity management capabilities of large-vehicle transit within a coordinated system.
Although it may be difficult to imagine the transition steps towards an automated taxi system, the social and economic benefits are potentially high; it is unknown when such a system might overcome the technical and regulatory barriers required for providing an automated vehicle ride-hailing service, but several companies such as Uber, Volvo, Ford, Google, and GM are actively working on developing such systems as part of their current research and development activities (Chafkin 2016; Stoll 2016; Boudette 2016; Grisold 2016). The research here indicates that the performance of a shared-ride automated taxi system could meet vital mobility, environmental, and economic needs. Nevertheless, such automated taxi systems will require forward-looking policy frameworks to ensure that the benefits to passengers are maximized while their potential negative externalities of increased VKT and greater congestion are mitigated.
References
American Automobile Association. 2013. “Your Driving Costs.”
Ann Arbor Area Transportation Authority. 2014a. “Ann Arbor Area Transportation Authority Boarding Data.” Ann Arbor, Michigan.
Ann Arbor Area Transportation Authority. 2014b. “Ride Guide.” Passenger Schedule. Ann Arbor, Michigan.
Bischoff, Joschka, and Michal Maciejewski. 2016. "Simulation of City-wide Replacement of Private Cars with Autonomouos Taxis in Berlin." Procedia Computer Science, 83: 237-244.
Boudette, Neal E. 2016. “Ford Promises Fleets of Driverless Cars within Five Years.” New York Times, August 16. http://www.nytimes.com/2016/08/17/business/ford-promises-fleets-of-driverless-cars-within-five-years.html?_r=2.
Bowman, Larry A., and Mark A. Turnquist. 1981. “Service Frequency, Schedule Reliability and Passenger Wait Times at Transit Stops.” Transportation Research Part A: General 15 (6): 465–71. doi:10.1016/0191-2607(81)90114-X.
Burns, Lawrence D., William C Jordan, and Bonnie A. Scarborough. 2013. “Transforming Personal Mobility.” The Earth Institute, Columbia University, New York.
Chafkin, Max. 2016. “Ubers’ First Self-Driving Fleet Arrives in Pittsburgh This Month.” Bloomberg, August 18. http://www.bloomberg.com/news/features/2016-08-18/uber-s-first-self-driving-fleet-arrives-in-pittsburgh-this-month-is06r7on.
Chester, Mikhail, and Arpad Horvath. 2009. “Life-Cycle Energy and Emissions Inventories for Motorcycles, Diesel Automobiles, School Buses, Electric Buses, Chicago Rail, and New York City Rail.” Berkeley, CA. https://escholarship.org/uc/item/6z37f2jr.
Ciari, Francesco, and Benno Bock. 2014. “Modeling Station-Based and Free-Floating Carsharing Demand : A Test Case Study For Berlin , Germany.” 93rd Annual

Journal of Public Transportation, Vol. 20, No. 2, 2017 37
Comparing Automated Shared Taxis and Conventional Bus Transit for a Small City
Meeting of the Transportation Research Board, 13. Washington, DC. file:///C:/Users/louismerlin/Documents/Research/_In_Progress/Automated Vehicles as Transit/Ciari Bock 2014 - Modeling Free Floating and Station Based Carsharing.pdf.
Consumer Reports. 2013. “Why You Might Not Be Getting the Efficiency Promised.” Consumer Reports, August.
Fagnant, Daniel J., and Kara M. Kockelman. 2014. “The Travel and Environmental Implications of Shared Autonomous Vehicles, Using Agent-Based Model Scenarios.” Transportation Research Part C: Emerging Technologies 40 (March): 1-13. doi:10.1016/j.trc.2013.12.001.
Fagnant, Daniel J, Kara M Kockelman, and Prateek Bansal. 2015. “Operations of Shared Autonomous Vehicle Fleet for Austin, Texas, Market.” Transportation Research Record, 2536: 98-106.
Fan, Wei (David), and Randy B. Machemehl. 2009. “Do Transit Users Just Wait for Buses or Wait with Strategies?” Transportation Research Record, 2111(1): 169–76. doi:10.3141/2111-19.
Federal Transit Administration. 2014. “National Transit Database.” Washington, DC. http://www.transit.dot.gov/ntd.
Feigon, S., and C. Murphy. 2016. "Shared Mobility and the Transformation of Public Transit," TCRP Report 188. http://nap/edu/23578.
Gnansounou, E., A. Dauriat, J. Villegas, and L. Panichelli. 2009. “Life Cycle Assessment of Biofuels: Energy and Greenhouse Gas Balances.” Bioresource Technology, 100(21): 4919–30. doi:10.1016/j.biortech.2009.05.067.
Grisold, Alison. 2016. “Self-Driving Taxis from General Motors and Lyft.” Quartz, May 5. http://qz.com/677394/self-driving-taxis-from-general-motors-and-lyft-will-hit-the-road-within-a-year/.
Levine, Jonathan, Moira Zellner, Yoram Shiftan, M. Arquero de Alarcon, and A. Diffenderfer. 2013. “Effects of Automated Transit, Pedestrian and Bicycling Facilities on Urban Travel Patterns.” Ann Arbor, MI.
Liang, Xiao, Gonçalo Homem de Almeida Correia, and Bart van Arem. 2016. “Optimizing the Service Area and Trip Selection of an Electric Automated Taxi System Used for the Last Mile of Train Trips.” Transportation Research Part E: Logistics and Transportation Review, 93: 115–29. doi:10.1016/j.tre.2016.05.006.
Maheo, A., P. Kilby, and P. Van Hentenryck. 2016. “Benders Decomposition for the Design of a Hub and Shuttle Public Transit System.” https://pascalvanhentenryck.engin.umich.edu/wp-content/uploads/sites/228/2016/01/BusPlus.pdf.
Martinez, Luis M., and Jose M Viegas. 2016a. “Concepts and Impacts of New Urban Shared Mobility Alternatives: An Agent-Based Simulation Model for the City of Lisbon, Portugal.” Transportation Research Board 95th Annual Meeting, 16.

Journal of Public Transportation, Vol. 20, No. 2, 2017 38
Comparing Automated Shared Taxis and Conventional Bus Transit for a Small City
Martinez, Luis M., and Jose M. Viegas. 2016b. “Concepts and Impacts of New Urban Shared Mobility Alternatives: An Agent-based Simulation Model for the City of Lisbon, Portugal." Transportation Research Board 95th Annual Meeting: 20.
Nustats. 2012. “Southeast Michigan Council of Governments Regional On-Board Transit Survey.”
Searchinger, Timothy, Ralph Heimlich, Richard A. Houghton, Fengxia Dong, Amani Elobeid, Jacinto Fabiosa, Simla Tokgoz, Dermot Hayes, and Tun-Hsiang Yu. 2008. “Use of US Croplands for Biofuels Increases Greenhouse Gases through Emissions from Land-Use Change.” Science, 319 (5867): 1238-40.
Shaheen, Susan, Nelson Chan, Apaar Bansal, and Adam Cohen. 2015. “Shared Mobility. Definitions, Industry Developments, and Early Understanding." Berkeley, CA.
Shepherd, Simon, and Helen Muir. 2011. “CityMobil D2.3.2 Strategic Modelling Results.” http://www.citymobil-project.eu/.
Spieser, Kevin, Kyle Treleaven, Rick Zhang, Emilio Frazzoli, Daniel Morton, and Marco Pavone. 2014. “Toward a Systematic Approach to the Design and Evaluation of Automated Mobility-on-Demand Systems A Case Study in Singapore.” Cambridge, MA. http://hdl.handle.net/1721.1/82904.
Stoll, John D. 2016. “Volvo, Uber to Jointly Develop Autonomous Sport Utility Vehicles.” Wall Street Journal, August 18. http://www.wsj.com/articles/volvo-uber-to-jointly-develop-autonomous-sport-utility-vehicles-1471518577.
US Census Bureau. 2013. “American Community Survey (5-Year Estimates).”
US Department of Energy. 2015. “Biodiesel.” Energy Efficiency and Renewable Energy. http://www.fueleconomy.gov/feg/biodiesel.shtml.
US Energy Information Administration. 2015. “Frequently Asked Questions.” http://www.eia.gov/tools/faqs/faq.cfm?id=307&t=11.
Woodman, Spencer. 2016. “Welcome to Uberville.” The Verge, September. http://www.theverge.com/2016/9/1/12735666/uber-altamonte-springs-fl-public-transportation-taxi-system.
Zhang, Wenwen, Subhrajit Guhathakurta, Jinqi Fang, and Ge Zhang. 2015a. “Exploring the Impact of Shared Autonomous Vehicles on Urban Parking Demand: An Agent-Based Simulation Approach.” Sustainable Cities and Society. doi:10.1016/j.scs.2015.07.006.
Zhang, W., S. Guhathakurta, J. Fang, and G. Zhang. 2015. "Exploring the Impact of Shared Autonomous Vehicles on Urban Parking Demand: An Agent-based Simulation Approach." Sustainable Cities and Society, 19: 34-45.

Journal of Public Transportation, Vol. 20, No. 2, 2017 39
Comparing Automated Shared Taxis and Conventional Bus Transit for a Small City
About the Author
Louis A. Merlin, Ph.D., AICP ([email protected]) is an Assistant Professor of Urban Planning at Florida Atlantic University. He holds a B.A. in Mathematics with Honors from Yale University and conducted National Science Foundation-funded graduate work towards master’s degrees in Operations Research and City and Regional Planning from the Georgia Institute of Technology. He earned his doctoral degree in City and Regional Planning from the University of North Carolina, with research work funded by the Royster Society of Fellows. His current research work concerns how to better integrate transportation and land use planning through the application of accessibility-based planning tools, as well as the implications of automated vehicles for transportation systems.