comparing alternative home delivery models for e-grocery...
TRANSCRIPT

Comparing alternative home delivery models
for e-grocery business
Mikko Punakivi
Dissertation for the degree of Doctor of Science in Technology to be
presented with due permission for public examination and debate in auditorium
Luna at Helsinki University of Technology, Department of Industrial Engineering
and Management, Finland on the 7th of June, 2003 at 12 o’clock noon.
1
AbstractRecently, last mile logistics has been identified as one of the most important factors
in developing consumer direct business concepts. Research and experience have
revealed that the goods reception mode is one of the key factors when developing
cost-efficient home delivery operations. This dissertation identifies, models, and
analyses existing and emerging e-grocery home delivery operation models. The cost
levels of various home delivery models offering attended and unattended reception
are compared, and their feasibility evaluated using real point-of-sale data and a
vehicle routing tool. The cost level of home delivery service is also compared to the
current costs of a household customer visiting a supermarket using his/her own car.
In addition, the environmental effects of the different home delivery models are
analysed.
According to the results, home delivery transportation costs using the shared
reception box concept are 55-66% lower than those of the current standard home
delivery model with attended reception and 2-hour delivery time windows. This cost
reduction alone justifies the two-to-five-year payback period of the investment
required, even if there is only a fairly small number of deliveries per day. Compared
similarly, using customer-specific reception boxes in home delivery operations leads
to a cost reduction of 44-53%. Because of the high investments involved in
customer-specific reception boxes, the payback period, based on the cost savings, is
6-13 years. This requires customer involvement in investment. These results show
that the most cost-efficient e-grocery home delivery model is based on unattended
reception, which enables the optimal routing and scheduling of delivery vehicles. It
would also be the best solution when considering the environmental aspects. Usage
of e-grocery home delivery services offers a notable potential for traffic reduction
when compared to the situation in which customers visit the shop using their own
cars. In the selected test area, the reduction would be between 54 and 93 per cent,
depending on the home delivery model used. However, the total traffic reduction
and reduction of traffic emissions depends greatly on the e-grocery market share in
the future.
Keywords: electronic grocery shopping, home shopping, home delivery, last mile
problem, transportation, home delivery costs, unattended reception, reception box,
delivery box, shared reception box
2
AcknowledgementsFirst and foremost I would like to thank my supervisor Professor Kari Tanskanen
and instructor Docent Jan Holmström for their time and valuable pieces of advice
during the research and writing process. Especially professor Tanskanen offered his
help and support during the critical "last mile" in this process. Additionally, I would
like to thank the pre-examiners of this dissertation Professors Michael Browne and
Aimo Inkiläinen. Their feedback has been valuable and the quality of the dissertation
has been improved considerably based on their comments.
I would also like to take this opportunity to thank all my colleagues and other people
that have helped me through this learning process. Since this dissertation is a binding
story based on several individual articles, I owe a special thanks to my friends and co-
authors: Kari Tanskanen, Jan Holmström, Hannu Yrjölä, Vesa Kämäräinen, Juha
Saranen, Jaana Auramo, Anna Aminoff, Hanne Siikavirta, Mikko Kärkkäinen, and
Lassi Linnainen. During the research work and also in spare time I have spent some
unforgettable moments with you. Additionally, I wish to thank my parents, relatives
and friends for their encouragement and support during the last four years.
Other contributors to this dissertation are of course the commercial partners in the
Ecomlog research program providing business critical case data, experience, and
advice during the work. I would like to thank all the commercial partners and Tekes -
the national technology agency- for providing the financial foundation for the
Ecomlog research program. I'm also very grateful to Kuorma-autoliikenteen Volvo
Säätiö, Tekniikan edistämissäätiö, Henry Fordin Säätiö and the Doctoral Program in
Industrial Engineering and Management for the financial support that enabled
finalising this dissertation.
My warmest thanks I owe to the world’s best wife Pia and my lovely daughter Ella
for their supportive and understanding attitude towards my work and for offering me
great moments in private life.
Espoo 15th May 2003
Mikko Punakivi
3
CONTENTS
ABSTRACT.....................................................................................................................................1
ACKNOWLEDGEMENTS............................................................................................................2
LIST OF FIGURES AND TABLES ..............................................................................................5
PAPERS ...........................................................................................................................................6
DEFINITIONS ................................................................................................................................7
1 INTRODUCTION .................................................................................................................9
1.1 REVIEW OF CURRENT E-GROCERY OPERATIONS ...................................................................9
1.2 RESEARCH OBJECTIVES AND RESEARCH SCOPE..................................................................16
1.3 RESEARCH ENVIRONMENT .................................................................................................17
1.4 OUTLINE OF THE DISSERTATION ........................................................................................24
2 LITERATURE REVIEW ...................................................................................................25
2.1 LOGISTICS AND SUPPLY CHAIN MANAGEMENT...................................................................25
2.2 TRADITIONAL GROCERY SUPPLY CHAIN.............................................................................28
2.2.1 Traditional grocery supply chain structure.............................................................28
2.2.2 Development trends in the traditional grocery supply chain ..................................29
2.2.3 The grocery market in Finland................................................................................33
2.2.4 The consumer in the traditional grocery supply chain ............................................35
2.3 E-GROCERY SUPPLY CHAIN................................................................................................36
2.3.1 e-Grocery supply chain structure............................................................................36
2.3.2 e-Grocery operations ..............................................................................................38
2.3.3 Motivations for e-grocery........................................................................................41
2.4 MODELLING IN LOGISTICS DECISION-MAKING....................................................................44
2.5 BACKGROUNDS FOR MODELLING HOME DELIVERY OPERATIONS........................................47
2.5.1 General....................................................................................................................47
2.5.2 Home delivery market .............................................................................................48
2.5.3 Key elements in home delivery ................................................................................49
2.5.4 Vehicle routing ........................................................................................................50
2.5.5 The possible effects of home delivery services on road traffic ................................53
3 RESEARCH HYPOTHESES .............................................................................................57
3.1 HYPOTHESES .....................................................................................................................57
3.2 OVERVIEW OF THE SEPARATE PAPERS................................................................................58
4
4 RESEARCH METHODOLOGY .......................................................................................61
4.1 RESEARCH APPROACH .......................................................................................................61
4.2 RESEARCH PROCESS AND DATA .........................................................................................65
4.3 MODELLING TOOL USED ....................................................................................................69
4.4 DISCUSSION OF THE RESEARCH APPROACH SELECTED .......................................................70
5 REVIEW OF THE RESULTS ...........................................................................................72
5.1 INTRODUCTION ..................................................................................................................72
5.2 COST ANALYSIS OF THE OPERATIONAL HOME DELIVERY MODELS......................................73
5.2.1 Home delivery costs compared to the current situation ..........................................73
5.2.2 Costs of attended vs. unattended reception in home delivery..................................76
5.2.3 Validating the cost analysis of the home delivery models .......................................77
5.3 ECONOMICAL FEASIBILITY OF UNATTENDED RECEPTION CONCEPTS ..................................81
5.3.1 Analysing the customer-specific solutions for unattended reception ......................81
5.3.2 Analysing the shared reception box concept ...........................................................85
5.4 EFFECTS OF HOME DELIVERY SERVICES ON TRAFFIC AND THE ENVIRONMENT ...................87
6 DISCUSSION.......................................................................................................................94
6.1 SUMMARY AND MANAGERIAL CONCLUSIONS.....................................................................94
6.2 CONTRIBUTION AND RELEVANCE OF THE RESEARCH .........................................................98
6.3 VALIDITY AND RELIABILITY OF THE RESEARCH ...............................................................101
6.4 LIMITATIONS OF THE RESEARCH ......................................................................................103
6.5 AGENDA FOR FURTHER RESEARCH...................................................................................106
REFERENCES............................................................................................................................109
APPENDIX I ...............................................................................................................................131
APPENDIX II..............................................................................................................................132
APPENDIX III ............................................................................................................................135
APPENDIX IV.............................................................................................................................138
APPENDIX V ..............................................................................................................................139
APPENDIX VI.............................................................................................................................140
5
List of Figures and TablesFIGURE 1 CUSTOMER-SPECIFIC RECEPTION BOX (HOLLMING). ..........................................................7
FIGURE 2 DELIVERY BOX WITH A SECURE DOCKING MECHANISM (HOMEPORT, 2002).......................8
FIGURE 3 SHARED RECEPTION BOX UNIT (HOLLMING).......................................................................8
FIGURE 4 LOGISTICS NETWORK. ......................................................................................................26
FIGURE 5 TRADITIONAL GROCERY SUPPLY CHAIN STRUCTURE (YRJÖLÄ, 2001). .............................28
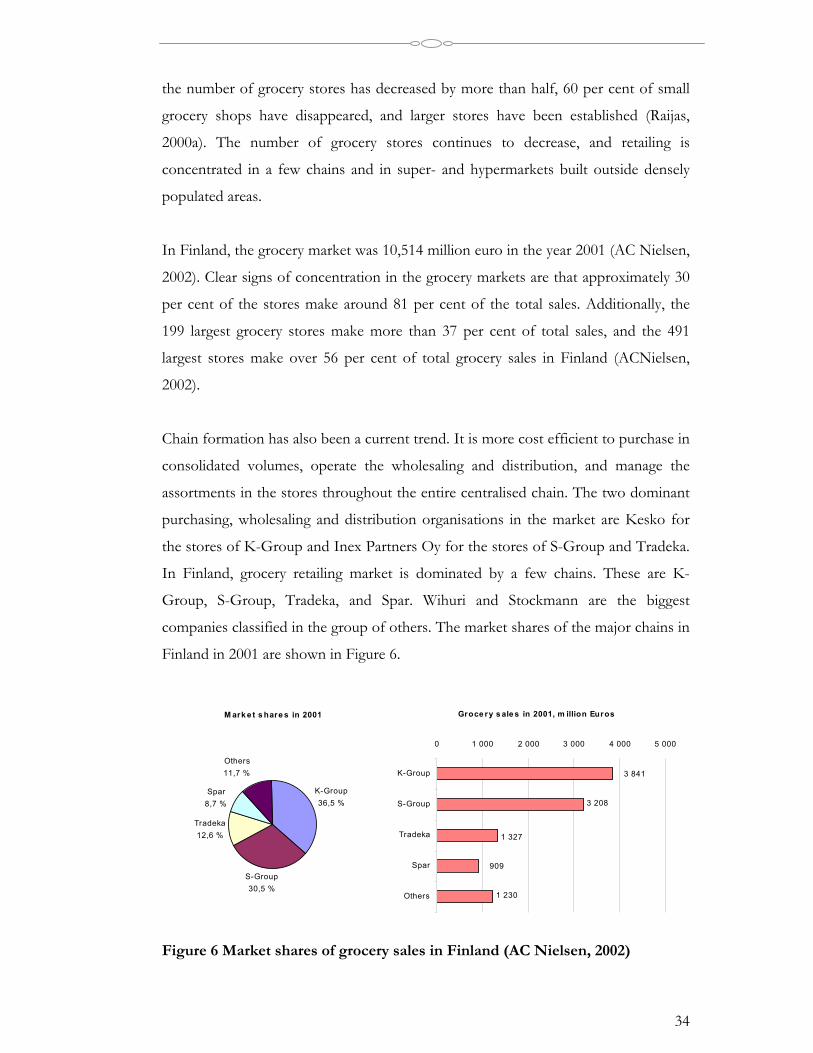
FIGURE 6 MARKET SHARES OF GROCERY SALES IN FINLAND (AC NIELSEN, 2002) .........................34
FIGURE 7 SIMPLIFIED STRUCTURE OF THE E-GROCERY SUPPLY CHAIN (YRJÖLÄ, 2001). ..................37
FIGURE 8 ROAD TRAFFIC IN FINLAND 2000 (VTT, 2002). ...............................................................56
FIGURE 9 POSITIONING OF THE CONSTRUCTIVE APPROACH (KASANEN ET AL., 1993) .....................63
FIGURE 10 ELEMENTS OF CONSTRUCTIVE RESEARCH (KASANEN ET AL., 1993)..............................64
FIGURE 11 THE INDEXED TRANSPORTATION COSTS OF VARIOUS HOME DELIVERY MODELS. ............74
FIGURE 12 AVERAGE DISTANCE DRIVEN PER ORDER AND NUMBER OF DELIVERIES PER HOUR USING
DIFFERENT HOME DELIVERY MODELS (PUNAKIVI & SARANEN, 2001)....................................76
FIGURE 13 THE AVERAGE WORKING TIME PER STOP AND THE NUMBER OF VEHICLES NEEDED. ........77
FIGURE 14 THE OPERATIONAL COST LEVELS OF HOME DELIVERY MODELS (26 EURO/H) (PUNAKIVI &
TANSKANEN, 2002)................................................................................................................78
FIGURE 15 THE DELIVERIES-PER-HOUR PERFORMANCE OF THE HOME DELIVERY MODELS. ..............79
FIGURE 16 SCREEN SHOT PICTURE OF THE ROUTE OF THE SECOND TEST, WITH 22 CUSTOMER
ORDERS. .................................................................................................................................80
FIGURE 17 PAYBACK PERIOD FOR THE INVESTMENT IN UNATTENDED RECEPTION SOLUTIONS
COMPARED TO HOME DELIVERY SERVICE WITH A ONE-HOUR DELIVERY TIME WINDOW
(PUNAKIVI ET AL., 2001). .......................................................................................................83
FIGURE 18 PAYBACK PERIOD FOR A SHARED RECEPTION BOX UNIT WITH A CAPACITY OF 24 LOCKERS
(PUNAKIVI & TANSKANEN, 2002). .........................................................................................85
FIGURE 19 AVERAGE DISTANCE DRIVEN PER ORDER AND AVERAGE NUMBER OF ORDERS PER ROUTE
(SIIKAVIRTA ET AL., 2003). ....................................................................................................88
FIGURE 20 PRE-SELECTION TOOL FOR SELECTING APPROPRIATE HOME DELIVERY MODEL...............96
FIGURE 21 MAP OF THE SELECTED TEST AREA. ..............................................................................136
TABLE 1 RELATIONS OF THE SEPARATE ARTICLES AND THE HYPOTHESIS. .......................................60
TABLE 2 EMISSION FACTORS (SIIKAVIRTA ET AL., 2003).................................................................89
TABLE 3 ANALYSIS RESULTS (SIIKAVIRTA ET AL., 2003).................................................................89
TABLE 4 REDUCTION POTENTIALS IN DISTANCE DRIVEN..................................................................90
TABLE 5 SUMMARY OF RESULTS IN THE DISSERTATION. ..................................................................94
TABLE 6 DESCRIPTION OF THE CASES IN THE ANALYSIS (PUNAKIVI & SARANEN, 2001). ..............138
TABLE 7 DESCRIPTION OF THE HOME DELIVERY MODELS (PUNAKIVI & TANSKANEN, 2002). .......139
TABLE 8 DESCRIPTION OF THE MODELLED SOLUTIONS (PUNAKIVI ET AL., 2001). .........................140
6
Papers
Paper I Auramo, J., Aminoff, A., Punakivi, M. (2002), "Research agenda for
e-business logistics -based on professional opinions", International
Journal of Physical Distribution and Logistics Management, Vol.32, Iss.7,
pp.513-531.
Paper II Punakivi, M. and Saranen, J. (2001), "Identifying the success factors
in e-grocery home delivery " International Journal of Retail and
Distribution Management, Vol. 29, Iss. 4, pp. 156-163.
Paper III Punakivi, M., Yrjölä, H. and Holmström, J. (2001), "Solving the Last
Mile Issue: Reception box or Delivery box" International Journal of
Physical Distribution and Logistics Management, Vol. 31, Iss. 6, pp. 427-439
Paper IV Siikavirta, H., Punakivi, M., Kärkkäinen, M. and Linnainen, L.
(2003), "Effects of e-commerce on greenhouse gas emissions case:
home delivery service", Journal of Industrial Ecology, Vol.6, No. 2, pp.83-
97
Paper V Punakivi, M. and Tanskanen, K. (2002), "Increasing the cost
efficiency in e-fulfilment by using shared reception boxes",
International Journal of Retail and Distribution Management, Vol.30, Iss. 10,
pp.498-507.
7
Definitionse-Grocery An abbreviation of online grocery shopping, or electronic
grocery shopping also referred to as EGS.
Home delivery Home delivery model is defined by the e-grocery servicemodel provider. Characteristics of the service offered include
delivery hours, for example from 8 a.m. to 10 p.m. onweekdays. Additionally, if attended reception is used, there aredelivery time windows, for example 2-hour time windowsduring the delivery hours.
Attended reception Attended reception is the traditional home delivery model,where customers wait at home to receive the delivery. (see:Home delivery model)
Unattended reception Using facilities enabling unattended reception, the customer isrelieved of the need to receive the goods ordered. Unattendedreception may be based on reception boxes, delivery boxes,shared reception boxes, or collection and delivery points(CDP).
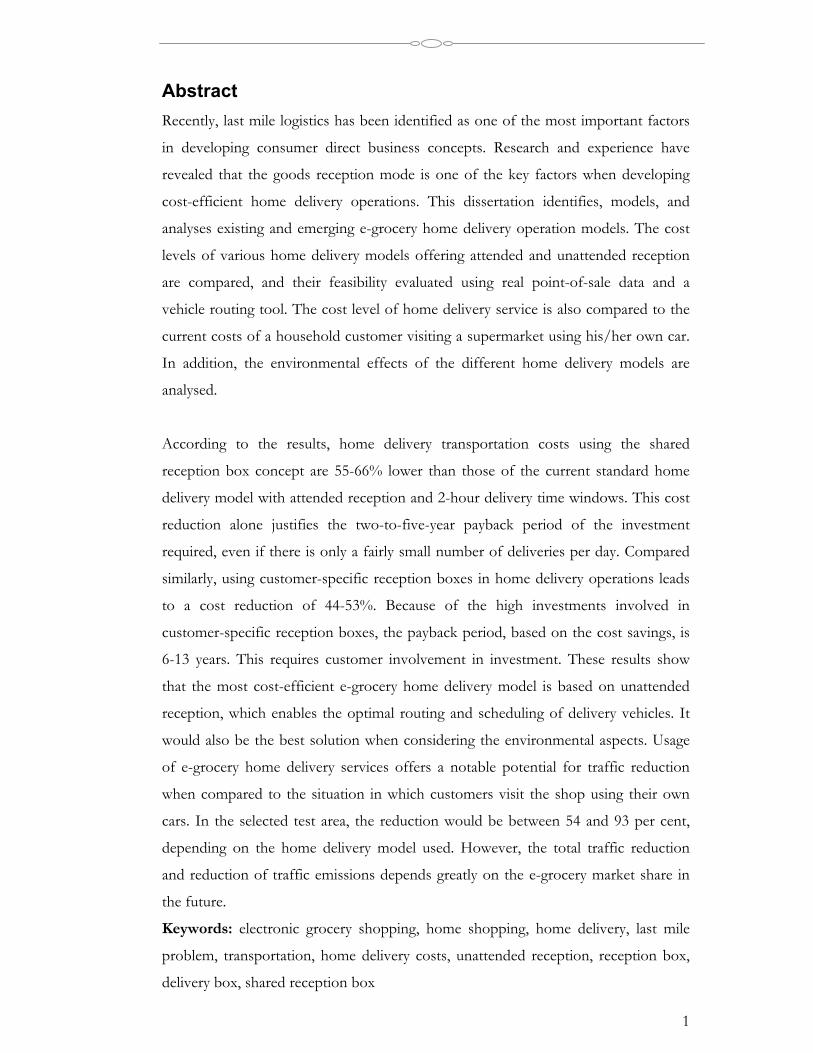
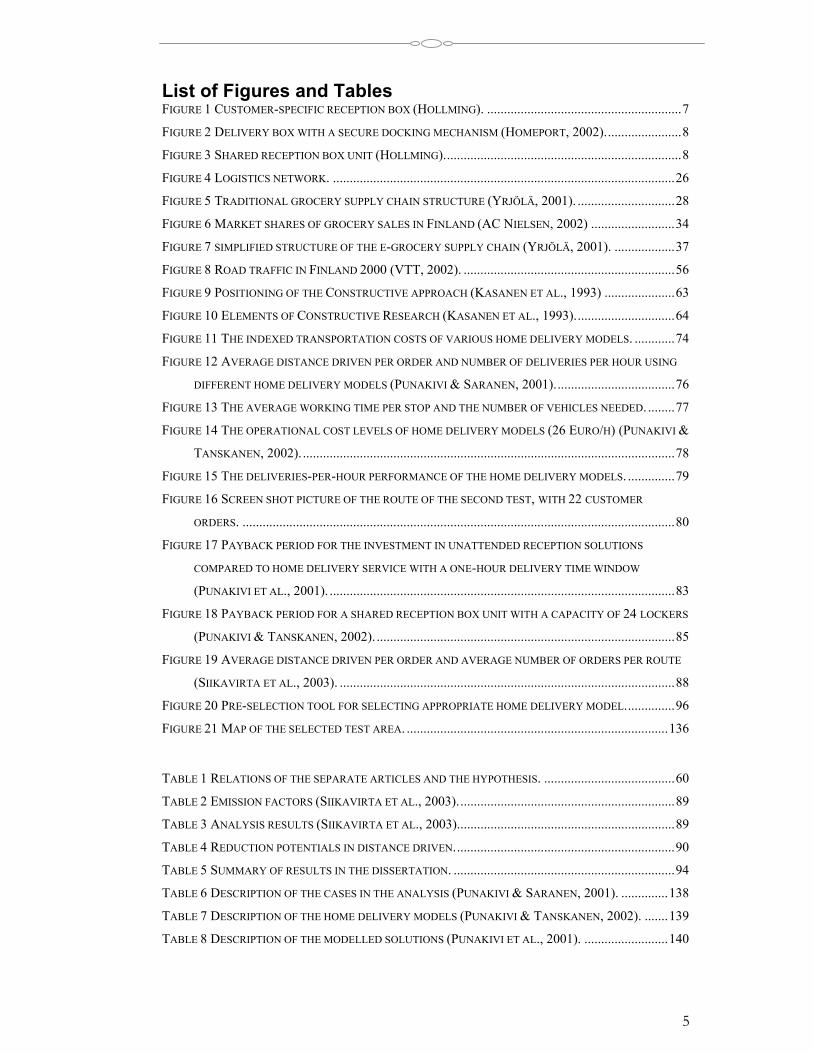
Reception box: The customer-specific reception box is equipped with arefrigerator-freezer unit, enabling compartments for frozenand chilled food. In the reception box there is also a roomtemperature compartment. The customer-specific receptionbox is installed, for example, in the customer’s garage or theyard of their home.
Figure 1 Customer-specific reception box (Hollming).
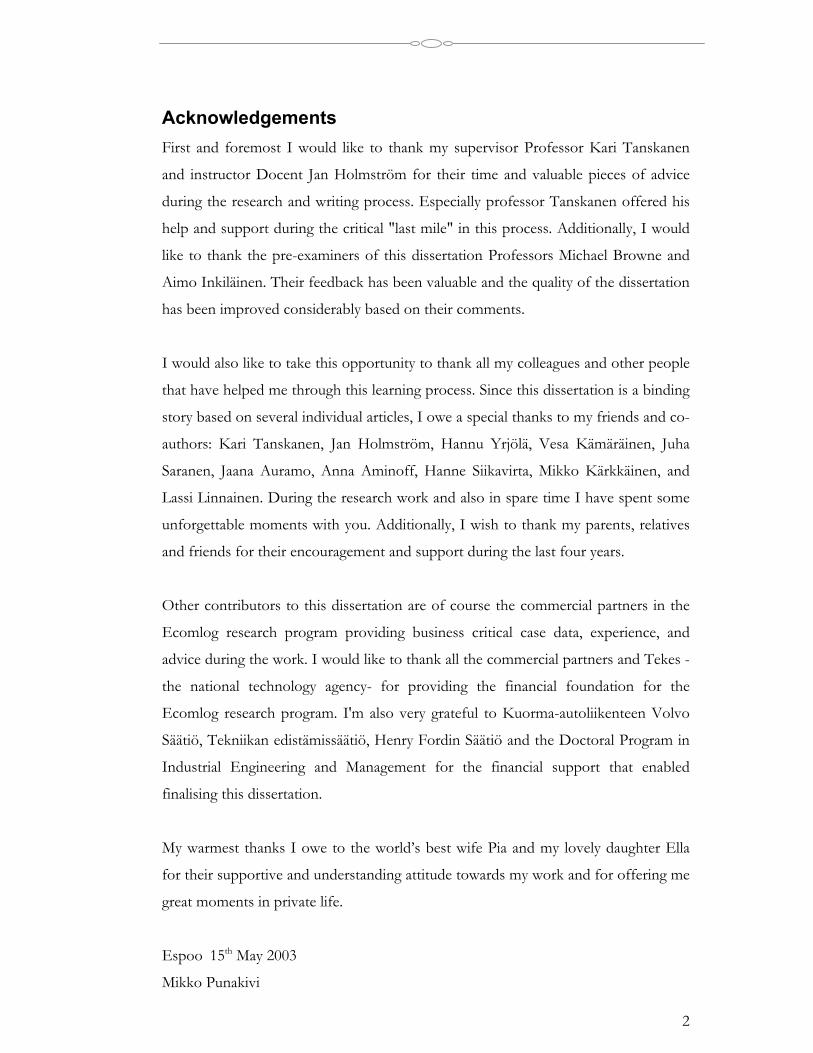
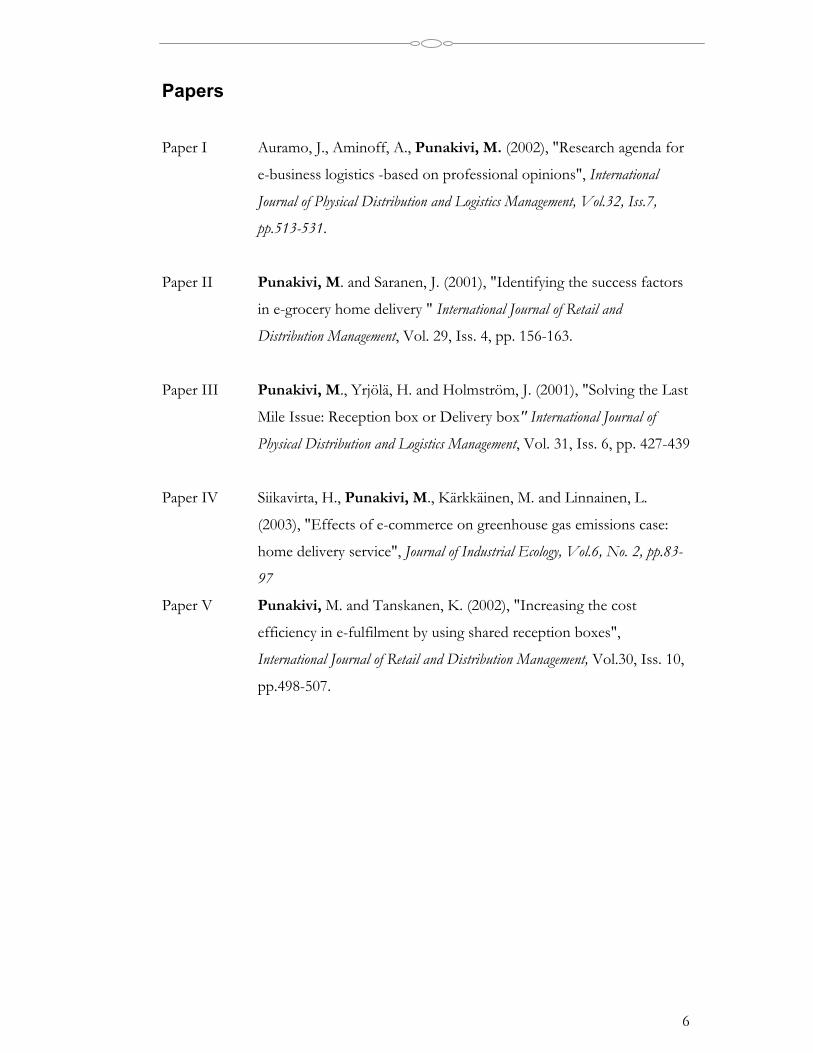
Delivery box: A delivery box is an insulated secured box that can be left onthe customer’s doorstep. In the best case, the delivery box isequipped with a secure docking mechanism. (See Figure 2)
8
Figure 2 Delivery box with a secure docking mechanism(Homeport, 2002).
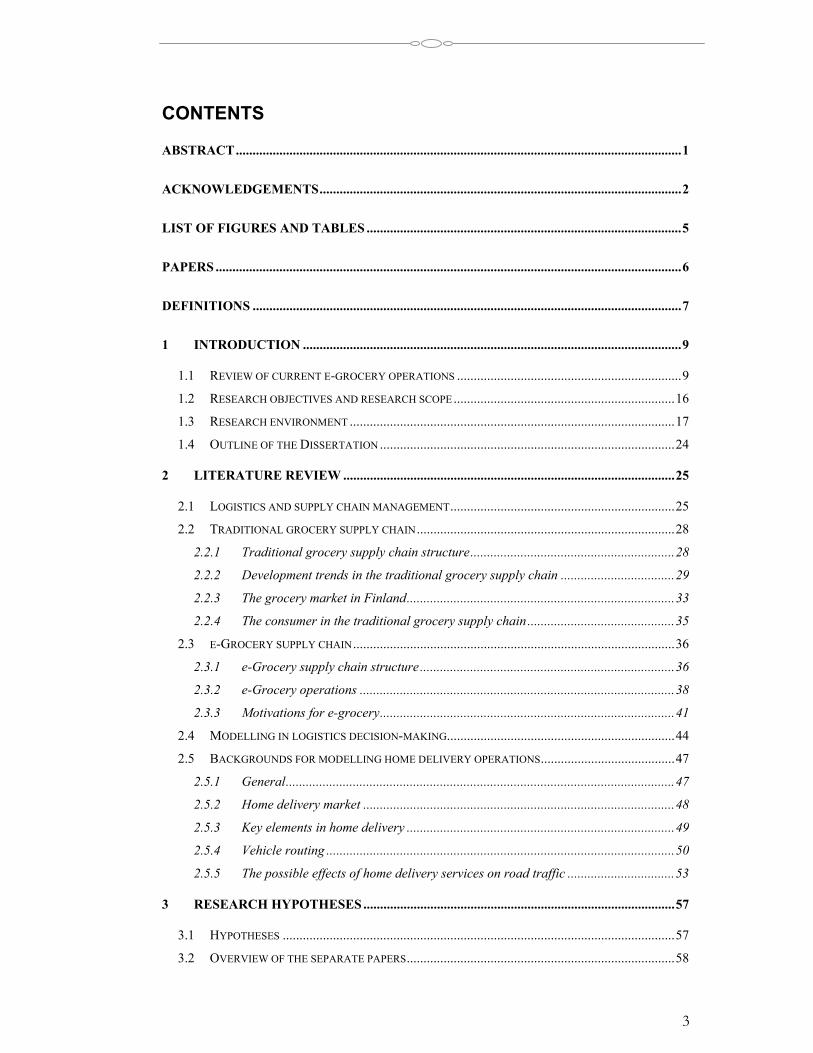
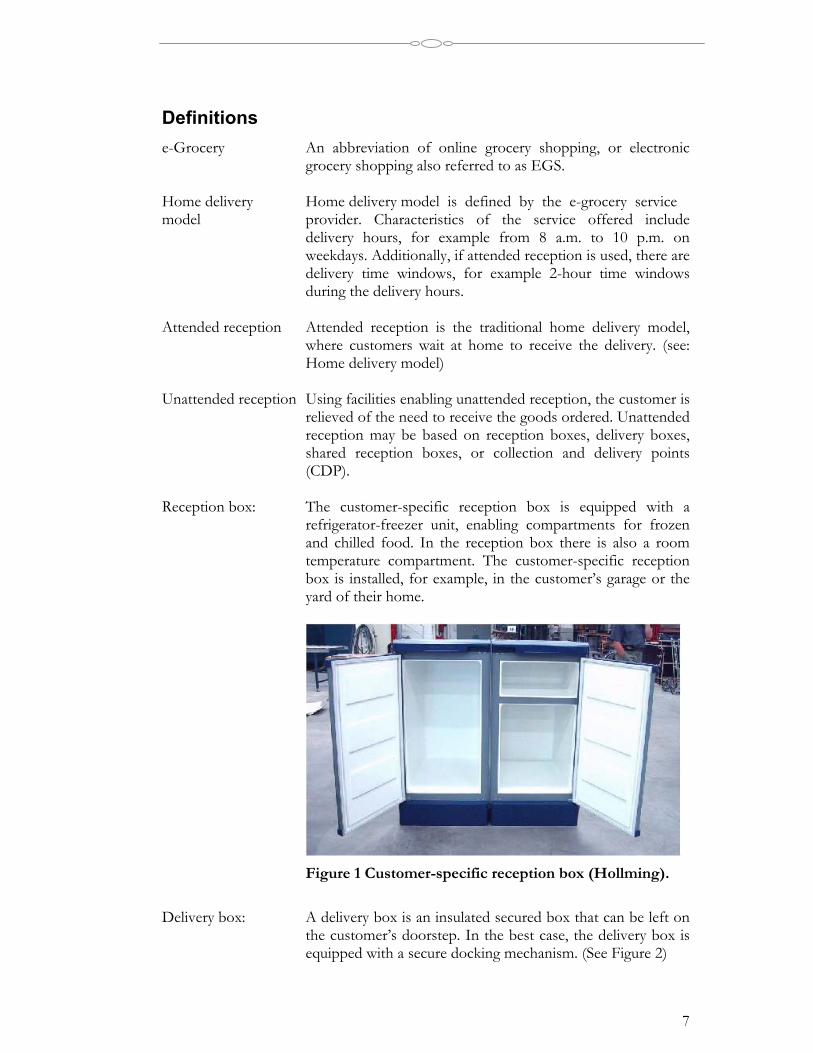
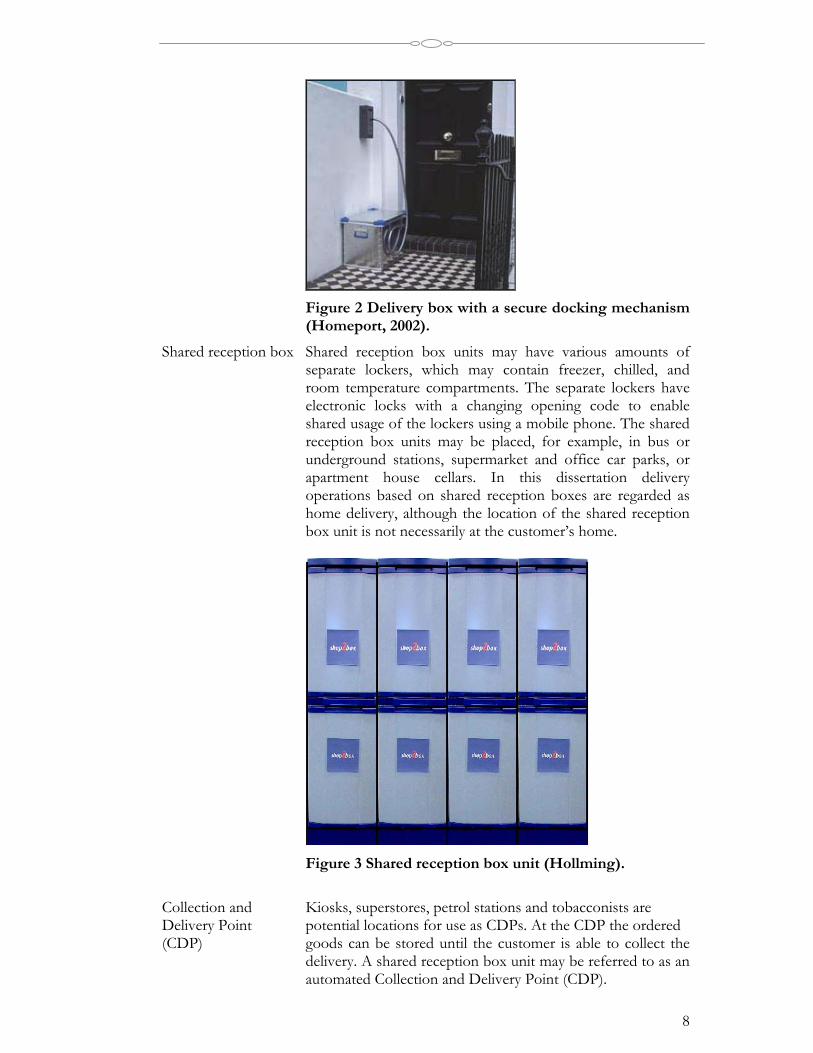
Shared reception box Shared reception box units may have various amounts ofseparate lockers, which may contain freezer, chilled, androom temperature compartments. The separate lockers haveelectronic locks with a changing opening code to enableshared usage of the lockers using a mobile phone. The sharedreception box units may be placed, for example, in bus orunderground stations, supermarket and office car parks, orapartment house cellars. In this dissertation deliveryoperations based on shared reception boxes are regarded ashome delivery, although the location of the shared receptionbox unit is not necessarily at the customer’s home.
Figure 3 Shared reception box unit (Hollming).
Collection and Kiosks, superstores, petrol stations and tobacconists areDelivery Point potential locations for use as CDPs. At the CDP the ordered(CDP) goods can be stored until the customer is able to collect the
delivery. A shared reception box unit may be referred to as anautomated Collection and Delivery Point (CDP).
9
1 INTRODUCTION
1.1 Review of current e-grocery operations
The development of information technology and the utilisation of the Internet in
ordering goods have made it possible to develop new business models and service
concepts for consumers. One example of new service concepts and better customer
convenience is consumer direct electronic grocery shopping (e-grocery) and home
delivery service. In brief, electronic grocery shopping means ordering a basket of
commodities over an electronic network (Internet, email). The home delivery of the
ordered goods is then an additional service included to the service concept.
Thus, one major precondition for using the electronic grocery shopping service is the
customers Internet access. However, that is not seen as a barrier since, for example,
in the USA 57%, in Finland 45%, and in the UK 34% of the adult population are
already Internet users (GER, 2001). What is seen as a barrier is the resistance of
change and slow adoption of new ways of action in general. Developing and
implementing new operating concepts, as well as using those new services, requires a
willingness to change the current operating models. This willingness is required of
consumers, retailers, and manufacturers, as well as of the various service providers in
the supply chain.
Compared to traditional grocery shopping, e-grocery requires new operating models
in the supply chain. In the traditional grocery supply chain, goods are delivered to the
store and customers perform the picking and final delivery to the home. For an e-
grocer the major cost drivers are picking, packing, and home delivery transportation
(Lewis, 2000; @ Your Home, 2001). The challenges for an e-grocer are to achieve
cost-efficient operating models and to provide more convenience to consumers.
The challenge in picking operations has been solved by using two alternative
strategies. Picking operations can be carried out either by using the current store
infrastructure or new dedicated distribution centres. The first strategy is called an
10
intermediary model and the second, based on a distribution centre, a channel model
(Dagher, 1998; Bartolotta, 1998; Heikkilä et al., 1998a; Holmström et al., 1999;
Kämäräinen et al., 2001a). Traditional retailers have generally used the first strategy,
in which e-grocery operations are based on current store infrastructure. The second
strategy, based on distribution centres, has been used mainly by the new rival
competitors, also known as "pure play" e-grocers.
Both of these strategies have their strengths and weaknesses. In the channel model,
distribution centres may be located in an area that is not as expensive as the one
where the traditional stores are located (Jaakola, 1999; Kämäräinen et al., 2001b). A
distribution centre is typically designed to achieve efficient picking operations,
whereas traditional stores are normally designed to display products to consumers
(Peters, 2001; Yrjölä, 2001). Additionally, in the intermediary model the customers
doing their shopping in the store slow down the picking work, whereas in
distribution centres some of the picking work may even be automated (Reda, 1998;
Kämäräinen et al., 2001b). Automation, however, requires high investment and, for it
to be viable, high capacity utilisation and stable demand are also needed (Kämäräinen
& Punakivi, 2001).
When using the intermediary model, where picking operations are based on the
existing store infrastructure, the required investment is significantly smaller compared
to using distribution centres. Compared to the channel model, the intermediary
concept has three main strengths. Firstly, the risk of over investment is small.
Secondly, customer acquisition is easier because of the fact that traditional retailers
usually have a well-known brand on the market. Thirdly, the traditional retailer
already has a well-established relationship to their suppliers.
Regardless of the strategy used in the picking operations, the goods have to be
delivered to the customers. Home delivery operations, the second major cost driver,
have become the Achilles heel of the e-grocery business. Daily grocery products are
more demanding than other physical products like books or clothing, because the
trade of grocery goods is tightly regulated and controlled in terms of preservation
and the quality of the delivered goods. This is why dedicated delivery structure with
temperature controlled storage and vehicles are needed. Various models of home
11
delivery operations have been developed and are in use, including both attended and
unattended reception. An overall classification of home delivery models follows:
1. Attended reception of the goods ordered at a location chosen by the
customer (home, office) using delivery time windows defined by the service
provider.
2. Unattended reception using a reception box concept. A reception box is a
refrigerated, customer-specific locked reception box installed in the
consumer’s home yard or garage. (See Figure 1 on page 7)
3. Unattended reception using a delivery box concept. A delivery box is an
insulated secured box that can be left on the customer’s doorstep but which
is returned to the retailer. Delivery boxes may be equipped with a docking
mechanism that makes secure delivery possible. (See Figure 2 on page 8)
4. Unattended reception using shared reception box units, also known as
automated Collection and Delivery Points (CDP). The shared reception box
units have various amounts of separate lockers, each of which contains
freezer, chilled, and room temperature compartments. The separate lockers
also have electronic locks with a changing opening code to make possible
shared usage of the lockers using a mobile phone. The shared reception box
units may be placed, for example, in bus or underground stations, office and
supermarket car parks, apartment house cellars, or wherever the retailer
believes it to be convenient for consumers. (See Figure 3 on page 8)
To illustrate the importance of the home delivery model selected, let us look at a few
case examples where different home delivery models are used. The first case example
is Webvan, probably the best-known "pure play" e-grocer, which launched its e-
grocery business in June 1999. To reach market dominance, Webvan offered its
customers home delivery with attended reception and delivery time windows of 30
minutes. Furthermore, the service was free of charge for orders above $50. In spite
of that, Webvan was unable to create sufficient delivery density to reach
economically viable home delivery operations. Low customer density, attended
12
reception, and short delivery time windows together resulted in extremely high
delivery costs. In November 2000 Webvan started to charge $4.95 for deliveries
worth less than $75 (Austria Farmer, 2000). In December 2000 Webvan tried to
decrease its home delivery costs by cutting down its service level to 60-minute
delivery time windows (Webvan, 2001). Then, in May 2001, Webvan again raised its
delivery charges from $4.95 to $9.95 for orders under $75, and imposed a new fee of
$4.95 for orders between $75 and $100, leaving free delivery only for orders over
$100 (Sandoval, 2001a). Even rationalising and pricing its home delivery service was
not enough to prevent Webvan from running out of money as a result of an
unexpected drop-off in incoming orders when delivery fees were introduced (Austria
Farmer & Sandoval, 2001; Reinhardt, 2001). Finally, Webvan ceased its operations in
July 2001 (Sandoval, 2001b).
Another example of an e-grocer offering home delivery and attended reception is
Matomera (owned by Bergendahls Gruppen), which operated in Malmö, Sweden
from 1998 to March 2001 (Johnsson, 1999; Matomera, 2001; Borgström, 1998). The
distribution centre based picking operations were manual but efficient. The
problematic issue with the Matomera e-grocery service was its home delivery
operation. The service area selected was too large, being of a 30-kilometre radius
around Malmö, leading to huge amounts of kilometres being driven, thus destroying
the business’ profitability. This large service area was selected to attract as many
customers as possible. Although only three 2-hour delivery time windows were
offered to the customers, the low customer density led to a high home delivery cost
per order. According to a Matomera press release on 26.3.2001, the e-grocery
operations were closed down as a consequence of small market demand (Matomera,
2001).
Streamline.com was the first e-grocer offering unattended reception by installing
refrigerated reception boxes in the customer’s garage (Bartolotta, 1998). Streamline
launched its e-grocery business as early as 1993 and commenced Internet ordering in
1997. As early as 1997, around 75% of the orders were being placed over the Internet
(Feare, 1999). The idea was to offer well-off suburban families a convenient grocery
service that also included value-added services such as dry cleaning, film processing,
UPS package pick-up, and Vendor Managed Inventory (Dagher, 1998; Feare, 1999;
13
Småros & Holmström, 2000; Småros et al., 2001). Additionally, the service concept,
based on unattended reception, made possible the achievement of a high repetitive
purchasing rate, customer loyalty, stable demand, and notable efficiency gains in
home delivery operations compared to attended reception (Lardner, 1998).
Streamline offered its reception box and home delivery service once a week for $30 a
month; additionally, an entrance fee of $39 was charged when first subscribing to the
service (Dagher, 1998; Feare, 1999). However, in 2000 Streamline had to close its
business because it was unable to reach the necessary critical sales volume (Nasdaq,
2000; Junnakar, 2000). Another problem that it encountered was weak negotiation
and purchasing power with its suppliers. Streamline's operations in the Chicago and
Washington D.C. areas were acquired by Peapod.com in September 2000 (Peapod,
2000), and in November 2000 Streamline closed down the rest of its business
(Junnakar, 2001).
Streamline's experience, however, shows that offering unattended reception could
bring benefits to the e-grocer, home delivery service provider, and to the customers.
At the moment the standard home delivery service concept offered by the worlds
leading e-grocers, Tesco.com and Peapod.com, is attended reception with 2-hour
delivery time windows. Tesco.com was started in 1996 and is currently the world’s
biggest e-grocer with annual online sales of £356 million (approximately 535 million
euro) in 2002. Tesco.com relies on store based picking operations and carries out
more than 3.7 million home deliveries per year in the UK market. The home delivery
operations are based on attended reception and 2-hour delivery time windows. The
cost of the last mile home delivery operations not including picking was some 7% of
Tesco.com sales (Reinhardt, 2001; Jones, 2001). Peapod.com was founded in 1989
and since August 2001 is totally owned by Royal Ahold. Peapod.com is currently the
second largest e-grocer in the world and biggest in the USA operating in 5
metropolitan areas there. In the picking operations Peapod relies on both warehouses
and supermarkets depending on the market size. In the home delivery operations,
providing both attended reception with 2-hour delivery time window and unattended
reception, Peapod uses about 600 delivery vehicles. The average order size was worth
of USD 135 in the year 2002. Additionally, according to Van Gelder (2002a)
Peapod.com operations are profitable in 4 out of 5 markets and the company has
achieved an annual growth rate of 35 per cent.
14
To develop operational efficiency and customer service, also Tesco has plans for
unattended reception and like noted Peapod is already offering unattended deliveries
(Tesco, 2001; Bentham, 2001; Peapod, 2001). In fact according to Van Gelder
(2002a) some 35 per cent of Peapods customers in Washington and 10 per cent of
the customers in Chicago use unattended reception today. Service offers with a
delivery box concept have also been started in the UK, for example by the Food
Ferry and Sainsbury's (Homeport, 2002). Consignia, the former Post Office
organisation, has also launched trials of five different solutions to the question of
unattended deliveries in the UK (Rowlands, 2001a). Additionally, major white goods
manufacturers such as Siemens in Holland and Electrolux in the UK have projects in
which facilities for unattended reception are being tested (Bearbox, 2001; Siemens,
2001).
However, there are still many unsolved problems concerning customer-specific
unattended reception concepts. Facilities require high investment and, at the same
time, the utilisation rate is very low. One of the solutions that has been suggested and
is also supported by policy makers is the usage of shared reception boxes (Browne et
al., 2001; Rowlands, 2001b). The assumption is that, using shared reception boxes,
the utilisation rate of the facilities would be higher than in the case of customer-
specific reception facilities.
One of the earliest shared reception box pilot projects was introduced in 2000 by the
GIB Group in greater Brussels, Belgium (GIB, 2001). GIB had 18 trucks specially
designed to act as pickup points for grocery shopping baskets ordered online. Every
day the 18 trucks were loaded with up to 45 orders each and driven to selected
pickup points to intercept the consumer on their way home from work. The trucks
stayed at the pickup point for five hours, from 4 p.m. until 9 p.m. (Ring & Tigert,
2001). Unfortunately, the business model did not work, presumably as a result of the
high level of investment and inefficient usage of the trucks. Recently, shared
reception box units for receiving grocery products have been introduced, for
example by Hollming Ltd in Finland and Boxcar Systems Inc. in the USA (Hollming,
2001; Boxcar, 2001). Pilot experiments with these shared reception boxes have also
been started. Additionally, Consignia in the UK already has a pilot project in which
15
shared reception box units or "boxbanks" from Bybox are used for parcel deliveries
(Rowlands, 2001a).
To summarise, although many e-grocery home delivery models have been launched
and are emerging, knowledge of the success factors has remained hidden. Due to lack
of research, the potential savings, for example, of using unattended reception are not
yet known or publicly available. However, customer demand for unattended
reception already exists. According to Lewis (2001), 40 per cent of active or potential
European online grocery shoppers would be interested in unattended deliveries.
Additionally, according to a Finnish market research company, Gallup Web, 45-50
per cent of Finnish Internet users are interested in using unattended reception for
groceries purchased online. In particular, active Internet users and Internet users
living in the countryside are very interested in unattended reception (Gallup Web,
2001). Another factor supporting the research focusing on developing e-grocery
home delivery is the forecast market growth. According to Verdict Research
(Rowlands, 2001b), online grocery shopping will be one of the fastest-growing
businesses on the Internet in coming years. Between 1999 and 2000 the online
grocery market grew by nearly 200 per cent and the average growth rate forecast for
the next five years is 64 per cent (Jupiter, 2001). In 2001 the market share of online
groceries was only 0.3-0.7 per cent in the UK (Finch, 2001; @ Your Home, 2001),
0.22 per cent in the USA (IDC, 2000; Van der Laan, 2000), and 0.1 per cent in
Finland (Päivittäistavarakauppa, 2001). However, online shopping may represent as
much as 2 to 15 per cent of grocery volume in the USA by the year 2006 (Peapod,
2001; Jupiter, 2001). In Europe, it has been estimated that online shopping will
account for from 2.5 up to even more than 20 per cent of the grocery market by
2005-2010 (Lewis, 2000; Powell, 2000; @ Your Home, 2001; Finch, 2001; O'Neill,
2001; Heiskanen, 2000; Tuunainen, 1999; Heikkilä et al. 1998b). Currently, after the
e-commerce hype, the growth estimates tend to be closer to 3-10 per cent by 2005-
2010 on both continents.
Estimates presented vary significantly from one another. However, the grocery
market is so vast, currently approximately 500 billion euro in the USA, 140 billion
euro in the UK, and around 10.5 billion euro in Finland, that even development
according to the most conservative estimates would create substantial business.
16
1.2 Research objectives and research scope
As already shown in the Introduction, home delivery has become a major problem in
the e-grocery business. Furthermore, this problem is not going to disappear as the
online grocery market grows in the future. Therefore, the objective of this
dissertation is to identify existing and emerging home delivery operations models in
the e-grocery business. A second objective is to analyse and compare the cost
efficiency of the alternative solutions in home delivery operations by modelling. The
modelling work, analysing and comparing the cost levels of various home delivery
models, is based on real traditional grocery shopping point-of-sale data. In the
modelling, the cost levels of home delivery operations are also compared to the
current costs of a household customer visiting a supermarket using their own car. In
addition to the cost efficiency analysis, a further objective is to analyse the
environmental effects of the alternative home delivery models. Giving guidelines for
developing feasible and economically and environmentally sustainable home delivery
services is seen as the final objective. The aim of the research is to formulate answers
to the following research questions:
• What are the cost levels of the identified e-grocery home delivery models?
• What is the impact of alternative goods reception modes on home delivery cost-efficiency?
• What are the costs of home delivery models compared to “self-service”, where a household
customer visits a supermarket using their own car?
• In which situations is each alternative home delivery model feasible?
• Can the operational cost savings in home delivery transportation justify the required investments
in unattended reception?
• What are the possible environmental effects of the alternative home delivery models?
• What is the impact on the mileage driven in urban traffic?
• What is the effect on greenhouse gas emissions?
The focus of this dissertation is home delivery operations in the e-grocery business.
A great business potential is seen there because grocery shopping is the largest
business in retailing. Consumers buy grocery products regularly and frequently and
thus groceries make up the greatest constant material flow to household customers,
17
regardless of the time of year. Additionally, there is no need to test or see the
supposedly well-known products before ordering them. This is why grocery products
are also seen very suitable for e-commerce. Thus, here the grocery products are seen
as basic home delivery material flow into which other product groups, such as books,
CDs, laundry etc., may be included in the future, increasing the service level and
customer convenience. The research work for this dissertation was conducted in
Finland. The central reasons for focusing the research on the Finnish e-grocery
business were the availability of proper data for research purposes and of the
expertise of the Finnish grocery and transportation businesses.
1.3 Research environment
This dissertation is a part of the Ecomlog research programme, started in April 1999
and carried out by the TAI Research Centre at the Helsinki University of
Technology, Finland. The programme was a three-year e-commerce initiative funded
by Tekes - the national technology agency - and leading Finnish companies in
telecommunications, logistics, retailing, and packaged consumer goods (Appendix I).
The Ecomlog research programme co-ordinated three subprojects addressing
different challenges facing companies in a changing supply chain environment. This
dissertation was produced within the Intertrade project, which aimed to create
competitive logistics solutions for e-business and especially for electronic grocery
shopping in Finland. The principal company partners in the Intertrade project were
S-Group, Norpe, Valio, Panimoliitto, and Trading House Hansel.
In the Intertrade project the initial problem definition and planning was carried out
mainly by Hannu Yrjölä, starting in 1997 and resulting in the commencement of the
actual Ecomlog research programme in April 1999. Yrjölä & Tanskanen (1999) and
Yrjölä et al. (2000) were published soon after starting the Intertrade project,
providing guidelines for the research work.
The main research question in the Intertrade project, What is the effective supply chain for
e-grocery business?, was formulated on the basis of the definition of the problem area
and current state analysis of the problem area. Then the relevant research topics were
18
identified and selected for research. The home delivery system, including analysis of
various service models and the effects of attended vs. unattended reception, was seen
as an important research topic. Another important topic to be analysed was the order
assembly system, including comparing the picking operations in a dedicated DC and
store and the analysis of appropriate level of automation in the picking operations. A
third area of interest was the possible impacts on upstream operations in the grocery
supply chain, including analysis from the first-tier supplier's point of view.
Hannu Yrjölä took the research responsibility of studying the main research question.
However, since the main question was found to be very complex and includes several
essential sub-questions, the research work was carried out as a joint effort. During
the research process the research responsibilities were divided in the following way:
1. What is the impact of alternative goods reception modes on the effectiveness of home delivery?
(main responsibility: Mikko Punakivi)
2. What is the impact of alternative order assembly systems on the effectiveness of the e-grocery
supply chain? (main responsibility: Vesa Kämäräinen)
3. What are the implications of changing from conventional shopping to EGS for the grocers’ first-
tier suppliers? (main responsibility: Hannu Yrjölä)
In the main research phase these topics were then analysed partly by the authors
working together and partly individually. Regardless of dividing the research work in
to parts co-operation between the researchers was emphasised bearing in mind that
every action in a supply chain affects many others. During the research work the
chief emphasis was placed on topics 1 and 2, since greater development potential was
identified there. During the research process, several more specific questions were
revealed and selected for further research conducted both individually and in co-
operation. The research questions and focus areas of the researchers in the Intertrade
project are presented in detail in Appendix II. The research results of Yrjölä and
Kämäräinen are briefly covered next.
The dissertation by Yrjölä (2003) concentrates on finding out under which
conditions e-grocery business could be cost competitive compared to conventional
grocery retailing. The main hypothesis of the dissertation is that "e-grocery with
19
home delivery can be more efficient than supermarket retailing handling a similar
volume of sales".
According to Yrjölä, the e-grocery business should be seen as an assembly industry
producing shopping baskets. Instead, the e-grocery business has typically been
conducted as a supermarket copied into an electronic form, that is, it is seen only as
an opportunity to buy products. Yrjölä states that the starting point of operational
design should be the real needs of a household, and take into account the possibility
of adding new services for the customers.
According to Yrjölä (2003), the most important research finding of his dissertation is
that the operational costs of a Local Distribution Centre can be lower than those of a
supermarket.
According to Yrjölä's analysis, store-based order picking is less expensive than using
a specialised distribution centre when turnover is less than one million euros per year.
A turnover of more than 3 million euros means that a dedicated distribution centre
appears to be more efficient than store-based picking. However, the distribution
centre must be purpose-built for shopping basket assembly with a reasonably stable
workload to avoid unnecessary high resource allocation to be able to cope with
demand peaks.
Yrjölä (2003) introduces additionally a hybrid model that combines distribution
centre and store-based picking as an opportunity to create gradual low-risk growth in
the e-grocery business. In the hybrid model, supermarkets are redesigned by dividing
the floor space into to Local Distribution Centre and supermarket areas. This is how
order picking and home deliveries can be carried out more effectively than in a
conventional supermarket.
One of the important characteristics of the hybrid model is that grocery products in a
supermarket are initially divided into three categories based on sales volume.
Products in class A are high volume goods that are not stored in the supermarket but
can be ordered directly to the Local Distribution Centre from the producers. The
orders can be made according to the customer's online orders. Class B products have
20
some inventory in the supermarket, and the picking operations may be manual or
automated depending on the sales volume. The products in class C are low volume
goods that use the supermarket as an inventory, and picking is done manually from
the supermarket shelves.
Yrjölä (2003) also focuses on the efficiency of home delivery operations. According
to Yrjölä's research findings, it seems that efficient home delivery can be achieved
even with a moderate market share.
Largely based on the early research work done in co-operation with Punakivi and
Saranen (Punakivi & Saranen, 2001), he concludes that unattended reception is very
important for the overall cost structure of the supply chain. According to Yrjölä,
there seems to be a possibility of achieving real economy of scale in home delivery,
but not with the service models used by the early e-grocers. If the consumer is free to
decide the delivery time, the production cost of the service will be high, even with
high customer density. This is also proven in the research work done by Laseter et al.
(2000). With service models that give flexibility in route planning and optimisation,
for example home delivery based on unattended reception, the service can be
provided more efficiently.
However, the investments that home delivery based on unattended reception
requires are only discussed briefly in Yrjölä's dissertation. He suggests that household
customers themselves could make the investment in the long run. This requires that
the facility enabling unattended reception be seen as additional refrigerator-freezer
for the household, not only for the purpose of receiving goods ordered online.
Another important research finding in Yrjölä (2003) is that costs in the middle and
upstream of the supply chain will not increase as a result of changing supermarkets to
Local Distribution Centres. Some investments in better and more detailed order
handling and fulfilment in some food industries, such as breweries, is required.
However, there are many positive aspects, for instance increased demand
predictability and cost reductions in deliveries, which will more than offset the
negative aspects.
21
On the basis of earlier research findings, the main research finding in Yrjölä (2003) is
that electronic grocery shopping with home delivery service can be made cheaper to
operate than supermarket retailing handling a similar volume of sales.
Yrjölä, however, states that this requires a restructuring of the supply chain and
consumer co-operation. Successful operations require customer loyalty, forward
planning, and delivery times optimised by the service provider rather than dictated by
the customer on impulse. According to Yrjölä's analysis, a local distribution centre-
based home delivery service with annual sales of more than 200.000 euros per square
kilometre seems to have the potential to become more cost-effective than running
supermarkets. This sales volume can be achieved with 25 four-person households per
square kilometre with 90 per cent loyalty. Based on his research results, Yrjölä states
that new efficiency indicators, such as sales per distribution centre and sales per
square kilometre, are needed to measure the efficiency of the e-grocery business.
According to Yrjölä the most useful factor is sales per square kilometre.
Based on the research results, some conclusions are made in Yrjölä's dissertation.
According to Yrjölä, e-grocery retailing is a very local business, and store-based
picking is a good alternative if fast roll-out with a low level of investment is required.
A distribution centre-based operation is potentially much more efficient, but it is
slower to implement and needs more investment. Whatever service model is chosen,
it should first be made to work in a relatively compact geographical area and only
then copied to new areas.
Concurrent with Yrjölä's research work, Kämäräinen, one of the researchers in the
Ecomlog programme, has published results supporting the research work in this
dissertation. The licentiate thesis by Kämäräinen (2002) is based on the research
work from the pre-understanding phase and on early results published up to the
spring of 2001. Kämäräinen (2002) concentrates on identifying the biggest logistical
challenges when developing operations for the e-grocery supply chain and describes
some basic principles of how to develop cost-efficient supply chain solutions.
The work in progress dissertation by Kämäräinen (2003) is enlarged on the basis of
the licentiate thesis. According to Kämäräinen (2003) improving overall logistical
22
efficiency can be seen as one of the most important steps towards profitability in e-
grocery. Therefore, he aims at understanding e-grocery business system
implementation from the logistics point of view.
The main objective in Kämäräinen (2003) is to study how best to implement e-
grocery business so that e-grocers can make their business profitable. A second
objective selected in his dissertation is to identify, model, and evaluate different
logistical solutions that can be used in the e-grocery business system. Solutions for
achieving better picking efficiency are presented and modelled. Special attention is
paid to investments in picking automation. Different solutions and revenue models
of unattended reception are identified and examined. The potentials of the revenue
models are evaluated with modelling and concrete examples. The last objective is to
find out cost-effective combinations of solutions in different market situations to
enable successful e-grocery business implementation.
According to the results in Kämäräinen (2003), cost-savings in picking cannot be
realised with automation if demand and capacity utilisation varies too much.
Automation, however, can be a remarkable solution when trying to increase the
picking efficiency in the distribution centre. The problem is how to make the
investment on the right level while customer demand is still low and may vary a lot.
To realise cost savings, high and stable capacity utilisation must be achieved.
Therefore, Kämäräinen suggests that the focus should be more on creating a flexible
distribution centre and use of manual solutions with labour instead of automation.
Another research finding partly based on Punakivi & Tanskanen (2002) and the co-
operation of Kämäräinen and Punakivi (Kämäräinen & Punakivi, 2002; Kämäräinen
& Punakivi, 2003) suggests that operations models based on shared reception boxes
have the best potential to become profitable among the solutions offering
unattended reception.
Investments required in the reception facilities are high, and if the e-grocer or
customer makes the investments, it is likely that access to the reception boxes would
be limited. Therefore, according to Kämäräinen, the most likely investor for the
reception facility is a third party operator who could offer receiving facilities for both
23
B2C and B2B customers, keeping the service open for many retailers and
transportation service providers. According to Kämäräinen, in this way it is also
possible to offer the services with a reasonable service fee. Additionally, Kämäräinen
states that capacity utilisation is a crucial factor and must be high enough for the
service to become profitable.
Thirdly, Kämäräinen (2003) focuses on analysing how the order of implementing
solution components affects the success of e-grocery supply chain investment. First,
Kämäräinen has identified that the possible investment targets are investments in
new customer services, investments in reception facilities, and investments in the
distribution centre.
According to Kämäräinen's results, the order of implementing solution components
has a strong impact on the success of e-grocery supply chain investment. All the
solutions have some impact on the other solutions, which should be taken into
account when implementing an e-grocery supply chain. Kämäräinen concludes that
while the goal should be the creation of a wide and loyal customer base in a dense
service area, investments should be started from the reception facilities or value-
added services. In spite of the high investments required, customer specific reception
boxes are seen as a good way to reach a loyal customer base. In the case of pure play
e-grocers, the distribution centre has been the most obvious alternative of the
investment possibilities. However, this implementation strategy has been too
expensive for most of the pure e-grocers, and it has often led to failure in the e-
grocery business.
Based on the research results, Kämäräinen makes some conclusions. According to
Kämäräinen, it is more important to take into account the flexibility and usability of
individual solutions in different market situations than the maximum performance of
an individual solution. Additionally, solutions and implementation strategies chosen
depend heavily on the targets of the service. If e-grocery business is established only
to support traditional grocery retailing, the starting point is entirely different to the
starting point of pure play e-grocers.

24
1.4 Outline of the Dissertation
This dissertation consists of five individual articles and this binding story. In the first
chapter, the background to the dissertation, research objectives, research questions,
the scope of the research, and the research environment are introduced and
described. In Chapter 2 a literature study of the accumulated theoretical knowledge
(body of knowledge) relevant to this work is covered and discussed. Chapter 3
presents the hypotheses of this dissertation and gives an overview of the separate
papers that are used to answer the hypotheses. The research methodology in this
dissertation are presented in Chapter 4. In Chapter 5 the research results are analysed
and conclusions considering the hypotheses are drawn. Chapter 6 then evaluates the
contribution, relevance, validity, and reliability of the results of this dissertation, and
raises some themes for further research.

25
2 LITERATURE REVIEW
This literature study starts with a brief introduction of logistics and supply chain
management. Since the focus area in this dissertation is developing cost-efficient
home delivery operations for an e-grocery business, the second and third sections of
the literature study covers more thoroughly both the traditional grocery supply chain
and the e-grocery supply chain. In the fourth section the basic principles of
modelling in logistics decision-making are covered. The fifth section then covers the
basic characteristics of home delivery operations and focuses on the vehicle routing
problem. In the final section also the possible effects of home delivery on traffic and
the environment are covered.
2.1 Logistics and supply chain management
In the early 1950s the management of logistics was still quite an unexplored area in
business life. Companies had concentrated on transportation and inventory activities
having the main focus on transportation (Ballou, 1999; Bowersox et al., 1999).
During the 1950s the great potential of integrated logistics was discovered and total
cost concept developed (Lewis et al.,1956). The main finding was that the lowest
total cost might not be achieved by pursuing the lowest achievable cost in each
individual logistics function. In order to reduce total costs, it was now seen possible
to spend more on one function, such as selecting air transportation, in order to
reduce the costs of other functions, such as inventory holding.
Recently, the Council of Logistics Management defined logistics as follows
(Bowersox et al., 1999): "Logistics is that part of the supply chain process that plans,
implements, and controls the efficient, effective flow and storage of goods, services,
and related information from the point of origin to the point of consumption in
order to meet customers' requirements."
Another commonly used definition of logistics has been presented by Christopher
(1998): "Logistics is the process of strategically managing the procurement,
movement of storage of materials, parts and finished inventory (and the related
26
information flows) through the organisation and its marketing channels in such a way
that current and future profitability are maximised through the cost efficient
fulfilment of orders."
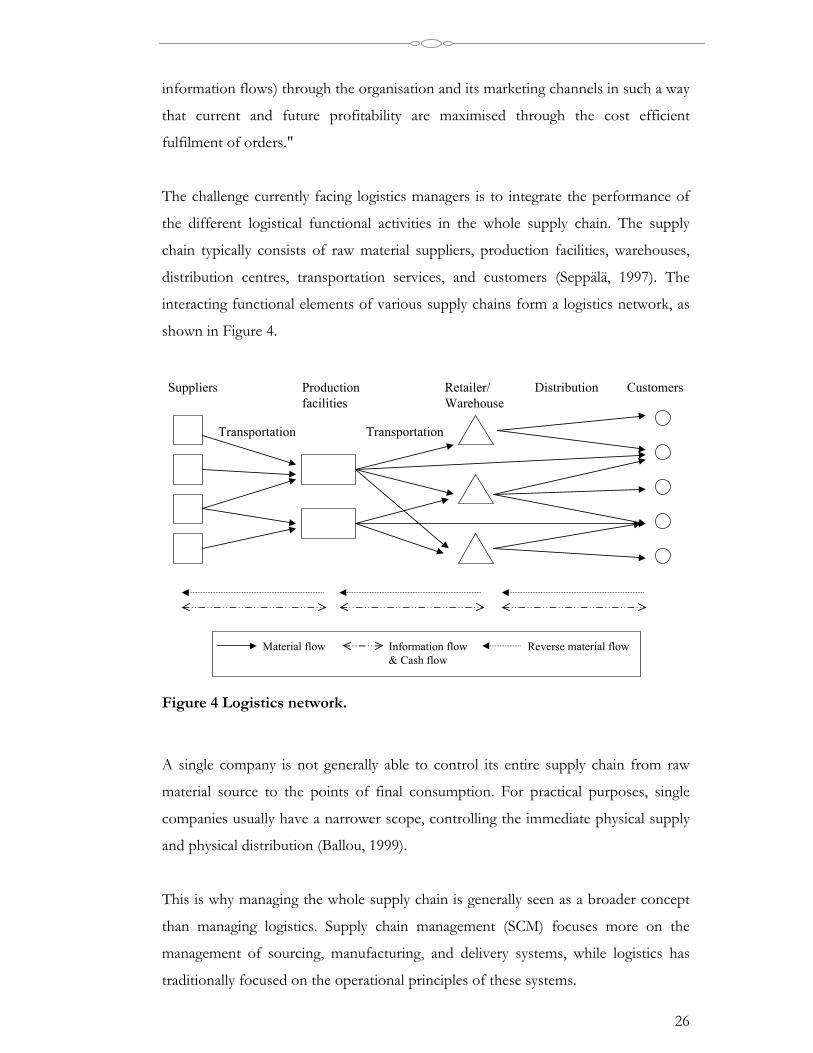
The challenge currently facing logistics managers is to integrate the performance of
the different logistical functional activities in the whole supply chain. The supply
chain typically consists of raw material suppliers, production facilities, warehouses,
distribution centres, transportation services, and customers (Seppälä, 1997). The
interacting functional elements of various supply chains form a logistics network, as
shown in Figure 4.
Suppliers
Transportation
Productionfacilities
Transportation
Retailer/Warehouse
Distribution Customers
Material flow Information flow & Cash flow
Reverse material flow
Figure 4 Logistics network.
A single company is not generally able to control its entire supply chain from raw
material source to the points of final consumption. For practical purposes, single
companies usually have a narrower scope, controlling the immediate physical supply
and physical distribution (Ballou, 1999).
This is why managing the whole supply chain is generally seen as a broader concept
than managing logistics. Supply chain management (SCM) focuses more on the
management of sourcing, manufacturing, and delivery systems, while logistics has
traditionally focused on the operational principles of these systems.
27
Bowersox et al. (1999) see supply chain management (SCM) as a collaborative-based
strategy to link interorganisational business operations to achieve a shared market
opportunity. The activities associated with logistics are included in this definition.
Similarly, according to Christopher (1998), supply chain management is the
management of upstream and downstream relationships with suppliers and
customers to deliver superior customer value at less cost to the supply chain as a
whole.
Nowadays, the development of cost-efficient operations is still seen as one of the
main objectives of both logistics and supply chain management. High service level,
flexibility, customer satisfaction, and profit performance are also seen as very
important.
The importance of the logistics operations for a typical commercial enterprise can be
illustrated by the fact that 10-25 per cent of every sales dollar is spent on logistics
(Bowersox et al., 1999). For example, in Finnish companies the cost of logistics is, on
average, 10.2 per cent of sales (Kanerva & Purola, 2001). According to Ballou (1999),
transportation and warehousing usually represent the most important single elements
in logistics costs for most companies.
However, through developing logistical operations models and the supply chain
structure, improvements can be achieved. According to Seppälä (1997), the size of a
logistics network, the number of echelons in the network, and the number of
facilities in each echelon have a strong impact on logistics costs. Additionally,
according to Inkiläinen (1998) the level of centralisation and usage of postponement
are strategic decisions affecting both cost-efficiency and responsiveness of the
distribution systems. Typically the major trade-offs are the level and the cost of
customer service. To summarise, by developing new logistical operations models and
changing the structure of the logistic network costs may be decreased and the service
level raised.
28
2.2 Traditional grocery supply chain
2.2.1 Traditional grocery supply chain structure
Just as in the general example of logistical networks (Figure 4) in the previous
chapter, the grocery supply chain serves as the link between manufacturers and the
end customer in the grocery business. The supply chain partners perform a variety of
logistical functions as a part of that link, including warehousing, transportation, sales,
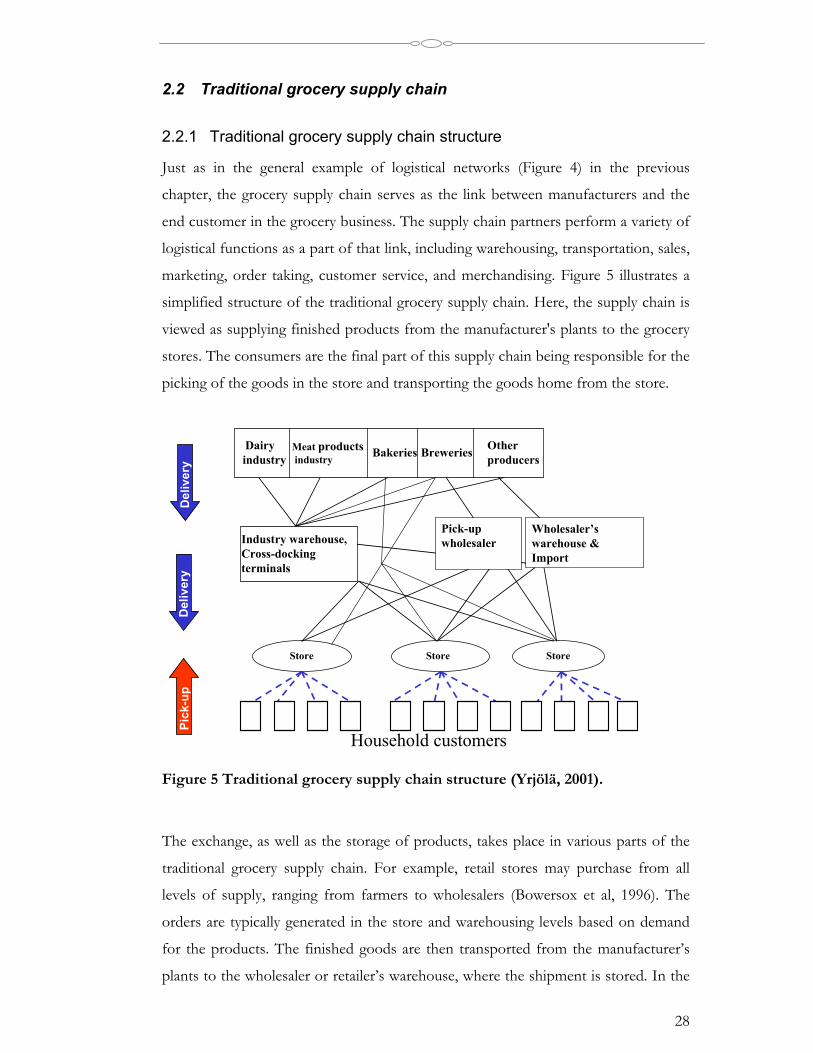
marketing, order taking, customer service, and merchandising. Figure 5 illustrates a
simplified structure of the traditional grocery supply chain. Here, the supply chain is
viewed as supplying finished products from the manufacturer's plants to the grocery
stores. The consumers are the final part of this supply chain being responsible for the
picking of the goods in the store and transporting the goods home from the store.
Dairyindustry
Meat products industry Bakeries Breweries Other
producers
Industry warehouse, Cross-dockingterminals
Store Store
Wholesaler’swarehouse &Import
Store
Household customers
Pick
-up
Del
iver
yD
eliv
ery
Pick-upwholesaler
Figure 5 Traditional grocery supply chain structure (Yrjölä, 2001).
The exchange, as well as the storage of products, takes place in various parts of the
traditional grocery supply chain. For example, retail stores may purchase from all
levels of supply, ranging from farmers to wholesalers (Bowersox et al, 1996). The
orders are typically generated in the store and warehousing levels based on demand
for the products. The finished goods are then transported from the manufacturer’s
plants to the wholesaler or retailer’s warehouse, where the shipment is stored. In the

29
traditional grocery supply chain the warehousing level then fulfils the retail orders. In
practice, because of door-to-door service requirements, flexible operating hours, the
need to move small shipments, and short distances, the transportation of grocery
products is carried out using trucks (Magee et al., 1985; Lambert & Stock, 1993;
Lambert et al., 1998).
Pressure to improve physical distribution effectiveness and customer service has led
to alternative distribution channels. For example, grocery product manufacturers
have set up multiple systems, under pressure from major chain stores, with the
traditional wholesale channel being supplemented by direct distribution to chain
stores and chain distribution centres (Magee et al., 1985). Direct-to-store delivery is
typical in food and beverage distribution, for example, in the brewery or dairy
industries (Bonning et al., 1998).
Additionally, for example in Finland, the brewery industry is committed to common
recyclable and reusable packing standards (bottles and cans) and this policy is
supported by the society in the form of taxation. Using packages other than those
approved in the common recycling system leads to an environmental tax of FIM 4
(0.67 euro) per litre. Consumers are committed to the system as well and return the
packages to the supermarkets. According to Panimoliitto (2002) the return rate of the
packages is 97-98 per cent for bottles and 84 per cent for cans. From the
supermarkets the breweries collect the empty packages for reuse as a part of the
direct distribution channel.
2.2.2 Development trends in the traditional grocery supply chain
As described in the above, the traditional grocery supply chain involves the
management and control of the flows of information, products, and resources from
manufacturers to consumers and in some instances, back to the manufacturers.
For retailers, the goal in traditional grocery supply chain operations is to satisfy the
consumers' desire for product availability. Similarly, pressure is put on all retailers to
offer the consumer the best price and to reduce the costs associated with
distribution. As retailers expand their product ranges, the complexities of the supply

30
chains increase. However, by constantly developing the operations models in the
grocery supply chain, retailers seek to achieve the customer service goal and at the
same time reduce the overall cost level of the operations. Some of the key objectives
are achievement of improved on time delivery, accuracy, inventory reduction, and
reduction of distribution costs, which consist of warehouse costs 46.8%, transport
costs 40.7%, system costs 3.4% and other costs 9.0% (IGD, 1999; IGD, 2001).
The recent development in retail logistics has been widely reviewed in the UK.
Fernie et al. (2000) identified major stages in the development of grocery retail
logistics in the UK. the first stage was supplier control (pre-1980), the second one
was centralisation stage (1981-1989), the third stage was just-in-time or Quick
Response between 1990 and 1995, and the current stage is the relationship stage
from 1996 onwards. Additionally, during these development stages, six trends in
retail logistics have been identified by McKinnon (1996). These trends are briefly
described in the following (McKinnon, 1996):
1. Retailers have been increasing their control over secondary distribution
from warehouses to the stores. The retailer's distribution centre can order and
receive bulk loads from suppliers. The distribution centre also acts as a central
stockholding point and consolidates the deliveries to retail outlets. It can be
claimed that retailers have taken over the traditional wholesaler function, though
supplying only their own chain stores. Benefits such as bulk discounts from
suppliers, inventory reductions due to centralised warehousing, cheaper storage
space, quick offloading of consolidated deliveries, more frequent and rapid
delivery of supplies, expansion of product range, and conversion of retail floor
space from storage to sales display area have been achieved (McKinnon, 1990).
This has also enabled more efficient central processing of orders and invoices.
However, the logistical operations are now more dependent on IT, particularly
the integrated stock replenishment systems that control the movement and
storage of the products.
2. Restructuring of retailers' logistical systems has been implemented to reduce
inventory and generally to improve the efficiency of the operations. Examples of
this are development of "composite distribution", centralisation of slower
31
moving stock, and establishing common stock rooms for non-food retailers to
reduce the backstore-room inventory. Composite distribution is a system in
which different product groups, requiring varying degrees of temperature control,
are channelled through the same distribution centre and delivered with the same
vehicle.
3. Adoption of Quick Response, again with the aim of cutting inventory levels.
This involves applying just-in-time principles to grocery logistics, that is, reducing
order lead-times and providing more frequent delivery of smaller consignments,
both between suppliers and distribution centre and between distribution centre
and stores. The benefits achieved are increased rate of stock-turn and inventory
reductions. The adoption of quick response has also involved the use of "cross-
docking", whereby the goods are received, resorted according to the retail stores,
and despatched often within a few hours rather than stored in the distribution
centre. Quick response has been made possible through the use of EPOS
(Electronic Point Of Sale) information and EDI (Electronic Data Interchange) in
ordering the goods. The drawback of using quick response is the increase in
inbound deliveries and backdoor congestion in the distribution centres as well as
poorer utilisation of suppliers' vehicle capacity due to reduction in average
consignment size.
4. Rationalisation of primary distribution. Partly because of quick response
pressures and partly as a response to more intense competition, retailers have
additionally been extending their control upstream from the distribution centre.
Nominated carriers have been selected to undertake consolidation of inbound
supplies. This carrier collects the goods from the suppliers or have the suppliers
deliver the goods to their nominated warehouse. In most cases, the carrier then
distributes the consolidated loads to the retailers' distribution centres.
Additionally, timetabling of inbound deliveries in the distribution centre has been
applied to overcome the problems associated with increased numbers of
deliveries. To improve the utilisation of their logistical assets, retailers are also
trying to integrate their secondary and primary distribution operations. It has
become common practice for retailers' vehicles to collect goods from suppliers'
premises on the return journey from stores. It was also noticed that there is a
32
need for software tools to plan and manage these more complex cross-shipment
networks.
5. Collaboration in the supply chain: Today, many retailers collaborate closely
with suppliers to maximise the efficiency of the retail supply chain as a whole.
Supply Chain Management (SCM) and Efficient Consumer Response (ECR)
provide a management framework within which retailers and suppliers can more
effectively co-ordinate their activities. SCM is well established in manufacturing
industry, for example in the automotive and electronics industries, and is similarly
becoming more common in retailing. ECR has become widely adopted in
retailing to describe the development of new open relationships and the
exchange of information between retailers and suppliers working together. Three
key elements in an ECR programme are category management, operations
improvement, and enabling technologies. The aim is to optimise assortment,
promotions, and product introductions and to automate store ordering, enabling
continuous replenishment, cross-docking, and synchronised production. By
adopting the ECR principles, the flow of products through the supply chain
could be "smoothed" and inventory levels again reduced. Recently, CPFR
(Collaborative Forecasting and Replenishment), a new approach to improving the
overall supply chain performance in retailing, has emerged in retailing. According
to CPFR.org (2002), CPFR includes a set of business processes that entities in a
supply chain can use for collaboration on a number of buyer/seller functions. By
integrating demand and supply side processes, CPFR improves efficiencies,
increase sales, and reduces fixed assets, working capital, and inventory for the
entire supply chain while satisfying consumer needs.
6. Increasing return flow of packaging material and handling equipment for
recycling/reuse. An increasing proportion of transit packaging, mainly of
cardboard and plastic, is being returned by retailers for recycling and reuse.
Cardboard boxes are being replaced by reusable trays. This is increasing the
return flow of packaging waste and handling equipment back along the supply
chain. Retailers are involved in developing reverse logistics for three reasons.
Most are doing it primarily to make money. It also helps retailers in creating a
favourable environmental image to consumers. Thirdly, retailers are coming
33
under stronger legislative pressure to reduce the amount of packaging materials
entering the waste stream.
McKinnon (1996) also notices that the consumer direct channel, namely home
shopping, may increase sharply in the next 10-15 years, creating logistical challenges.
According to his analysis, four logistical problems with home shopping would need
to be addressed: order picking, home reception, return flow, and channel structure.
Packaged groceries and household consumables present the greatest order picking
problems because of their diverse handling characteristics. In home delivery, the
reception of the goods is seen as the major problem. There is a conflict between the
customer's wish for personal freedom and the delivery company's desire for
flexibility in the routing and scheduling of vehicles. Return flow of the products is
also seen as a potential problem an average of 20 per cent of mail orders are
returned. However, in the grocery sector this is not seen as an acute problem. The
distribution channel structure is seen as the fourth problem area. The growth of
home shopping would probably require development of a new logistics infrastructure
or reallocation of logistical responsibilities among the channel members. Since this
dissertation is focused on developing e-grocery home delivery operations, this topic
is discussed in more detail in Chapter 2.5.
2.2.3 The grocery market in Finland
Development in the Finnish grocery retail market has been somewhat similar to that
described above, although market size is notably smaller than in the UK
(Päivittäistavarakauppa, 2001). As in the UK, in Finland the grocery retail market has
undergone notable structural changes during the past three decades (Heiskanen et al.,
2001). The general trend has been the concentration of grocery retailing followed by
a reduction in the number of retail outlets. Until the 1970's, the number of grocery
stores increased, and in 1978 the number of the grocery stores was 9,398. Currently,
it is only 3,555. However, including specialist shops, market halls, kiosks, and petrol
station shops offering grocery products, the number of outlets was 4,165 in the year
2001 (Päivittäistavarakauppa, 2001; AC Nielsen, 2002). Additionally, the general
trend in Finnish grocery retailing has been towards larger grocery stores and
concentration of the stores in the population centres (Yli-Kovero, 2002). Since 1980,
34
the number of grocery stores has decreased by more than half, 60 per cent of small
grocery shops have disappeared, and larger stores have been established (Raijas,
2000a). The number of grocery stores continues to decrease, and retailing is
concentrated in a few chains and in super- and hypermarkets built outside densely
populated areas.
In Finland, the grocery market was 10,514 million euro in the year 2001 (AC Nielsen,
2002). Clear signs of concentration in the grocery markets are that approximately 30
per cent of the stores make around 81 per cent of the total sales. Additionally, the
199 largest grocery stores make more than 37 per cent of total sales, and the 491
largest stores make over 56 per cent of total grocery sales in Finland (ACNielsen,
2002).
Chain formation has also been a current trend. It is more cost efficient to purchase in
consolidated volumes, operate the wholesaling and distribution, and manage the
assortments in the stores throughout the entire centralised chain. The two dominant
purchasing, wholesaling and distribution organisations in the market are Kesko for
the stores of K-Group and Inex Partners Oy for the stores of S-Group and Tradeka.
In Finland, grocery retailing market is dominated by a few chains. These are K-
Group, S-Group, Tradeka, and Spar. Wihuri and Stockmann are the biggest
companies classified in the group of others. The market shares of the major chains in
Finland in 2001 are shown in Figure 6.
M ark e t s hare s in 2001
K-Group36,5 %
S-Group30,5 %
Tradeka12,6 %
Spar8,7 %
Others11,7 %
Groce ry s ale s in 2001, m illion Euros
3 208
1 230
3 841
1 327
909
0 1 000 2 000 3 000 4 000 5 000
K-Group
S-Group
Tradeka
Spar
Others
Figure 6 Market shares of grocery sales in Finland (AC Nielsen, 2002)

35
As a result of the described development in grocery retailing in Finland, for example,
the logistics costs of the distribution of goods to the fewer number of stores has
decreased, self-service in the large grocery stores has increased, and thus prices have
decreased. However, nowadays consumers need to travel longer distances to get to
the store, and transport costs related to grocery shopping have increased (Heiskanen
et al., 2001). Additionally, the larger grocery stores are often not easily accessible to
consumers without a car. The development is reflected in the store selection criteria
of the consumers. Currently, distance to the store is the most important selection
criterion for 52 per cent of the consumers (Päivittäistavarakauppa, 2001). This, has
led to increasing sales in small convenience stores such as kiosks and petrol stations
shops, where the prices are not at all at the supermarket level.
2.2.4 The consumer in the traditional grocery supply chain
In the traditional grocery supply chain, the final exchange takes place in the grocery
stores or supermarkets, where the consumers select and buy the products. After
picking and purchasing, the consumers carry out do-it-yourself packing and home
delivery work.
Though there have been considerable structural changes in grocery retailing as
described earlier, consumers' shopping habits have not yet changed significantly. In
the future, the traditional grocery supply chain will face challenges based on changing
consumer demand. In Finland, for example, the number of households is increasing
and the average size of a household is decreasing (Heiskanen et al., 2001).
Additionally, the proportion of ageing or elderly people in the population is
increasing. According to Statistics Finland (2001), in 2010 17% and in 2020 some
23% of the population in Finland will be over 65 years of age. Additionally, the
increasing number of people using the Internet, expanding knowledge about online
services, and increasing confidence in online shopping (GER, 2001) can be seen as
factors accelerating customer demand for new services in grocery retailing.
The current shopping habits of Finnish consumers are briefly covered in the
following. In 2001, the yearly average amount of grocery purchases in Finland was
36
FIM 11,900 (2,001 euro) per capita (Päivittäistavarakauppa, 2001). Additionally,
Finns do grocery shopping frequently and buy relatively small purchases at any one
time. According to studies in Finland (Granfelt et al., 1995; Raijas, 1994; Pylvänäinen,
1996; Spåre & Pulkkinen, 1997: Päivittäistavarakauppa, 2001), households visit
grocery stores 3.4 to 5.0 times a week, depending on their place of residence and the
type of grocery store used. The average was 4.3 times a week in 1996 and 4.04 times
a week in 2001 (Spåre & Pulkkinen, 1997; Päivittäistavarakauppa, 2001). Although
the number of visits has constantly been declining, it is still reasonably high when
compared, for example, to US consumers, who make only 2.2 to 2.3 visits to
supermarkets a week (Priluck, 2001; Mendelson, 2001).
It has also been found that US consumers make two types of trips: regular trips on a
weekly basis and quick trips to pick up additional items (Priluck, 2001). Similarly, in
Finland time spent per shopping trip was, on average, 48 minutes on weekdays and
58 minutes at weekends (Spåre & Pulkkinen, 1997). Additionally, of the shopping
trips in Finland, a total of 57 per cent was spent in cars driving the average 3.5-
kilometre one way journey to the store and back (Granfelt et al., 1995).
In summary, according to Raijas (2000b), from the consumer's viewpoint, traditional
grocery shopping can be described as rational routine action. It is also obligatory and
regular. Some customers see grocery shopping as a burden, and want to do it as
quickly as possible, sacrificing as little time and effort as possible. Additionally, the
majority of consumers' shopping expenditure is associated with the shopping trip,
and during the last decade consumers' costs of shopping has increased. Reasons for
this include structural changes in retailing, longer shopping trips, and increased car
use, all of which have created the demand for developing electronic grocery shopping
and home delivery services.
2.3 e-Grocery supply chain
2.3.1 e-Grocery supply chain structure
In the e-grocery business the supply chain structure looks much like the traditional
grocery supply chain structure (Figure 5). However, in Figure 7 the direction of the
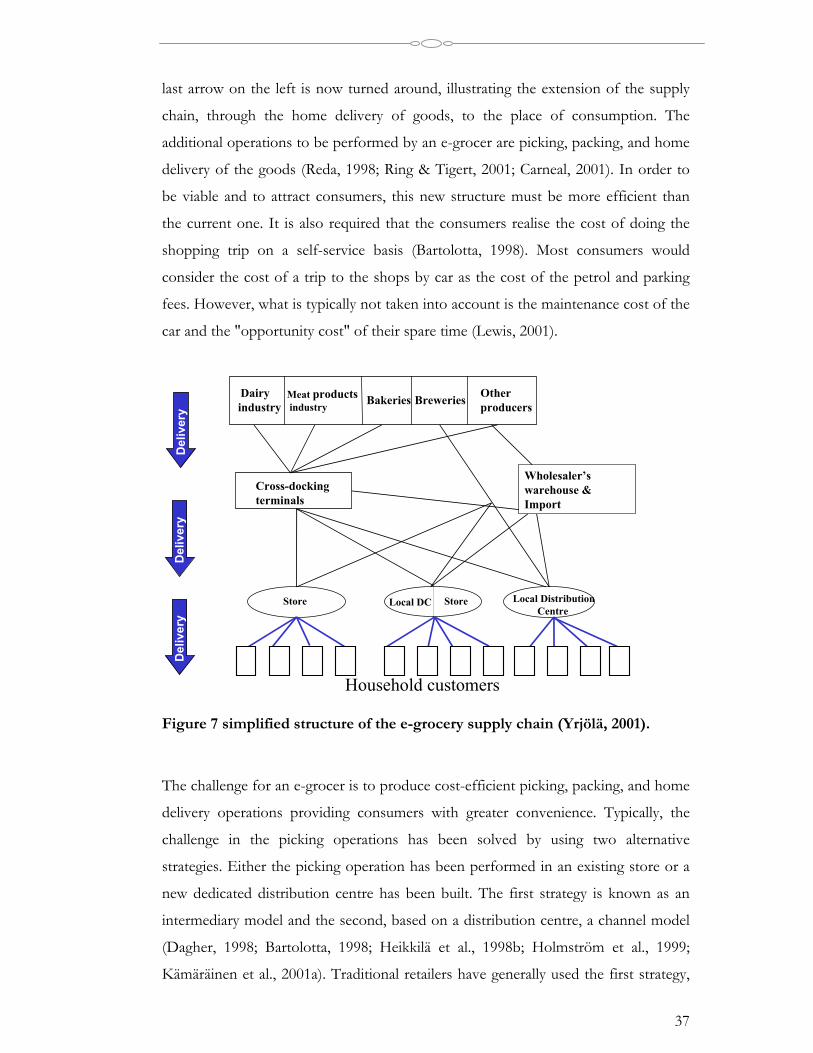
37
last arrow on the left is now turned around, illustrating the extension of the supply
chain, through the home delivery of goods, to the place of consumption. The
additional operations to be performed by an e-grocer are picking, packing, and home
delivery of the goods (Reda, 1998; Ring & Tigert, 2001; Carneal, 2001). In order to
be viable and to attract consumers, this new structure must be more efficient than
the current one. It is also required that the consumers realise the cost of doing the
shopping trip on a self-service basis (Bartolotta, 1998). Most consumers would
consider the cost of a trip to the shops by car as the cost of the petrol and parking
fees. However, what is typically not taken into account is the maintenance cost of the
car and the "opportunity cost" of their spare time (Lewis, 2001).
Dairyindustry
Meat products industry Bakeries Breweries Other
producers
Cross-dockingterminals
Local DistributionCentre
Local DC Store Store
Wholesaler’swarehouse &Import
Household customers
Del
iver
yD
eliv
ery
Del
iver
y
Figure 7 simplified structure of the e-grocery supply chain (Yrjölä, 2001).
The challenge for an e-grocer is to produce cost-efficient picking, packing, and home
delivery operations providing consumers with greater convenience. Typically, the
challenge in the picking operations has been solved by using two alternative
strategies. Either the picking operation has been performed in an existing store or a
new dedicated distribution centre has been built. The first strategy is known as an
intermediary model and the second, based on a distribution centre, a channel model
(Dagher, 1998; Bartolotta, 1998; Heikkilä et al., 1998b; Holmström et al., 1999;
Kämäräinen et al., 2001a). Traditional retailers have generally used the first strategy,

38
in which e-grocery operations are based on current store infrastructure. The second
strategy, based on distribution centres, has been used mainly by the new rival
competitors who are also known as "pure play" e-grocers. Jaakola (1999) and Yrjölä
(2001) suggest a third strategy for performing the picking operations. The idea is that
a traditional store could be partly transformed into a local distribution centre serving
an e-grocery picking operation. Also the alternative picking strategies are shown in
Figure 7.
2.3.2 e-Grocery operations
The first online grocer, Grocery Express, was founded in San Francisco in 1981. It
offered home delivery of grocery products ordered via an on-line service with a
simple user interface in addition to phone and fax. Grocery Express was eventually
closed down because of logistical challenges and inability to build scale (Mendelson,
2001). After the fast market growth from mid 1990's to the end of 1990's, many new
players with different operations models, such as Webvan, Streamline, Homegrocer,
Peapod, and Groceryworks have either collapsed or been acquired by traditional
retailers. However, successful and profitable operations models such as Tesco's,
started in 1996 based on picking from existing stores, have been developed and today
Tesco.com is the world's biggest e-grocer with sales of £356 million or 535 million
euros in 2002 (Reinhardt, 2001; Reynolds, 2002). Currently, other big players are
Peapod (120 million euro in 2001), Safeway (65 million euro in 2001), Sainsbury’s (65
million euro in 2001), Asda Wal-Mart (60 million euro in 2001), Iceland (50 million
euro in 2001), and Carrefour (50 million euro in 2001) (Van Gelder 2002a).
The market share of online grocery shopping is tiny at the moment, only 0.3-0.7 per
cent in the UK (Finch, 2001; @ Your Home, 2001), 0.22 per cent in the USA (IDC,
2000; Van der Laan, 2000), and 0.1 per cent in Finland (Päivittäistavarakauppa, 2001).
However, the growth estimates for e-grocery business tend to range from 3 to 10 per
cent of the grocery market by 2005-2010, in both the USA and Europe. Thus, it is
worth trying to learn from the mistakes made by the early e-grocers.
During the biggest hype of e-commerce in the years 1999 to 2000, the pure play e-
grocers in particular invested heavily in dedicated distribution centres to make
39
possible efficient picking and packing operations. Webvan, for example, invested
around $35 million in each of its fully automated distribution facilities (Himelstein,
1999; Sandoval, 2000b, Perman, 2000). Because of lower than expected growth in
customer demand, low capacity utilisation, and high investments, this structure soon
proved highly unprofitable. Currently, the major e-grocers rely on their traditional
stores when considering their picking operations. For example, Tesco.com uses 250
of its 690 stores for e-grocery picking operations, covering 91% of the population in
the UK (Reinhardt, 2001; Jones, 2001; Knichel, 2001).
Regardless of the strategy used in e-grocery picking operations, the goods must be
delivered to the customer. Because of the nature of grocery products, the picking and
home delivery operations must be performed locally. According to John Caltigerone,
former logistics director for Peapod, online grocers forgot that they must home
deliver the products to the customers. Instead of their betting on fulfilling high
customer demand based on estimates suggesting rapid growth, the process should
have been started smaller and then enlarged once the business could support the
costs (Carneal, 2001; Tanskanen et al., 2002). Similarly, according to Van der Laan
(2000), success in online food retailing depends on two factors, market potential and
distribution costs, which are interdependent.
Currently, the cost of picking and home delivery operations in the Tesco.com e-
grocery supply chain is approximately 14 per cent of sales, divided evenly between
both operations (Reinhardt, 2001). Tesco.com performs its picking operations in
traditional stores, and offers home delivery with attended reception and 2-hour
delivery time windows. The delivery fee charged is USD 7.26 (£5) per order. The
average purchase from Tesco.com in 2001 was around USD 123, more than three
times a typical supermarket purchase of USD 35 in Tesco store. For Webvan, the
cost of picking and home delivery operations was as much as 26 per cent of sales,
and the average shopping basket size was USD 114 (Reinhardt, 2001). At that time,
Webvan executed its picking operations in fully automated distribution centres, and
offered free home delivery with attended reception and 1-hour delivery time
windows. Additionally, as already described in the introduction, Streamline offered
reception boxes for their customers in order to offer a convenient unattended
40
reception service for the customer and to operate home delivery cost-effectively1.
According to Lardner (1998), Streamline also succeeded in its attempt to please
customers and reach, on average, 10 deliveries an hour, while others in the field at
that time were struggling to reach three deliveries an hour. However, in November
2000 Streamline had to close down its business because of lower than expected
market growth (Nasdaq, 2000; Junnakar, 2000).
As in the USA and elsewhere in Europe, in Finland e-grocery shopping is still in its
infancy. At the moment, the customer base for the e-grocery businesses consists
mainly of busy well-off families with children, as well as elderly and disabled people
(Tuunainen, 1999; Raijas, 2000b; Anckar et al., 2002). In Finland, the e-grocery
market share was only around 0.1 per cent in 2000, and the value of an e-grocery
shopping basket was, on average, 85 euro (Päivittäistavarakauppa, 2001; Raijas,
2000b). In 2000, there were around 20 e-grocers in Finland, but the amount has since
decreased. Currently, e-grocery services in Finland are provided by a handful of
service providers in different cities. Most e-grocers operate next to a traditional
supermarket, and the home delivery transportation is usually an additional service
provided using outsourced service providers. Ruokavarasto, providing e-grocery
services in eight cities in southern Finland based on the Ruokavarasto stores, is the
largest Finnish e-grocer at the moment. Ruokarasti operates based on store picking
and outsourced home delivery in Kuopio and Ykköshalli, and K-Supermarket Hertta
operate in the Helsinki metropolitan area. The latter two also operate based on
traditional store picking and outsourced home delivery service. Currently, only two
operators, Nettimarket in Turku and Ruokanet in the Helsinki metropolitan area, use
wholesaler warehouses for their picking operations.
The delivery time windows for attended reception are normally one to three hours
(Ykköshalli, 2003; Ruokanet, 2003; Ruokavarasto, 2003; Ruokarasti, 2003; Hertta,
2003; Nettimarket, 2003). In addition, S-Group had a two-year e-grocery pilot
operation, launched in June 2000 in co-operation with the Ecomlog research group,
1 Hoover et al. (2001) refer to Streamline's concept based on customer-specific
unattended reception as a "we service your home" grocery business model.
41
offering e-grocery services and a home delivery model in which the groceries were
delivered to locked reception boxes located in customers' yards (Huhtakangas, 2000;
SOK, 2001). Currently, Ruokavarasto has taken over the S-Groups pilot operation
and continues developing the e-grocery service models offering both attended and
unattended reception options.
2.3.3 Motivations for e-grocery
From the consumer's point of view, electronic grocery shopping is a new attractive
service model providing help in everyday life for many consumers. The premise of
the consumer direct channel is for the consumer to be able to order groceries and
other products from home, and have them delivered to the door. This appeals
particularly to people with little time or desire to shop and those unable to leave the
home (Bartolotta, 1998; Hoyt, 2001).
Based on longitudinal data collected in three studies in 1998, 1999, and 2001,
Morganosky & Cude (2002) describe the typical e-grocery customer to be younger
that 45 years of age, female, and a college graduate. Additionally, customer
households typically include children and two adults and the annual household
income is USD 70,000 or more. This type of customer profile is also identified as the
typical online grocery shopper in earlier research (Lardner, 1998; Ingram, 1999).
According to Raijas (2000) and Morganosky & Cude (2000 and 2002), the customer's
main motivations for using e-grocery services are convenience, time saving, and
avoiding the work involved in picking and home delivery. Additionally, a significant
proportion of customers (15%) cited physical or constraint issues as their primary
reason for online shopping.
Nowadays, the customers are also buying the same product groups online as in
traditional grocery stores. According to Morganosky & Cude (2002) in their most
recent study 80 per cent of customers were willing to buy any grocery item online,
whereas in their first study in 1998 only 48 per cent responded this way. Additionally,
e-grocery customers particularly appreciate being able to buy packaged and heavy
42
goods such as beverages (Raijas, 2000b). These product groups are also the easiest to
preserve in the e-grocery supply chain all the way from picking to home delivery.
From the retailer's point of view the consumer direct market seems tempting.
Retailers believe that electronic grocery shopping will form a significant part of the
future market, and high customer service levels are an essential element for satisfying
customer requirements (Lewis, 2000). In contrast with the e-commerce hype in 1999
to 2000, nowadays the consumers using the online shopping services are not price
sensitive. This is because the main motivation for using online services is
convenience and time savings or physical/constraint issues. According to Anckar et
al. (2002), online shoppers are willing to pay a slightly higher price than in the
traditional stores or alternatively a delivery fee, as shown by Tesco.com (Reinhardt,
2001) in order to have the convenience benefits. However, many operational
questions are still unanswered from the service provider's point of view.
According to Bartolotta (1998), the ability of a pure play online grocer to deliver
higher net profits rests on the fact that it is more efficient than the traditional retail
channel. Using warehouses for picking the orders, enabling the elimination of retail
stores in, high priced locations was seen as a means to reduce cost levels. Cost
reductions could also be achieved by reducing labour costs and inventory levels.
Furthermore, bundling of non-traditional services such as Streamline was seen as a
driver to attract new customers and increase the average gross margins. Additionally,
this type of wholesale or warehouse based operations model (channel model) offered
the possibility to new competitors to enter the retailing market. However, at least the
first pure play online grocers have failed as the examples of Webvan, Streamline, and
Matomera show. This implies that the operations models and service offerings
provided still needs to be developed, and the appropriate customer groups must be
better defined in the future.
From the traditional retailer's point of view, entering the consumer direct channel is
additionally seen as a possibility. Initially, the main motivation of traditional retailers
for entering the market, however, was to respond to the pure play e-grocers'
offerings. At the moment Tesco, for example, sees online grocery as a way to build
and expand its relationship with the customers (Hoyt, 2001). Since the frequency of
43
ordering groceries is higher than with other products, the online grocery shoppers
could be offered other product groups a side increasing the total sales. If the picking
operations were to be based on using the existing store infrastructure, higher
resource utilisation of the existing assets would be achieved (Knichel, 2001).
Efficiency of this operations model would became a problem only with higher
customer demand and demand peaks (Reinhardt, 2001; Kämäräinen & Punakivi,
2002). If most customers order via e-grocery only once a week, this accumulates the
deliveries to demand peaks. These peaks are usually on Fridays and Saturdays, as with
a traditional grocery business. This reduces operational efficiency and so increases
costs (Kämäräinen & Punakivi 2002).
Additionally, it was seen that by offering online grocery shopping, the retailer could
enlarge the geographic service area covered, while taking the transportation
restriction into account (Kyyrö, 2000). By offering better customer service, the
retailer could also gain higher market share through extra sales from both new
customers due to higher reach and by winning competitors customers. Here, a risk of
cannibalisation of the existing business was identified (Hoyt, 2001). Since the grocery
business is highly local because of transportation costs, many of the "new" online
customers would in fact be established, regular customers who actually become less
profitable for the retailer when shopping electronically (Anckar et al., 2002). Tesco,
however, reported that one-third of its online customers had never shopped in Tesco
stores, and that 25 per cent of the online sales come from new customers and 25 per
cent from increasing spend (Knichel, 2001; Hoyt, 2001).
From society's point of view, there is also motivation for supporting the
development of e-grocery services. Creation of online grocery shopping services with
home delivery would support offering better and/or lower cost services to disabled
and elderly people living at home (Tuunainen, 1999). Another social aspect related to
the creation of e-commerce services is the question of coverage. Are the people
living in deprived urban environments or in rural areas excluded from e-commerce
services and what are the logistical solutions in those areas (Reynolds, 2000; Lewis,
2000)? An additional aspect is environmental sustainability. What is the capability of
e-grocery and other e-commerce sectors with home delivery to affect the increase of
overall traffic levels, congestion, and the level of traffic emissions? The overall

44
impact on traffic levels depends upon the balance between total distance travelled by
home delivery vans and the impact that this has upon customer travel behaviour
(Reynolds, 2000; Lewis, 2000). As this topic is one of the focus areas in this
dissertation, it is covered in more detail in Chapter 2.5.4.
In brief, the development of more efficient operations models supporting the
consumer direct channel is seen an important topic from many points of view,
thereby strengthening the motivation for this dissertation.
2.4 Modelling in logistics decision-making
Since the focus in this dissertation is modelling existing and emerging home delivery
models in the e-grocery business, a brief introduction to modelling in logistics
decision-making and a more thorough description of the home delivery business are
presented next.
Currently, modelling is an important part of logistics analysis, planning, and decision-
making. Today, logistics networks, and often also individual supply chains, are highly
complex. However, the logistical decisions and operational models selected directly
affect the profitability both of the individual company and the whole supply chain.
One major complicating factor in logistics decision-making is the high amount of
data available concerning the various logistics functions. Trying to find better
operations models is not easy and that is where computer models are used (Powers,
1989).
The facility or process of interest is usually called a system and in order to study it a
set of assumptions often has to be made about how it works (Law & Kelton, 2000).
These assumptions, usually mathematical or logical relationships, constitute a model
that is used to gain a better understanding of how the system of interest behaves
(Law & Kelton, 2000).
Analysing logistical problems involves the organisation of the available data into
meaningful information in the form of alternative solutions. Making decisions based
on the analysis is then simply a matter of choosing from among the alternatives to
45
get the best outcome. The more alternatives there are and the more complete the
analysis, the better the chances of selecting the right solution (Powers, 1989).
According to the classification used by, for example, Powers (1989) and Mentzer
(1989), there are three modelling techniques in logistics decision-making:
optimisation, heuristics, and simulation. More recently, Seppälä (1996) too has
divided the modelling techniques similarly and, additionally, includes simple
spreadsheet models. Law & Kelton (2000), however, due to their focus on
simulation, divide the mathematical models into analytical models and simulation.
According to Law & Kelton (2000), if the model is simple enough, it may be possible
to work with its relationships and quantities to get an exact analytical solution.
However, highly complex systems often lead to too-complex mathematical models,
precluding analytical solutions (Law & Kelton, 2000).
According to Bowersox & Closs (1989), the division used by Law & Kelton (2000) is
common in practice and practitioners then group heuristic and simulation models as
one methodology, whereas analytical modelling is seen as equal to optimisation. In
the following paragraphs the characteristics of the three modelling techniques in
logistics decision-making are briefly presented.
In its simplest form, optimisation merely means that no better answer exists to a
given mathematical problem (Powers, 1989). The mathematical problem may be very
complex, consisting of thousands of variables and equations. An example of such a
complex mathematical problem would be a logistics network (Powers, 1989).
According to Mentzer (1989), optimisation is the best approach if it will work;
however, it is the largest user of computer capacity and the most restrictive in
assumptions, and is unable to deal with the uncertainty of logistics operations. When
compared to heuristics, the primary difference is the degree of mathematical
precision (Bowersox & Closs, 1989).
Heuristics are rules of thumb or common sense solution approaches (Powers, 1989)
that direct the solution approach toward the best solution but do not guarantee that
it will be found. The idea is to find a satisfactory rather than an optimal solution, but
in a fraction of the computational time required, for example, in an optimisation

46
approach (Ballou, 1989). Ballou (1989) describes good heuristics as being frequently
the result of common sense procedures that work effectively. Heuristics may be
based on concepts, principles, and theories that relate to a specific problem, or they
may result from observing the form of optimised solutions and imitating them
(Ballou, 1989). Heuristics are typically used in truck routing and scheduling,
warehouse location problems, and designing the layout of items in a warehouse
(Ballou, 1989). According to Mentzer (1989), heuristics also suffers from an
abstraction from reality, especially uncertainty, but not to the same degree as
optimisation. Typical of heuristics are lower computer resource needs and less
restrictive assumptions leading to only satisfactory, rather than optimal, answers to a
given problem (Mentzer, 1989).
Simulation can be described as building an experimental model of a system, usually in
great detail, and then evaluating alternatives that are fully specific to the model in a
series of test runs (Powers, 1989). According to Law & Kelton (2000), in simulations
a computer is used to evaluate a model numerically, and data is gathered in order to
estimate the desired true characteristics of the model. Examples of suitable targets
for simulation are conveyor systems in a factory or queuing and inventory systems
(Law & Kelton, 2000). Additionally, channel structure and facility location analyses,
as well as evaluating trade-offs between costs and service level, are also typical
(Bowersox & Closs, 1989). According to Bowersox & Closs (1989), simulation will
seek merely "better" as opposed to "optimal" solutions to the problems analysed.
Additionally, the distinguishing feature of simulation is its capability to include
dynamic and stochastic situations, i.e. the model may evolve over time and involve at
least some random input components, providing the most realistic analysis of the
problem (Lehtonen J-M, 1999).
According to Mentzer (1989), each of these techniques is viable in solving particular
logistics problems. However, in order to make intelligent analysis and decisions,
matching the specific problem to the right approach seems appropriate. Additionally,
the different modelling techniques are often used in combination (Bowersox &
Closs, 1989).
47
Usage of modelling techniques in logistics decision making has become more and
more common. In the 1990s especially the spreadsheet packages begin to play major
role in modelling and solving management science problems (Lawrence &
Pasternack, 2002). Today enterprise requirements planning software (ERP) typically
includes also logistics modelling tools. For example, the worlds leading ERP-
software, SAP R/3, include optional modelling packages from CAPS Logistics
(CAPS, 2002).
In this dissertation the home delivery operations are modelled using CAPS RoutePro,
a commercially available vehicle routing tool from CAPS Logistics. Thus, the
modelling technique selected in this dissertation for modelling home delivery
operations is heuristics. The heuristic algorithm used was developed by CAPS
Logistics. The functionality of the Route Pro vehicle routing tool and the selected
routing algorithm is explained thoroughly in Chapter 4.
2.5 Backgrounds for modelling home delivery operations
2.5.1 General
Home shopping is the provision of goods directly by a company to a customer in
response to an order. The order could have been generated in a number of ways:
general catalogues, direct catalogues etc., but the essence of mail order is provision -
the final point of the logistics network being the customer's home. (Brady &
Harrison, 1990)
As stated in the above definition the development of consumer direct markets has
created a fundamental change in the design of retail supply chains, from store-centric
to customer-centric. Typically, retail supply chains were designed to move products
efficiently from many vendors to a finite number of stores. Theoretically, a consumer
direct supply chain allows shipment from any place to any customer (Bonning et al.,
1998). However, in practice the final home delivery of the products is very much a
local business (Carneal, 2001). Regardless of the product group, the basic principles
of achieving success in the home delivery business depend on the same fundamental
characteristics as in cost-efficient transportation generally.
48
In transportation economy of scale refers to the fact that the transportation cost per
unit of weight decreases when the size of the shipment increases. As an example,
truckload (TL) shipments utilising the entire vehicle's capacity cost less per pound
than less-than-truckload (LTL) shipments utilising only a portion of the vehicle's
capacity. The economies of scale exist because fixed expenses associated with
moving a load can be spread over the load's weight (Bowersox et. al, 1996).
The fixed expenses, which do not vary with shipment volume, include terminal
facilities, transport equipment, administrative costs such as taking the order, time for
positioning the vehicle for loading or unloading, and invoicing. The variable costs
usually include fuel and labour, equipment maintenance, handling, and loading and
unloading (Ballou, 1999; Bowersox et. al, 1996).
Over the past few decades a serious problem was found in small-shipment
transportation. For a common carrier it was difficult to provide a reasonably priced
small-shipment service because of the significant overhead costs associated with
terminal and line-haul services. This offered a market entrance opportunity for new
companies offering a specialised small-shipment service or parcel service. Today,
parcel delivery services represent an important part of transportation infrastructure
(Bowersox et. al, 1996). Examples of parcel delivery service providers of this type are
UPS (United Parcel Service Inc.), FedEx (Federal Express Corporation), DHL, and
TNT.
2.5.2 Home delivery market
The growth of home delivery markets has been strong. According to the Retail
Logistics Task Force report @ Your Home (2001), for example, the UK internal
market for express delivery services in 1998 was 660 million small packages and had
a value of £1554 million. Of the packages delivered, around 60 per cent were
business-to-consumer (B2C) deliveries. In the B2C sector parcel services have
increased, primarily to support the fast-growing area of non-store retailing, based on
catalogue or mail ordering of merchandise and subsequent home delivery. This
consumer direct channel has recently been expanding rapidly, along with mail-order
49
sales growth and the growth of e-commerce. For example, in the UK the value of the
total home delivery market is likely to rise by 83 per cent, from £18.3 billion in 2000
to £34.5 billion by 2005 (Rowlands, 2001b; @ Your Home, 2001). Additionally,
Forrester (Brooksher, 1999) estimates that along with the growth in online sales, the
number of residential deliveries in the USA will exceed 2.1 billion by 2003.
In Finland the Post, national postal service provider, is the leading distribution
channel for mail order business, e-business, and companies' postal services. The Post
delivers around 25 million packages (less than 35 kg) yearly of which some 50 per
cent is B2C deliveries. The Post has strong market share in Finland covering around
two thirds of the parcel market. The Post is strong especially in delivering B2C mail
order parcels and aims for increasing its share of B2B parcel market as well. It is
estimated that the economic downturn in 2001-2002 has decreased the total parcel
volume slightly in Finland (Lassila, 2000; Posti, 2002).
2.5.3 Key elements in home delivery
In the home delivery business, consolidating many small shipments into the same
truckload enables cost efficiency to be reached. According to Lee and Whang (2001),
the cost of delivery is justified only if there is a high concentration of orders from
customers located in close proximity or if the value of the order is large enough.
However, the consolidation of several orders also raises the problem of how to reach
cost-efficient delivery operations. In selecting their operating strategy, the service
providers have to consider the following elements affecting to the cost-efficiency of
home delivery (Van der Laan, 2000; Laseter et al., 2000; Reinhardt, 2001; Browne,
2001):
• size of the service area,
• order frequency,
• number of companies offering home deliveries,
• market penetration of home shopping,
• the higher the average order size the better,
• delivery charges,
• customer density,
50
• the average distance from the warehouse or store to the customers,
• the average distance between customers,
• vehicle routing according to the promised delivery time windows,
• the stop time at customers’ locations,
• the loading and unloading time,
• handling efficiency,
• cost per hour,
• vehicle fill rate, and
• capital investment.
However, the paradox in developing home delivery operations is that as online
shopping markets increase, the likelihood of the customers being at home to receive
the delivery seems to decrease. According to the Retail Logistics Task Force report
@ Your Home (2001), as many as 60 per cent of home deliveries may fail due to the
absence of the customer from the home, causing increased costs to the distributor
and inconvenience to the customer. One of the solutions presented to solve the
problem in the home delivery business is unattended reception of orders
(McKinnon, 1996; Reda, 1998; Lardner, 1998; Lewis, 2001). This would allow a wide
delivery time window, a better possibility of optimising vehicle routing, and
maximum utilisation of transportation equipment, as well as of the personnel
involved. Furthermore, the level of customer convenience would increase
significantly, as the customers would be totally independent of the delivery timetable.
2.5.4 Vehicle routing
Reaching cost-efficient e-grocery home delivery operations is challenging, for
example, due to constantly-changing customer locations, failed deliveries because
customers are not at home, rush hours, multiple delivery vans, parking restrictions,
and tight delivery time windows promised to the customers (Reda, 1998; Lardner,
1998). Vehicle routing problems, as in e-grocery home delivery operations, typically
arise in situations where vehicles must travel to a variety of locations to deliver or
pick up goods or provide services. Generally, the goal in solving vehicle routing
problems is to achieve minimal total operating costs based on a high rate of
51
deliveries per hour and high vehicle fill rate. However, at the same time the aim is to
fulfil the service offering promised to the customer. Good solutions to routing
problems can be found by applying the following 8 principles (Ballou, 1999):
1. load trucks with stop volumes that are in the closest proximity to each other,
2. stops on different days should be arranged to produce tight clusters or
service areas,
3. build routes beginning with the farthest stop from the depot,
4. the sequence of stops on a truck route should form a teardrop pattern, so
that no paths of the route cross,
5. the most efficient routes are built using the largest vehicles available,
6. pickups should be mixed into the delivery routes rather than assigned to the
end of routes,
7. a stop that is greatly removed from a route cluster is a good candidate for an
alternative means of delivery, and
8. narrow stop time window restrictions should be avoided.
These types of guideline principle are the result of long research and development
work both in practice and theory. However, in the e-grocery home delivery business
the deliveries are made in suburban and urban areas hindering, for example, the
possibility to use large vehicles. Additionally, the service models selected by the e-
grocers has typically led to a situation with a narrow delivery time windows, like
described in the introduction and literature review. However, the principles
presented by Ballou (1999) are seen very useful in this dissertation and are based on
wide body of knowledge in vehicle routing briefly described in the following.
Optimal solutions for vehicle routing problems have been studied intensively and
one of the most widely studied and best-known routing problems is the Travelling
Salesman Problem (TSP) (Lawler et al., 1985; Onal et al., 1996). TSP is a problem in
which a number of cities have to be visited by a salesman who must return to the
same starting point; each city must be visited exactly once and the aim is to minimise
the total distance travelled (Perttunen, 1995). The Vehicle Routing Problem (VRP) is
an extension of TSP. According to Solomon (1987), in VRP the problem is to design
a set of minimum-cost vehicle routes for a fleet of vehicles from a central depot to a
set of customers (cities, stores, warehouses etc.) with known demand. The routes

52
must be designed so that each customer is served exactly once by one vehicle and
taking into account the fact that the total demand of all points on the route does not
exceed the vehicle capacity (Desrochers et al., 1992; Bräysy, 2001). Routing and
scheduling problems are typically NP-hard problems, for which no polynomially-
bounded algorithm has yet been found, meaning that solving these problems
optimally suffers from an exponential growth in computational burden with problem
size (Bräysy, 2001). In other words NP-hard problems are difficult because there is
no algorithm that will solve them swiftly and optimally. Instead, all possible solutions
have to be tried to find out which produces the best result.
The e-grocery home delivery problem has the characteristics of a Vehicle Routing
Problem with Time Windows (VRPTW). In VRPTW added complexity is involved,
when compared to VRP (Desrochers et al., 1992). In VRPTW every customer may
select a time window, the earliest and the latest time within which the customer
should be served (Desrochers et al., 1992). The objective is to minimise both
distances travelled and the total duration of routes, in addition to the number of
routes, which is often the primary criterion. Additional complexities in VRPTW are
the length-of-route constraint arising from depot time windows and the cost of
waiting time if the vehicle comes to a customer location too early (Solomon &
Desrosiers, 1988; Bräysy, 2001).
Vehicle routing problems with time windows have recently been investigated
intensively by a number of operations researchers (for example Golden & Assad,
1986; Solomon, 1987; Solomon et al., 1988; Desrosiers et al. 1988; Desrochers et al.,
1988; Bodin, 1990; Desrochers et al., 1992; Desrosiers et al., 1995; Bramel & Simchi-
Levi, 1996; Bräysy, 2001). However, the vehicle routing problems have been studied
widely since as long ago as the late fifties. Danzig and Ramser (1959) described a
practical problem concerned with delivering petrol to filling stations. According to
Fisher (1995), this was the first formulation of the general vehicle routing problem.
Soon after that, Clark and Wright (1964) presented probably the best-known route-
building heuristic, the Clark and Wright savings method, beginning with a solution in
which every customer is supplied individually by a separate vehicle. By combining
any two of these single customer routes, one less vehicle is needed and costs would
be reduced. A few years later, Pullen and Webb (1967) developed a heuristic-based

53
system for scheduling van drivers’ duty schedules for the bulk conveyance of mail in
the Central London area in order to reduce idle and empty-running time between
jobs. At the same time, Knight and Hofer (1968) presented a case study of a contract
transport company where a heuristic manual system was developed to increase the
utilisation of its 40 vehicles in the London area. In this case study the service time
windows of individual customers were also taken into consideration. Since the simple
heuristics of the 1960s and 1970s, the development of better vehicle routing methods
has continued constantly. For example, mathematical programming-based heuristics
have been applied. Additionally, exact optimisation algorithms and artificial
intelligence techniques have been developed (Fisher, 1995).
Recently, in the context of developing last mile physical distribution operations,
vehicle routing tools have been used, for example, in research on city logistics
focusing on co-operation between various freight forwarders delivering goods to the
shops in the inner city (Taniguchi & Van Der Heijden, 2000). Studies have also been
carried out analysing the effects of unattended reception in the e-grocery home
delivery business. Kallio et al. (2000) used a spreadsheet model, Kämäräinen et al.
(2001a) used a vehicle routing tool in a one vehicle environment, Punakivi & Saranen
(2001), Punakivi et al. (2001), and Punakivi & Tanskanen (2002) used a vehicle
routing tool in a multi-vehicle environment with real point-of-sale data. In these
analyses, the usage of unattended reception actually relaxes the time window
constraint and in this way enables more optimal vehicle routing. Additionally,
analysis of grocery home delivery operations has been conducted that takes into
consideration the environmental effects of home delivery services (Cairns, 1998;
Cairns, 1999). This theme is covered in greater depth in the next chapter.
2.5.5 The possible effects of home delivery services on road traffic
As stated earlier, home shopping is currently becoming more general both in Europe
and the USA. Various associated home delivery models have been developed and are
still in the process of development. However, knowledge of the possible effects of
consumer direct selling and home delivery services on road traffic and the
environment is still fairly sparse. It is challenging to make specific estimates or
54
analyses, since the future market demand for this type of service is unknown at the
moment.
On the one hand it is argued that home delivery services are an environmental
solution, as they release people from carrying what they buy and encourage them to
make their shopping trips using public transport services, thus potentially reducing
car traffic and dependence on cars. Additionally, home delivery services could bring
social benefits, such as new service options for elderly or disabled people who have
trouble getting to the shops themselves (Tuunainen, 1999; Heikkilä et al, 1999).
Shoppers may also be able to fulfil their needs in a single trip, eliminating the need
for a separate trip from the main weekly trip (Lewis, 2000). On the other hand it is
argued that home delivery services may cause an environmental disaster, due to
increasing road freight traffic in population centres while customers still make
additional shopping trips using their cars, for example to buy fresh food or visit
different retail outlets. Additionally, delivery services are also likely to be used by
non-car owners, who may have previously done the shopping without using a
vehicle, thus generating a net increase in traffic (Cairns, 1999; @ Your Home, 2001).
Political decision-makers are, however, in favour of developing new services that
offer the potential to reduce overall road traffic and traffic emissions, lessen the need
for travelling, and reduce car dependence in everyday activities (Cairns, 1997;
Department of Environment, Transport & the Regions, 1998; @ Your Home, 2001;
EU, 2002; Nuutinen, 2002; YTV, 2001). Currently, for example, the Department for
Transport, Local Government and the Regions in the UK is committed to the
commissioning of new research in the home delivery sector, dealing with issues such
as operational transportation efficiency and the environmental impacts of increasing
home shopping (DTLR, 2002).
A supportive attitude from policymakers and strong development in the area has
encouraged analysis focusing on the environmental issues connected with home
delivery services. However, only a few studies covering information relevant to this
focus area have been published. Interviews dealing with service provider experiences
and customer questionnaires have been reported, covering associated changes in
customers’ shopping and travelling behaviour (Cairns, 1996; Cairns, 1999; Tacken,
1990; Knichel, 2001). Additionally, Cairns (1997) built a hypothetical home delivery
55
models using Geographical Information System TransCAD and analysed the trade-
off between car trips and home delivery service, taking into consideration the
distance driven. Cairns (1997) showed that even with a relatively small number of
customers and vans which can only carry 8 loads of shopping each, 70-80 per cent of
vehicle kilometres could be saved if customers no longer travelled to the shops by
car, but had their shopping delivered from the same store by a fleet of delivery vans
instead. In practice, the traffic reduction would increase still further if customers
were concentrated in particular locations such as specific housing estates or along
bus routes (Cairns, 1997). Generally, this result implies that there would still be a
traffic reduction if 7 out of 10 customers continued to use their cars for shopping
trips along with using the home delivery service. However, it was noted in Cairns
(1999) that the 70-80 per cent mileage savings would only apply to the customers
using the home delivery services. Based on estimates that the maximum usage of the
e-grocery and home delivery services would be 10-20 per cent of all customers, the
traffic reduction at a local store resulting from the replacement of car trips by van
trips could be in the range of 7-16 per cent (Cairns, 1999).
Additionally, on the basis of recent reports, home shopping and home delivery
services are likely to change customers’ shopping and travelling behaviour. According
to Knichel (2001) and Reinhardt (2001), the average shopping basket ordered from
Tesco.com is USD 123. This is nearly four times more valuable than the average
shopping basket, USD 34, sold in a Tesco store. This implies that the customers
shopping online and using home delivery services tend to buy more and shop less
often so as to get the most out of the delivery charge. Furthermore, according to
Cairns (1999), 61 per cent of the home delivery customers of The Food Ferry, an
independent e-grocery service provider operating in London, are the owners of at
least one car. Of the car owners, 74 per cent were nowadays using their cars less
because of shopping with The Food Ferry. In a similar customer questionnaire
(Tacken, 1990), 70 per cent of the home delivery customers of James Telesuper in
Amstelveen in the Netherlands believed that the service saved them time. Two-thirds
of the customers were the owners of at least one car. When asked how their means
of travel for shopping had changed, 28 per cent of the customers estimated that they
travelled less by car, 23 per cent said that they walked more often, and 14 per cent
travelled more by bike.
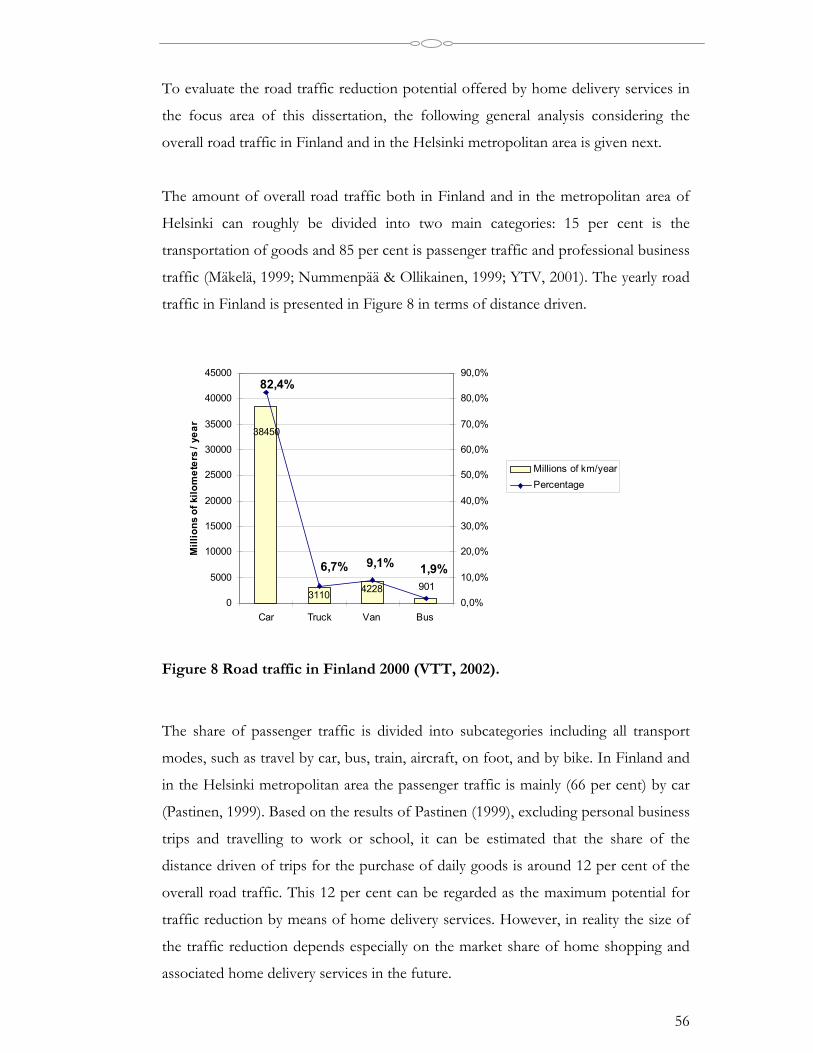
56
To evaluate the road traffic reduction potential offered by home delivery services in
the focus area of this dissertation, the following general analysis considering the
overall road traffic in Finland and in the Helsinki metropolitan area is given next.
The amount of overall road traffic both in Finland and in the metropolitan area of
Helsinki can roughly be divided into two main categories: 15 per cent is the
transportation of goods and 85 per cent is passenger traffic and professional business
traffic (Mäkelä, 1999; Nummenpää & Ollikainen, 1999; YTV, 2001). The yearly road
traffic in Finland is presented in Figure 8 in terms of distance driven.
38450
3110 4228 901
82,4%
6,7% 9,1% 1,9%
0
5000
10000
15000
20000
25000
30000
35000
40000
45000
Car Truck Van Bus
Mill
ions
of k
ilom
eter
s / y
ear
0,0%
10,0%
20,0%
30,0%
40,0%
50,0%
60,0%
70,0%
80,0%
90,0%
Millions of km/yearPercentage
Figure 8 Road traffic in Finland 2000 (VTT, 2002).
The share of passenger traffic is divided into subcategories including all transport
modes, such as travel by car, bus, train, aircraft, on foot, and by bike. In Finland and
in the Helsinki metropolitan area the passenger traffic is mainly (66 per cent) by car
(Pastinen, 1999). Based on the results of Pastinen (1999), excluding personal business
trips and travelling to work or school, it can be estimated that the share of the
distance driven of trips for the purchase of daily goods is around 12 per cent of the
overall road traffic. This 12 per cent can be regarded as the maximum potential for
traffic reduction by means of home delivery services. However, in reality the size of
the traffic reduction depends especially on the market share of home shopping and
associated home delivery services in the future.
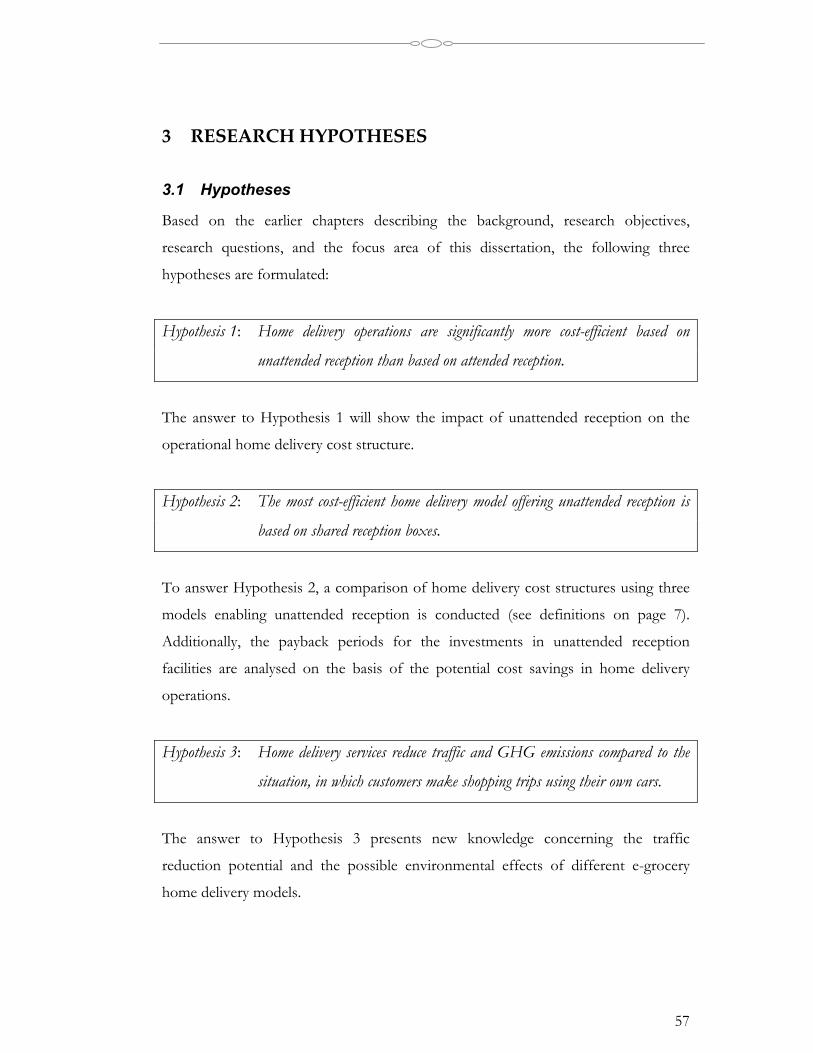
57
3 RESEARCH HYPOTHESES
3.1 Hypotheses
Based on the earlier chapters describing the background, research objectives,
research questions, and the focus area of this dissertation, the following three
hypotheses are formulated:
Hypothesis 1: Home delivery operations are significantly more cost-efficient based on
unattended reception than based on attended reception.
The answer to Hypothesis 1 will show the impact of unattended reception on the
operational home delivery cost structure.
Hypothesis 2: The most cost-efficient home delivery model offering unattended reception is
based on shared reception boxes.
To answer Hypothesis 2, a comparison of home delivery cost structures using three
models enabling unattended reception is conducted (see definitions on page 7).
Additionally, the payback periods for the investments in unattended reception
facilities are analysed on the basis of the potential cost savings in home delivery
operations.
Hypothesis 3: Home delivery services reduce traffic and GHG emissions compared to the
situation, in which customers make shopping trips using their own cars.
The answer to Hypothesis 3 presents new knowledge concerning the traffic
reduction potential and the possible environmental effects of different e-grocery
home delivery models.
58
3.2 Overview of the separate papers
In this section the dissertation papers are identified, using their titles and publication
references. The identification is followed by a brief introduction to each of the
papers. Finally, an overview of the hypotheses and the interconnections between the
separate articles and the hypotheses is shown.
Paper I Auramo, J., Aminoff, A., Punakivi, M. (2002), "Research agenda for
e-business logistics -based on professional opinions", International
Journal of Physical Distribution and Logistics Management, Vol.32, Iss.7,
pp.513-531.
Paper II Punakivi, M. and Saranen, J. (2001), "Identifying the success factors
in e-grocery home delivery " International Journal of Retail and
Distribution Management, Vol. 29, Iss. 4, pp. 156-163.
Paper III Punakivi, M., Yrjölä, H. and Holmström, J. (2001), "Solving the Last
Mile Issue: Reception box or Delivery box" International Journal of
Physical Distribution and Logistics Management, Vol. 31, Iss. 6, pp. 427-439
Paper IV Siikavirta, H., Punakivi, M., Kärkkäinen, M. and Linnainen, L. (2003),
"Effects of e-commerce on greenhouse gas emissions case: home
delivery service", Journal of Industrial Ecology, Vol.6, No. 2, pp.83-97
Paper V Punakivi, M. and Tanskanen, K. (2002), "Increasing the cost
efficiency in e-fulfilment by using shared reception boxes",
International Journal of Retail and Distribution Management, Vol.30, Iss. 10,
pp.498-507.
Paper I defines the most important research and development questions related to
the logistics of electronic business. In this article the requirements of e-business on
the national logistics infrastructure were found to be one of the focus research areas.
According to the study, integrated supply network structure with suitable visibility
and usage of real-time data transfer is another area of great importance. According to
the results, the R&D of new logistics service concepts such as home delivery should
59
also be promoted, as well as there being a need for research on the effects and
possibilities of using new product data management and product identification
methods.
Paper II compares the cost levels of various home delivery models and the current
costs when customers do the shopping trip using a car. Additionally, the first results
of unattended reception compared to attended reception are obtained. Finally,
identifying the cost factors in home delivery operations gives guidelines for the
future development of e-grocery home delivery services.
Paper III extends the analysis started in Paper II, concentrating on studying the
models offering customer-specific unattended reception. In Paper III two
possibilities for unattended deliveries, the reception box concept and the delivery
box concept, are analysed. According to the study, the reception box concept results
in more effective home delivery transportation and the delivery box concept in a
smaller investment to achieve unattended reception. The cost savings in
transportation when comparing unattended and attended reception are analysed
using a vehicle routing tool. Then the payback periods of investments in facilities
enabling unattended reception are calculated on the basis of the operational cost
savings.
In Paper IV a literature review of the effects of e-commerce on various parts of the
demand-supply chain was carried out. The literature study revealed many possibilities
for e-commerce to reduce GHG emissions in the food production and consumption
system. Some possibly negative effects were also identified. The e-grocery home
delivery service was chosen as the subject of a case study because of its potential for
reducing road traffic and GHG emissions in the food production and consumption
system. In this case study the same results as in Paper II were analysed from the
viewpoint of environmental effects, that is mileage and greenhouse gas emissions
produced.
Paper V continues the work started in Papers II & III and complements the
knowledge of cost savings related to unattended reception. In this paper the shared
reception box concept is identified and compared to the models offering customer-
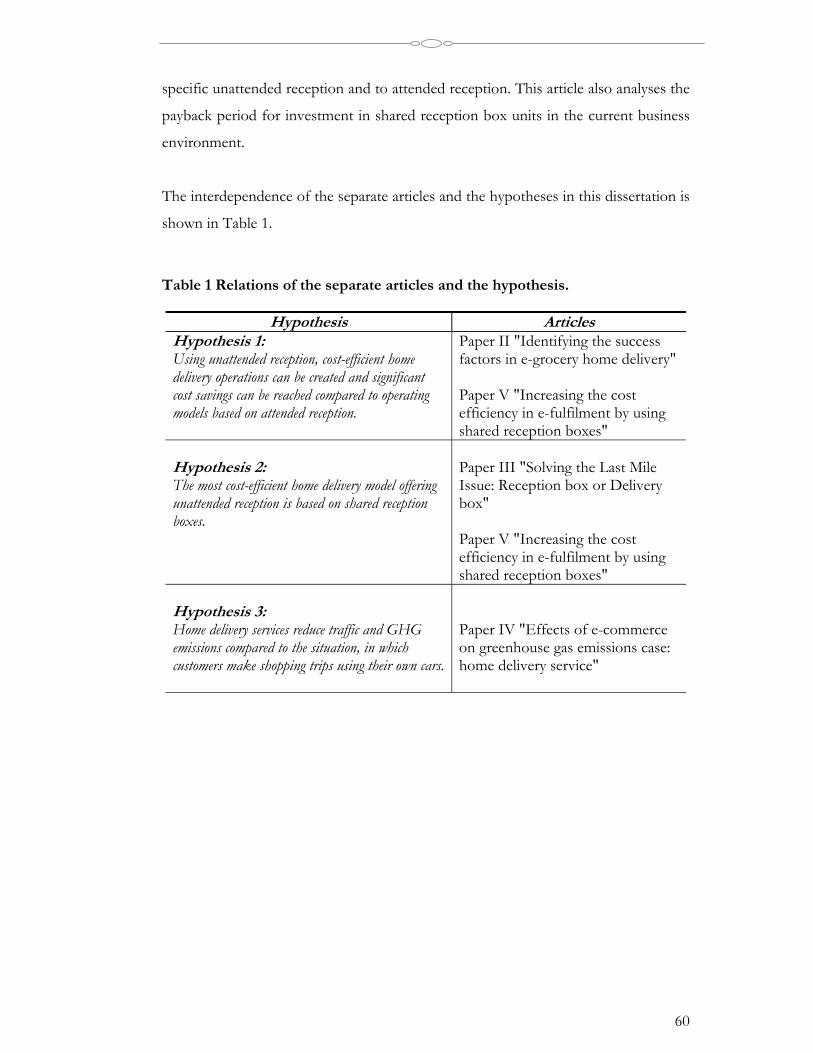
60
specific unattended reception and to attended reception. This article also analyses the
payback period for investment in shared reception box units in the current business
environment.
The interdependence of the separate articles and the hypotheses in this dissertation is
shown in Table 1.
Table 1 Relations of the separate articles and the hypothesis.
Hypothesis ArticlesHypothesis 1:Using unattended reception, cost-efficient homedelivery operations can be created and significantcost savings can be reached compared to operatingmodels based on attended reception.
Paper II "Identifying the successfactors in e-grocery home delivery"
Paper V "Increasing the costefficiency in e-fulfilment by usingshared reception boxes"
Hypothesis 2:The most cost-efficient home delivery model offeringunattended reception is based on shared receptionboxes.
Paper III "Solving the Last MileIssue: Reception box or Deliverybox"
Paper V "Increasing the costefficiency in e-fulfilment by usingshared reception boxes"
Hypothesis 3:Home delivery services reduce traffic and GHGemissions compared to the situation, in whichcustomers make shopping trips using their own cars.
Paper IV "Effects of e-commerceon greenhouse gas emissions case:home delivery service"
61
4 RESEARCH METHODOLOGY
In the following chapters the research methodology is presented. First, the research
approach is introduced and then the research process, data and the modelling tool
used are described.
4.1 Research approach
Research in industrial engineering and management is positioned within applied
sciences aiming at practical results applicable in industry (Olkkonen, 1994; Eloranta,
2000). According to Niiniluoto (1993), applied sciences, falling between basic science
and technology (engineering), produce new knowledge intended to be useful for the
specific purpose of increasing the effectiveness of some human activity. Hence, the
results can be evaluated both based on the new information and practical usefulness
of this knowledge. Additionally, Näsi (1980) argues that the results of applied
science, supporting decision making, can be evaluated based on applicability,
usability, practicability, and feasibility.
Depending on the research problem selected, the available information, the level of
available information, and the final results the research aims at, several research
approaches may be used. The research approach to be selected in this dissertation
should provide means to answer the practical research questions formulated in
chapter 1.2. Additionally, it should enable reaching the final objective of creating new
knowledge and practical recommendations for developing feasible, economically and
environmentally sustainable home delivery services.
At the time the research work was started in 1999, there were practically no historical
data nor established operations models in the e-grocery home delivery business. The
operations models were just created and introduced by the service providers
according to the expected customer demand. Thus, when selecting the research
approach and research methods, the operations were still in a development phase
and under constant change.
62
For example, it seemed impossible to reach a large enough sample size to arrive at
generally valid and reliable results by using a nomothetical research approach and
survey methods with detailed questionnaires. Because of the highly competitive
market conditions and growth expectations, the e-grocers' willingness to open up and
publish the cost structure of their core operations seemed unrealistic. Furthermore,
the differences in the e-grocer's service area characteristics and, for example, labour
cost levels were seen as factors hindering equal comparison of different home
delivery operations models offered by different service providers. For the same
reasons, an action oriented approach and case study method based on real-life
observations or measurements and interviews also seemed unrealistic. Additionally,
when the research was started, the major e-grocers typically rejected requests for
visits or interviews or e-mail questionnaires hindering the applicability of both the
survey and case study methods.
Moreover, one important issue discovered when first studying the available service
offerings was that not all the identified operational home delivery models were used
yet by the service providers. This eliminated completely the possibility of getting part
of the information required in answering the practical research questions formulated.
Answering the practical research questions, providing new knowledge and
recommendations was seen as normative goal-directed problem solving task. Thus,
the conceptual approach with theoretical and descriptive characteristics was not
selected. Based on the above reasoning, the constructive research approach was
selected in this dissertation.
Additionally, modelling appeared the most feasible research method, offering the
possibility of analysing all the home delivery models in equal experimental
conditions. Interviews and literature based case studies was selected to be used as
supporting research methods increasing the validity of the modelling work.
In the Figure 9 the constructive research approach is presented in a framework
(Kasanen et al., 1993) that classifies different research approaches according to their
main emphases on two axes, theoretical-empirical and descriptive-normative.
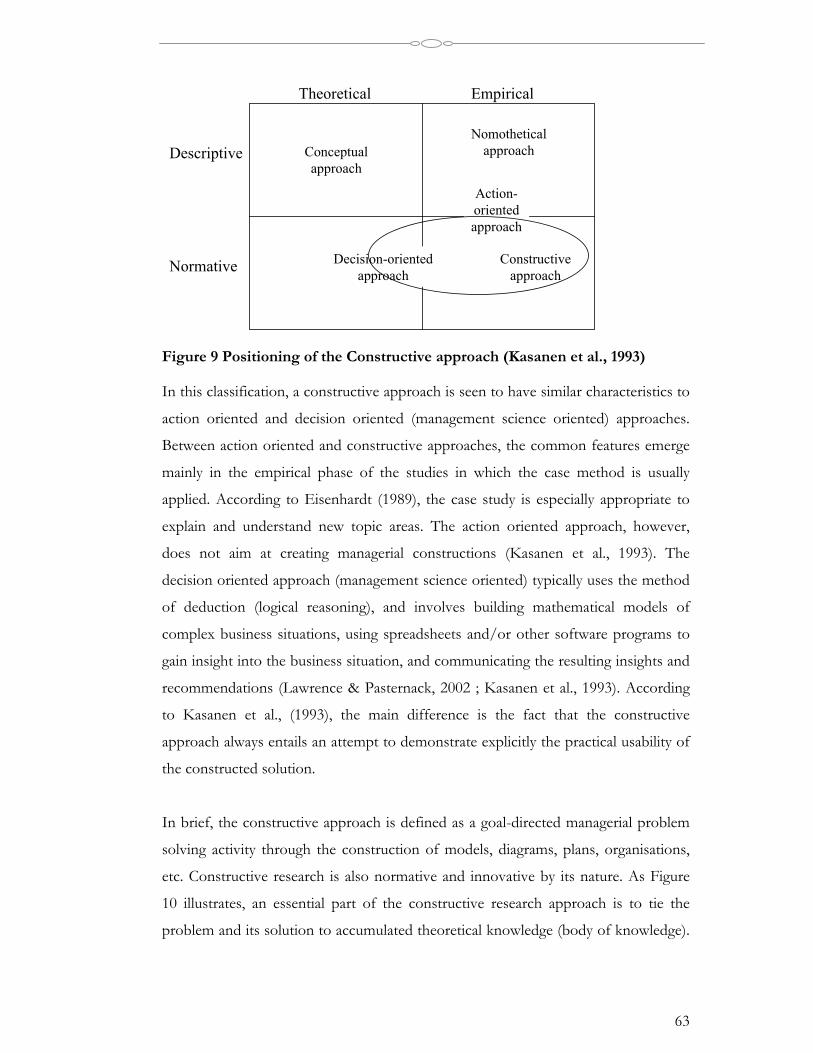
63
Descriptive
EmpiricalTheoretical
Normative
NomotheticalapproachConceptual
approach
Decision-orientedapproach
Action-orientedapproach
Constructiveapproach
Figure 9 Positioning of the Constructive approach (Kasanen et al., 1993)
In this classification, a constructive approach is seen to have similar characteristics to
action oriented and decision oriented (management science oriented) approaches.
Between action oriented and constructive approaches, the common features emerge
mainly in the empirical phase of the studies in which the case method is usually
applied. According to Eisenhardt (1989), the case study is especially appropriate to
explain and understand new topic areas. The action oriented approach, however,
does not aim at creating managerial constructions (Kasanen et al., 1993). The
decision oriented approach (management science oriented) typically uses the method
of deduction (logical reasoning), and involves building mathematical models of
complex business situations, using spreadsheets and/or other software programs to
gain insight into the business situation, and communicating the resulting insights and
recommendations (Lawrence & Pasternack, 2002 ; Kasanen et al., 1993). According
to Kasanen et al., (1993), the main difference is the fact that the constructive
approach always entails an attempt to demonstrate explicitly the practical usability of
the constructed solution.
In brief, the constructive approach is defined as a goal-directed managerial problem
solving activity through the construction of models, diagrams, plans, organisations,
etc. Constructive research is also normative and innovative by its nature. As Figure
10 illustrates, an essential part of the constructive research approach is to tie the
problem and its solution to accumulated theoretical knowledge (body of knowledge).

64
In addition, the constructive research approach requires that the practical usability of
the construction be demonstrated. (Kasanen et al., 1993)
Construction,problem solving
Practicalrelevance
Theoryconnection
Theoreticalcontribution
Practicalfunctioning
Figure 10 Elements of Constructive Research (Kasanen et al., 1993).
Additionally, Kasanen et al. (1993) have characterised the constructive approach by
dividing the research process into the following six phases.
1 Find a practically relevant problem which also has research potential
2 Obtain a general and comprehensive understanding of the topic
3 Innovate, that is, construct a solution idea
4 Demonstrate that the solution works
5 Show the theoretical connections and the research contribution of the
solution concept
6 Examine the scope of applicability of the solution.
These phases are also used in this dissertation and the research process is described
in the next chapter. Additionally, for examining and demonstrating the practical
usability of the construction, Kasanen et al. (1993) have suggested market tests of
three different levels. These market tests are presented in the following:
• Weak market test, which requires that the construction is in use somewhere,
• Semi-strong market test, which requires that the construction has become
widely adopted by companies, and
• Strong market test, which requires that the companies applying the
construction have systematically produced better financial results than those
not using it.
65
Kasanen et al. (1993) note that even the weak market test is relatively strict, and it is
probably not often that a tentative construction is able to pass it. Thus, it is usual that
several attempts must be made.
As described earlier in chapter 1.1 and in chapter 2.3.2, applications of different types
of the identified home delivery models have already been used by some e-grocers.
Thus, in this dissertation it is seen that the weak market test has already been taken
by companies offering e-grocery services in various geographical areas. To ease
passing semi-strong and strong market tests in the future, however, more
information seems to be needed. In order to provide new and objective information
as a result of this dissertation, the testing of various home delivery models was done
using modelling. In this way, the comparison could be made in equal conditions for
all the identified home delivery models. Additionally, the modelling results were
compared with relevant real-life information from a practical e-grocery pilot
operation. Thus, the pilot operation was used for validating the modelling settings
and the research results. A detailed description of the research process is provided in
the following chapter.
4.2 Research process and data
The research process in this dissertation follows the six steps of the constructive
approach described above. In the following, the research process and data used are
described.
Find a practically relevant problem with research potential
As described in the introduction of this dissertation, the home delivery service model
is a potential problem area in the supposedly rapidly growing e-grocery business. The
problems encountered by early e-grocers reveal that this problem area has significant
research potential and notable impact on developing the e-grocery business. It was
also obvious that this problem area belonged to the research area of logistics as it
covers developing various transportation service solutions for the consumer direct
channel.
66
Obtain a general and comprehensive understanding of the topic
Already in early research, developing home delivery operations in an e-grocery
business was found to be a more complex issue than initially appeared. Comparing,
for example, the distance driven by the customers if they transport their shopping
home by car to the distance driven by a fleet of home delivery vans delivering the
same shopping seems simple. However, the trade-off depends on many factors,
including the nature of the road network, the number and location of customers, van
capacity, the number of delivery vans required, the time period within which the
shopping must be delivered from when the order is placed, the delivery time
window, and the reception mode. Because of the complexity of the problem area and
lack of suitable data, in earlier research work, for example that of Cairns (1997), only
some of these constraints were taken into account.
Innovate, that is, construct a solution idea
Analysing the existing and emerging home delivery models required first
identification of possible solutions to the home delivery problem, which is seen as
the construction in this dissertation.
The possible home delivery operations models were identified from literature,
newspapers, interviews with e-grocers' management in magazine articles, and
especially by analysing the e-grocers' home delivery service offerings that existed at
that time. Additionally, when starting the research in 1999, we succeeded in
organising an interview with, and evaluation of, the established Matomera e-grocery
operation in Sweden (Johnsson, 1999). Interviews at Inex Partners Oy, which is one
of the two dominant purchasing and distribution organisations in the Finnish grocery
retailing market, was also organised to understand better the characteristics of
grocery distribution (Harju, 1999; Ojala, 1999). Additionally, interviews at Harwall
Oyj, the biggest brewery in Finland (Matikainen, 1999), and Valio Oy, the biggest
dairy products manufacturer in Finland (Hilden, 1999), were organised to understand
the direct distribution operations model. Furthermore, interviews of transportation
service providers' representatives were organised to reveal the characteristics of home
delivery operations in the Helsinki metropolitan area (Lehtonen, 1999; Holtari, 2000;
Henriksson, 2000; Danska, 2001). The home delivery models to be analysed in this
dissertation were then selected on the basis of the information collected.
67
Demonstrate that the solution works -analysis and testing
Demonstration of the identified service solutions in the e-grocery home delivery
business was to be made by means of analyses and comparisons based on modelling.
It was noticed that not all the possible home delivery models were yet in use.
Consequently, modelling appeared the most feasible research method because it
offers the possibility of analysing all the home delivery models in equal experimental
conditions. The main settings for the modelling work were created together with
Juha Saranen (Paper II) on the basis of the information collected.
However, most important from the modelling point of view was the availability of
real point-of-sales data from S-Group, covering detailed information about
customers’ grocery shopping. The exact receipt information from one week in
October 1999 was collected from five of S-Group’s supermarkets, including 81,139
receipts, henceforth referred to as orders. These data include, for example, items,
quantities, volumes (litres), supermarket, date and shopping time, and the prices of
shopping baskets. Customers’ street addresses were obtained from their loyalty cards.
However, the customers remained anonymous in order to keep their identities
confidential.
The data selected for the modelling work were limited in two ways. First, the order
size taken into account was limited to shopping baskets that exceeded 25 euro.
Smaller purchases were not considered feasible for home delivery service modelling.
The second limitation to the data was the customer's place of residence, which had to
be within the boundaries of the selected test area (135 km2) that was considered
reasonable for deliveries from one location. The test area covered part of the
Helsinki metropolitan area in Finland, and was defined using the postal codes of the
area. A list of these postal codes and a map of the area can be seen in Appendix III.
The number of inhabitants in the test area is approximately 202,000, and the number
of households is about 89,000 (Statistics Finland, 1998). Given these limitations, the
research data included 1,639 shopping baskets belonging to 1,450 anonymous
household customers, slightly more than 1.6 per cent of the households in the area.
From the modelling point of view, the most important elements in this point-of-sales
data were shopping time, customers' place of shopping, and customers' addresses.
68
Limitations to vehicle capacity utilisation were determined by the delivery time
windows, shopping basket volume, and the number of orders. Later in Paper V, after
the validation of the results, number of orders and delivery time windows were
selected as the limiting factors (see Appendix III).
Using this real shopping data and customers’ street address information, the e-
grocery home delivery models were modelled using the CAPS RoutePro vehicle
routing tool (see Chapter 4.3). Additionally, the situation in which the customers do
the shopping trip using their own cars, was modelled. Papers II, III, and IV were
then written based on these first modelling results, forming the basis for the practical
e-grocery pilot operation.
The e-grocery pilot operation, in which around 50 household customers used an
online grocery shopping service based on the reception box concept, was launched in
June 2000 by S-Group and Hollming Ltd in co-operation with the Ecomlog research
group. In this dissertation, the two-year pilot operation was used to verify the
research results achieved.
Show the theoretical connections and the research contribution of the solution
concept
The theoretical connections and the research contribution are demonstrated in both
the individual articles and this binding story. Of the individual articles, Papers II, III,
and IV were written based on the first modelling results, forming the basis for the e-
grocery pilot operation in the selected test area. Comparing the original analysis and
the verification results obtained during the practical pilot operation led to more
reliable settings in the model (described in Appendix III). Furthermore, a need for
more specific analysis and comparisons of various possible ways to offer home
delivery and unattended reception emerged. Paper V was then written based on these
complementary results.
Examine the scope of applicability of the solution.
The scope of applicability of the various home delivery models and the results
attained are discussed in both the individual articles (Papers II-V) and the Results and
Discussion chapters of this binding story.
69
4.3 Modelling tool used
The modelling work in this dissertation was performed using a commercial vehicle
routing tool, RoutePro (6.4.1) from CAPS Logistics Inc (CAPS, 2002). The
modelling work can thus be described as static and deterministic, that is, the
modelling is a representation of a particular time, and the components such as costs
and data are known with certainty (Lehtonen J-M, 1999). Additionally, spreadsheet
programs were used in data processing and analysing the cost structures of the home
delivery models.
With over 20 years of experience, CAPS is a leading provider in decision support
software. The products are used in a wide range of industries, such as Chemical,
Food and Beverage, 3PL Providers, and Transportation. CAPS RoutePro product
features include, for example, an unlimited number of depots, sites, orders, vehicles,
routes, and time windows in the routing. Vehicle types, order types, and site types
and their specific characteristics may be defined by the user. Additionally, RoutePro
uses digital road maps in the vehicle routing. This make possible taking into
consideration, for example, different road characteristics like speed limits and rush
hours for different road types. Finally, also the presentation of the results is
progressive. The routing results are visualised on the map and illustrated in graphics
showing, for example, under/over utilised routes.
It soon became obvious that the RoutePro vehicle routing tool was suitable for the
purposes of this research. Additionally, it was available to be used. When starting the
modelling work a two phased selection process was used for choosing the routing
algorithm. First the descriptions of the various algorithms available in CAPS
RoutePro software were studied using the users’ manual. Based on the manual two
algorithms, namely Tree-algorithm and Nearest neighbour-algorithm, were selected
as suitable candidates for this type of modelling work. In the second phase of the
selection process these two algorithms were tested in the selected geographical area.
The difference between the calculation results of Nearest neighbour-algorithm and
the Tree-algorithm were small, but the Tree-algorithm was slightly better in
optimising the routes in the selected area. Additionally, according to the advice of the

70
CAPS representative (Lindholm, 2000) and the operating instructions (CAPS, 1998),
the Tree-algorithm is more suitable for modelling home deliveries that originate
from, and are destined for, a single depot in a suburban and urban area.
The Tree-algorithm builds routes one at a time and tries to build a full truckload with
one vehicle before using another vehicle. The highest priority order will start a route.
The site that starts the route is called the seed location. The algorithm grows the
route by adding the unrouted candidate order whose summed distance to the seed
location and the depot is the smallest. The orders can be pure pickups, pure
deliveries, or a mixture of pickups and deliveries (CAPS, 1998). The Tree-algorithm
used was developed by CAPS Logistics but seems to bear similarities to the
successful Solomon (1987) insertion heuristic I1.
Other possible vehicle routing tools that could have been used in this dissertation
are, for example, RouteView Pro (Genimap, 2002; InfoTech, 2002). However, it was
noticed that reaching the objective of this dissertation did not require the use of
more than one vehicle routing tool. The focus was to analyse the differences among
the possible operations models in the e-grocery home delivery business. Even if the
absolute numerical outcomes of the tests had been slightly different using another
vehicle routing tool or another routing algorithm, the relative differences and
relations of the analysed home delivery models would have been the same.
4.4 Discussion of the research approach selected
Constructive research approach selected in this dissertation is seen to have
similarities with two probable more generally known research approaches or
frameworks in logistics research.
Firstly similarities are found with Forrester's (1961) experimental approach, used for
research into the management of industrial systems. Forrester (1961) describes the
experimental approach as one of building experimental models of companies or
industries to determine the influences of organisation and management policy.
Although his methods are quantitative and result in a mathematical representation of
the business system, the philosophy, objectives, and approaches are more like those
71
of the practising manager. In practice, this approach consists of first identifying a
problem area in the business and then setting up a computer model of the conditions
describing the problem area. Different management decisions, operations models,
and market assumptions can then be tested with the computer model to determine
their effects on the company’s success and increase the understanding of the business
system.
The second one is the logistics research framework presented by Mentzer & Kahn
(1995). According to this framework, good research in the field of logistics includes
an appropriate literature study and sufficient real-life observations to provide
evidence of the importance of the research, proceeds to theory development and
testing, and finally presents conclusions consistent with the theoretical basis as
regards reliability and validity. Additionally, good research provides an adequate
insight into the future research and managerial implications of the effort (Mentzer &
Kahn, 1995).
72
5 REVIEW OF THE RESULTS
In this section the results of this dissertation are presented. To a large extent the
results have already been published in the separate articles. Here, the findings of the
five separate articles are collected and summarised according to the hypothesis
outlined in Chapter 3. In the introduction the findings most relevant to the focus
area of this dissertation published in Paper I (Auramo et al., 2002) are briefly
covered. Then the cost levels of the various home delivery models, differences
between unattended and attended reception, and payback periods for the required
investments in unattended reception are examined. On this basis the most
economically and operationally efficient home delivery model is identified. This is
followed by an analysis of the possible effects of home delivery on traffic and the
environment. Validation of the research results is presented during the review as well
as in the Discussion in chapter 6.
5.1 Introduction
The development of e-business has already imposed increased quality requirements
on logistics services and on logistics infrastructure as a whole and will continue to do
so. It is seen as important to be able to fully utilise existing resources and to provide
various service levels according to customer requirements. On the basis of the results
in Paper I, the requirements e-business imposes on the national logistics
infrastructure were found to be one of the focus research areas. Additionally, an
integrated supply network structure with suitable visibility and usage of real-time data
transfer was another area of great importance. Research into, and the development
of, new logistics service concepts, as well as research into the effects and possibilities
of using new product data management and product identification methods, were to
be promoted as well.
According to the professional opinions reported in Paper I, it is presumed that
material flows will become narrower but more frequent in the B2B e-business
environment. This is due to increased information flow and the optimising of
inventory levels in the different parts of the logistical network. Material flows to
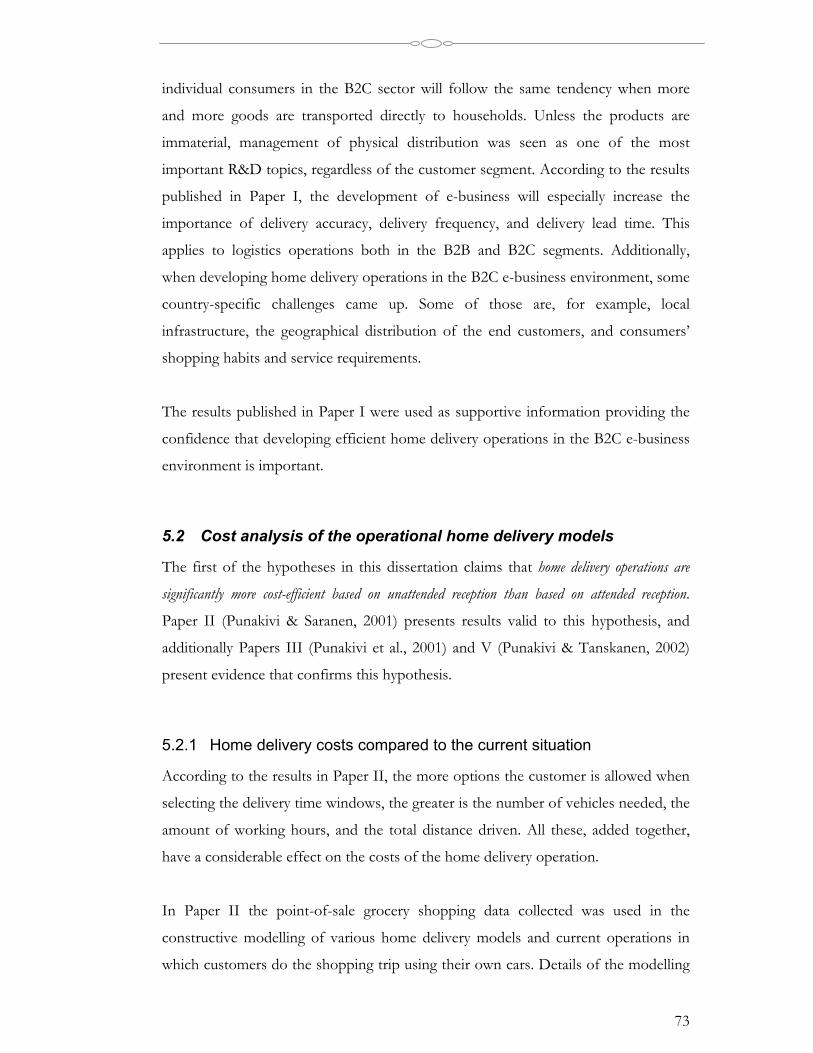
73
individual consumers in the B2C sector will follow the same tendency when more
and more goods are transported directly to households. Unless the products are
immaterial, management of physical distribution was seen as one of the most
important R&D topics, regardless of the customer segment. According to the results
published in Paper I, the development of e-business will especially increase the
importance of delivery accuracy, delivery frequency, and delivery lead time. This
applies to logistics operations both in the B2B and B2C segments. Additionally,
when developing home delivery operations in the B2C e-business environment, some
country-specific challenges came up. Some of those are, for example, local
infrastructure, the geographical distribution of the end customers, and consumers’
shopping habits and service requirements.
The results published in Paper I were used as supportive information providing the
confidence that developing efficient home delivery operations in the B2C e-business
environment is important.
5.2 Cost analysis of the operational home delivery models
The first of the hypotheses in this dissertation claims that home delivery operations are
significantly more cost-efficient based on unattended reception than based on attended reception.
Paper II (Punakivi & Saranen, 2001) presents results valid to this hypothesis, and
additionally Papers III (Punakivi et al., 2001) and V (Punakivi & Tanskanen, 2002)
present evidence that confirms this hypothesis.
5.2.1 Home delivery costs compared to the current situation
According to the results in Paper II, the more options the customer is allowed when
selecting the delivery time windows, the greater is the number of vehicles needed, the
amount of working hours, and the total distance driven. All these, added together,
have a considerable effect on the costs of the home delivery operation.
In Paper II the point-of-sale grocery shopping data collected was used in the
constructive modelling of various home delivery models and current operations in
which customers do the shopping trip using their own cars. Details of the modelling
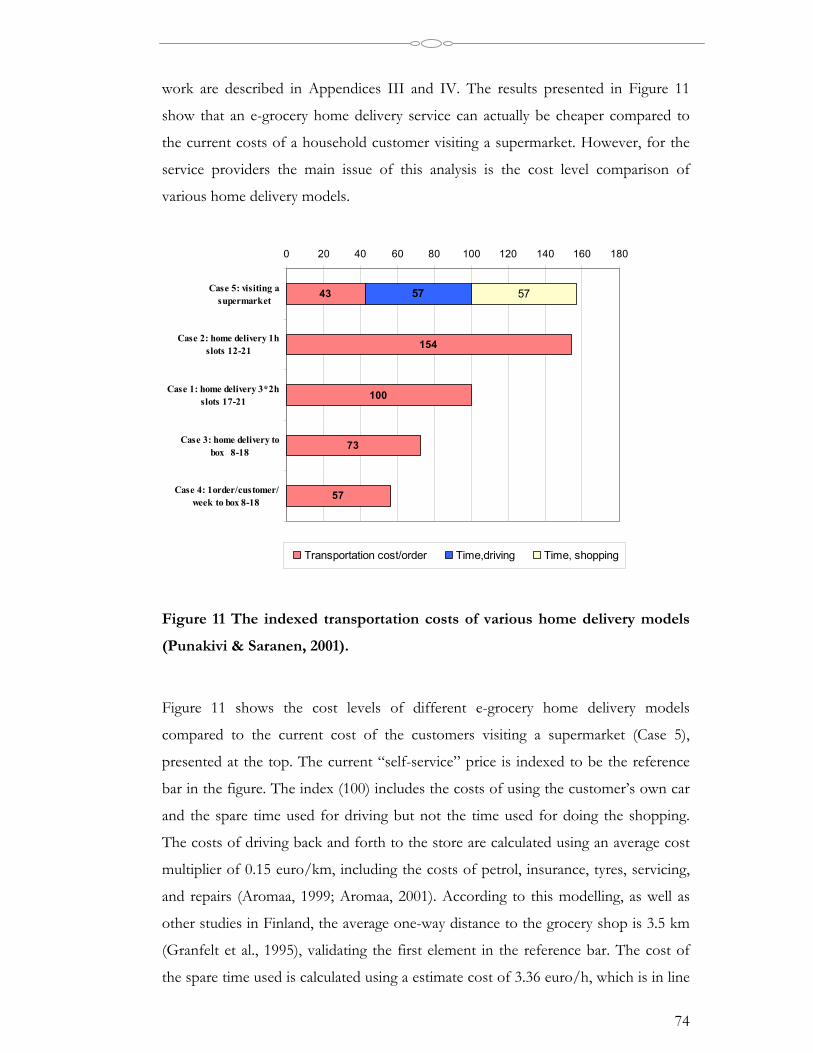
74
work are described in Appendices III and IV. The results presented in Figure 11
show that an e-grocery home delivery service can actually be cheaper compared to
the current costs of a household customer visiting a supermarket. However, for the
service providers the main issue of this analysis is the cost level comparison of
various home delivery models.
43
154
100
73
57
57 57
0 20 40 60 80 100 120 140 160 180
Case 5: visiting asupermarket
Case 2: home delivery 1hslots 12-21
Case 1: home delivery 3*2hslots 17-21
Case 3: home delivery tobox 8-18
Case 4: 1order/customer/week to box 8-18
Transportation cost/order Time,driving Time, shopping
Figure 11 The indexed transportation costs of various home delivery models
(Punakivi & Saranen, 2001).
Figure 11 shows the cost levels of different e-grocery home delivery models
compared to the current cost of the customers visiting a supermarket (Case 5),
presented at the top. The current “self-service” price is indexed to be the reference
bar in the figure. The index (100) includes the costs of using the customer’s own car
and the spare time used for driving but not the time used for doing the shopping.
The costs of driving back and forth to the store are calculated using an average cost
multiplier of 0.15 euro/km, including the costs of petrol, insurance, tyres, servicing,
and repairs (Aromaa, 1999; Aromaa, 2001). According to this modelling, as well as
other studies in Finland, the average one-way distance to the grocery shop is 3.5 km
(Granfelt et al., 1995), validating the first element in the reference bar. The cost of
the spare time used is calculated using a estimate cost of 3.36 euro/h, which is in line
75
with the value placed on leisure time by the Ministry of Transport and
Communications Finland when assessing investments in the road network. The
average driving and shopping time, 50 min/shopping trip, is here divided half-and-
half between shopping and driving (Raijas, 1994).
According to Paper II, when an e-grocery home delivery service provider offers a
one-hour delivery time window (Case 2) the delivery costs are 54 per cent higher
than in Index 100, covering the cost of driving the car and using spare time for
driving. The cost level obtained for Case 2 in the analysis has been confirmed as
being correct by a Finnish e-grocery shopkeeper (Kyyrö, 2000).
Limiting the delivery time window to three 2-hour delivery slots (Case 1) enables
better route optimisation and scheduling, leading to a significant (54 per cent) cost
reduction compared to Case 2. With this operating model, the cost is the same as in
“self-service” (Case 5). From the service provider’s point of view, this operating
model is cost-efficient, but significant cost reductions can still be found by using
unattended reception, eliminating the tight time window constraint.
Unattended reception (Cases 3-4) and wide (8 a.m.-6. p.m.) delivery time windows
enable efficient home delivery operations. Case 4 describes the best attainable
situation, where the orders are sorted by postal code and divided evenly among six
delivery days in a week. In Case 3 the orders are delivered on the original shopping
date. According to the analysis, the cost level of Case 3 will be 28 per cent below the
cost level of “self-service”. In Case 4 the cost level drops dramatically, by 43 per
cent, below the cost level of “self-service”. In real life, this kind of situation could be
reached only by an effective service area clustering and pricing policy.
The key factors in these results are the density of stops along the route and the
possibility of route and schedule optimisation. To demonstrate this, the average
distance driven per order and the number of deliveries per hour in each of the cases
are shown in Figure 12. Analysing Figure 12, it can be noticed that the cost efficiency
of a home delivery model is based on decreased average mileage per order and a
simultaneously increased number of stops per hour.

76
3,2
1,60,9 0,6
6,9
6
1
9
13
16
0,0
1,0
2,0
3,0
4,0
5,0
6,0
7,0
8,0
Case
5: v
isiti
ng a
supe
rmar
ket
Cas
e 2:
hom
ede
liver
y 1h
slo
ts12
-21
Case
1: h
ome
deliv
ery
3*2h
slot
s 17
-21
Cas
e 3:
hom
ede
liver
y to
box
8-
18
Cas
e 4:
1ord
er/c
usto
mer
/w
eek
to b
ox 8
-18
Kilo
met
ers
/ Ord
er
0
2
4
6
8
10
12
14
16
18
Del
iver
ies
/ Hou
r
Km/order
deliveries/h
Figure 12 Average distance driven per order and number of deliveries per hour
using different home delivery models (Punakivi & Saranen, 2001).
5.2.2 Costs of attended vs. unattended reception in home delivery
As covered in the previous chapter, the operational cost level of home delivery
models using unattended reception is notably lower compared to the models using
attended reception with tight time windows. During the analysis, the question of how
mixing attended and unattended stops would affect cost efficiency arose as a possible
way of reaching cost-efficient home delivery operations.
The further analysis in Paper II, focusing on mixed attended and unattended
receptions (Case 6), was performed using the point-of-sale data from one day,
including 462 orders. Attended receptions were described using “customer-chosen”
1-hour delivery time windows, which were chosen according to the real shopping
time between 8 a.m. and 6 p.m. Unattended receptions were described using an open
delivery time window between 8 a.m. and 6 p.m. During the analysis the amount of
attended receptions was gradually increased.
Figure 13 shows the number of vehicles needed to deliver the orders and the indexed
average time per stop for evaluating the cost effects.
77
100 109 118 132 149 163 257185 195 220 245
4
89 9
1011
15
1213 13
14
0
50
100
150
200
250
300
100%
unatt
ende
d
10% at
tende
d
20% at
tende
d
30% at
tende
d
40% at
tende
d
50% at
tende
d
60% at
tende
d
70% at
tende
d
80% at
tende
d
90% at
tende
d
100%
atten
ded
INDE
X
0
2
4
6
8
10
12
14
16
Num
ber o
f veh
icle
s
Time/stopVehicles
Figure 13 The average working time per stop and the number of vehicles
needed (Punakivi & Saranen, 2001).
Generally the results in Figure 13 demonstrate a significant growth in the variable
cost level when attended reception is used. The most important observation was that
the number of vehicles needed increases rapidly if attended and unattended deliveries
are mixed. Already 10% of attended deliveries along the route will double the
number of vehicles needed, when compared to totally unattended home deliveries.
After that increasing the number of attended stops, however, seems to affect more
smoothly.
According to these results, the average cost per attended stop (100% attended) is
2.57 times higher than in the case of an unattended stop (100% unattended),
meaning an additional cost of 157 per cent. For the service providers currently
offering one-hour delivery time windows, the possible cost savings would be as great
as 61 per cent. The reason for this is simply that with one-hour delivery time
windows the delivery vehicle needs to drive back and forth in the delivery area to
meet the promised delivery time windows.
5.2.3 Validating the cost analysis of the home delivery models
To validate the results obtained using the modelling settings presented in Appendices
III and IV, a further analysis was conducted in Paper V, in which three models
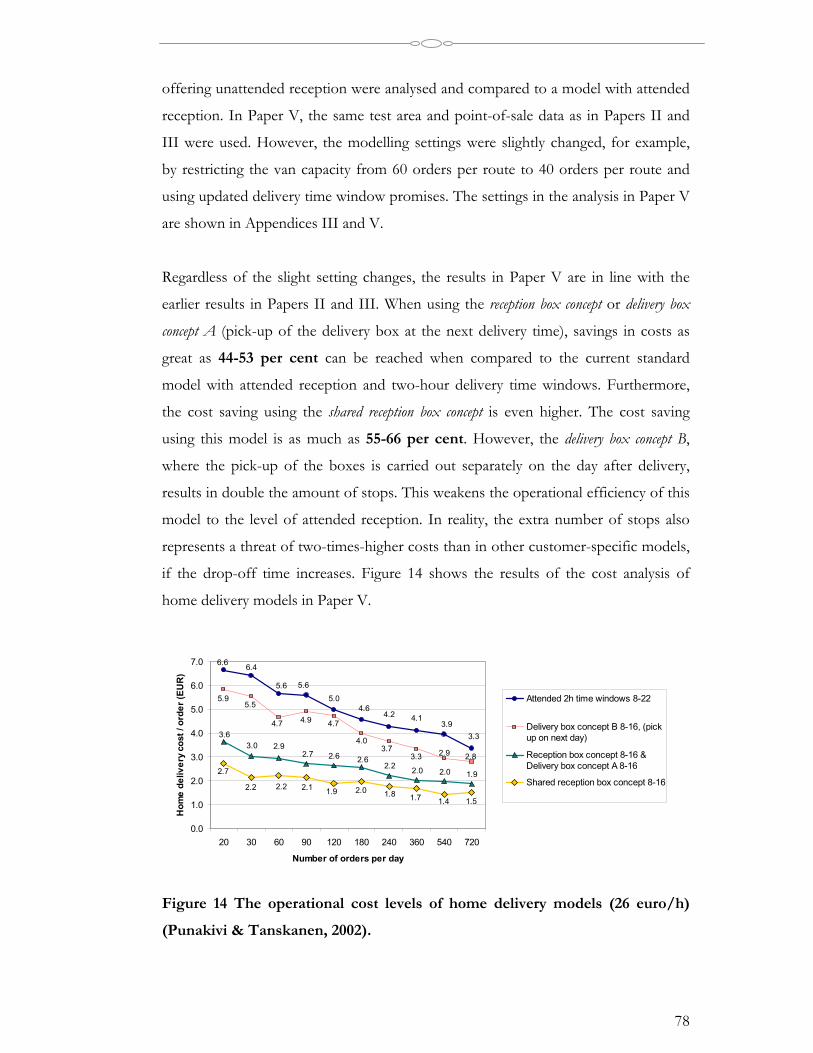
78
offering unattended reception were analysed and compared to a model with attended
reception. In Paper V, the same test area and point-of-sale data as in Papers II and
III were used. However, the modelling settings were slightly changed, for example,
by restricting the van capacity from 60 orders per route to 40 orders per route and
using updated delivery time window promises. The settings in the analysis in Paper V
are shown in Appendices III and V.
Regardless of the slight setting changes, the results in Paper V are in line with the
earlier results in Papers II and III. When using the reception box concept or delivery box
concept A (pick-up of the delivery box at the next delivery time), savings in costs as
great as 44-53 per cent can be reached when compared to the current standard
model with attended reception and two-hour delivery time windows. Furthermore,
the cost saving using the shared reception box concept is even higher. The cost saving
using this model is as much as 55-66 per cent. However, the delivery box concept B,
where the pick-up of the boxes is carried out separately on the day after delivery,
results in double the amount of stops. This weakens the operational efficiency of this
model to the level of attended reception. In reality, the extra number of stops also
represents a threat of two-times-higher costs than in other customer-specific models,
if the drop-off time increases. Figure 14 shows the results of the cost analysis of
home delivery models in Paper V.
6.46.6
5.6 5.6
5.04.6
4.2 4.13.9
3.3
2.82.93.33.7
4.0
4.74.94.7
5.55.9
1.92.02.02.22.6
3.63.0 2.9
2.7 2.6
1.51.41.71.82.01.92.12.22.2
2.7
0.0
1.0
2.0
3.0
4.0
5.0
6.0
7.0
20 30 60 90 120 180 240 360 540 720
Number of orders per day
Hom
e de
liver
y co
st /
orde
r (EU
R)
Attended 2h time windows 8-22
Delivery box concept B 8-16, (pickup on next day)
Reception box concept 8-16 &Delivery box concept A 8-16
Shared reception box concept 8-16
Figure 14 The operational cost levels of home delivery models (26 euro/h)
(Punakivi & Tanskanen, 2002).
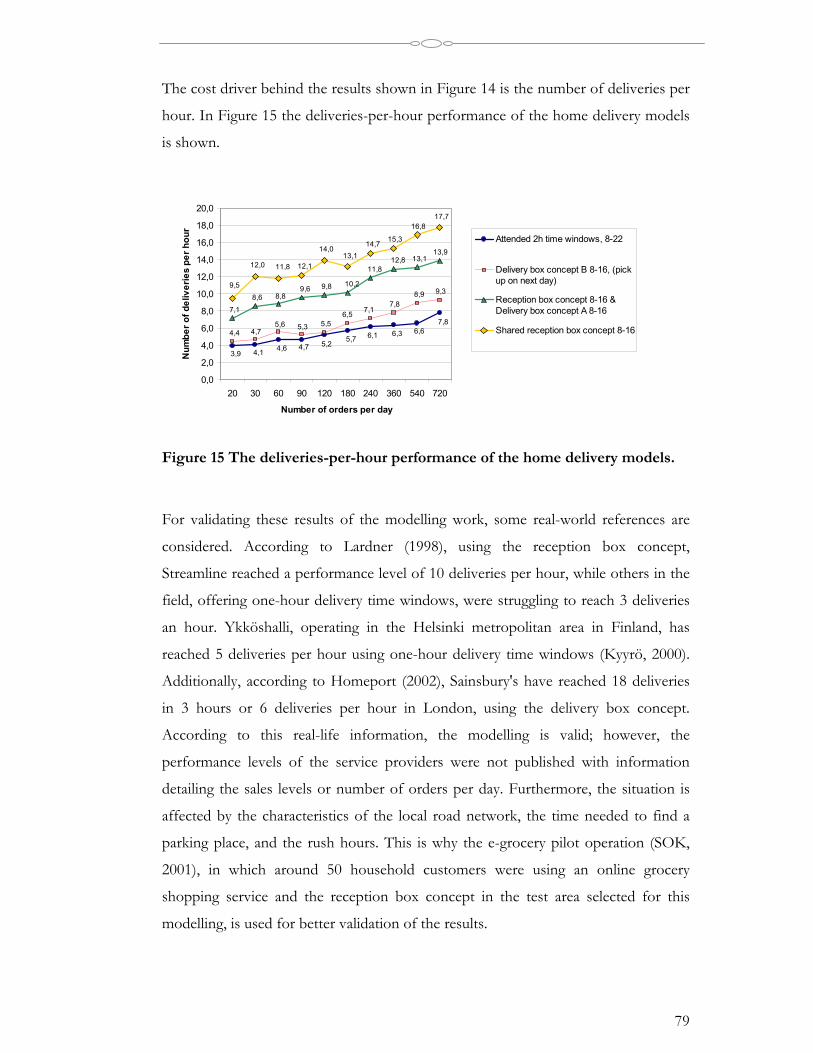
79
The cost driver behind the results shown in Figure 14 is the number of deliveries per
hour. In Figure 15 the deliveries-per-hour performance of the home delivery models
is shown.
7,86,66,36,15,7
5,24,74,64,13,9
9,38,97,8
7,16,55,55,35,6
4,74,4
13,913,112,8
11,8
10,29,89,68,88,6
7,1
17,716,8
15,314,713,1
14,0
12,111,812,0
9,5
0,0
2,0
4,0
6,0
8,0
10,0
12,0
14,0
16,0
18,0
20,0
20 30 60 90 120 180 240 360 540 720
Number of orders per day
Num
ber o
f del
iver
ies
per h
our
Attended 2h time windows, 8-22
Delivery box concept B 8-16, (pickup on next day)
Reception box concept 8-16 &Delivery box concept A 8-16
Shared reception box concept 8-16
Figure 15 The deliveries-per-hour performance of the home delivery models.
For validating these results of the modelling work, some real-world references are
considered. According to Lardner (1998), using the reception box concept,
Streamline reached a performance level of 10 deliveries per hour, while others in the
field, offering one-hour delivery time windows, were struggling to reach 3 deliveries
an hour. Ykköshalli, operating in the Helsinki metropolitan area in Finland, has
reached 5 deliveries per hour using one-hour delivery time windows (Kyyrö, 2000).
Additionally, according to Homeport (2002), Sainsbury's have reached 18 deliveries
in 3 hours or 6 deliveries per hour in London, using the delivery box concept.
According to this real-life information, the modelling is valid; however, the
performance levels of the service providers were not published with information
detailing the sales levels or number of orders per day. Furthermore, the situation is
affected by the characteristics of the local road network, the time needed to find a
parking place, and the rush hours. This is why the e-grocery pilot operation (SOK,
2001), in which around 50 household customers were using an online grocery
shopping service and the reception box concept in the test area selected for this
modelling, is used for better validation of the results.
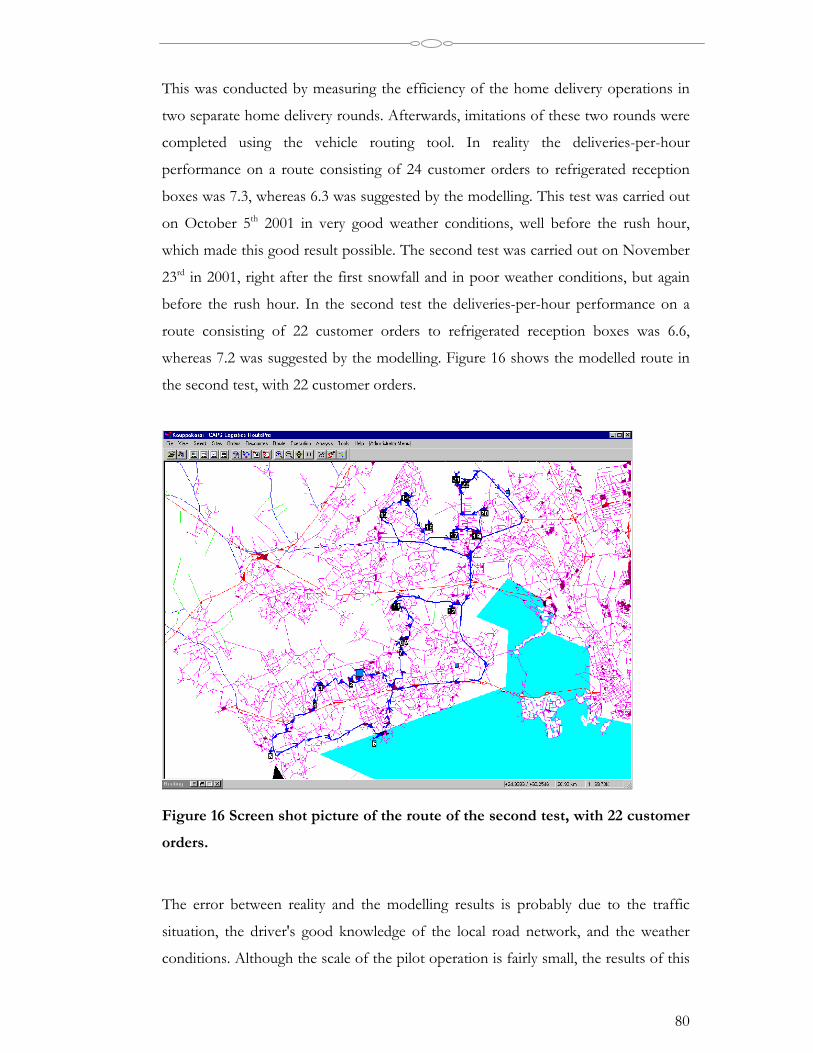
80
This was conducted by measuring the efficiency of the home delivery operations in
two separate home delivery rounds. Afterwards, imitations of these two rounds were
completed using the vehicle routing tool. In reality the deliveries-per-hour
performance on a route consisting of 24 customer orders to refrigerated reception
boxes was 7.3, whereas 6.3 was suggested by the modelling. This test was carried out
on October 5th 2001 in very good weather conditions, well before the rush hour,
which made this good result possible. The second test was carried out on November
23rd in 2001, right after the first snowfall and in poor weather conditions, but again
before the rush hour. In the second test the deliveries-per-hour performance on a
route consisting of 22 customer orders to refrigerated reception boxes was 6.6,
whereas 7.2 was suggested by the modelling. Figure 16 shows the modelled route in
the second test, with 22 customer orders.
Figure 16 Screen shot picture of the route of the second test, with 22 customer
orders.
The error between reality and the modelling results is probably due to the traffic
situation, the driver's good knowledge of the local road network, and the weather
conditions. Although the scale of the pilot operation is fairly small, the results of this
81
verification effort add the reliability and practical utility of the modelling work and
the results based on that.
To summarise, Hypothesis 1: Home delivery operations are significantly more cost-efficient
based on unattended reception than based on attended reception, is confirmed since potential
cost savings of 44-66 per cent can be considered significant. Furthermore, it is
important to notice that in these analyses, the drop-off time was the same (2
minutes) for all the home delivery models analysed. It is likely that in a real situation
attended reception includes some customer service and takes more time than
unattended reception. This would make the cost advantage of unattended reception
even greater than shown in these results. Additionally, in these analyses the home
delivery cost driver was considered to be the actual working time needed per delivery,
whereas in real life there would be an additional fixed price per vehicle needed. This
would further increase the cost-saving potential of models offering unattended
reception, enabling fewer vehicles to serve the customers. However, one of the major
obstacles seen in implementing a home delivery service based on unattended
reception is the investment involved in the reception facility. In the following chapter
the investments involved in the facilities for unattended reception are considered.
5.3 Economical feasibility of unattended reception concepts
The second hypothesis claims that The most cost-efficient home delivery model offering
unattended reception is based on shared reception boxes. In answering this question, the
investments involved in facilities for unattended reception must be taken into
consideration, in addition to the operational cost savings covered in Chapter 5.2.
Papers III (Punakivi et al., 2001) and V (Punakivi & Tanskanen, 2002) present results
relevant to this hypothesis.
5.3.1 Analysing the customer-specific solutions for unattended reception
It is convenient for customers to have groceries delivered to a reception box or a
secured movable delivery box near the door of their home. This allows customers to
be independent of delivery time windows. For home delivery service providers
unattended reception means the elimination of tight time windows and capacity
82
problems resulting from uneven demand during daily working hours. Both the
reception box and delivery box concepts shorten the delivery time at the door and
eliminate the "not at home problem" or the cost of redelivery (Jones, 2000).
Although both the reception box and delivery box concepts make possible the
benefit of unattended reception, there are several differences. The customer-specific
reception box requires a location in the customer’s garage or home yard and is
equipped with a refrigerator-freezer, providing total independence of delivery time
windows (SOK, 2001; Huhtakangas, 2000; The Times, 2000; Croft, 2000). Secured
delivery boxes, however, are insulated and should ensure that frozen/chilled food
remains frozen/chilled for 12 hours (Homeport, 2002). An open question is whether
the delivery boxes function in the northern winter, that is, do the groceries freeze if a
delivery box is left outside in minus 15°C (5°F)? However, the issue of finding the
space required for customer-specific reception boxes in, for example, apartment
buildings can be avoided using the delivery box concept. Normally, there is little
space around buildings, especially in city centres. Reception boxes could be installed
in cellars, but delivery boxes, such as Homeports (Homeport, 2002), could even be
left on the pavement, securely attached to a locking device bolted into the building
wall.
In Paper III the focus was on assessing the payback period of investments in
facilities enabling unattended reception. This was carried out by examining what level
of investment the cost savings in transportation justify from the home delivery
service provider's point of view. The price of a reception box was assumed to be
comparable to a normal refrigerator-freezer, i.e. 400-1000 euros. For a retailer the
price of a secured delivery box system is between 80 and 170 euros, including £7 to
£60 for a delivery box depending on the size, £9 for the cable, and £30 for the
locking device (Homeport, 2002). Thus, the investment in the delivery box concept
can be expected to be significantly lower than in the case of reception boxes, where
the electronics, the refrigerator, and the freezer increase the costs.
To be well-grounded, the investments in unattended reception need to be recovered
either by the savings achieved in home delivery operations or by service fees. The
payback period analysis in Paper III was conducted on the basis of the cost
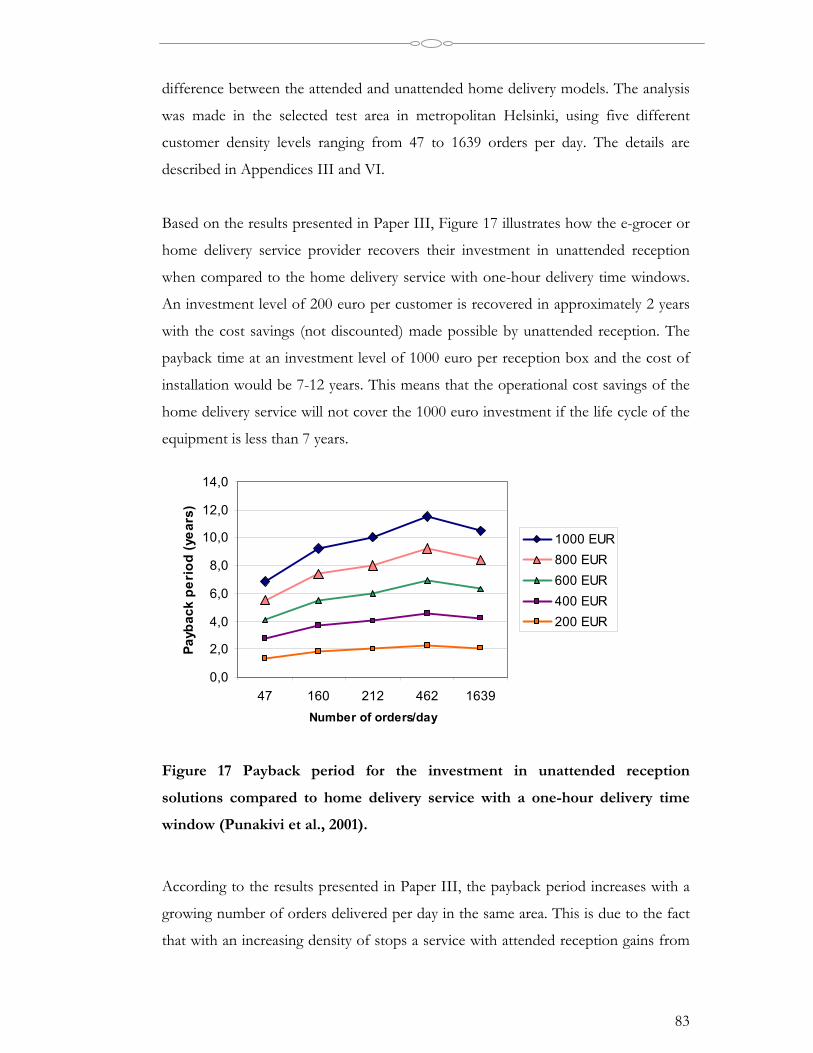
83
difference between the attended and unattended home delivery models. The analysis
was made in the selected test area in metropolitan Helsinki, using five different
customer density levels ranging from 47 to 1639 orders per day. The details are
described in Appendices III and VI.
Based on the results presented in Paper III, Figure 17 illustrates how the e-grocer or
home delivery service provider recovers their investment in unattended reception
when compared to the home delivery service with one-hour delivery time windows.
An investment level of 200 euro per customer is recovered in approximately 2 years
with the cost savings (not discounted) made possible by unattended reception. The
payback time at an investment level of 1000 euro per reception box and the cost of
installation would be 7-12 years. This means that the operational cost savings of the
home delivery service will not cover the 1000 euro investment if the life cycle of the
equipment is less than 7 years.
0,0
2,0
4,0
6,0
8,0
10,0
12,0
14,0
47 160 212 462 1639Number of orders/day
Payb
ack
peri
od (y
ears
)
1000 EUR800 EUR600 EUR400 EUR200 EUR
Figure 17 Payback period for the investment in unattended reception
solutions compared to home delivery service with a one-hour delivery time
window (Punakivi et al., 2001).
According to the results presented in Paper III, the payback period increases with a
growing number of orders delivered per day in the same area. This is due to the fact
that with an increasing density of stops a service with attended reception gains from
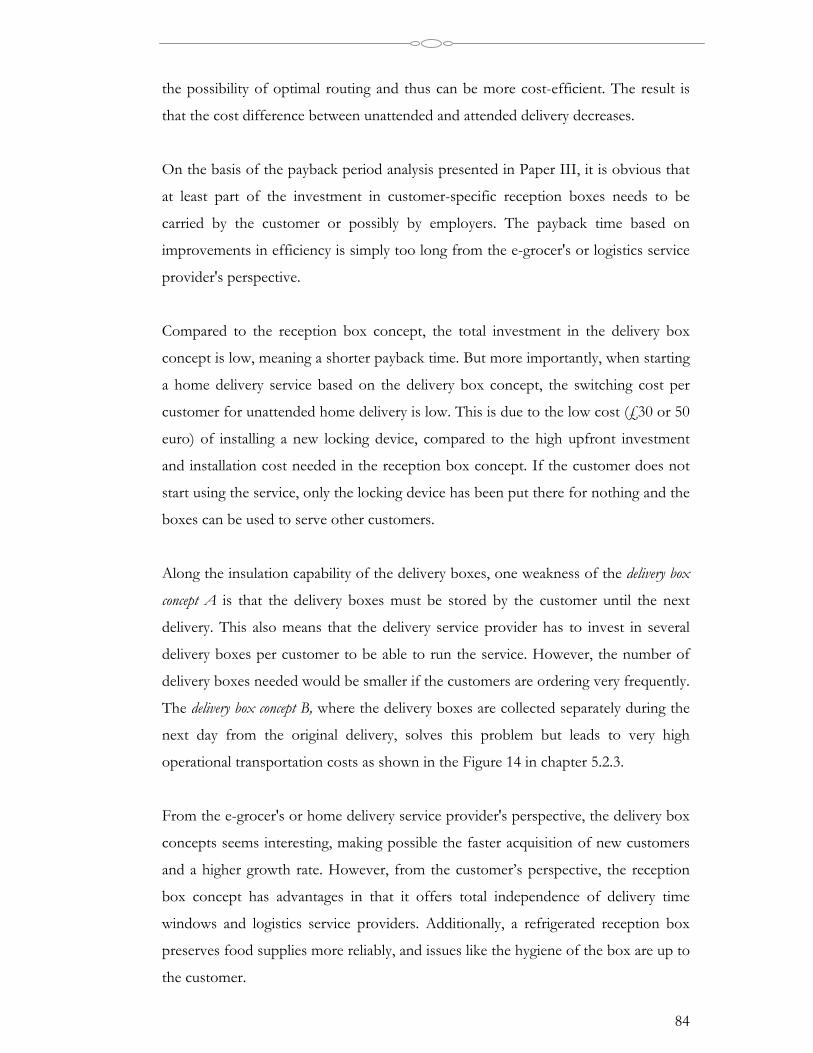
84
the possibility of optimal routing and thus can be more cost-efficient. The result is
that the cost difference between unattended and attended delivery decreases.
On the basis of the payback period analysis presented in Paper III, it is obvious that
at least part of the investment in customer-specific reception boxes needs to be
carried by the customer or possibly by employers. The payback time based on
improvements in efficiency is simply too long from the e-grocer's or logistics service
provider's perspective.
Compared to the reception box concept, the total investment in the delivery box
concept is low, meaning a shorter payback time. But more importantly, when starting
a home delivery service based on the delivery box concept, the switching cost per
customer for unattended home delivery is low. This is due to the low cost (£30 or 50
euro) of installing a new locking device, compared to the high upfront investment
and installation cost needed in the reception box concept. If the customer does not
start using the service, only the locking device has been put there for nothing and the
boxes can be used to serve other customers.
Along the insulation capability of the delivery boxes, one weakness of the delivery box
concept A is that the delivery boxes must be stored by the customer until the next
delivery. This also means that the delivery service provider has to invest in several
delivery boxes per customer to be able to run the service. However, the number of
delivery boxes needed would be smaller if the customers are ordering very frequently.
The delivery box concept B, where the delivery boxes are collected separately during the
next day from the original delivery, solves this problem but leads to very high
operational transportation costs as shown in the Figure 14 in chapter 5.2.3.
From the e-grocer's or home delivery service provider's perspective, the delivery box
concepts seems interesting, making possible the faster acquisition of new customers
and a higher growth rate. However, from the customer’s perspective, the reception
box concept has advantages in that it offers total independence of delivery time
windows and logistics service providers. Additionally, a refrigerated reception box
preserves food supplies more reliably, and issues like the hygiene of the box are up to
the customer.
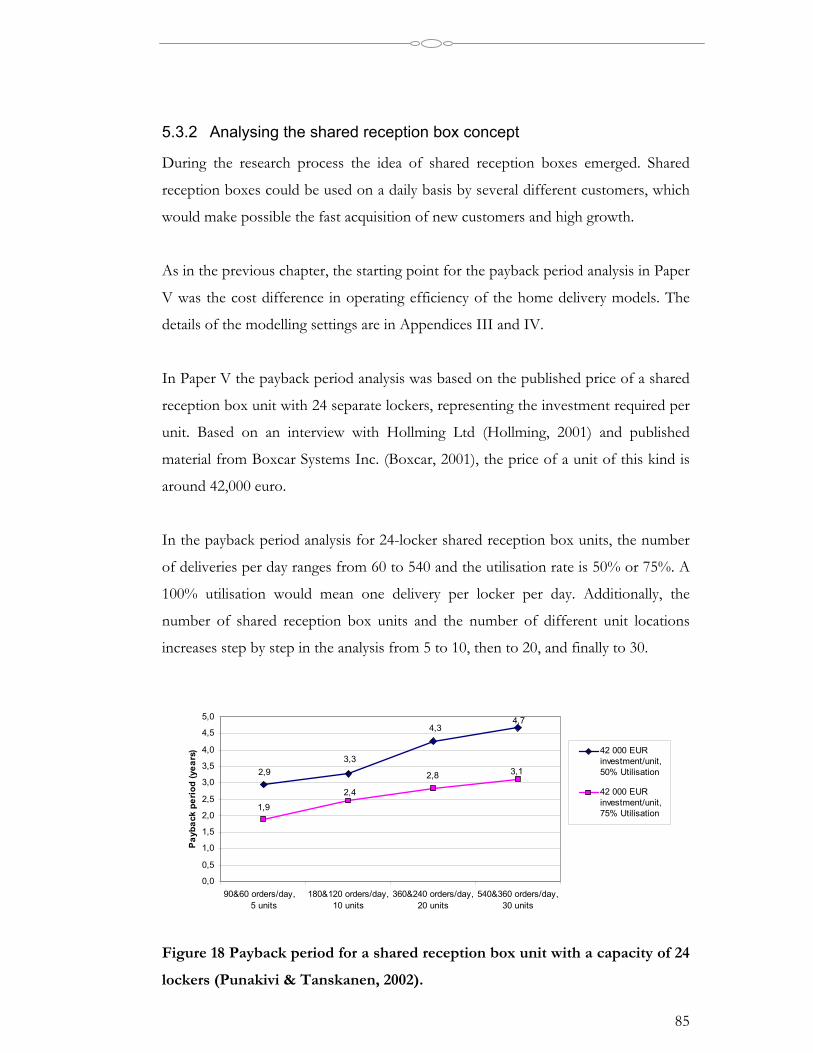
85
5.3.2 Analysing the shared reception box concept
During the research process the idea of shared reception boxes emerged. Shared
reception boxes could be used on a daily basis by several different customers, which
would make possible the fast acquisition of new customers and high growth.
As in the previous chapter, the starting point for the payback period analysis in Paper
V was the cost difference in operating efficiency of the home delivery models. The
details of the modelling settings are in Appendices III and IV.
In Paper V the payback period analysis was based on the published price of a shared
reception box unit with 24 separate lockers, representing the investment required per
unit. Based on an interview with Hollming Ltd (Hollming, 2001) and published
material from Boxcar Systems Inc. (Boxcar, 2001), the price of a unit of this kind is
around 42,000 euro.
In the payback period analysis for 24-locker shared reception box units, the number
of deliveries per day ranges from 60 to 540 and the utilisation rate is 50% or 75%. A
100% utilisation would mean one delivery per locker per day. Additionally, the
number of shared reception box units and the number of different unit locations
increases step by step in the analysis from 5 to 10, then to 20, and finally to 30.
2,93,3
4,34,7
3,12,8
2,4
1,9
0,0
0,5
1,0
1,5
2,0
2,5
3,0
3,5
4,0
4,5
5,0
90&60 orders/day, 5 units
180&120 orders/day,10 units
360&240 orders/day,20 units
540&360 orders/day,30 units
Payb
ack
perio
d (y
ears
) 42 000 EURinvestment/unit,50% Utilisation
42 000 EURinvestment/unit,75% Utilisation
Figure 18 Payback period for a shared reception box unit with a capacity of 24
lockers (Punakivi & Tanskanen, 2002).
86
Figure 18 illustrates how the e-grocer or home delivery service provider recovers
their investment in shared reception box units when compared to the standard home
delivery service with 2-hour delivery time windows. With a 75% utilisation rate the
payback time would be 2 to 3 years and with a utilisation level of 50% between 3 and
5 years (not discounted). This result encourages investing in shared reception box
units rather than, for example, in specially designed vehicles, as in the GIB example
(Ring & Tigert, 2001) described earlier.
For comparison to the results presented in Paper III, a payback period analysis for
customer-specific reception boxes was made, based on the results in Paper V, using a
price of 1,000 euro per unit. According to this confirmation analysis, the payback
period for reception boxes is between 6 and 13 years, when the number of daily
deliveries ranges from 20 to 720. According to this, the results presented in Paper III
are in line with the results in Paper V.
As in Figure 17 and also in Figure 18, the payback period increases when there are
more orders to be delivered per day. This is due to the reduced cost difference
between the model with 2-hour delivery time windows and unattended reception.
The reason for the reduced cost difference is based on the effects of economies of
scale. With a higher number of orders, the density of the stops is also higher. With a
higher stop density, home delivery operations are more cost-effective, regardless of
the operating model.
To summarise, Hypothesis 2: The most cost-efficient home delivery model offering unattended
reception is based on shared reception boxes, is confirmed. Additionally, in Paper V the
analysis of the shared reception box concept was made using 50% and 75% unit
utilisation rates. When a shared reception box is placed in a busy railway or
underground station, as many as 2 or 3 orders per day per locker (a 200-300%
utilisation rate) could be possible. Furthermore, as noted in answering Hypothesis 1,
in this analysis the drop-off time for attended reception and unattended reception
was 2 minutes, to enable proper comparison. In reality, the drop-off time using
attended reception may be higher, whereas using the shared reception box concept it
may turn out to be even shorter as a result of the scale benefits. However, the risk in
87
the shared reception box concept is in unknown customer acceptance. At the
moment it is unknown if consumers are willing to use a "halfway" home delivery
model, which still requires collection of the goods and last mile transportation if the
shared reception box unit is not installed in the apartment house cellar or on the
office car park.
5.4 Effects of home delivery services on traffic and the environment
The third hypothesis in this dissertation claims that Home delivery services reduce traffic
and GHG emissions compared to the situation, in which customers make shopping trips using their
own cars. Paper IV (Siikavirta et al., 2003) presents results relevant to this hypothesis.
In Paper IV the same original results were used as in Paper II. However, in Paper IV
the focus was placed on analysing the possible environmental effects of the home
delivery models, whereas in Paper II only the cost levels were analysed. Thus the
modelling settings were the same as in Paper II, presented in Appendices III and IV.
According to the results presented in Paper IV and Punakivi & Holmström (2001),
all the home delivery service models are more environment-friendly than the
situation, in which customers visit the store using their own cars. Figure 19 presents
the average distance driven per order using various home delivery models and the
situation in which household customers visit the store, driving back and forth with
their own cars.
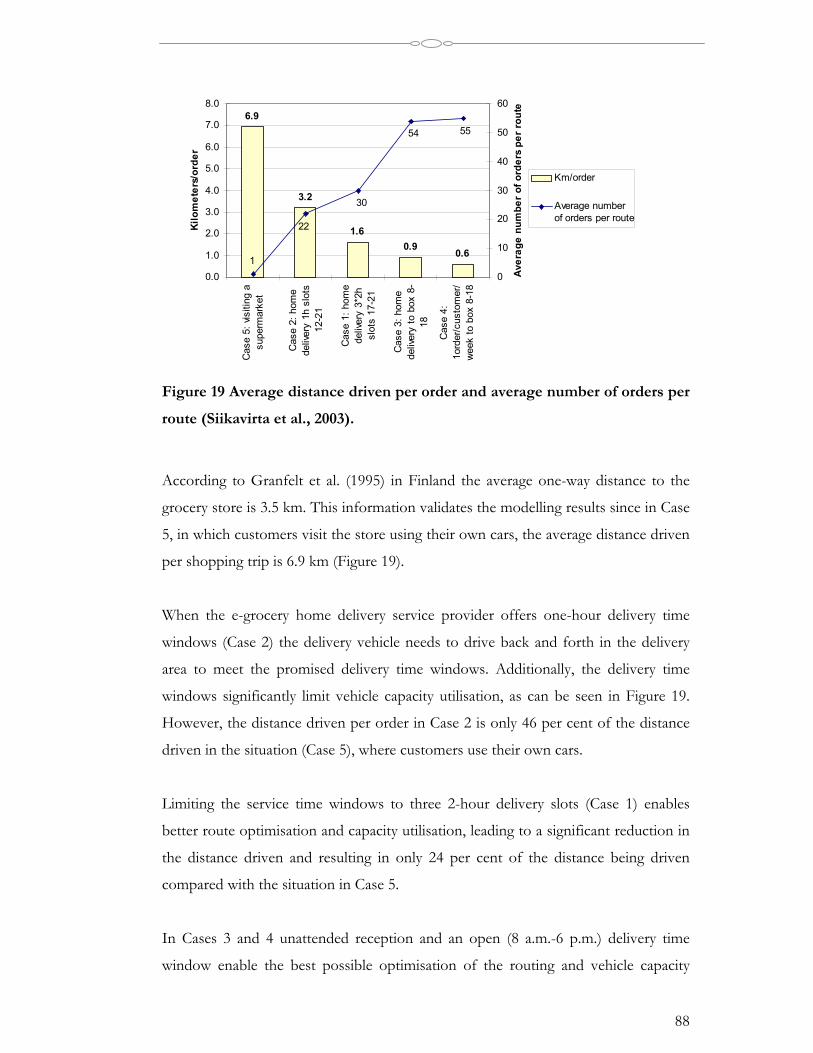
88
6.9
3.2
1.60.9 0.6
1
5554
30
22
0.0
1.0
2.0
3.0
4.0
5.0
6.0
7.0
8.0
Cas
e 5:
vis
iting
asu
perm
arke
t
Cas
e 2:
hom
ede
liver
y 1h
slo
ts12
-21
Cas
e 1:
hom
ede
liver
y 3*
2hsl
ots
17-2
1
Cas
e 3:
hom
ede
liver
y to
box
8-
18
Cas
e 4:
1ord
er/c
usto
mer
/w
eek
to b
ox 8
-18
Kilo
met
ers/
orde
r
0
10
20
30
40
50
60
Aver
age
num
ber o
f ord
ers
per
rout
e
Km/order
Average numberof orders per route
Figure 19 Average distance driven per order and average number of orders per
route (Siikavirta et al., 2003).
According to Granfelt et al. (1995) in Finland the average one-way distance to the
grocery store is 3.5 km. This information validates the modelling results since in Case
5, in which customers visit the store using their own cars, the average distance driven
per shopping trip is 6.9 km (Figure 19).
When the e-grocery home delivery service provider offers one-hour delivery time
windows (Case 2) the delivery vehicle needs to drive back and forth in the delivery
area to meet the promised delivery time windows. Additionally, the delivery time
windows significantly limit vehicle capacity utilisation, as can be seen in Figure 19.
However, the distance driven per order in Case 2 is only 46 per cent of the distance
driven in the situation (Case 5), where customers use their own cars.
Limiting the service time windows to three 2-hour delivery slots (Case 1) enables
better route optimisation and capacity utilisation, leading to a significant reduction in
the distance driven and resulting in only 24 per cent of the distance being driven
compared with the situation in Case 5.
In Cases 3 and 4 unattended reception and an open (8 a.m.-6 p.m.) delivery time
window enable the best possible optimisation of the routing and vehicle capacity
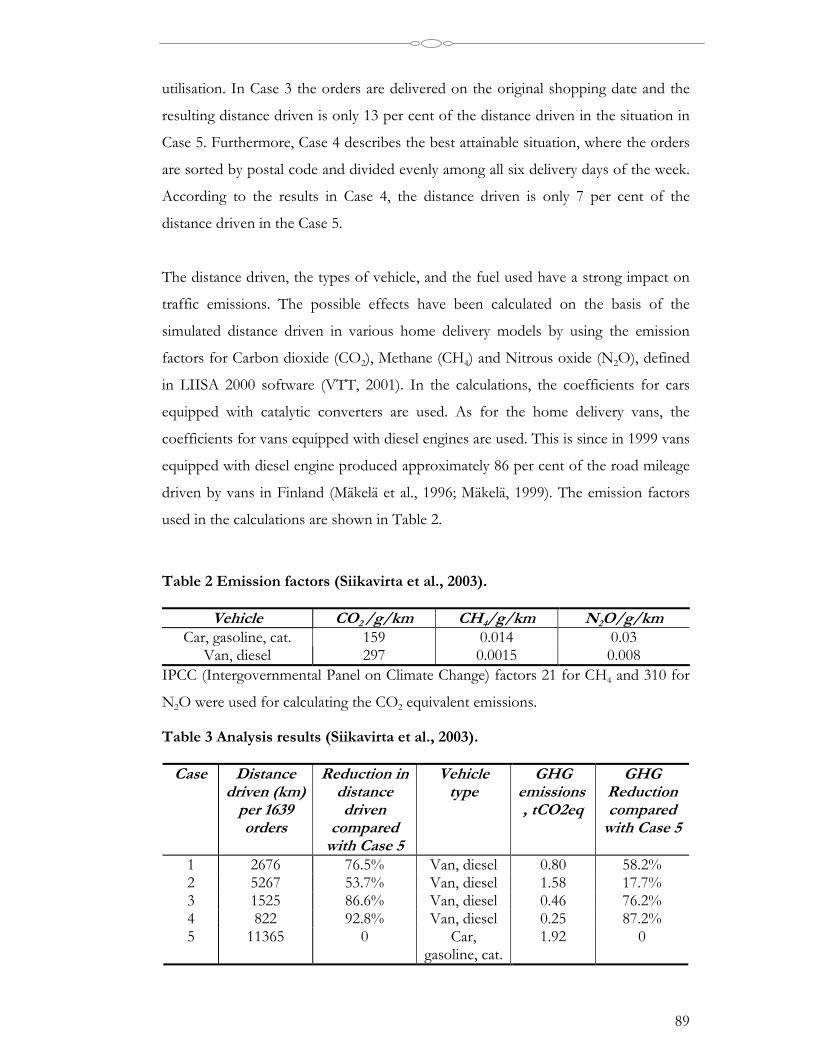
89
utilisation. In Case 3 the orders are delivered on the original shopping date and the
resulting distance driven is only 13 per cent of the distance driven in the situation in
Case 5. Furthermore, Case 4 describes the best attainable situation, where the orders
are sorted by postal code and divided evenly among all six delivery days of the week.
According to the results in Case 4, the distance driven is only 7 per cent of the
distance driven in the Case 5.
The distance driven, the types of vehicle, and the fuel used have a strong impact on
traffic emissions. The possible effects have been calculated on the basis of the
simulated distance driven in various home delivery models by using the emission
factors for Carbon dioxide (CO2), Methane (CH4) and Nitrous oxide (N2O), defined
in LIISA 2000 software (VTT, 2001). In the calculations, the coefficients for cars
equipped with catalytic converters are used. As for the home delivery vans, the
coefficients for vans equipped with diesel engines are used. This is since in 1999 vans
equipped with diesel engine produced approximately 86 per cent of the road mileage
driven by vans in Finland (Mäkelä et al., 1996; Mäkelä, 1999). The emission factors
used in the calculations are shown in Table 2.
Table 2 Emission factors (Siikavirta et al., 2003).
Vehicle CO2 /g/km CH4/g/km N2O/g/kmCar, gasoline, cat. 159 0.014 0.03
Van, diesel 297 0.0015 0.008IPCC (Intergovernmental Panel on Climate Change) factors 21 for CH4 and 310 for
N2O were used for calculating the CO2 equivalent emissions.
Table 3 Analysis results (Siikavirta et al., 2003).
Case Distancedriven (km)
per 1639orders
Reduction indistancedriven
comparedwith Case 5
Vehicletype
GHGemissions, tCO2eq
GHGReductioncompared
with Case 5
1 2676 76.5% Van, diesel 0.80 58.2%2 5267 53.7% Van, diesel 1.58 17.7%3 1525 86.6% Van, diesel 0.46 76.2%4 822 92.8% Van, diesel 0.25 87.2%5 11365 0 Car,
gasoline, cat.1.92 0

90
The results presented in Table 3 show that a home delivery service creates a
significant potential for traffic reduction when compared to the situation, in which
customers visit the shop using their own cars. In the best possible case this reduction
in the distance driven could be as much as 93 per cent (Case 4). However, depending
on the home delivery model used the reduction would be somewhere between 54
and 93 per cent.
The results in Figure 19 and in Table 3 do not, however, cover the home delivery
models based on using shared reception boxes or delivery boxes. Thus the traffic
reduction potential associated in these service models was analysed during finalising
this binding story. This additional analysis was conducted based on the original
modelling results published in the Paper V. The additional results are presented in
the Table 4.
Table 4 Reduction potentials in distance driven.
Home delivery model Reduction potential indistance driven
Attended reception, 2h delivery time windows,delivery between 8-22
60 %
Delivery box concept B, delivery between 8-16,pick up of the delivery box on next day
80 %
Delivery box concept A, delivery between 8-16,pick up of the delivery box on next delivery
86 %
Reception box concept, delivery between 8-16 86 %
Shared reception box concept, delivery between 8-16 88 %
Compared to the results presented in in Figure 19 and in Table 3, only the results
based on the shared reception box concept and delivery box concept B are new. The
potential reduction in distance driven based on home delivery and attended reception
is in line with the earlier results. This is also the case with the reduction potential
based on the home delivery to reception boxes. Furthermore, delivery box concept A
is comparable to reception box concept when the distance driven is considered.
However, it was surprising according to this additional analysis that delivery box
concept B also includes a reduction potential of 80 per cent, although two separate
stops per order are conducted. In addition, the shared reception box concept seems

91
particularly environment-friendly and includes a traffic reduction potential of 88 per
cent.
However, the reduction potential included in the shared reception box concept is
valid only if the shared reception box unit is located at customers’ office or home car
park, eliminating the shopping trip but increasing the delivery vehicle traffic. If the
shared reception box units were located, for example, at the grocery shop car parks,
there would be no shopping traffic reduction potential at all. In this case, the result
would be an increased amount of traffic and a greater total distance driven as a result
of the delivery vehicle trips. This, however, depends on the location of the store or
distribution centre where the picking operations are performed.
In brief, these results indicating a traffic reduction potential of between 54 and 93
per cent are in line with earlier research. For example, Cairns (1997 and 1998) found
a mileage reduction potential of 77 per cent. However, the results in this dissertation
reveal the wide variations in the potential for reducing the distance driven by using
different home delivery models, which have not been reported in earlier studies.
Moreover, in Paper IV and in Punakivi & Holmström (2001), the reduction potential
of traffic emissions was similarly analysed based on the potential reduction in traffic.
In Paper IV, the analysis was concentrated on the effects on GHG emissions.
According to the results shown in Table 3, the potential reduction in GHG
emissions could be between 18 and 87 per cent compared to the situation (Case 5) in
which cars are used.
Generalising these results is complicated since in reality, the results are highly
dependent on local road networks, rush hours, and the vehicles used. However,
putting the presented results into a more general form, we used our earlier estimate,
that 12 per cent of the overall traffic is the maximum traffic reduction potential in
Finland. Based on this assumption, with a 100 per cent e-grocery market share, the
maximum attainable overall road traffic reduction potential in Finland would be
between 6.5 and 11 per cent, depending on the home delivery model used. When
using the current estimate for the market share of e-grocery, 10 per cent by 2005-
2010, the attainable reduction potential would be between 0.65 and 1.1 per cent of
overall road traffic in Finland.

92
The potential reduction of GHG emissions was similarly generalised. In Finland, the
GHG emissions from road traffic were 11 million tons (Mt) in 1998, of which cars
accounted for 6.3 Mt (KTM, 2001). In Paper IV, it was estimated that the current
GHG emissions from grocery shopping travel are 1.1 Mt CO2, which accounts for
1.4 percent of Finland's GHG emissions. Depending on the selected e-grocery home
delivery model, a GHG emission reduction of 0.19-0.95 Mt CO2 could be achieved
in theory, which would reduce GHG emissions in Finland by approximately 0.3-1.3
per cent. However, again using the current estimate for the market share of e-
grocery, 10 per cent by 2005-2010, the attainable reduction potential would be
between 0.03-0.13 per cent.
Although these figures seem relatively small, the potential must be estimated
alongside the expected traffic growth rates. For example, the Finnish Road
Administration has estimated that the overall increase in traffic in Finland will be 38
per cent between 1997 and 2030. The growth rate is thus around one per cent a year.
During the same period, the estimated overall increase in traffic in the Helsinki
metropolitan area will be 50 per cent (FINRA, 2002). By supporting the development
of e-grocery and home delivery services, the increase of traffic levels could at least
slow down. Similarly, the potential of the e-grocery home delivery service to reduce
the GHG emissions in Finland is small. In countries where the share of GHG
emissions from the transportation sector are higher, the traffic reduction potential
and GHG emission reduction potential of the e-grocery home delivery service can
also be higher. The reduction potential of both traffic and GHG emissions depends
on the size of the metropolitan area served, population density, and number of
suitable market areas for e-grocery services in the country, that is, the market share of
e-grocery services.
To summarise Hypothesis 3: Home delivery services reduce traffic and GHG emissions
compared to the situation, in which customers make shopping trips using their own cars, can be
answered positively. Based on the results, the traffic reduction potential is highly
dependent on the selected home delivery model, varying between 54 and 93 per cent.
The GHG emission reduction potential is directly dependent on the mileage
reduction and varies from 18 to 87 per cent depending on the home delivery model.
93
Finally, according to this analysis, the potential over all road traffic reduction and
reduction of GHG emissions from road traffic depends on both the home delivery
model selected and, especially, the market share of home shopping in the future.
Additionally, on the basis of earlier research (Cairns, 1999; Tacken, 1990), it may be
assumed that customers using e-grocery and home delivery services would not use
the increased amount of spare time they would have in such a way that would
notably increase the need for using their cars. According to Cairns (1999), 61 per
cent of the food home delivery customers of "The Food Ferry" are owners of at least
one car, and 74 per cent of the car-owners used their cars less as a result of shopping
with the Food Ferry e-grocery.
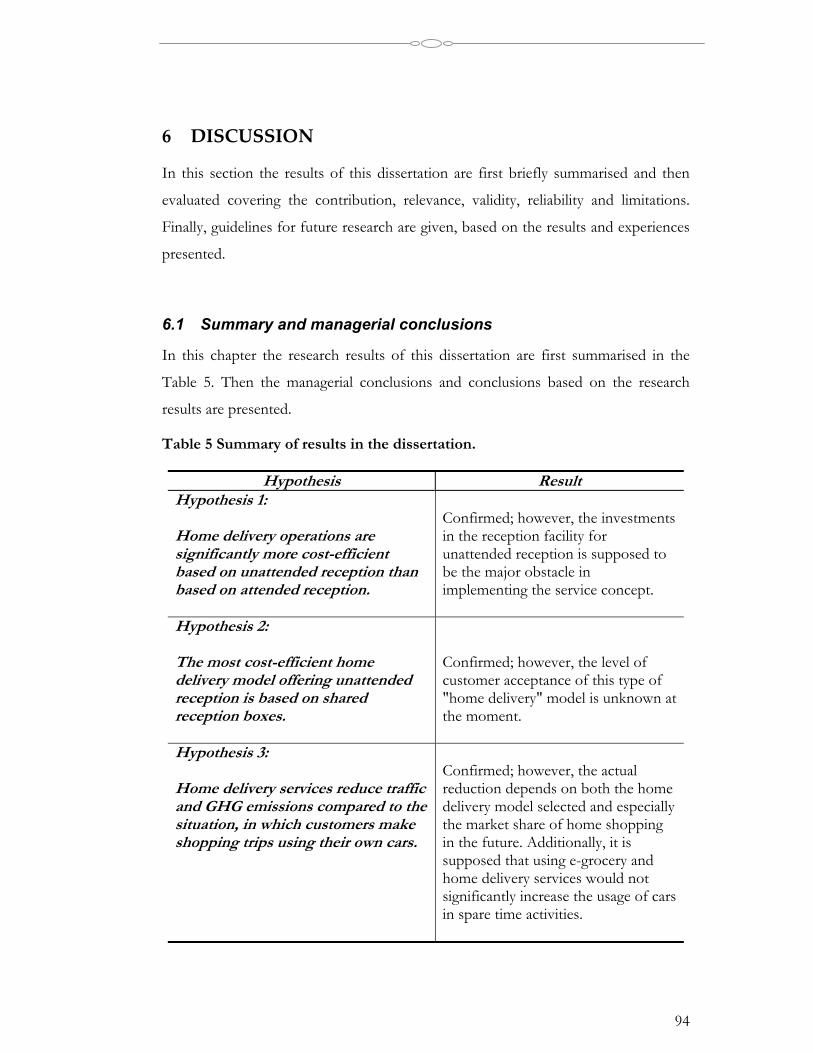
94
6 DISCUSSION
In this section the results of this dissertation are first briefly summarised and then
evaluated covering the contribution, relevance, validity, reliability and limitations.
Finally, guidelines for future research are given, based on the results and experiences
presented.
6.1 Summary and managerial conclusions
In this chapter the research results of this dissertation are first summarised in the
Table 5. Then the managerial conclusions and conclusions based on the research
results are presented.
Table 5 Summary of results in the dissertation.
Hypothesis ResultHypothesis 1:
Home delivery operations aresignificantly more cost-efficientbased on unattended reception thanbased on attended reception.
Confirmed; however, the investmentsin the reception facility forunattended reception is supposed tobe the major obstacle inimplementing the service concept.
Hypothesis 2:
The most cost-efficient homedelivery model offering unattendedreception is based on sharedreception boxes.
Confirmed; however, the level ofcustomer acceptance of this type of"home delivery" model is unknown atthe moment.
Hypothesis 3:
Home delivery services reduce trafficand GHG emissions compared to thesituation, in which customers makeshopping trips using their own cars.
Confirmed; however, the actualreduction depends on both the homedelivery model selected and especiallythe market share of home shoppingin the future. Additionally, it issupposed that using e-grocery andhome delivery services would notsignificantly increase the usage of carsin spare time activities.
95
For developing the e-grocery and associated home delivery service offerings, some
managerial conclusions and guidelines can be drawn based on this research work.
According to the results presented in this dissertation, the most operationally cost-
efficient e-grocery home delivery service is based on unattended reception.
Unattended reception, which enables optimal vehicle routing and scheduling, would
also be the best solution when considering the potential traffic reduction and
environmental aspects.
Because of the somewhat high investment level required in customer-specific
unattended reception facilities, it is estimated that these models will remain as niche
services, at least in the short term. The niche customer group may consist of well-off
families with children, living in a suburban area in one-family houses or row houses.
Additionally, catering kitchens, bars, and kiosks may be suitable customer groups as
well. Similarly, office deliveries may represent a potential market segment where
companies could be willing to invest in customer-specific unattended reception.
However, using shared reception boxes, home shopping and unattended delivery
services can be offered to a significantly wider customer base. Shared reception
boxes may be placed, for example, in central bus and underground stations, petrol
stations, supermarket and office car parks, apartment house cellars, or wherever the
retailer believes it to be convenient for consumers. Because of shared usage, the
utilisation level of the facility is higher than in the case of customer-specific
unattended reception. The shared reception box concept allows interested customers
to experiment easily with the service, and makes it easier for customers to adopt
home shopping generally. For delivery companies, it is also a potential solution since
the shared reception box units may easily be connected to the Internet, and a full
audit trail of the delivery event can be provided. Additionally, according to the results
in this dissertation, investment in shared reception box facilities can be justified by
the cost savings in home delivery operations, and the payback period for the
investment is reasonably low. However, customers must be involved in investments
in customer-specific unattended reception facilities, since the cost savings in home
delivery transportation do not justify the investments within a reasonable timeframe.
As a managerial summary based on the numerical results of this dissertation, a "pre-
selection tool" is presented in Figure 20.
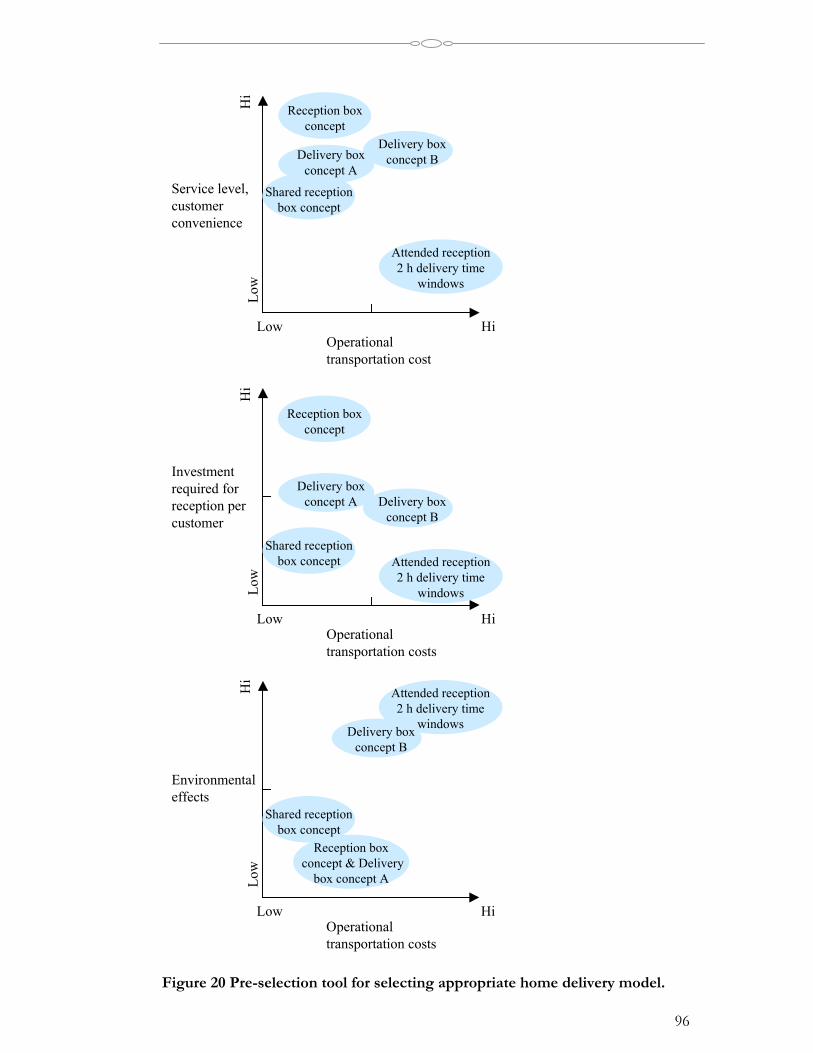
96
Operationaltransportation cost
Service level,customerconvenience
Hi
Hi
Low
Low
Shared receptionbox concept
Attended reception2 h delivery time
windows
Delivery boxconcept B
Reception boxconcept
Delivery boxconcept A
Operationaltransportation costs
Investmentrequired forreception percustomer
Hi
Hi
Low
Low
Attended reception2 h delivery time
windows
Delivery boxconcept B
Delivery boxconcept A
Reception boxconcept
Shared receptionbox concept
Operationaltransportation costs
Environmentaleffects
Hi
Hi
Low
Low
Attended reception2 h delivery time
windowsDelivery boxconcept B
Reception box concept & Delivery
box concept A
Shared receptionbox concept
Figure 20 Pre-selection tool for selecting appropriate home delivery model.
97
This pre-selection tool can be used as a guideline for decision-makers responsible for
developing or investing in the development of home delivery operations. In the pre-
selection tool, customer service level, investments required, and environmental
effects of the analysed home delivery models are presented regarding their
operational cost levels. Presented in this way, the numerical results of this
dissertation are in a more abstract form, which makes it possible for the reader
quickly to identify the greatest differences among the home delivery models analysed.
However, it must be kept in mind that generalising the results in this simplistic way is
extremely complicated since in reality the success in home delivery operations is
highly dependent on the characteristics of the service area selected and resources
available. For example, local road networks, rush hour characteristics, customer
density, customer ordering frequency, number of depots, the number and type of
vehicles used, and the cost of resources used are some of the key elements.
Because of the service area analysed in this dissertation, the pre-selection tool
suggested is seen as the most suitable for developing home delivery services for
suburban and urban areas. As in the urban and suburban areas, the shared reception
boxes are also seen as a potential solution in city centres. This view is supported by
the results of the pilot operations by Consignia, who tested five different versions of
unattended reception facility (Rowlands, 2002). For the rural areas, either the already
used shop-in-the-bus concept with a fixed timetable or shared reception boxes
extending services in the village store, post office, or petrol station are seen as the
solutions with the greatest potential in the future.
Moreover, it should be kept in mind that developing the operational capabilities and
operations models is not enough. To grow, develop, and eventually become
profitable, the e-grocery business needs higher customer demand. It seems that the
best way to start developing the services and acquiring customers is to focus on
selected consumer groups in densely populated areas. In addition, the management
of Peapod currently supports this view. According to Marc Van Gelder, President
and CEO of Peapod, "the whole business is about customer density" (Van Gelder,
2002b).
98
One way to achieve sufficient customer density level is through the co-operation of
various online retailers, both e-grocers and other service providers. A potential
solution would be to create shared home delivery services to be used by all the local
retailers willing to offer home shopping services. Especially in the smaller markets,
this would enable the critical customer mass to be reached more quickly. This would
similarly ease the costs of providing various home delivery models based on both
attended and unattended reception. Similarly, from the environmental point of view,
shared home delivery services would be the best solution. Eventually, local customer
requirements and the accepted price level would determine service development.
The pace of development will depend, however, on the general willingness to change
current shopping habits. One of the central requirements for the success and growth
of the e-grocery business, and home shopping generally, is that customers realise the
costs associated with visiting supermarkets using their own car. These include petrol
and maintenance costs and parking fees, as well as the financial value of their leisure
time. Evaluating current costs helps the customer to accept the fee charged for order
picking and home delivery services.
Additionally, the role of the government or communities in the development of
home delivery services remains to be seen. By accelerating development of e-grocery
and home delivery services, however, there is a possibility to offer better services to
citizens, reduce car dependence in everyday life, reduce traffic congestion, and
potentially reduce the environmental effects of traffic.
6.2 Contribution and relevance of the research
This dissertation presents a part of the pioneering work focused on developing e-
grocery supply chain operations conducted in the Ecomlog research programme. The
focus area selected in this dissertation was the development of home delivery
operations in the e-grocery business. As the real-life examples presented in the
introduction and literature review show, this topic is currently one of the two most
important single problem areas in the e-grocery business. The other problem area,
efficient order picking operations, is not covered in this dissertation but has been
99
analysed by other researchers (Yrjölä, 2003; Kämäräinen, 2002; Yrjölä, 2001; Jaakola,
1999) in the Ecomlog research group.
The research work done during the Ecomlog programme has created new knowledge
supporting the development of home delivery services. The results have been
published in several academic journals. In this dissertation, the elements of this new
knowledge are the cost differences between attended and unattended reception types
of home delivery, the effects of tight delivery time windows in home delivery
operations, analysing the home delivery models from the environmental point of
view, comparisons with the situation in which customers do the shopping trip using
cars, and payback periods for the investments required in facilities for unattended
reception.
In this dissertation, the research results published in the five individual articles are
combined and summarised using both detailed research questions and hypotheses.
Additionally, in the dissertation the research work is more closely tied to the existing
body of knowledge.
The research results showing that home delivery based on unattended goods
reception is superior to a service with attended reception are in line with the basic
body of knowledge covering the vehicle routing problem (Ballou, 1999; Solomon,
1987; Desrochers et al., 1992; Desrosiers et al., 1995; Fisher, 1995). These results are
also in line with the research work by Laseter et al. (2000), who demonstrated that
even in the larger US cities, the density of population will not allow for a low cost
provision of home delivery services if the customer decides the timing (short delivery
time window) of the service.
Furthermore, these results increase the current body of knowledge by presenting
practically and comparably existing and emerging business solutions to the home
delivery problem. In particular, the analysis comparing attended reception and
various unattended reception models in home delivery has increased the body of
knowledge. Additionally, this new knowledge is already being used by other
researchers. For example, the thesis of Yrjölä (2003) builds partly on the research
results published in some of the articles used as the basis for this dissertation.

100
Furthermore, Heiskanen et al. (2001), for example, have used some of these results in
their report for the Ministry of the Environment.
Additionally, the results of this dissertation support the findings of Cairns (1997 and
1999), who reported positive environmental effects related to home delivery services.
Compared to Cairns' work, this research analyses both mileage reduction potential
and the effects on GHG emissions. This research also takes delivery time windows
into account, and reveals this way the differences among various operations models,
using real point-of-sales information in the modelling. In this focus area, the results
increase the body of knowledge by presenting the environmental effects in the
current situation and when using different home delivery models.
The relevance of this study is confirmed by the high priority given to the domain of
business problems. The results are also seen to have potential value for practitioners
(Eloranta, 2000). The relevance of this research work is in providing practical
knowledge, for example, in the form of the cost levels associated with different
operational home delivery models as well as in the form of new knowledge of the
environmental effects associated with these service models. The payback period
analysis based on the transportation cost savings and the investments required for
unattended reception facilities is also considered relevant. This new knowledge has
relevance for four different groups:
• Third party service providers (transportation & warehousing)
• Retailing companies (online grocers as well as traditional retailers)
• Manufacturers of reception facilities
• Governmental or communal decision-makers
Third party home delivery service providers can utilise these results in developing
cost-efficient transportation service models, not only for e-grocery needs, but also in
the home delivery business generally. It is assumed that these results also have
relevance for those retailing companies willing to develop their currently available
home delivery services, or who are simply planning their service strategy. S-Group
and Wihuri, for example, in Finland have used this information in their e-grocery
101
operations development. Currently, Ruokavarasto, a Wihuri grocery store chain that
has taken over the S-Groups pilot operation based on unattended reception boxes
continues developing e-grocery service models, offering both attended and
unattended reception option (Peltonen, 2002).
In addition to the retailer’s and home delivery service provider's points of view, there
is a third commercial point of view from which these results are seen as relevant.
Hollming Ltd in Finland has started the commercial development and manufacturing
of unattended reception facilities partly based on the new knowledge created during
this research work. Homeport, a UK based system provider for unattended home
delivery services, has also used this information in their development work
(Borsheim, 2000).
Furthermore, this research has shown that offering home delivery services includes
the possibility of achieving positive environmental effects by potentially reducing
traffic and traffic emissions. This type of knowledge has relevance for governments
and communities who supposedly are involved in part of the investments to be made
in developing home delivery infrastructure, serving for example elderly and disabled
customers. In the UK, these results have already been taken into consideration by the
Department for Transport, Local Government and the Regions (Davies, 2002), and
in Finland by the Ministry of Transport and Communications (MINTC, 2002).
6.3 Validity and reliability of the research
According to Forrester (1961), the answers obtained from using any scientific
methods are only as relevant as the questions asked, and the validity of the results is
only as good as the assumptions on which the study is based. Validity, in this type of
business-minded modelling with a constructive approach, requires that correct
operational parameters be used.
In this dissertation, the original modelling results presented in Papers II and III were
based on accurate information collection, real point-of-sale demand data, and
modelling parameter selection based on several expert interviews (see chapter 4.2).
Next, the original results were compared with relevant real-life information from the
102
e-grocery pilot operation. The two-year e-grocery pilot operation set up in co-
operation with the business partners and the Ecomlog research group was launched
in June 2000. In the pilot operation, around 50 household customers used e-grocery
and home delivery service based on the reception box concept. The piloting
customers were located in the same test area that was used in the modelling in this
dissertation. Based on the operational information collected, the model was revised
slightly for Paper V.
The pilot operation was used to verify the validity and reliability of the research
results achieved, as suggested by Mentzer & Kahn (1995) and Kasanen et al. (1993).
The verification was conducted by measuring the efficiency of home delivery
operations based on using customer specific reception boxes. Two home delivery
rounds were measured with a stopwatch and afterwards, imitations of these two
rounds were completed using the CAPS RoutePro vehicle routing tool.
Based on the comparison, in reality the vehicle completed a route consisting of the
delivery of 24 customer orders to refrigerated reception boxes around 13 per cent
faster than suggested by the routing tool. This test was carried out on October 5th,
2001 in good weather conditions, well before the rush hour. The second test was
performed on November 23rd, 2001, shortly after the first snowfall and in poor
weather conditions, but before the rush hour. In the second test, the vehicle
completed a route consisting of the delivery of 22 customer orders to refrigerated
reception boxes around 10 per cent more slowly than suggested by the routing tool.
The error margin found on the first round was probably due to the driver's good
knowledge of the road network, the good timing of the delivery round, and the small
number of customers served in the pilot operation, which provided a certain type of
stability for the driver to improve the efficiency of the operation. In the second
round, the error margin found was certainly due to the poor weather conditions.
However, according to Ballou and Agarwahl (1988), this level of computational error
may be acceptable where results must be obtained in short order and when good
solutions, as opposed to optimal ones, are needed.
103
Based on the verification, the research results and the computer model were
confirmed as being fairly reliable and valid for the analyses conducted. Additionally,
accurate documenting and publishing of the settings, as well as the results, increase
the reliability.
6.4 Limitations of the research
As the different home delivery models were analysed in a selected part of the
Helsinki metropolitan area, the absolute numerical results of this dissertation can be
generalised only in this geographical area. However, these results are not seen as the
main contribution of this research.
More generally, the results of this dissertation indicate significant differences in
operational efficiency and cost levels among different home delivery models, even if
the same drop-off time assumption is used. This result is more broadly valid as a
generalisation than the exact cost levels or absolute performance indicators.
However, the precise cost levels and deliveries-per-hour performance indicators
shown as results in this dissertation can be taken as approximations and guidelines
elsewhere. According to this research, the costs of vehicles and labour, vehicle
capacity, location of the depot, customer density, driver experience, capacity of the
local road network, rush hour characteristics, and typical weather conditions are
some of the most important factors to be considered when developing home delivery
operations.
Furthermore, in these analyses the drop-off time was the same (2 minutes) for all the
home delivery models analysed. However, it is likely that in a real situation attended
reception includes some customer service and takes more time than unattended
reception. The time needed for customer service may also vary in different cultures.
If the drop-off time would be higher in attended reception, the difference in cost
levels between different home delivery models would be even greater than shown in
these results. Additionally, the capacity of the local road network and rush hour
characteristics are factors that affect not only the efficiency of each home delivery
model, but also the differences between the models. Poor local road network and
104
high congestion favour even more the usage of unattended reception facilities. More
accurate analysing of these topics are left for further research and development
topics.
Modelling
A limitation of the research is that the analyses of the home delivery models were
conducted using only one vehicle routing tool, RoutePro (6.4.1). Additionally,
following the advice of the CAPS representative (Lindholm, 2000) and the operating
instructions (CAPS, 1998), only the Tree-algorithm was used. Parameter selection in
the modelling work is seen as an additional limiting factor that was, however, taken
into consideration in the verification phase. In brief, conducting the analysis with
other similar tools would have increased the reliability and accuracy of the results.
However, the relative differences between the operational home delivery models
would presumably have been at the same level.
Several more general limitations may also be pointed out in the assumptions made in
this type of modelling work. Browne (2001), for example, lists six parameters that are
likely to affect trip generation in this type of modelling, and that should be taken into
consideration when evaluating the results:
1) how customer behaviour will change as a result of home shopping,
2) whether companies use shared or dedicated home delivery systems,
3) what the customer order frequency is,
4) the quantity of returned goods,
5) delivery time constraints and the need for customer to be present, and
6) the location of the distribution depot.
Nevertheless, modelling such as that used in this dissertation provides a simplistic
view of the issue. In the modelling, for example, the average consumer time used for
shopping and travel costs are presented only to give implication of the consumer
cost involved in traditional grocery shopping. However, these costs vary according to
the consumer's valuation of his/her spare time, how often the store is visited, and
whether a car or another means of transport is used.
105
Additionally, in this analysis it was assumed that in the current situation, all of the
1,450 ordering customers, that is, 1.6 per cent of the households in the test area, used
their own cars to do the 1,639 shopping trips. In order to estimate better and analyse,
for example, the overall traffic reduction potential in the future, several issues should
be taken into account. These are, for example, the proportion of households having
cars, using their cars for shopping trips, and using other means of transport when
visiting the store. For future modelling work, it would also be important to include
information on whether the customers come to the store from home or on their way
home from work or hobbies. This would provide information based on which the
location of shared reception boxes should be determined. A related open question is
the shopping behaviour of non-car owners, which should also be examined closely in
the future. If they are the most likely users of home delivery services, the result will
be extra road traffic.
Data used in the modelling
The data used in the modelling was a sample of real point-of-sales data including
detailed information about customers’ traditional grocery shopping habits. The
information was collected from five of the S-Group’s supermarkets, and customers’
street addresses were obtained from their loyalty cards. Only the orders exceeding 25
euro were taken into account. This limitation was to eliminate casual visits to the
supermarket from the data. From the modelling point of view, the most important
elements in this point-of-sales data were shopping time, customers' place of
shopping, and customers' street addresses. Limitations to vehicle capacity utilisation
were determined by the delivery time windows, shopping basket volume, and the
number of orders.
However, using supermarket based shopping data for analysing the cost structure of
the e-grocery home delivery operations restricts the validity of the results. The reason
for using traditional grocery shopping data was simple. When the research work was
started, no e-grocery shopping data was available, or the sample size was too small to
be used in modelling work.
106
e-grocery pilot
In all, the tiny size of the e-grocery market currently is seen as a limitation in this
research. Similarly, the tiny size of the e-grocery pilot operation is a limitation for
further conclusions. For example, the e-grocery pilot operation used for verifying
and improving the research results served only around 50 customers. Additionally,
the two delivery rounds analysed contained only 22 and 24 orders. The scale of the
pilot is therefore not sufficient to prove the constructive modelling results involving,
for example, 720 deliveries a day (in Paper V) as absolutely correct. A larger scale of
operations and greater number of different factors easily leads to unexpected
problems. However, regardless of the small size of the e-grocery pilot operation, real-
life information increases the practical utility and the reliability of the results, and
helps in focusing on the critical issues in developing these operations.
6.5 Agenda for further research
Various operational home delivery models have been developed and are in current
use. The search for viable, cost-efficient, and environment-friendly home delivery
models is still in progress, and requires commitment to continuously refining the
operational models and logistical networks. Further research and development work
connected with e-grocery home delivery operations should be focused on analysing
the market demand for various home delivery models in general. In particular, the
knowledge of customer acceptance of home delivery services based on shared
reception boxes would be essential. In addition, the needs of particular customer
segments, as well as different residential areas should be analysed in the future.
Home delivery research should include, for example, evaluating the possible special
needs of potential business customers such as bars or restaurants, cafeterias, catering
kitchens, offices, and similarly the needs of families with children, single households,
elderly people, disabled people, people in cities, and people in sparsely-populated
areas. The research should also include analysis and evaluation of the requirements
and potential benefits of combining the delivery material flows to and from B2C and
B2B customers.
107
There is also a need to identify and develop appropriate revenue models for the
services offered in different customer segments. This is especially so if the home
delivery service is based on unattended reception, where the primary question is who
makes the investment in the receiving facility (Kämäräinen & Punakivi, 2003).
Additionally, research should be supported by conducting pilot operations such as
that of Consignia in the UK (Rowlands, 2001a), where alternative delivery models
offering unattended reception are evaluated in different cities so that the best
solutions can be pointed out and further developed. This type of large-scale
experiment by a national postal service provider may also be seen as the first step
towards developing shared home delivery systems for any company to use.
Shared home delivery systems would supposedly increase the cost efficiency of
operations because of more extensive consolidation possibilities. Additionally, the
general level of trust in home shopping as well as customer convenience could
increase. Furthermore, shared home delivery systems would be the best solution
from the environmental point of view. In developing shared home delivery systems,
national postal organisations and dedicated service providers responsible for both
information and material flows are seen as the most favourable partners for both e-
grocers and online retailers of other physical products.
Additionally, the development of shared home delivery systems requires supporting
research work that should be carried out in various geographical areas. These are, for
example, big cities with high customer density and rural areas with low customer
density. This would enable the building up of more reliable knowledge focused on
the cost efficiency of different home delivery models. However, the availability of a
suitable amount of real online shopping point-of-sales data or home delivery data is
the key requirement for obtaining precise results. When concentrating on home
delivery services, for example, according to Lee and Whang (2001), the cost of
delivery is justified only if there is a high concentration of orders from customers
located in close proximity, or if the value of the order is large enough. Similarly,
according to Yrjölä (2003), sales per square kilometre is an important indicator
affecting the cost structure of home delivery. Based on real point-of-sales data, it
would be possible to analyse, evaluate, and develop more effectively the home
108
delivery models and customer service level in practice. One simple tool for
determining whether it is economical to deliver goods to a neighbourhood area in
one trip has been presented by Lee and Whang (2001). Delivery-value density (DVD)
can be computed by dividing the average total dollar volume of the shipment per trip
by the average travel distance per trip. This would presumably be a useful measure in
analysing, defining, pricing, and developing the home delivery models for different
types of geographical areas. However, the critical requirement is the availability of
real point-of-sales data.
Finally, changes in customers’ shopping habits and the possible effects of home
shopping on their leisure time activities should be examined and analysed in the
future. In this way, new knowledge concerning the possible environmental effects of
home shopping and home delivery services could be increased. This again might
encourage governments or communities to invest in developing home delivery
services.
109
References
ACNielsen (2002), "Grocery retailing in Finland in 2001 -Päivittäistavarakauppa
2001" (in Finnish), http://www.acnielsen.fi
Auramo, J., Aminoff, A., Punakivi, M. (2002), "Research agenda for e-business
logistics -based on professional opinions", International Journal of Physical
Distribution and Logistics Management, Vol.32, Iss.7, pp.513-531.
Aromaa, P. (1999), “Experiences and costs" (In Finnish), magazine article in
Tekniikan Maailma, Vol. 47 No. 20/99, pp. 132-134
Aromaa, P. (2001), "TM Car Tests 1992-2001 -TM Käyttötestit 1992-2001" (in
Finnish), magazine article in Tekniikan Maailma, Vol. 49 No. 20/01, pp. 144-
146
Austria Farmer, M. (2000), "Webvan delivers charge for small orders", CNET
news.com, Nov. 2000, http://news.cnet.com/news/0-1007-200-3579941.html
Austria Farmer, M. and Sandoval, G. (2001), "Webvan delivers its last word:
Bankruptcy", CNET news.com, Jul. 2001, http://news.cnet.com/news/0-1007-
200-6519317.html
@ Your Home (2001), "@ Your Home -New Markets for Customer Service and
Delivery", Report to Retail Logistics Task Force of Foresight program, UK, p.46,
http://www.foresight.gov.uk/servlet/DocViewer/doc=2857/
Ballou, R.H. and Agarwahl, Y. K. (1988), "A Performance comparison of Several
Popular Algorithms for Vehicle Routing and Scheduling", Journal of Business
Logistics, Vol. 9, No. 1, pp.51-65
Ballou, R. (1989), "Heuristics: Rules Of Thumb For Logistics Decision Making",
Journal of Business Logistics, Vol. 10, No.1, pp. 122-132.
110
Ballou, R.H. (1999), Business Logistics Management -Planning, Organizing and Controlling the
Supply Chain, Fourth Edition, Prentice-Hall Inc., New Jersey, p. 682.
Bartolotta, S. (1998), The consumer direct channel How the virtual retailer is winning
new customers, In Strategic Supply Chain Alignment Best Practice in supply chain
management, Ed. Gattorna J., Gower Publishing Limited, Brookfield.
Bentham, M. (2001), "Fridge door opens for home deliveries", The Sunday Telegraph,
May 6, p.10,
http://news.telegraph.co.uk/news/main.jhtml?xml=/news/2001/05/06/ncoo
l06.xml
BearBox (2001), http://www.bearbox.com, November 2001
Bodin, L. (1990), "Twenty years of routing and scheduling", Operations Research, July-
August 1990, Vol. 38, No. 4, pp.571-579.
Bonning, K., Rader, E. and Chavie, R. (1998), The global retail supply chain, In
Strategic Supply Chain Alignment Best Practice in supply chain management, Ed. Gattorna
J., Gower Publishing Limited, Brookfield.
Borgström, H. (1998), "Matomera först i Europa med enbart nätkunder" (in
Swedish), Dagens Industri, 1998-11-02, (http://di.se/inetsspec98b/di0016.htm)
Borsheim, Turid (2000) personal communication with Ms. Turid Borsheim and Mr.
Mark Lunn from Homeport Ltd., London, September 6, 2000
Bowersox, D.J. and Closs, D.J. (1989), "Simulation In Logistics: A Review Of
Present Practice And A Look To The Future", Journal of Business Logistics, Vol.10,
No. 1, pp.133-148.
Bowersox, D.J. and Closs, D.J. (1996), Logistical Management the integrated supply chain
process, McGraw-Hill, New York, p.730.

111
Bowersox, D.J., Closs, D.J. and Stank, T.P (1999), 21st Century Logistics: Making Supply
Chain Integration A Reality, Council of Logistics Management, Oak Brook, p.264.
Boxcar (2002), http://www.boxcarsystems.com, Feb 2002
Brady, D. and Harrison, J. (1990), "Physical Diswtribution Management in Mail
Order - The Grattan Case", In: Retail Distribution Management, pp. 223-239, Ed.
Fernie, John, Kogan Page, London, p.244.
Bramel, J. and Simchi-Levi, D. (1996), "Probabilistic analyses and practical algorithms
for the vehicle routing problem with time windows", Operations Research, May/Jun
1996, Vol. 44 No. 3, pp. 501-509.
Brooksher, K., (1999), "E-commerce and logistics", Traffic World, Vol. 260, Iss.7,
Nov. 15, pp. 31-34.
Browne, M. (2001), "The impact of e-commerce on transport" paper presented in
OECD/ECMT seminar, Paris, France.
Browne, M., Jackson, M., Allen, J. and Anderson, S. (2001), "Home delivery market
size and operations in the UK", Logistic Research Network 2001 conference
proceedings, Heriot Watt University, Edinburgh, UK.
Bräysy, O. (2001), "Local Search and Variable Neighborhood Search Algorithms for the
Vehicle Routing Problem with Time Windows", Acta Wasaensia, No. 87,
Mathematics 8. Operational Research, University of Vaasa, Vaasa, Finland
Cairns, S. (1996), "Delivering alternatives: Successes and Failures in Providing Home
Delivery Services for Food Shopping", Transport Policy, Vol. 3, Iss.4, pp. 157-
176.
112
Cairns, S. (1997), "Potential traffic reductions from home delivery services: Some
initial calculation", ESRC Transportation Studies Unit, University College London,
Ref.97/45, p.39
Cairns, S. (1998) "Promises and problems: using GIS to analyse shopping travel",
Journal of Transport Geography, Vol. 6, No. 4, pp. 273-284.
Cairns, S. (1999), "Home Delivery: environmental solution or disaster?",
http://www.ucl.ac.uk/transport-studies/tsuhome.htm
http://www.asgab.com/index.asp?mainframe=miljo/index.asp&meny=miljo
CAPS (1998), Operating manual CAPS101D, RoutePro Dispatcher, Operational
Vehicle Routing, pp. 198-200.
CAPS (2002), http://www.caps.com/products/rprodisp/rpromain.asp
Carneal, T. (2001), "Online Grocers Eyes Wide Shut?", Food Logistics, Iss. 44, Sept.
15, pp. 23-26.
Christopher, M. (1998), Logistics and Supply Chain Management-Strategies for Reducing Cost
and Improving Service, Pearson Education Limited, Great Britain, p.294.
Clark, G. and Wright, J. (1964), "Scheduling of vehicles from a central depot to a
number of delivery points", Operations Research, Vol. 12, No.4, pp. 568-581.
CPFR.org (2002), http://www.cpfr.org
Cuglielmo, C. (2000), "Can Webvan deliver the goods?", Inter@ctive Week, February 7,
2000, http://www.zdnet.com
Croft, J. (2000), "Dynamid boxes clever", Financial Times, Companies & Finance, July 8.,
2000.
113
Dagher, N., Soumitra, D. and De Meyer, A. (1998), "Online Grocery Shopping", 1998
INSEAD, Fontainebleau, France.
Danska, Kimi (2001), personal communications with Mr. Danska, sales
representative for Helsingin KTK Oy, November 22nd, 2001
Danzig, G.B. and Ramser, J.H. (1959), "The truck dispatching problem", Management
Science, Vol.6, pp.80-91
Davies, Lowri (2002), personal communications with Mrs. Davies, Research
coordinator in DTLR (Department for Transport, Local Government and the
Regions) UK, Helsinki 19th August , 2002.
Demkes, R. & Tavasszy L. (2000), "Benchmarking Infrastructure and Logistic
Services Across Europe, Asia-Pacific and North America", IMRL 2000 Third
International Meeting for Research in Logistics, Trois-Rivie'res, France
Department of Environment, Transport & the Regions (1998), " A new deal for
transport: better for everyone", The Government’s White Paper on the future of
transport, London, http://www.detr.gov.uk/itwp/index.htm
Desrochers, M., Lenstra, J.K., Savelsberg, M.W.P. and Soumis, F. (1988), "Vehicle
routing with time windows: optimization and approximation", In: Vehicle Routing:
Methods and Studies, pp.65-84, Ed. Golden, B.L. & Assad, A.A., Elsevier Science
Publishers, Amsterdam.
Desrochers, M., Desrosiers, J. and Solomon, M. (1992), "A New Optimization
Algorithm for the Vehicle Routing Problem with Time Windows", Operations
Research, March-April 1992, Vol. 40, No. 2, pp. 342-3534.
Desrosiers, J., Soumis, F. and Sauve, M. (1988), "Lagrangian Relaxation Methods for
Solving the Minimum Fleet Size Multiple Traveling Salesman Problem With
Time Windows", Management Science, Vol. 34, 1005-1022.
114
Desrosiers, J., Dumas, Y., Solomon, M. and Soumis, F. (1995),"Time constrained
routing and scheduling", In: Handbooks in Operations Research and Management
Science , Vol. 8, Network Routing, pp. 35-139, Ed. Ball M., Magnanti T., Monma
C. and Nemhauser, G, Elsevier Science Publishers, Amsterdam.
DTLR (2002), A general letter sent on 16.1.2002 for feedback on DTLR formulated
research priorities and individual projects based on the Foresight “@ Your
Home” document, Department for Transport, Local Government and the
Regions, UK.
Eisenhardt, K. (1989), "Building Theories from Case Study Research", Academy of
Management Review, vol.14, No.4, pp.532-550
Eloranta E. (2000), "Characteristics of a Post Graduate Thesis- Research Methods in
Industrial Engineering and Management", lecture to doctoral students,
Helsinki University of Technology, 5.12.2000
EU (2002), The EU's Fifth Framework Programme (FP5), The Growth Programme,
Research theme Sustainable mobility and intermodality
http://europa.eu.int/comm/research/growth/gcc/guidedtour.html#top ,
http://europa.eu.int/comm/research/growth/gcc/ka02.html#top
Feare, T. (1999), "Building a new kind of on-line business" Modern Materials Handling
Iss. 9, August 1/1999,
http://www.manufacturing.net/mmh/index.asp?layout=articleWebzine&articleid
=CA125164
Fernie, J., Pfab, F. and Marchant, C. (2000), "Retail Grocery Logistics in the UK",
The international Journal of Logistics Management, Vol. 11, No. 2, pp.83-90
Finch, J. (2001), "E-grocery sales soar in Britain", Guardian, Feb. 23, 2001,
http://www.guardian.co.uk/Archive/Article/0,4273,4140780,00.html
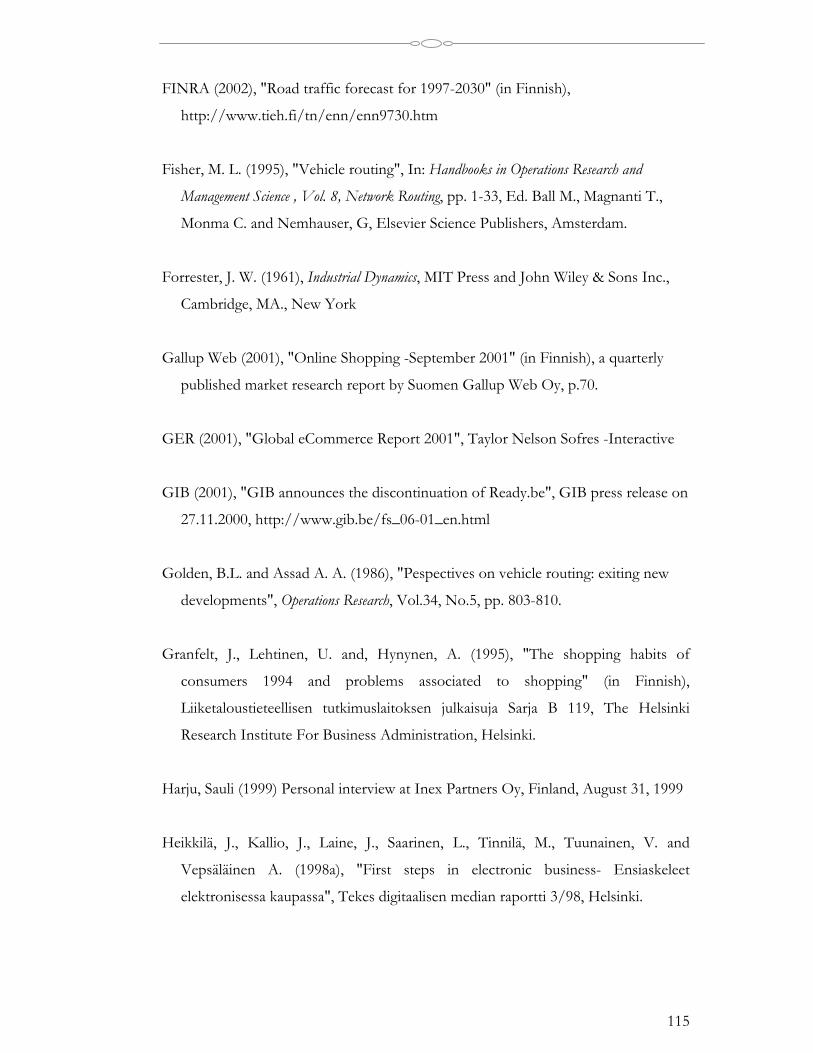
115
FINRA (2002), "Road traffic forecast for 1997-2030" (in Finnish),
http://www.tieh.fi/tn/enn/enn9730.htm
Fisher, M. L. (1995), "Vehicle routing", In: Handbooks in Operations Research and
Management Science , Vol. 8, Network Routing, pp. 1-33, Ed. Ball M., Magnanti T.,
Monma C. and Nemhauser, G, Elsevier Science Publishers, Amsterdam.
Forrester, J. W. (1961), Industrial Dynamics, MIT Press and John Wiley & Sons Inc.,
Cambridge, MA., New York
Gallup Web (2001), "Online Shopping -September 2001" (in Finnish), a quarterly
published market research report by Suomen Gallup Web Oy, p.70.
GER (2001), "Global eCommerce Report 2001", Taylor Nelson Sofres -Interactive
GIB (2001), "GIB announces the discontinuation of Ready.be", GIB press release on
27.11.2000, http://www.gib.be/fs_06-01_en.html
Golden, B.L. and Assad A. A. (1986), "Pespectives on vehicle routing: exiting new
developments", Operations Research, Vol.34, No.5, pp. 803-810.
Granfelt, J., Lehtinen, U. and, Hynynen, A. (1995), "The shopping habits of
consumers 1994 and problems associated to shopping" (in Finnish),
Liiketaloustieteellisen tutkimuslaitoksen julkaisuja Sarja B 119, The Helsinki
Research Institute For Business Administration, Helsinki.
Harju, Sauli (1999) Personal interview at Inex Partners Oy, Finland, August 31, 1999
Heikkilä, J., Kallio, J., Laine, J., Saarinen, L., Tinnilä, M., Tuunainen, V. and
Vepsäläinen A. (1998a), "First steps in electronic business- Ensiaskeleet
elektronisessa kaupassa", Tekes digitaalisen median raportti 3/98, Helsinki.
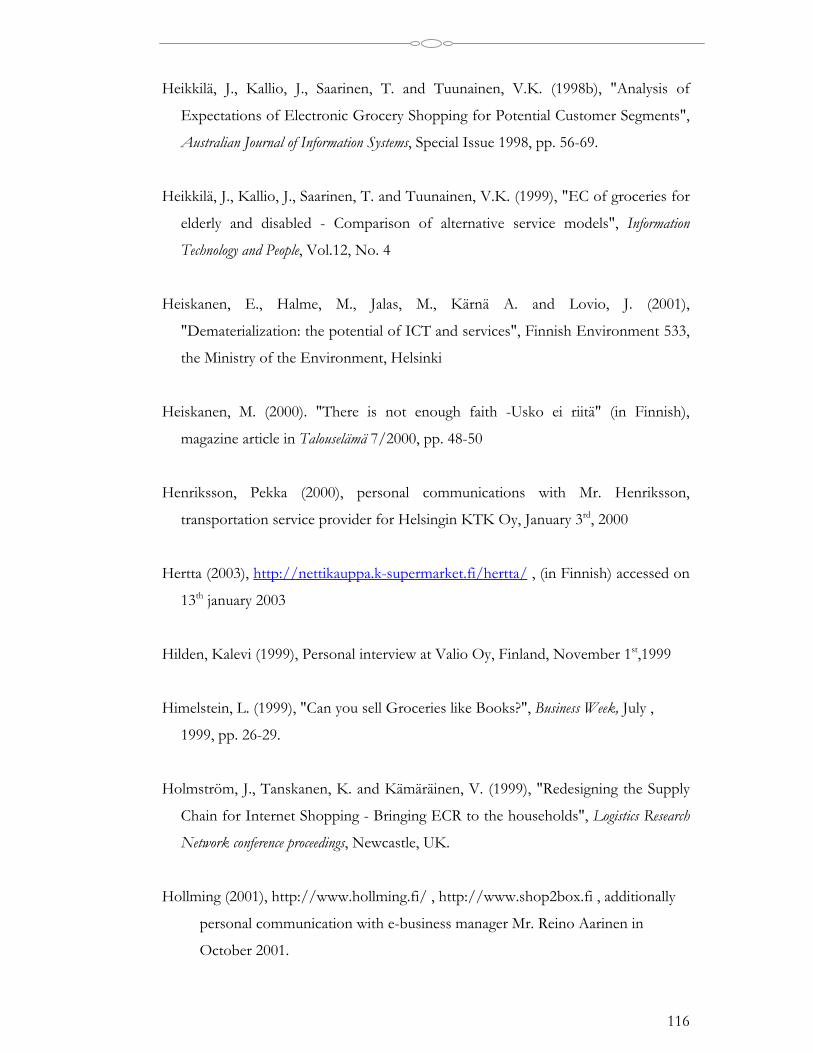
116
Heikkilä, J., Kallio, J., Saarinen, T. and Tuunainen, V.K. (1998b), "Analysis of
Expectations of Electronic Grocery Shopping for Potential Customer Segments",
Australian Journal of Information Systems, Special Issue 1998, pp. 56-69.
Heikkilä, J., Kallio, J., Saarinen, T. and Tuunainen, V.K. (1999), "EC of groceries for
elderly and disabled - Comparison of alternative service models", Information
Technology and People, Vol.12, No. 4
Heiskanen, E., Halme, M., Jalas, M., Kärnä A. and Lovio, J. (2001),
"Dematerialization: the potential of ICT and services", Finnish Environment 533,
the Ministry of the Environment, Helsinki
Heiskanen, M. (2000). "There is not enough faith -Usko ei riitä" (in Finnish),
magazine article in Talouselämä 7/2000, pp. 48-50
Henriksson, Pekka (2000), personal communications with Mr. Henriksson,
transportation service provider for Helsingin KTK Oy, January 3rd, 2000
Hertta (2003), http://nettikauppa.k-supermarket.fi/hertta/ , (in Finnish) accessed on
13th january 2003
Hilden, Kalevi (1999), Personal interview at Valio Oy, Finland, November 1st,1999
Himelstein, L. (1999), "Can you sell Groceries like Books?", Business Week, July ,
1999, pp. 26-29.
Holmström, J., Tanskanen, K. and Kämäräinen, V. (1999), "Redesigning the Supply
Chain for Internet Shopping - Bringing ECR to the households", Logistics Research
Network conference proceedings, Newcastle, UK.
Hollming (2001), http://www.hollming.fi/ , http://www.shop2box.fi , additionally
personal communication with e-business manager Mr. Reino Aarinen in
October 2001.

117
Holtari, Jyrki (2000), Personal interview at UPS (Finland) Oy, November 1st, 2000
Homeport (2002), http://www.homeporthome.com, November 2001
Hoover, W. E., Eloranta, E., Holmström, J. and Huttunen, K. (2001), Managing the
Demand-Supply Chain -Value Innovations for Customer Satisfaction, John Wiley &
Sons, Inc., New York, p.257.
Hoyt, D. (2001), "Tesco Delivers", Graduate school of business Stanford University,
Case number EC-32, September 2001, p.11
Huhtakangas, P. (2000)."S-kanava is piloting the reception boxes- S-kanava kokeilee
ruokapostilaatikkoja" (in Finnish), magazine article in Kehittyvä Elintarvike 4/2000,
pp.14-15
IDC (2000), "Online grocery Sales will Skyrocket", June 13., 2000,
http://www.businessweek.com/ebiz/0006/dm0613.htm
IGD (1999), "Retail Logistics 1999, IGD Annual Survey",
http://www.som.hw.ac.uk/logistics/download.html
IGD (2001), "Retail Logistics 2001 -Benchmarking Supply Chains ", IGD Business
Publication, UK, p. 318.
Ingram, B. (1999), "Boston bears watching", Supermarket Business, March, pp.41-45
Inkiläinen, A. (1998), "Managerial views on distribution systems", Doctoral Thesis,
Helsinki School of Economics and Business Administration, HSE, A-140,
Helsinki, p. 222.
Jaakola, T. (1999), "Local Distribution Center for E-Grocery -Verkkokaupan
paikallinen jakelukeskus" (in Finnish), Masters Thesis in Tampere University of
Technology, p. 92+17.
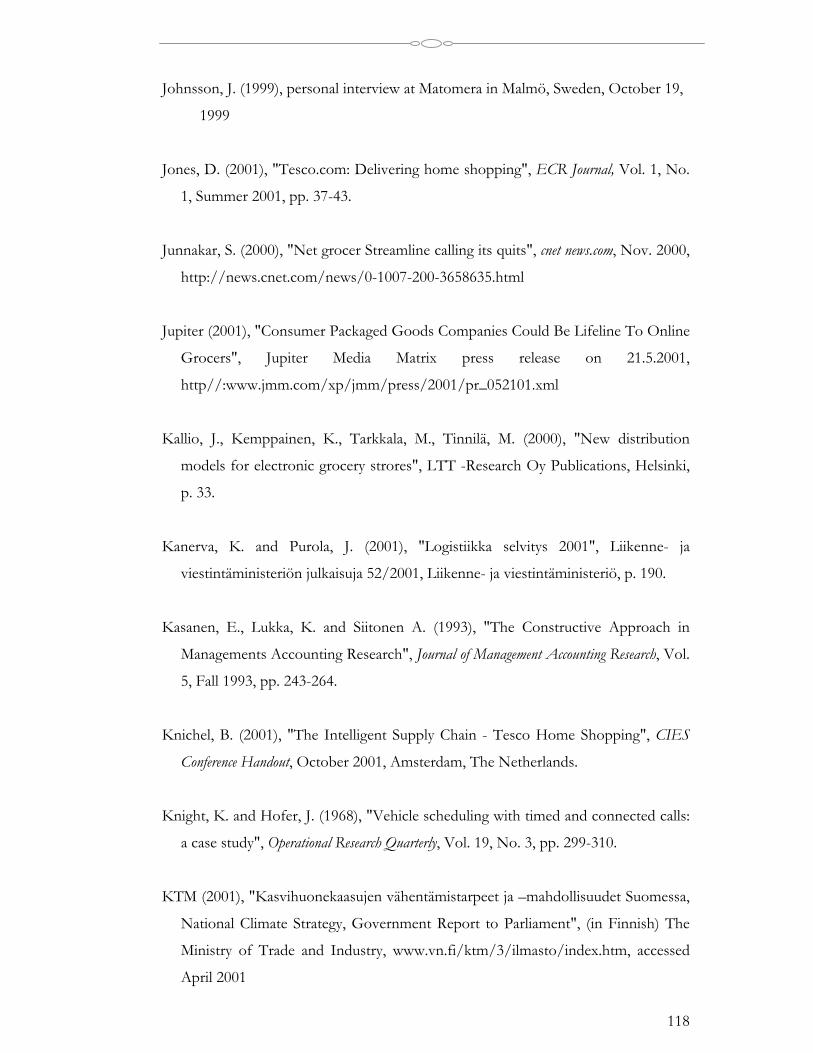
118
Johnsson, J. (1999), personal interview at Matomera in Malmö, Sweden, October 19,
1999
Jones, D. (2001), "Tesco.com: Delivering home shopping", ECR Journal, Vol. 1, No.
1, Summer 2001, pp. 37-43.
Junnakar, S. (2000), "Net grocer Streamline calling its quits", cnet news.com, Nov. 2000,
http://news.cnet.com/news/0-1007-200-3658635.html
Jupiter (2001), "Consumer Packaged Goods Companies Could Be Lifeline To Online
Grocers", Jupiter Media Matrix press release on 21.5.2001,
http//:www.jmm.com/xp/jmm/press/2001/pr_052101.xml
Kallio, J., Kemppainen, K., Tarkkala, M., Tinnilä, M. (2000), "New distribution
models for electronic grocery strores", LTT -Research Oy Publications, Helsinki,
p. 33.
Kanerva, K. and Purola, J. (2001), "Logistiikka selvitys 2001", Liikenne- ja
viestintäministeriön julkaisuja 52/2001, Liikenne- ja viestintäministeriö, p. 190.
Kasanen, E., Lukka, K. and Siitonen A. (1993), "The Constructive Approach in
Managements Accounting Research", Journal of Management Accounting Research, Vol.
5, Fall 1993, pp. 243-264.
Knichel, B. (2001), "The Intelligent Supply Chain - Tesco Home Shopping", CIES
Conference Handout, October 2001, Amsterdam, The Netherlands.
Knight, K. and Hofer, J. (1968), "Vehicle scheduling with timed and connected calls:
a case study", Operational Research Quarterly, Vol. 19, No. 3, pp. 299-310.
KTM (2001), "Kasvihuonekaasujen vähentämistarpeet ja –mahdollisuudet Suomessa,
National Climate Strategy, Government Report to Parliament", (in Finnish) The
Ministry of Trade and Industry, www.vn.fi/ktm/3/ilmasto/index.htm, accessed
April 2001
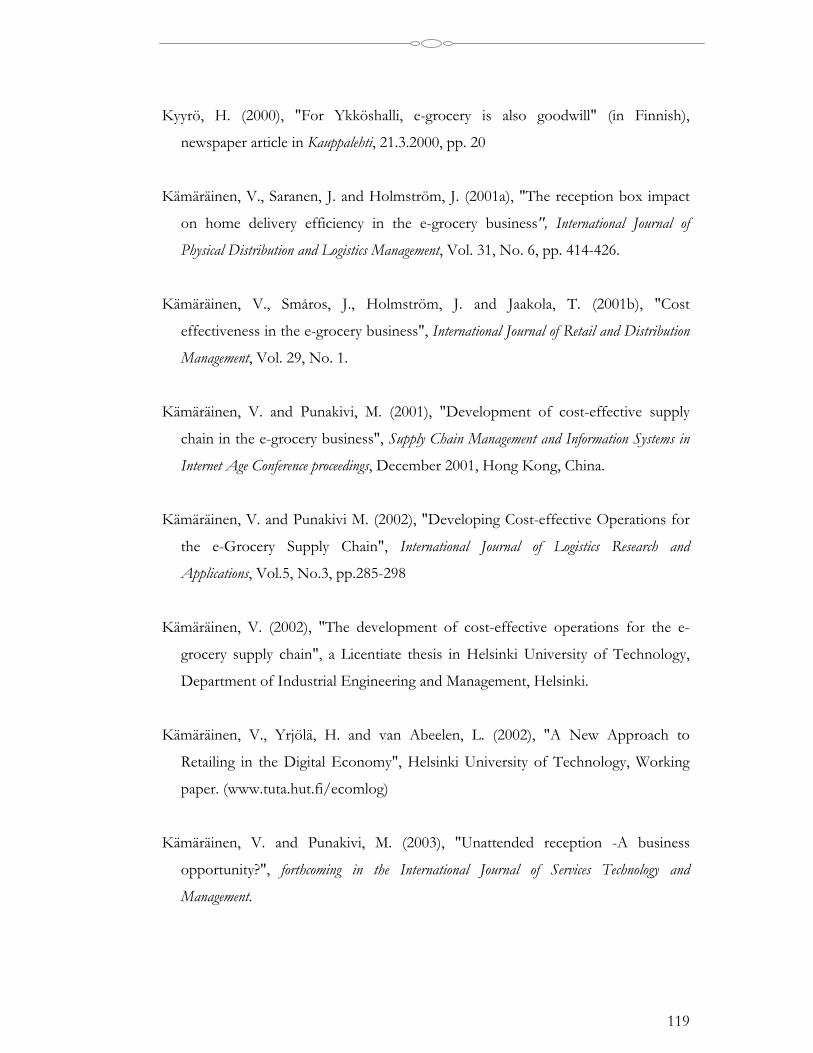
119
Kyyrö, H. (2000), "For Ykköshalli, e-grocery is also goodwill" (in Finnish),
newspaper article in Kauppalehti, 21.3.2000, pp. 20
Kämäräinen, V., Saranen, J. and Holmström, J. (2001a), "The reception box impact
on home delivery efficiency in the e-grocery business", International Journal of
Physical Distribution and Logistics Management, Vol. 31, No. 6, pp. 414-426.
Kämäräinen, V., Småros, J., Holmström, J. and Jaakola, T. (2001b), "Cost
effectiveness in the e-grocery business", International Journal of Retail and Distribution
Management, Vol. 29, No. 1.
Kämäräinen, V. and Punakivi, M. (2001), "Development of cost-effective supply
chain in the e-grocery business", Supply Chain Management and Information Systems in
Internet Age Conference proceedings, December 2001, Hong Kong, China.
Kämäräinen, V. and Punakivi M. (2002), "Developing Cost-effective Operations for
the e-Grocery Supply Chain", International Journal of Logistics Research and
Applications, Vol.5, No.3, pp.285-298
Kämäräinen, V. (2002), "The development of cost-effective operations for the e-
grocery supply chain", a Licentiate thesis in Helsinki University of Technology,
Department of Industrial Engineering and Management, Helsinki.
Kämäräinen, V., Yrjölä, H. and van Abeelen, L. (2002), "A New Approach to
Retailing in the Digital Economy", Helsinki University of Technology, Working
paper. (www.tuta.hut.fi/ecomlog)
Kämäräinen, V. and Punakivi, M. (2003), "Unattended reception -A business
opportunity?", forthcoming in the International Journal of Services Technology and
Management.

120
Kämäräinen, V. (2003), "The impact of investments in operations efficiency on the e-
grocery business system", Doctoral dissertation, Helsinki University of
Technology, Helsinki.
Lambert, D. M. and Stock, J. R. (1993), Strategic Logistics Management, Richard D.
Irwin, Inc., Homewood, p. 862
Lambert, D.M, Stock, J.R. and Ellram, L.M. (1998), Fundamentals of Logistics
Management, Irwin/McGraw-Hill, Boston, p.611
Lardner, J. (1998), "Please don't squeeze the tomatoes online -Supermarkets of the
future have no aisles", U.S. News & World Report, November 9, pp. 51-52.
Laseter, T., Houston, P., Chung, A., Byrne, S., Turner, M., Devendran, A. (2000),
"The Last Mile to Nowhere", Strategy + Business, September 2000, Issue 20.
Lassila, A. (2000), "Package deliveries in huge growth - Paketti kuljetukset hurjassa
kasvussa" (in Finnish), newspaper article in Helsingin Sanomat, 26.2.2000
Law, A. and Kelton, W. (2000), Simulation Modeling and Analysis, McGraw-Hill
Companies Inc., Singapore.
Lawler, E.L., Lenstra, J.K., Rinnooy Kan, A.H.G. and Shmoys, D.B. (1985), The
Travelling Salesman Problem: A Guided Tour of Combinatorial Optimization, John Wiley
& Sons Ltd., New York.
Lawrence, J. and Pasternack, B. (2002), Applied Management Science -Modeling, Spreadsheet
Analysis, and Communication for Decision Making, John Wiley & Sons Inc., New York
Lee, Hau L. and Whang S. (2001), "Winning the Last Mile of E-commerce", MIT
Sloan Management Review, Vol. 42, Iss. 4, pp. 54-62.
Lehtonen, Joni. (1999), personal communications with Mr. Lehtonen, development
manager of Schenker Kiitolinja Oy, December 12th, 1999
121
Lehtonen, J-M. (1999), "Supply Chain Development in Process Industry", Acta
Polytechnica Scandinavica, IM 4, Industrial Management and Business
Administration Series, Helsinki University of Technology, Finland
Lewis, H.T., Culliton, J.W. and Steele, J.D. (1956), "The Role of Air Freight in
Physical Distribution", Harvard Business School, Boston Ma.
Lewis, A. (2000), "@ Your Service Future Models of Retail Logistics", Report to
Retail Logistics Task Force of Foresight program, UK, p.36.
Lewis, C. (2001), "Leap of faith", Logistics Europe, April 2001, pp. 40-46.
Lindholm, M. (2000), personal interview of Mr. Lindholm a representative of CAPS
logistics at Helsinki University of Technology, Finland, April 4th, 2000.
Magee, J.F., Copacino, W.C. and Rosenfield, D.B. (1985), Modern Logistics Management
-Integrating Marketing, Manufacturing, and Physical Distribution, John Wiley & Sons,
New York, p. 430.
Matikainen, Harri (1999) personal interviews of Mr. Matikainen, Logistics director of
Hasrtwall at Hartwall Oy, Finland, September 1st, 1999 and October 15th, 1999
Matomera (2001), Press announcement 2001/03/26:"Matomeras verksamhet
upphör- Matomera closing the operations" (Swedish),
http://www.bergendahls.se/matomera/index.html
McKinnon, A. (1990), "The Advantages and Disadvantages of Centralised
Distribution", In: Retail Distribution Management, pp. 75-89, Ed. Fernie, John,
Kogan Page, London, p. 244.
McKinnon, A. (1996), "The Development of Retail Logistics in the UK" Report to
UK Technology Foresight Programme Retail and Distribution Panel, School of
Management Heriot-Watt University, November 1996, p.47.

122
Mendelson, H. (2001), “Webvan: The new and Improved Milkman”, Graduate
School of Business Stanford University, Case number EC-31, March 2001, p.15
Mentzer, J.T. (1989), "Symposium Feature: Approaches to Logistics Modeling",
Journal of Business Logistics, Vol.10, No.1, pp. 104-105.
Mentzer, J.T. and Kahn, K.B. (1995), "A Framework Of Logistics Research", Journal
of Business Logistics, Vol.16, No.1, pp. 231-249.
MINTC (2002), Ministry of Transport and Communications Finland,
http://www.mintc.fi/www/sivut/suomi/ymparisto/ , and
http://www.mintc.fi/www/sivut/suomi/ymparisto/sivut/dokumentit/tutkimus/
ilmasto/ilmastofin.htm
Morganosky, M. and Cude B. (2000), "Consumer response to online grocery
shopping", International Journal of Retail & Distribution Management, Vol. 28, No. 1,
pp. 17-26.
Mäkelä, Kari, Kanner, Heikki, Laurikko, Juhani, (1996), "The road traffic emissions
in Finland -Liisa 95 - emission model" (in Finnish), VTT Research notes 1772,
VTT, Espoo.
Mäkelä, Kari, (1999), personal interview, VTT Yhdyskuntatekniikka, Finland
October 21st, 1999.
Nasdaq (2000), "Streamline.com to be Delisted From Nasdaq National Market"-
Press release on November 28, 2000.
Nettimarket (2002) http://www.nettimarket.com, (in Finnish) accessed on 13th
January 2003
Niiniluoto, I. (1993), "The Aim and Structure of Applied Research", Erkentniss 38,
pp.1-21
123
Nummenpää, J. and Ollikainen, T. (1999), "The Goods traffic in densely populated
areas in Finland" (in Finnish), Publications of the Ministry of Transport and
Communications 5/99, Ministry of Transport and Communications, Helsinki.
Nuutinen, P. (2002), "Tolerable traffic as the goal -Tavoitteena siedetävä liikenne" (in
Finnish), newspaper article in Helsingin Sanomat, 2.2.2002, p. E2.
Näsi, J. (1980), “Liiketaloustiede soveltavana tieteenä: perusongelmien hahmotus ja
analyysi” (In Finnish), University of Tampere, Series A2, Research report 8, p.44.
Ojala, Kimmo (1999) personal interview at Inex Partners Oy, Finland, August 31,
1999
Onal, H., Jaramillo, B.M. and Mazzocco, M.A. (1996), "Two formulations of the
vehicle routing problem: An empirical application and computational experience",
Logistics and Transportation Review, Vol. 32, Iss. 2, pp. 177-186.
O'Neill, B. (2001), " Grocery eTailing-Eating Their Words Industry analysts remain
bullish on eGroceries but where's the beef? "
http://www.accenture.com/xd/xd.asp?it=enWeb&xd=industries/products/c
gs/egrocery.xml
Panimoliitto (2002), The association of Finnish Breweries online-address:
http://www.panimoliitto.fi/ymparisto/kiertavatpakkaukset.htm accessed
19.12.2002
Pastinen, V. (1999), "Passenger Transport Survey 1998-1999 -
Henkilöliikennetutkimus 1998-1999" (in Finnish), Publications of the Ministry of
Transport and Communications 43/99, Ministry of Transport and
Communications, Helsinki.

124
Peapod (2000), "Peapod Acquires Streamline.com, Inc.'s Operations in Two Key
Markets; Exits Texas and Ohio; Announces Plans to Enter Baltimore-
Washington" -Press release on September 7, 2000.
Peapod (2001), http://www.peapod.com, July 2001
Peltonen, K. (2002), "Wihuri and Hollming developing the e-grocery operations
together - Wihuri ja Hollming panostavat yhdessä ruokaverkkokauppaan", (in
Finnish) newspaper article in Tekniikka& Talous, 22.8.2002, pp. 5
Perman, S. (2000), "The eScout pledge: I, George Shaheen Promise to Do My Best,
to Do My Duty to God and My Country, to Help Other People and to Beat
the Living Crap out of the Competition", eCompany Now, September 2000,
pp.147-154.
Perttunen, J. (1995), "Computational experiments on edge exchange heuristics for
the euclidean travelling salesman problem", Acta Wasaensia, No. 33,
Mathematics 5. Operational Research, University of Vaasa, Vaasa, Finland
Peters, E. (2000), "Meeting the e-Fulfillment Challenge", Supply Chain Management
Review, November/December 2000, pp. 64-70
Posti (2001), Finland Post Corporation Annual Report 2001,
http://www.posti.fi/finlandpost/annualreports/
Powell, M. (2000), "A perspective on the key issues in the development of food
home shopping in the UK", CIES -Supply Chain for e-Commerce and Home Delivery in
the Food Industry Conference Handout, May 2000, Berlin, Germany.
Powers, R. (1989), "Optimization Models For Logistics Decisions", Journal of Business
Logistics, Vol. 10, No.1, pp.106-121.
Pullen, H. and Webb, M. (1967), "A computer application to a transport scheduling
problem", Computer Journal, Vol.10, No. 1, pp.10-13.

125
Punakivi, M. and Saranen, J. (2001). " Identifying the success factors in e-grocery
home delivery", International Journal of Retail and Distribution Management, Vol. 29,
No. 4, pp. 156-163.
Punakivi, M., Yrjölä, H. and Holmström, J. (2001) "Solving the Last Mile Issue:
Reception box or Delivery box?", International Journal of Physical Distribution and
Logistics Management, Vol. 31, No. 6, pp.427-439.
Punakivi, M. and Holmström, J. (2001), "Environmental performance improvement
potentials by food home delivery", NOFOMA 2001 Conference Proceedings,
Reykjavik, Iceland.
Punakivi, M. and Tanskanen, K. (2002), "Increasing the cost efficiency in e-fulfilment
by using shared reception boxes", International Journal of Retail and Distribution
Management, Vol.30, No. 10, pp.498-507.
Priluck, R. (2001), "The impact of priceline.com on the grocery industry", International
Journal of Retail & Distribution Management, Vol. 29, No. 3, pp. 127-134.
Pylvänäinen, E. (1996), "Shopping for groceries in localities of different sizes -
Päivittäistavarakaupassa asiointi erikokoisilla paikkakunnilla" (in Finnish),
Working papers 27/1996, National Consumer Research Centre, p.34.
Päivittäistavarakauppa (2001), "A brochure of Finnish grocery markets and annual
grocery sales -Päivittäistavarakauppa 2001 esite" (in Finish),
http://www.pty.fi/esite2001.html
Raijas, A. (1994), "The costs of customers in grocery shopping -Asioinnin
kustannukset päivittäistavarakaupassa" (in Finnish), Publications 15/1994,
National Consumer Research Centre, Helsinki, p.79.
Raijas, A. (2000a), "The consumer benefits and problems in electronic grocery store",
Working paper, Helsinki School of Economics, Electronic Commerce Institute

126
Raijas, A. (2000b), "Electronic and traditional grocery shopping -Päivittäistavaroiden
ostaminen elektronisessa ja perinteisessä kaupassa" (in Finnish), LTT-Tutkimus
Oy Elektronisen Kaupan Instituutti, p.33.
Reda, S. (1998), "Internet Food Retailers Face Tough Picking, Delivery Issues",
Stores, March 1998, pp. 50-51.
Reinhardt, A. (2001), "Tesco Bets Small - and Wins Big", Businessweek Online, October
1, http://www.businessweek.com/magazine/content/01_40/b3751622.htm
Reynolds, J. (2000), "eCommerce: acritical review", International Journal of Retail &
Distribution Management, Vol.28, No.10, pp. 417-444.
Reynolds, J. (2002), "Charting the multi-channel future: retail choises and
constraints", International Journal of Retail and Distribution Management,
Vol.30, No.11, pp.530-535
Ring, L. and Tigert, D. (2001), "Viewpoint: the decline and fall of Internet grocery
retailers", International Journal of Retail & Distribution Management, Vol. 29, No. 6,
2001, pp. 264-271.
Rowlands, P. (2001a), "Consignia's home delivery drive", e.logistics MAGAZINE,
Issue 13, Sept. 2001, pp. 22-25.
Rowlands, P. (2001b), "Home delivery -the story so far", e.logistics MAGAZINE,
Issue 14, Oct. 2001, pp.12-13.
Rowlands, P. (2002), "Why Consignia keeps coming up with more options", e.logistics
MAGAZINE, Issue 22, Sept. 2002, pp. 16-18.
Ruokanet (2003), http://www.ruoka.net/ , (in Finnish) accessed 13th January 2003
Ruokarasti (2003), http://www.ruokarasti.net ,(in Finnish) accessed 13th January 2003

127
Ruokavarasto (2003), http://www.ruokavarasto.fi ,(in Finnish) accessed 13th January
2003
Sandoval, G. (2000), "Webvan defends business model despite woes", CNET
news.com, November 13, 2000, http://news.cnet.com/news/0-1007-202-
3662541.html
Sandoval, G. (2001a), "Webvan hikes delivery fees", CNET news.com, May 1, 2001,
http://news.cnet.com/news/0-1007-200-5786526.html
Sandoval, G. (2001b), "Webvan files for backruptcy protection", CNET news.com, July
13, 2001, http://news.cnet.com/news/0-1007-200-6563050.html
Seppälä, U. (1996), "Developing logistics in the outer circle of the European Union",
Licentiate's thesis, Helsinki University of Technology, p. 85.
Seppälä, U. (1997), "An Evolutionary Approach for Locating Economic Facilities",
Acta Polytechnica Scandinavica, Ma 83, Mathematics, Computing and
Management in Engineering Series, Helsinki University of Technology, Finland
Siemens (2002), "Siemens HomeDeliveryBox" (in Dutch)
http://www.siemens.nl/hdb/default.asp, Jan 2002
Siikavirta, H., Punakivi, M., Kärkkäinen, M. and Linnainen, L. (2003), "Effects of e-
commerce on greenhouse gas emissions case: home delivery service", Journal of
Industrial Ecology, Vol.6, No. 2, pp.83-97
Småros, J., Holmström,J. (2000), "Reaching the consumer through e-grocery VMI",
International Journal of Retail & Distribution Management, Vol. 28, No 2
Småros, J., Holmström, J. and Kämäräinen, V. (2000) "New service opportunities in
the e-grocery business", International Journal of Logistics Management, Vol. 11, No. 1

128
SOK (2001), http://www.s-kanava.fi/s-box, July 2001
Solomon, M. (1987), "Algorithms for the Vehicle Routing and Scheduling Problems
with Time Window Constraints", Operations Research, March-April 1987, Vol. 35
No. 2, pp. 254-262.
Solomon, M. and Desrosiers, J. (1988), "Time window constrained Routing and
scheduling problems", Transportation Science, Vol. 22, pp.1-13.
Solomon, M. M., Baker, E.K. and Schaffer, J.R. (1988), "Vehicle routing and
scheduling problems with time window constraints: efficient implementations of
solution improvement procedures", In: Vehicle Routing: Methods and Studies, 85-106,
Ed. Golden, B.L. & Assad, A.A., Elsevier Science Publishers, Amsterdam.
Spåre, H. and Pulkkinen, M. (1997), "Perceived access to grocery stores -
Päivittäistavaroiden kauppapalvelujen koettu saavutettavuus" (in Finnish),
Liiketaloustieteellinen tutkimuslaitos LTT, Series B 139, Helsinki, p.92
Statistics Finland (1996), "Finland in statistics on CD -1996" (in Finnish),
http://tilastokeskus.fi/index_en.html, Statistics Finland, Helsinki.
Statistics Finland (2001), Finland in statistics: population projection, 21.2.2001,
http://www.tilastokeskus.fi/tk/tp/tasku/taskus_vaesto.html#väestöennuste
Tacken, M. (1990), "Effects of teleshopping on the use of time and space",
Transport Research Record 1285, pp. 89-91.
Taniguchi, E. and Van Der Heijden, R. (2000), "An evaluation methodology for city
logistics", Transport Reviews, Vol. 20 No. 1, pp.65-90.
Tanskanen, K., Yrjölä, H., and Holmström, J. (2002), " The way to profitable internet
grocery retailing - 6 lessons learned ", International Journal of Retail & Distribution
Management, Vol. 30, No.4 , pp. 169-178.
129
Tesco (2001), http://www.tesco.com, July 2001
The Times (2000), "The e-milkman cometh", THE TIMES Weekend Shopping,
September 2, 2000
Tuunainen, V.K. (1999), "Different models of Electronic Commerce -Integration of
value chains and business processes", Doctoral Thesis, Helsinki School of
Economics and Business Administration, HSE, A-153, Helsinki, p. 205.
Van der Laan, J.W. (2000), "The future of online food retailing", Retail Economics,
March 2000, http://www.retaileconomics.com/aboutpub1.htm
Van Gelder, Marc (2002a), “Winning with “clicks and bricks”, presentation at the
annual conference of Council of Logistics Management (CLM), Oct. 1, 2002
Van Gelder, Marc (2002b), personal communication with Mr. Van Gelder, President
and CEO of Peapod, October 1, 2002
VTT (2002), http://www.vtt.fi/rte/projects/yki6/liisae/miledate.htm (6.2.2002)
Webvan (2001), "Webvan to implement a 60-minute Delivery Window in all 10
markets", Webvan Press release on 4th of December 2000,
http://www000208.webvan.com
Ykköshalli (2003), http://www.yhalli.fi (in Finnish) accessed 13th January 2003
Yli-Kovero, K. (2002), "When store changed to hypermarket- Kun kauppa vaihtui
jättihalliksi" (in Finnish) newspaper article in Helsingin Sanomat, 13.10.2002, p.
E3
Yrjölä, H. and Tanskanen, K. (1999), "An evolutionary approach for developing
physical distribution in Electronic Grocery Shopping Logistics", Logistics Research
Network Conference Proceedings, UK.
130
Yrjölä, H., Lehtonen, J-M. and Kämäräinen, V. (2000), "An Agenda for Electronic
Grocery Shopping Supply Chain Research", IGLS 2000 Conference Proceedings,
Austria.
Yrjölä, H. (2001), "Physical distribution considerations for Electronic Grocery
Shopping", International Journal of Physical Distribution and Logistics Management, Vol.
31, No. 10, pp. 746-761.
Yrjölä, H. (2003), "Supply Chain Considerations for Electronic Grocery Shopping",
Dissertation series No.3, Helsinki University of Technology, Industrial
Management and Work and Organisational Psychology, Helsinki.
(http://lib.hut.fi/Diss/2003/isbn9512263238/isbn9512263238.pdf)
YTV (2001), http://www.ytv.fi/liikenne/julk/tsli.html
131
Appendix I
During 1999-2002 the following 10 company partners have been involved in theECOMLOG research programme:
• DNA Finland, the third biggest mobile operator in Finland,• Fazer Confectionery, the biggest chocolate and sugar confectionery producer
in Finland,• Nokia, the world’s leading mobile phone and network manufacturer,• Norpe Ltd, a manufacturer of refrigerating equipment (a subsidiary of
Hollming Ltd),• Panimoliito, the Finnish brewery union,• S-Group, the second biggest grocery retailer in Finland,• Sonera, the biggest mobile operator in Finland,• Trading House Hansel, an operator for public sector procurement and
materials management in Finland,• Unilever, an international grocery supplier, and• Valio, the biggest dairy products manufacturer in Finland.

132
Appendix II
I Current state analysis (Yrjölä assisted by Kämäräinen)
The goal of the first phase is the identification of the essential supply chain issuesinvolved in the emerging e-grocery business.
0. What are the essential issues in supply chain operations for the e-grocery business?
0.1 What are the market prospects and trends in grocery retailing?0.1.1 What are the market prospects for grocery retailing and electronic grocery
shopping internationally?0.1.2 What are the market prospects for grocery retailing and electronic grocery
shopping in Finland?0.1.2.1 What consumer groups have the biggest needs for home delivery service?0.1.2.2 How does the current laws regulating retailing affect electronic grocery
shopping in Finland?
0.2 What is the different supply chain structures and transport volumes for majorproduct groups in Finnish grocery retailing? (Breweries, Dairies, Meat industry)
0.3 What different solutions exist in early EGS operations?0.3.1 Solutions for goods reception for the customer?0.3.2 Solutions for order assembly?0.3.3 What are the different combinations of solutions?
0.4 What is the cost structure of early EGS operators?0.4.1 What is the cost structure for order assembly in a supermarket?0.4.2 What is the cost structure for order assembly in a local distribution centre?0.4.3 What is the cost structure for home delivery?
II Constructive phase
The results from phase I indicated that to gain insight into the operation andpotential effectiveness of EGS detailed constructive research on the following issueswas necessary:
1. What is the effective supply chain for electronic grocery shopping?1.1 What is the impact of alternative goods reception modes (attended, reception
box, delivery box, shared reception box) on home delivery effectiveness?1.1.1 What is the impact of alternative goods reception modes on home delivery
cost-effectiveness?1.1.1.1 What is the impact of attended goods reception vs. reception box on home
delivery cost? (Punakivi and Yrjölä)1.1.1.2 What is the impact of other unattended goods reception modes on
operational costs of home delivery? (Punakivi)1.1.1.3 What is the impact of the alternative unattended goods reception modes on
required investments? (Punakivi)
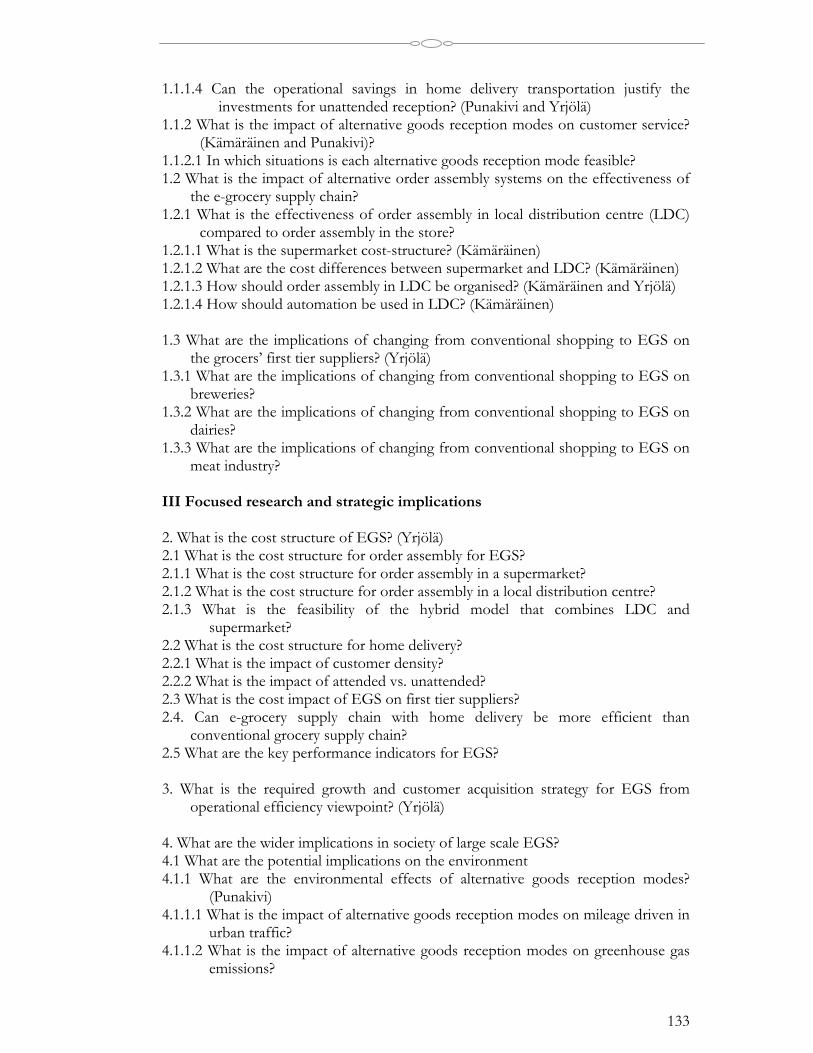
133
1.1.1.4 Can the operational savings in home delivery transportation justify theinvestments for unattended reception? (Punakivi and Yrjölä)
1.1.2 What is the impact of alternative goods reception modes on customer service?(Kämäräinen and Punakivi)?
1.1.2.1 In which situations is each alternative goods reception mode feasible?1.2 What is the impact of alternative order assembly systems on the effectiveness of
the e-grocery supply chain?1.2.1 What is the effectiveness of order assembly in local distribution centre (LDC)
compared to order assembly in the store?1.2.1.1 What is the supermarket cost-structure? (Kämäräinen)1.2.1.2 What are the cost differences between supermarket and LDC? (Kämäräinen)1.2.1.3 How should order assembly in LDC be organised? (Kämäräinen and Yrjölä)1.2.1.4 How should automation be used in LDC? (Kämäräinen)
1.3 What are the implications of changing from conventional shopping to EGS onthe grocers’ first tier suppliers? (Yrjölä)
1.3.1 What are the implications of changing from conventional shopping to EGS onbreweries?
1.3.2 What are the implications of changing from conventional shopping to EGS ondairies?
1.3.3 What are the implications of changing from conventional shopping to EGS onmeat industry?
III Focused research and strategic implications
2. What is the cost structure of EGS? (Yrjölä)2.1 What is the cost structure for order assembly for EGS?2.1.1 What is the cost structure for order assembly in a supermarket?2.1.2 What is the cost structure for order assembly in a local distribution centre?2.1.3 What is the feasibility of the hybrid model that combines LDC and
supermarket?2.2 What is the cost structure for home delivery?2.2.1 What is the impact of customer density?2.2.2 What is the impact of attended vs. unattended?2.3 What is the cost impact of EGS on first tier suppliers?2.4. Can e-grocery supply chain with home delivery be more efficient than
conventional grocery supply chain?2.5 What are the key performance indicators for EGS?
3. What is the required growth and customer acquisition strategy for EGS fromoperational efficiency viewpoint? (Yrjölä)
4. What are the wider implications in society of large scale EGS?4.1 What are the potential implications on the environment4.1.1 What are the environmental effects of alternative goods reception modes?
(Punakivi)4.1.1.1 What is the impact of alternative goods reception modes on mileage driven in
urban traffic?4.1.1.2 What is the impact of alternative goods reception modes on greenhouse gas
emissions?

134
4.1.2 What is the impact on packaging and recycling? (Yrjölä)4.2 What are the potential implications on employment? (Yrjölä)4.3.What are the potential implications on legislation? (Yrjölä)
5. What is the market potential for supplying unattended reception solutions?(Kämäräinen and Punakivi)
5.1 What are possible revenue models for unattended reception? (Kämäräinen)5.2 What are the most potential revenue models for a box supplier? (Kämäräinen)5.3 How do consumers experience unattended reception? (Kämäräinen)5.4 How do potential B2B customers experience unattended reception? (Kämäräinen
and Punakivi)
6. How best implement EGS using reception boxes (Kämäräinen)6.1 What kinds of service models are needed?6.2 What are customer experiences and needs for the ordering interface?6.3 What are customer experiences of using the reception boxes?6.4 How reception box service should be priced? (Kämäräinen and Punakivi)
7. What is the basic requirements for the reception box? (Kämäräinen, Punakivi andYrjölä)
7.1 Temperature requirements and size requirement based on shopping basketanalysis? (Punakivi)
7.2 What are the possible other requirements?
8. How can grocery manufacturer’s role be changed due to the EGS? (Kämäräinen)8.1 What are alternatives for the grocery manufacturer?8.1 What kind of marketing solutions can be adapted?8.3 How grocery manufacturer can take a more active role in the grocery business?
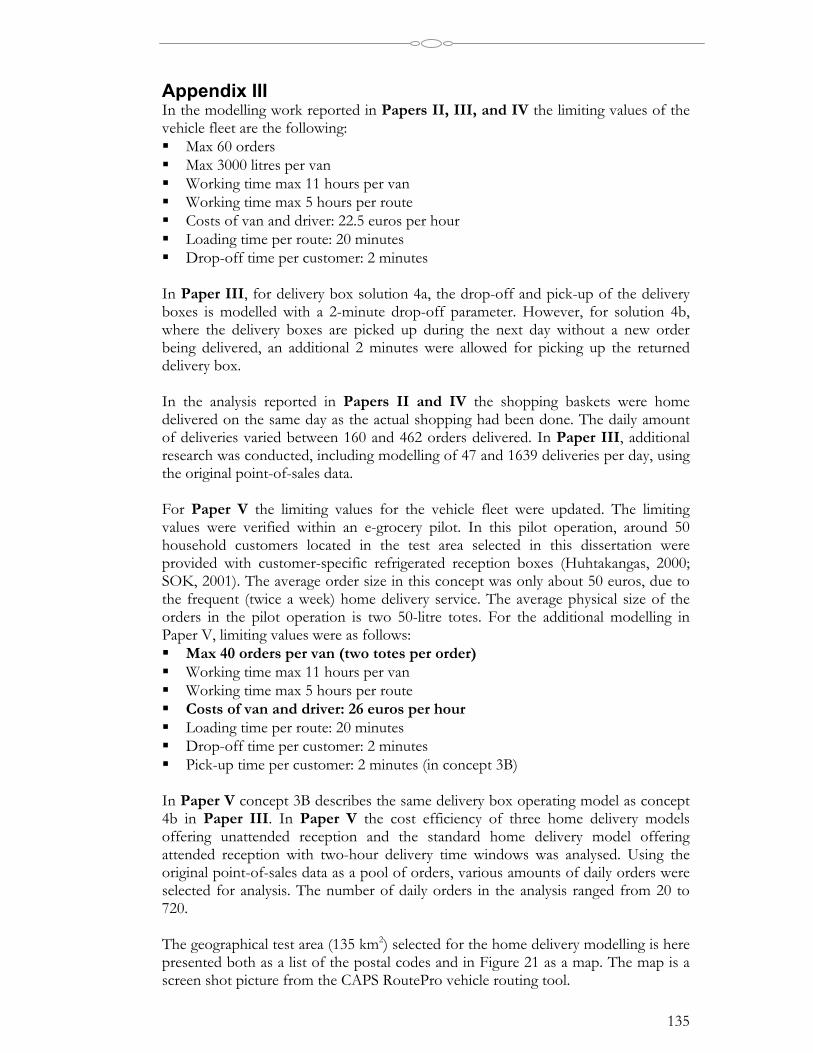
135
Appendix IIIIn the modelling work reported in Papers II, III, and IV the limiting values of thevehicle fleet are the following: Max 60 orders Max 3000 litres per van Working time max 11 hours per van Working time max 5 hours per route Costs of van and driver: 22.5 euros per hour Loading time per route: 20 minutes Drop-off time per customer: 2 minutes
In Paper III, for delivery box solution 4a, the drop-off and pick-up of the deliveryboxes is modelled with a 2-minute drop-off parameter. However, for solution 4b,where the delivery boxes are picked up during the next day without a new orderbeing delivered, an additional 2 minutes were allowed for picking up the returneddelivery box.
In the analysis reported in Papers II and IV the shopping baskets were homedelivered on the same day as the actual shopping had been done. The daily amountof deliveries varied between 160 and 462 orders delivered. In Paper III, additionalresearch was conducted, including modelling of 47 and 1639 deliveries per day, usingthe original point-of-sales data.
For Paper V the limiting values for the vehicle fleet were updated. The limitingvalues were verified within an e-grocery pilot. In this pilot operation, around 50household customers located in the test area selected in this dissertation wereprovided with customer-specific refrigerated reception boxes (Huhtakangas, 2000;SOK, 2001). The average order size in this concept was only about 50 euros, due tothe frequent (twice a week) home delivery service. The average physical size of theorders in the pilot operation is two 50-litre totes. For the additional modelling inPaper V, limiting values were as follows: Max 40 orders per van (two totes per order) Working time max 11 hours per van Working time max 5 hours per route Costs of van and driver: 26 euros per hour Loading time per route: 20 minutes Drop-off time per customer: 2 minutes Pick-up time per customer: 2 minutes (in concept 3B)
In Paper V concept 3B describes the same delivery box operating model as concept4b in Paper III. In Paper V the cost efficiency of three home delivery modelsoffering unattended reception and the standard home delivery model offeringattended reception with two-hour delivery time windows was analysed. Using theoriginal point-of-sales data as a pool of orders, various amounts of daily orders wereselected for analysis. The number of daily orders in the analysis ranged from 20 to720.
The geographical test area (135 km2) selected for the home delivery modelling is herepresented both as a list of the postal codes and in Figure 21 as a map. The map is ascreen shot picture from the CAPS RoutePro vehicle routing tool.

136
ESPOO
02110
02120
02160
02180
02240
02610
02680
02720
02730
02100
02130
02140
02150
02170
02200
02210
02230
02270
02600
02620
02630
02660
02710
02940
KAUNIAINEN
02700 02750
VANTAA
01630
01640
01660
01600
01610
01620
01650
01710
HELSINKI
00390 00410 00420
Figure 21 Map of the selected test area.
137
The general default speed for the distribution vans in the test area was set to 35km/h. Additionally, in the model the following specific road type-based defaultspeeds were used:
Highways: 45 km/hState roads: 35 km/hArterial roads: 27 km/hCollectors: 22 km/hResidential roads:15 km/h
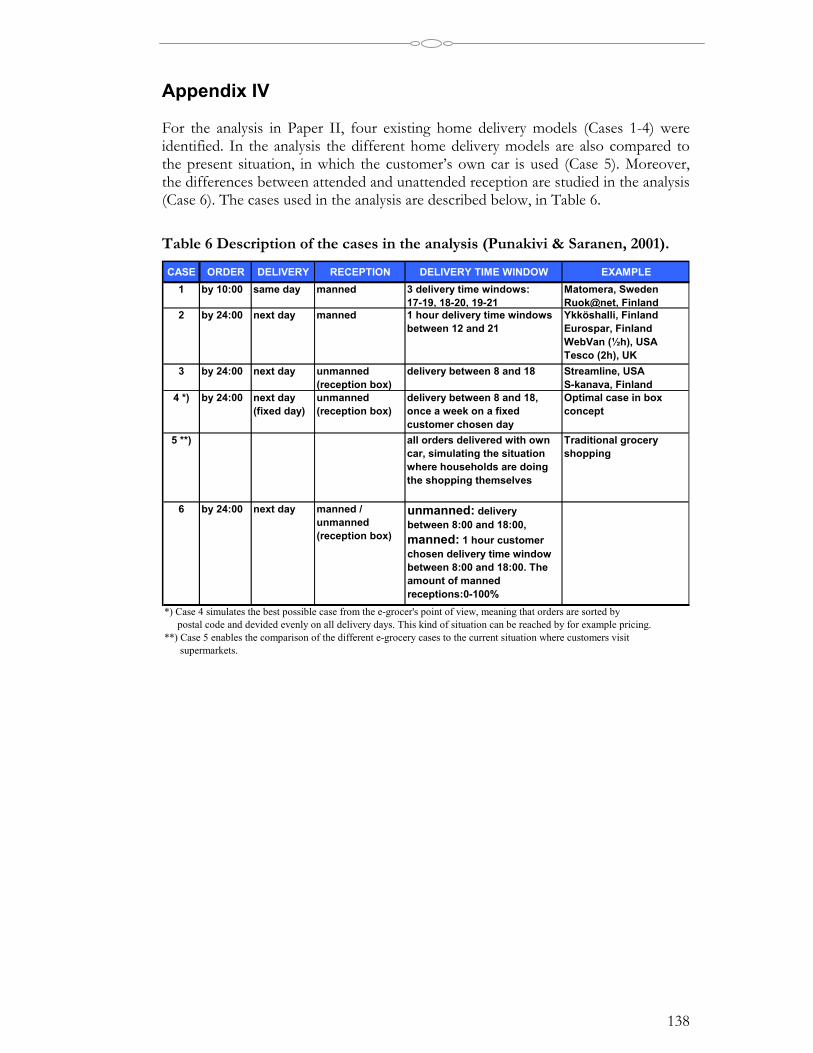
138
Appendix IV
For the analysis in Paper II, four existing home delivery models (Cases 1-4) wereidentified. In the analysis the different home delivery models are also compared tothe present situation, in which the customer’s own car is used (Case 5). Moreover,the differences between attended and unattended reception are studied in the analysis(Case 6). The cases used in the analysis are described below, in Table 6.
Table 6 Description of the cases in the analysis (Punakivi & Saranen, 2001).
CASE ORDER DELIVERY RECEPTION DELIVERY TIME WINDOW EXAMPLE1 by 10:00 same day manned 3 delivery time windows:
17-19, 18-20, 19-21Matomera, Sweden Ruok@net, Finland
2 by 24:00 next day manned 1 hour delivery time windows between 12 and 21
Ykköshalli, Finland Eurospar, Finland WebVan (½h), USA Tesco (2h), UK
3 by 24:00 next day unmanned (reception box)
delivery between 8 and 18 Streamline, USA S-kanava, Finland
4 *) by 24:00 next day (fixed day)
unmanned (reception box)
delivery between 8 and 18, once a week on a fixed customer chosen day
Optimal case in box concept
5 **) all orders delivered with own car, simulating the situation where households are doing the shopping themselves
Traditional grocery shopping
6 by 24:00 next day manned / unmanned (reception box)
unmanned: delivery between 8:00 and 18:00, manned: 1 hour customer chosen delivery time window between 8:00 and 18:00. The amount of manned receptions:0-100%
*) Case 4 simulates the best possible case from the e-grocer's point of view, meaning that orders are sorted by postal code and devided evenly on all delivery days. This kind of situation can be reached by for example pricing.**) Case 5 enables the comparison of the different e-grocery cases to the current situation where customers visit supermarkets.
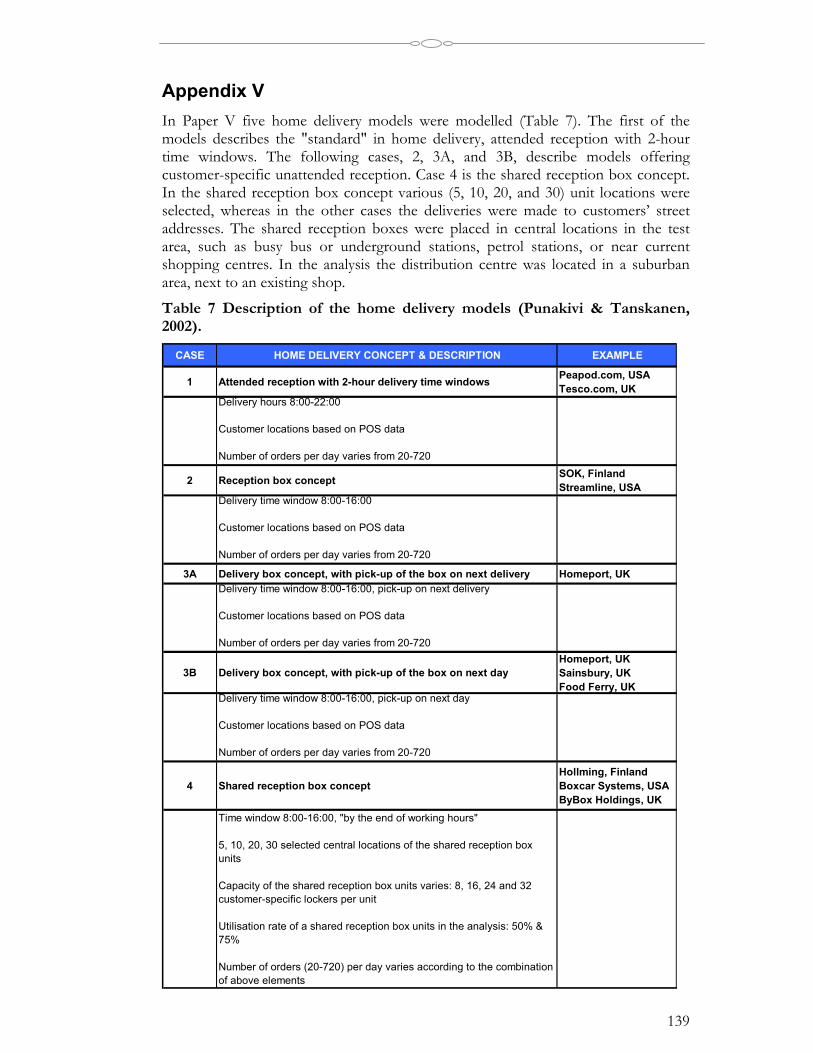
139
Appendix VIn Paper V five home delivery models were modelled (Table 7). The first of themodels describes the "standard" in home delivery, attended reception with 2-hourtime windows. The following cases, 2, 3A, and 3B, describe models offeringcustomer-specific unattended reception. Case 4 is the shared reception box concept.In the shared reception box concept various (5, 10, 20, and 30) unit locations wereselected, whereas in the other cases the deliveries were made to customers’ streetaddresses. The shared reception boxes were placed in central locations in the testarea, such as busy bus or underground stations, petrol stations, or near currentshopping centres. In the analysis the distribution centre was located in a suburbanarea, next to an existing shop.
Table 7 Description of the home delivery models (Punakivi & Tanskanen,2002).
CASE HOME DELIVERY CONCEPT & DESCRIPTION EXAMPLE
1 Attended reception with 2-hour delivery time windows Peapod.com, USA Tesco.com, UK
Delivery hours 8:00-22:00
Customer locations based on POS data
Number of orders per day varies from 20-720
2 Reception box concept SOK, Finland Streamline, USA
Delivery time window 8:00-16:00
Customer locations based on POS data
Number of orders per day varies from 20-720
3A Delivery box concept, with pick-up of the box on next delivery Homeport, UKDelivery time window 8:00-16:00, pick-up on next delivery
Customer locations based on POS data
Number of orders per day varies from 20-720
3B Delivery box concept, with pick-up of the box on next dayHomeport, UK Sainsbury, UK Food Ferry, UK
Delivery time window 8:00-16:00, pick-up on next day
Customer locations based on POS data
Number of orders per day varies from 20-720
4 Shared reception box conceptHollming, Finland Boxcar Systems, USA ByBox Holdings, UK
Time window 8:00-16:00, "by the end of working hours"
5, 10, 20, 30 selected central locations of the shared reception box units
Capacity of the shared reception box units varies: 8, 16, 24 and 32 customer-specific lockers per unit
Utilisation rate of a shared reception box units in the analysis: 50% & 75%
Number of orders (20-720) per day varies according to the combination of above elements
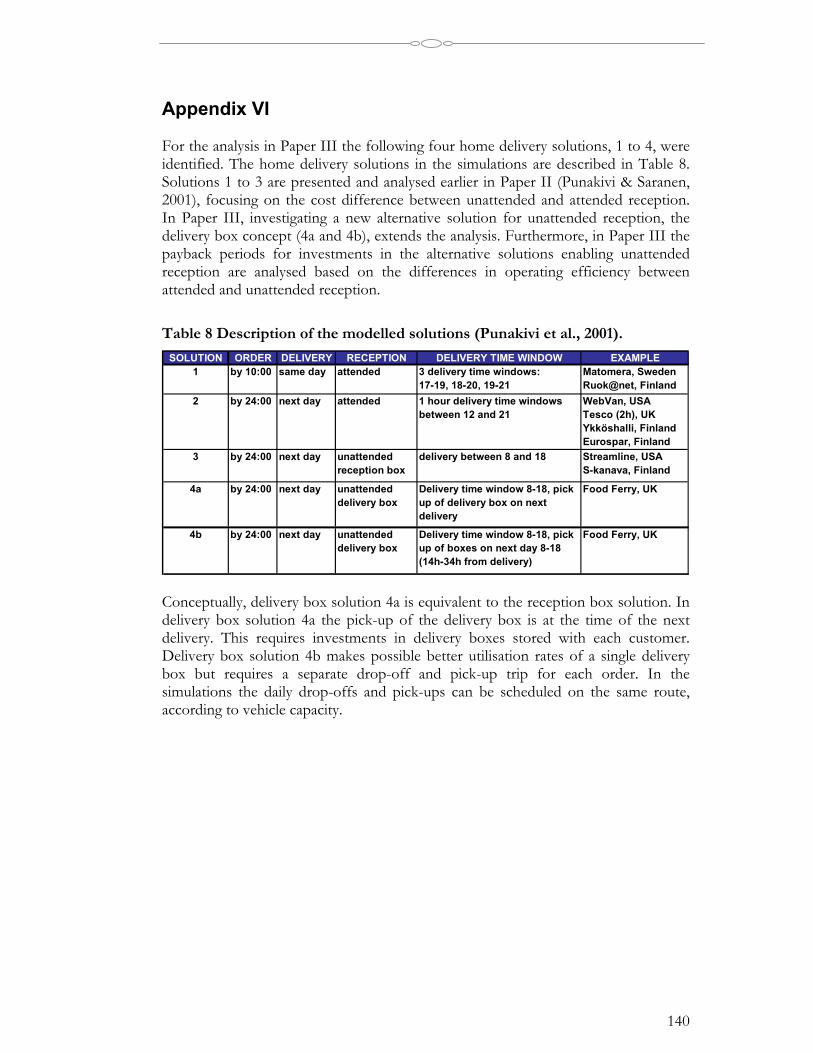
140
Appendix VI
For the analysis in Paper III the following four home delivery solutions, 1 to 4, wereidentified. The home delivery solutions in the simulations are described in Table 8.Solutions 1 to 3 are presented and analysed earlier in Paper II (Punakivi & Saranen,2001), focusing on the cost difference between unattended and attended reception.In Paper III, investigating a new alternative solution for unattended reception, thedelivery box concept (4a and 4b), extends the analysis. Furthermore, in Paper III thepayback periods for investments in the alternative solutions enabling unattendedreception are analysed based on the differences in operating efficiency betweenattended and unattended reception.
Table 8 Description of the modelled solutions (Punakivi et al., 2001).
SOLUTION ORDER DELIVERY RECEPTION DELIVERY TIME WINDOW EXAMPLE1 by 10:00 same day attended 3 delivery time windows:
17-19, 18-20, 19-21Matomera, Sweden Ruok@net, Finland
2 by 24:00 next day attended 1 hour delivery time windows between 12 and 21
WebVan, USA Tesco (2h), UK Ykköshalli, Finland Eurospar, Finland
3 by 24:00 next day unattended reception box
delivery between 8 and 18 Streamline, USA S-kanava, Finland
4a by 24:00 next day unattended delivery box
Delivery time window 8-18, pick up of delivery box on next delivery
Food Ferry, UK
4b by 24:00 next day unattended delivery box
Delivery time window 8-18, pick up of boxes on next day 8-18 (14h-34h from delivery)
Food Ferry, UK
Conceptually, delivery box solution 4a is equivalent to the reception box solution. Indelivery box solution 4a the pick-up of the delivery box is at the time of the nextdelivery. This requires investments in delivery boxes stored with each customer.Delivery box solution 4b makes possible better utilisation rates of a single deliverybox but requires a separate drop-off and pick-up trip for each order. In thesimulations the daily drop-offs and pick-ups can be scheduled on the same route,according to vehicle capacity.