comparative study of the prediction of … european conference on computational mechanics (eccm 6)...
TRANSCRIPT

6th European Conference on Computational Mechanics (ECCM 6)7th European Conference on Computational Fluid Dynamics (ECFD 7)
1115 June 2018, Glasgow, UK
COMPARATIVE STUDY OF THE PREDICTION OF HIGHANGLE OF ATTACK PHENOMENA USINGTRANSITIONAL TURBULENCE MODELS
JOLAN WAUTERS1, JORIS DEGROOTE1,2 AND JAN VIERENDEELS1,2
1 Department of Flow, Heat and Combustion Mechanics, Ghent UniversitySint-Pietersnieuwstraat 41, 9000, Ghent, Belgium
email: jolan.wauters, joris.degroote, [email protected]
2 EEDT, Flanders Make
Key words: low Reynolds flow, stall cell, transitional turbulence models, laminar sepa-ration bubble, high amplitude low frequency oscillation
Abstract. In this paper transitional turbulence modeling is approached from the pointof view relevant to small unmanned aerial vehicles (span ≈ 1m), of which the flow ischaracterized by very low values of turbulent intensity and transition is predominantly ofthe separation induced kind. Four different turbulence models for low Reynolds numberflow will be used to predict the flow over a NACA 0018 profile in 3D for different geometricsettings: infinite wing, finite wing clamped on one side and finite wing clamped on bothsides. The latter two mimicking wind tunnel experiments. The turbulence models underconsideration are Menter’s k − ω SST model with Wilcox’s low-Re modification, Menter& Langtry’s γ − Reθ model, it’s simplified γ model and Walters & Cokljat’s k − kl − ωmodel. The NACA 0018 profile is placed in a flow with chord-based Reynolds number of3×105 at an angle of attack (AoA) of 17o, allowing an assessment of the prediction of highangle of attack related phenomena, such as stall cells and high amplitude low frequencyoscillations by means of URANS simulations.
1 INTRODUCTION
The applicability of unmanned aerial vehicles (UAVs) for military, humanitarian, com-mercial and recreational purposes has led to a large body of research in UAV-related fields.A deep understanding and correct modeling of the aerodynamic behavior is fundamentalwith the objective of further extending the capabilities of these UAVs. Here we focus onthose that operate at a chord-based Reynolds numbers (Rec) below 5×10⁵, the conditionwhich is referred to as low Reynolds number flow [1].
A characteristic of UAVs operating at low Reynolds numbers is the appearance of aseparation bubble on the wing, also attributed to the low turbulence intensity of theexternal flow. It is fundamental in the analysis, design and optimization of the flight

Jolan Wauters, Joris Degroote, Jan Vierendeels
behavior of UAVs to correctly model this phenomenon. This paper focuses on Reynolds-Averaged Navier-Stokes (RANS) simulations, which have obtained a more prominent rolethrough their ability to be used in increasingly complex 3D geometries with a relativelylow computational cost. Classic turbulence models, which serve to close the system ofRANS equations, assume a fully turbulent flow. This makes their use in low Reynoldsapplication somewhat ambiguous. The last couple of decades have however seen the birthof a number of turbulence models that attempt to model the transition phenomena.
Based on the manner by which transition is predicted, transitional turbulence modelscan be categorized as low Reynolds models, which make use of damping functions, corre-lation based models, which typically relate the production of intermittency to correlationsdepending on flow parameters, and physics-based models, which attempt to model theflow based on a more theoretical framework. Of the three categories, representatives areselected that are compared with each other to assess their abilities. Menter’s k−ω ShearStress Transport (SST) model [2] with Wilcox’s low Reynolds modification [3] (henceforthreferred to as the low-Re model) is taken as representative of the low Reynolds models.Menter and Langtry’s γ − Reθ model [4, 5] and Menter and Langtry’s γ model [6] aretaken as representatives of the correlation models. Walter & Cockljat’s k − kl − ω model[7] is taken as representative of the physics-based models.
Typically, the characteristics of an airfoil using RANS are assessed in 2D. This simpli-fication can be justified for fully turbulent attached flows where the flow component inthe third dimension is predominantly caused by turbulence and thus modelled. However,in the case of separation-induced transition, the third dimension becomes much moresignificant since the separation-induced transition process is characterized by the three-dimensional deformation of Kelvin Helmholtz billows and the vortex shedding from thebubble. The three-dimensionality of the flow is even more dominantly present at highangles of attack (AoAs), where experimental measurements have shown the appearanceof stall cells (SCs) and/or high-amplitude low-frequency oscillations (HALFOs).
Stall cells (Figure 1) is the term in literature attributed to the experimentally [8, 9, 10,11, 12, 13, 14, 15] and numerically [10, 15, 16] observed coherent structures characterizedby a strong three dimensional nature of the wake near stall. They appear in the shapeof counter-rotating swirl patterns, sometimes also poetically addressed as owl faces ormushroom cells, through the use of oil flow and tuft measurements. These structuresappear in pairs and typically extend spanwise twice the length of the chord. When thespan increases beyond AR=2, the cells get stretched before splitting and forming a newpair. The presence of stall cells results in an increased CL compared to a fully 2D flowand translates itself in a reduced decrease of CL for an AoA above the one correspondingto CL,max, limited to a small region of ≈ 3o.
On the other hand, a number of studies [8, 17] observed a more violent fluctuatingbehavior of CL in the corresponding AoA-region, attributed to shear-layer flapping [18].They found that in the presence of a separation bubble, in time-averaged sense, the flowis two-dimensional and the stall cells are absent altogether. The flow is further morecharacterized by high-amplitude low-frequency oscillations and referred to as such.
2

Jolan Wauters, Joris Degroote, Jan Vierendeels
LE
TE
Figure 1: Schematic representation of the skin friction lines on the suction side of asection of a wing (AR = 4) confined by two symmetry planes (dotted lines) at an angleof attack just past the stall angle. The two stall cells are visible in the shape of counter
rotating swirl patterns: two foci (blue dots) connected by a global separation lineemerging from the saddle point (red dot).
The four turbulence models under consideration are compared for their ability to pre-dict high AoA related phenomena in a low Reynolds flow in three different configurations:an infinite wing, a finite wing clamped on one side and a finite wing clamped on bothsides through a series of URANS simulations.
2 METHODOLOGY
The URANS simulations are performed in such a way that they mimic the experimentalmeasurements of a NACA 0018 profile performed by Timmer [19] for Rec = 3× 10⁵. Themeasurements were executed in the Delft University Wind Tunnel using a 0.25 m chordmodel at velocities ranging between 10 m/s and 70 m/s with respectively correspondingturbulence intensity (Tu) values of 0.02% and 0.07%. This results in Tu = 0.04% forRec = 3 × 10⁵. The NACA 0018, being a thick profile, would likely be characterized bythe appearance of both SCs as HALFOs in the AoA past stall [8].
From experimental studies and the use of Tu-dependent trigger functions in the tran-sition models, it can be noted that Tu is a dominant parameter. RANS modeling hasbeen characterized by a decay of Tu especially for external flows, predominantly found inaeronautical applications. This decay of Tu is caused by the fact that only the destruc-tion terms in the k and ω transport equations are active between inlet and leading edge.Spalart & Rumsey [20] recognized the relevance of turbulent decay and the difficulty indefining a reasonable combination of Tuinlet and µt/µ that would yield acceptable results.They proposed for aeronautical applications the following relation: µt/µ ≈ 2×10⁻⁷×Rec,which yields for Rec = 3×10⁵ the following: µt/µ = 0.06. This results in Tuinlet ≈ 0.23%in order to predict the value of Tu at the inlet of the computational domain that one mayobtain a Tu = 0.04% at the leading edge.
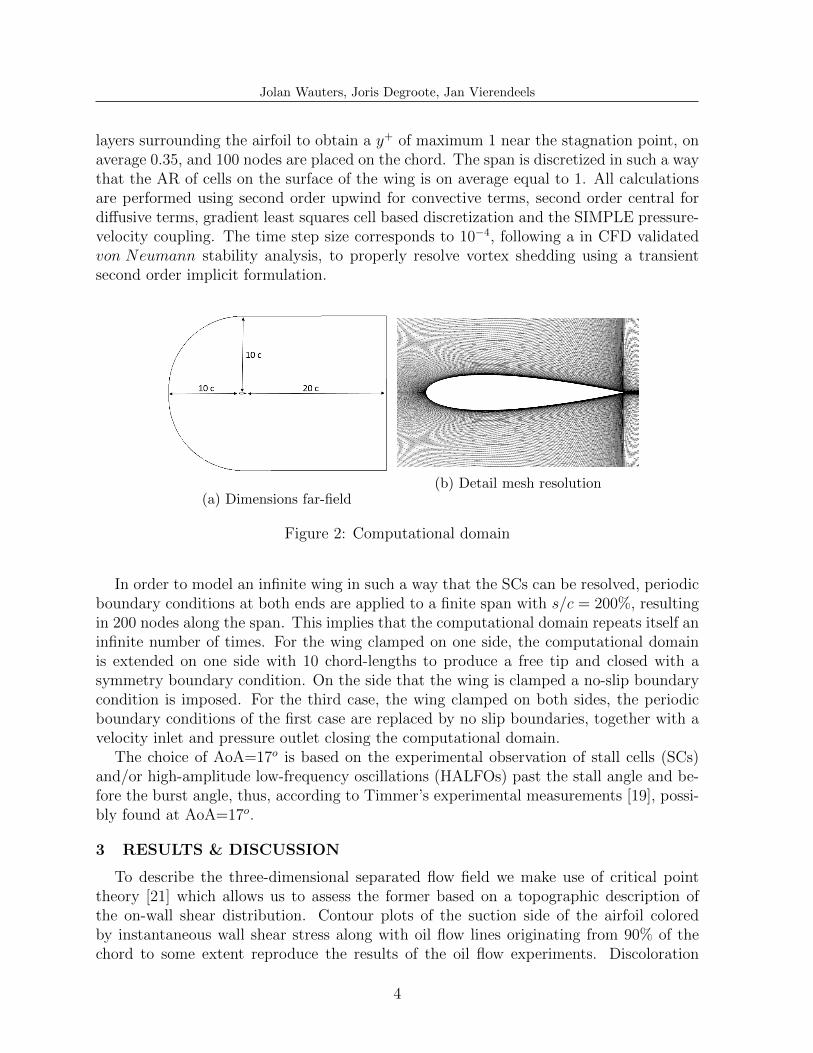
The computational domain surrounding the airfoil is c-shaped: extending 10 chordlengths in front, above and below the airfoil and 20 chord lengths behind it as presented inFigure 2a. Chordal grid discretization, spanwize grid discretization, wall normal expansionratio, first cell size and time step size were subjected to an independence study. The resultscorrespond to the strict requirements for the mesh as put forward by Langtry and Menter[4, 5, 6]: a maximum wall normal expansion ratio of 1.1 should be imposed on minimal 100
3
Jolan Wauters, Joris Degroote, Jan Vierendeels
layers surrounding the airfoil to obtain a y+ of maximum 1 near the stagnation point, onaverage 0.35, and 100 nodes are placed on the chord. The span is discretized in such a waythat the AR of cells on the surface of the wing is on average equal to 1. All calculationsare performed using second order upwind for convective terms, second order central fordiffusive terms, gradient least squares cell based discretization and the SIMPLE pressure-velocity coupling. The time step size corresponds to 10−4, following a in CFD validatedvon Neumann stability analysis, to properly resolve vortex shedding using a transientsecond order implicit formulation.
(a) Dimensions far-field(b) Detail mesh resolution
Figure 2: Computational domain
In order to model an infinite wing in such a way that the SCs can be resolved, periodicboundary conditions at both ends are applied to a finite span with s/c = 200%, resultingin 200 nodes along the span. This implies that the computational domain repeats itself aninfinite number of times. For the wing clamped on one side, the computational domainis extended on one side with 10 chord-lengths to produce a free tip and closed with asymmetry boundary condition. On the side that the wing is clamped a no-slip boundarycondition is imposed. For the third case, the wing clamped on both sides, the periodicboundary conditions of the first case are replaced by no slip boundaries, together with avelocity inlet and pressure outlet closing the computational domain.
The choice of AoA=17o is based on the experimental observation of stall cells (SCs)and/or high-amplitude low-frequency oscillations (HALFOs) past the stall angle and be-fore the burst angle, thus, according to Timmer’s experimental measurements [19], possi-bly found at AoA=17o.
3 RESULTS & DISCUSSION
To describe the three-dimensional separated flow field we make use of critical pointtheory [21] which allows us to assess the former based on a topographic description ofthe on-wall shear distribution. Contour plots of the suction side of the airfoil coloredby instantaneous wall shear stress along with oil flow lines originating from 90% of thechord to some extent reproduce the results of the oil flow experiments. Discoloration
4

Jolan Wauters, Joris Degroote, Jan Vierendeels
indicates the presence of vortex cores and movement of the oil flow towards the leadingedge indicates the presence of flow separation.
3.1 Infinite Wing
The choice to examine an infinite wing comes forth from the statement by Weihs &Katz [12], who postulated that since a multitude of cells form when the AR is increased,the presence of tips or end-plates does not influence the formation of cells and that it ispurely a product of the Crow instability: an interaction between two line vortices, hereone originating from the leading edge and one from the trailing edge.
The low-Re model produces a spanwise uniform flow (Figure 3a), while the γ modelclearly displays spanwise waviness of its separation front, unaffected by the vortex shed-ding from the separation bubble further upstream (note the discoloration spot near theleading edge of Figure 4a indicating the presence of vortex shedding of the separationbubble and the fairly continues separation front). The waviness corresponds to the initialphase of the crow instability, however there is no break up or formation of cells. Sar-lak et al. [16] performed a URANS simulation on an infinite wing with S826 airfoil andobserved a similar waviness in the separation front using the k − ω SST model. Theγ − Reθ model on the other hand is a prime example of violent vortex shedding fromthe separation bubble, breaking up the separation front, which results in a low frequencyfluctuating flow (Figure 5a) with St = O(10−2), roughly equal to experimental observa-tions. As illustrated by Broeren & Bragg [8], the time average of the violent sheddingflow is two-dimensional. This implies that if the spanwise size (s/c) is big enough to fullyresolve the breakdown of the vortices, a further increase of the span should yield to thesame averaged result. The opposite holds for stall cells, which will merge or split if s/cis changed. This results in a changing CL caused by a jet effect between the cells. Thefluctuations caused by the HALFOs increase with increasing AoA up to the point thatthe entire airfoil separates and behaves as a bluff body with St = O(10−1). The k−kl−ωmodel predicts an attached flow along with a violent vortex shedding from the laminarseparation bubble (Figure 6a).
3.2 One Side Clamped Wing
One of the earliest studies on SCs were performed by Winkelmann [13] and Bippes [9]on a wing clamped on one side. The appearance of a free tip results in the formation of atip vortex. For small ARs this leads to a reduced suction peak and consequently a delayedstall angle. On the side of the wall a horseshoe vortex appears caused by the interactionof the wall boundary layer and wing boundary layer.
The low-Re model produces a separation front that disappears near the tip and curls upnear the end-plate (Figure 3b), producing as it were half of a stall cell. As opposed to theinfinite wing, the separation front has progressed far less towards the leading edge, conformthe statement above, yet again steady in time. The discoloration near the tip illustratesthe presence of the tip vortex. The γ model produces a similar trend (Figure 4b), howeverthe wavefront has extend further. The γ − Reθ model again shows a distorted wavefront
5

Jolan Wauters, Joris Degroote, Jan Vierendeels
caused by vortices shed from the laminar separation bubble (Figure 5b). Anew we see forthe k − kl − ω model a vortex shedding from the separation bubble, but no separationoriginating from the trailing edge (Figure 6b).
3.3 Two Side Clamped Wing
A wing clamped on both sides, as typically encountered in wind tunnel experiments,is here fully resolved instead of imposing a symmetry condition on half the model as forexample done by Zarutskaya & Arieli [15] and Manolesos et al. [10]. While justifiable incase of steady simulations, as performed by the aforementioned, unsteady measurementshave shown the unsteady tendency of stall cells [14].
The low-Re model produces a clear stall cell, noticeable from the distinctive oil flowlines on the suction side (Figure 3c). The γ model shows a similar coherent structure, butasymmetric in nature: with a very low frequency St = O(10−3) the eyes of the structurealternately growing and shrinking in nature (Figure 4c). The latter justifies the choiceto resolve the entire span and not work with a symmetry condition as mentioned above,even though the time averaged flow field corresponds to the symmetric one. This resultsin large fluctuations in CL: ∆CL ≈ 0.5. Yon & Katz [14] found the appearance of bothHALFOs as SCs, but found no correlation between them. They did however note that theSCs move in time, a phenomenon to which they referred as ‘jostling’. The γ−Reθ modelsees the appearance of the former superposed on the appearance of HALFOs discusses inSection 3.1 (Figure 5c). Ragni & Ferreira [11] experimentally measured the appearanceof SCs in the presence of a separation bubble, but found that the latter had no influenceon the formation of the former. The k − kl − ω model again predicts a strongly attachedflow subjected to a violent vortex shedding from the separation bubble (Figure 6c).
4 CONCLUSION
Four transitional turbulence models, Menter’s k − ω SST model with Wilcox’s low-Remodification, Menter & Langtry’s (k−ω SST) γ−Reθ model, it’s simplified (k−ω SST)γ model and Walters & Cokljat’s k − kl − ω model, were compared for their ability topredict high AoA related coherent structures for three different geometric settings: aninfinite wing, to asses the presence of the Crow instability, a one side clamped wing and atwo side clamped wing to mimic the experimental oil flow measurements in a wind tunnel.
We found a different degree of separation for the different geometric settings for allfour models, caused by the end-plates and/or free tips. While not a new results [22, 17],we stress the importance of considering the geometric setting of the experiment whencomparing it 2D or 3D simulations.
Furthermore, it was found that the low-Re model predicts a steady flow in the threegeometric settings, with a clear formation of a SC in case of a two-side clamped wing.The γ model predicts the waviness which preludes the crow instability as predicted byWeihs & Katz [12] in case of an infinite wing, but showed no breaking of the separationfront. This might still occur at higher AoAs, but must be assessed in future research. Incase of a two-side clamped wing it shows ‘jostling’ as experimentally observed by Yon &
6

Jolan Wauters, Joris Degroote, Jan Vierendeels
Katz [14]. The γ − Reθ model shows a similar behavior as the γ model, but with theappearance of a violent vortex shedding of the separation bubble, leading to HALFOs.The k− kl−ω, while capable of predicting the vortex shedding of the separation bubble,fails to predict a separation front originating from the trailing edge.
ACKNOWLEDGEMENTS
Conducted as part of the EUFORIA (Efficient Uncertainty quantification For Opti-mization in Robust design of Industrial Applications) project under the financial supportof the IWT, the Flemish agency of Innovation through Science and Technology. Thiswork was carried out using the STEVIN Supercomputer Infrastructure at Ghent Univer-sity, funded by Ghent University, the Flemish Supercomputer Center (VSC), the HerculesFoundation and the Flemish Government department EWI.
REFERENCES
[1] Lissaman, P. B. S. “Low-Reynolds-Number Airfoils,” Annual Review of Fluid Me-chanics Vol. 15, No. 1, 1983, pp. 223-239.
[2] Menter, F. R. “Two-equation eddy-viscosity turbulence models for engineering ap-plications,” AIAA Journal Vol. 32, No. 8, 1994, pp. 1598-1605.
[3] Wilcox, D. A. “Simulation of Transition with a Two-Equation Turbulence Model,”AIAA Journal Vol. 32, No. 2, 1994, pp. 247-255.
[4] Menter, F. R., Langtry, R. B., Likki, S. R., Suzen, Y. B., Huang, P. G., and Volker,S. “A correlation-based transition model using local variables - Part I: Model for-mulation,” Journal of Turbomachinery-Transactions of the ASME Vol. 128, No. 3,2006, pp. 413-422.
[5] Langtry, R. B., Menter, F. R., Likki, S. R., Suzen, Y. B., Huang, P. G., and Volker,S. “A correlation-based transition model using local variables - Part II: Test casesand industrial applications,” Journal of Turbomachinery-Transactions of the ASMEVol. 128, No. 3, 2006, pp. 423-434.
[6] Menter, F. R., Smirnov, P. E., Liu, T., and Avancha, R. “A One-Equation LocalCorrelation-Based Transition Model,” Flow Turbulence and Combustion Vol. 95, No.4, 2015, pp. 583-619.
[7] Walters, D. K., and Cokljat, D. “A Three-Equation Eddy-Viscosity Model forReynolds-Averaged Navier-Stokes Simulations of Transitional Flow,” Journal of Flu-ids Engineering-Transactions of the ASME Vol. 130, No. 12, 2008, p. 14.
[8] Broeren, A. P., and Bragg, M. B. “Spanwise Variation in the Unsteady StallingFlowfields of Two-Dimensional Airfoil Models,” AIAA Journal Vol. 39, No. 9, 2001,pp. 1641-1651.
7

Jolan Wauters, Joris Degroote, Jan Vierendeels
LE
TE
(a) Infinite wingLE
TE
(b) Finite wing clamped on left sideLE
TE
(c) Finite wing clamped on both sides
(left, [Pa])
(right, [m/s])
Figure 3: Contour plot of the instantaneous wall shear stress on the suction side withthe leading edge at the top (LE) and the trailing edge at the bottom (TE) with oil flowpathlines originating from 90% of the chord (left) and contour plot of the instantaneous
velocity magnitude of a cross-section at half the span (right) at AoA=17o withs/c = 200% for the low-Re model.
8

Jolan Wauters, Joris Degroote, Jan Vierendeels
LE
TE
(a) Infinite wingLE
TE
(b) Finite wing clamped on left side
LE
TE
(c) Finite wing clamped on both sides
(left, [Pa])
(right, [m/s])
Figure 4: Contour plot of the instantaneous wall shear stress on the suction side withthe leading edge at the top (LE) and the trailing edge at the bottom (TE) with oil flowpathlines originating from 90% of the chord (left) and contour plot of the instantaneous
velocity magnitude of a cross-section at half the span (right) at AoA=17o withs/c = 200% for the γ model.
9

Jolan Wauters, Joris Degroote, Jan Vierendeels
LE
TE
(a) Infinite wingLE
TE
(b) Finite wing clamped on left sideLE
TE
(c) Finite wing clamped on both sides
(left, [Pa])
(right, [m/s])
Figure 5: Contour plot of the instantaneous wall shear stress on the suction side withthe leading edge at the top (LE) and the trailing edge at the bottom (TE) with oil flowpathlines originating from 90% of the chord (left) and contour plot of the instantaneous
velocity magnitude of a cross-section at half the span (right) at AoA=17o withs/c = 200% for the γ −Reθ model.
10

Jolan Wauters, Joris Degroote, Jan Vierendeels
LE
TE
(a) Infinite wingLE
TE
(b) Finite wing clamped on left sideLE
TE
(c) Finite wing clamped on both sides
(left, [Pa])
(right, [m/s])
Figure 6: Contour plot of the instantaneous wall shear stress on the suction side withthe leading edge at the top (LE) and the trailing edge at the bottom (TE) with oil flowpathlines originating from 90% of the chord (left) and contour plot of the instantaneous
velocity magnitude of a cross-section at half the span (right) at AoA=17o withs/c = 200% for the k − kl − ω model.
11

Jolan Wauters, Joris Degroote, Jan Vierendeels
[9] Bippes, H., and Turk, M. “Half Model Testing Applied to Wings above and belowStall,” Recent Contributions to Fluid Mechanics. Springer Berlin Heidelberg, Berlin,Heidelberg, 1982, pp. 22-30.
[10] Manolesos, M., Papadakis, G., and Voutsinas, S. “An Experimental and Numeri-cal Investigation on the Formation of Stall-Cells on Airfoils,” Journal of Physics:Conference Series Vol. 555, 2012, pp. 012068 1-9.
[11] Ragni, D., and Ferreira, C. “Effect of 3D stall-cells on the pressure distribution of alaminar NACA64-418 wing,” Experiments in Fluids Vol. 57, No. 8, 2016, p. 127.
[12] Weihs, D., and Katz, J. “Cellular patterns in poststall flow over unswept wings,”AIAA Journal Vol. 21, No. 12, 1983, pp. 1757-1759.
[13] Winkelmann, A., Barlow, J., Saini, J., Anderson, J. J., and Jones, E. “The effects ofleading edge modifications on the post-stall characteristics of wings,” 18th AerospaceSciences Meeting. American Institute of Aeronautics and Astronautics, 1980.
[14] Yon, S. A., and Katz, J. “Study of the Unsteady Flow Features on a Stalled Wing,”AIAA Journal Vol. 36, No. 3, 1998, pp. 305-312.
[15] Zarutskaya, T., and Arieli, R. “On Vortical Flow Structures at Wing Stall and Be-yond,” 35th AIAA Fluid Dynamics Conference and Exhibit. American Institute ofAeronautics and Astronautics, 2005.
[16] Sarlak, H., Nishino, T., and Sorensen, J. N. “URANS simulations of separated flowwith stall cells over an NREL S826 airfoil,” AIP Conference Proceedings Vol. 1738,No. 1, 2016, p. 030039-1−030039-4.
[17] Bragg, M. B., Heinrich, D. C., and Khodadoust, A. “Low-Frequency Flow Oscillationover Airfoils near Stall,” AIAA Journal Vol. 31, No. 7, 1993, pp. 1341-1343.
[18] Driver, D. M., Seegmiller, H. L., and Marvin, J. G. “Time-dependent behavior of areattaching shear layer,” AIAA Journal Vol. 25, No. 7, 1987, pp. 914-919.
[19] Timmer, W. A. “Two-Dimensional Low-Reynolds Number Wind Tunnel Results forAirfoil NACA 0018,” Wind Engineering Vol. 32, No. 6, 2008, pp. 525-537.
[20] Spalart, P. R., and Rumsey, C. L. “Effective Inflow Conditions for Turbulence Modelsin Aerodynamic Calculations,” AIAA Journal Vol. 45, No. 10, 2007, pp. 2544-2553.
[21] Delery, J. M. “Robert Legendre and Henri Werle: Toward the Elucidation of Three-Dimensional Separation,” Annual Review of Fluid Mechanics Vol. 33, No. 1, 2001,pp. 129-154.
[22] Pelletier, A., and Mueller, T. J. ”Effect of endplates on two-dimensional airfoil testingat low Reynolds number,” Journal of Aircraft Vol. 38, No. 6, 2001, pp. 1056-1059.
12