comparative study of mechanical and corrosion...
TRANSCRIPT

Technical Report Documentation Page 1. Report No.
FHWA/TX-11/0-4562-3
2. Government Accession No.
3. Recipient’s Catalog No.
4. Title and Subtitle
Comparative Study of Mechanical and Corrosion Resistance Properties of Bridge Post-Tensioning Strands
5. Report Date
August 15, 2011
6. Performing Organization Code 7. Author(s)
R. D. Kalina, S. Mac Lean, and J. E. Breen
8. Performing Organization Report No.
0-4562-3
9. Performing Organization Name and Address
Center for Transportation Research The University of Texas at Austin 1616 Guadalupe Street, Suite 4.202 Austin, TX 78701
10. Work Unit No. (TRAIS) 11. Contract or Grant No.
0-4562
12. Sponsoring Agency Name and Address
Texas Department of Transportation Research and Technology Implementation Office P.O. Box 5080 Austin, TX 78763-5080
13. Type of Report and Period Covered
Technical Report 09/03-07/11
14. Sponsoring Agency Code
15. Supplementary Notes Project performed in cooperation with the Texas Department of Transportation and the Federal Highway Administration.
16. Abstract
This report summarizes the exploration of new methods of protection for the strands used in post-tensioning of concrete bridges. Companion small-scale tests of strand or grout and strand were conducted. The tests included mechanical testing to determine modulus of elasticity, yield strength, and ultimate strength. In addition a number of passive corrosion exposure tests and accelerated active corrosion tests were run. These accelerated tests included both linear polarization resistance tests and potentiodynamic tests. Strand types investigated included conventional steel strand, hot dip galvanized strand, stainless steel strand, copper-clad strands, stainless-clad strands, and flow-filled epoxy-coated strand. The results indicated that the epoxy-coated strand dominated the others in corrosion resistance and met all mechanical property requirements. The stainless-clad and stainless steel strand were only slightly behind the epoxy-coated in corrosion resistance but need improvement in mechanical properties. The stainless-clad strand met the mechanical requirements for Grade 250 but not Grade 270.
17. Key Words
corrosion, post-tensioned concrete tendons, epoxy-coated strand, stainless steel strands, stainless-clad strands, hot dip galvanized strand, copper-clad strands, accelerated corrosion testing
18. Distribution Statement
No restrictions. This document is available to the public through the National Technical Information Service, Springfield, Virginia 22161; www.ntis.gov.
19. Security Classif. (of report) Unclassified
20. Security Classif. (of this page) Unclassified
21. No. of pages 74
22. Price
Form DOT F 1700.7 (8-72) Reproduction of completed page authorized


Comparative Study of Mechanical and Corrosion Resistance
Properties of Bridge Post-Tensioning Strands R. D. Kalina S. Mac Lean J. E. Breen CTR Technical Report: 0-4562-3 Report Date: August 15, 2011 Project: 0-4562 Project Title: Corrosion Resistance of Grouted Post-Tensioning Systems Sponsoring Agency: Texas Department of Transportation Performing Agency: Center for Transportation Research at The University of Texas at Austin Project performed in cooperation with the Texas Department of Transportation and the Federal Highway Administration.
iv
Center for Transportation Research The University of Texas at Austin 1616 Guadalupe Street, Suite 4.202 Austin, TX 78701 www.utexas.edu/research/ctr Copyright (c) 2011 Center for Transportation Research The University of Texas at Austin All rights reserved Printed in the United States of America

v
Disclaimers Author's Disclaimer: The contents of this report reflect the views of the authors, who
are responsible for the facts and the accuracy of the data presented herein. The contents do not necessarily reflect the official view or policies of the Federal Highway Administration or the Texas Department of Transportation (TxDOT). This report does not constitute a standard, specification, or regulation.
Patent Disclaimer: There was no invention or discovery conceived or first actually reduced to practice in the course of or under this contract, including any art, method, process, machine manufacture, design or composition of matter, or any new useful improvement thereof, or any variety of plant, which is or may be patentable under the patent laws of the United States of America or any foreign country.
Notice: The United States Government and the State of Texas do not endorse products or manufacturers. If trade or manufacturers' names appear herein, it is solely because they are considered essential to the object of this report.
Engineering Disclaimer NOT INTENDED FOR CONSTRUCTION, BIDDING, OR PERMIT PURPOSES.
Project Engineer: John E. Breen
Professional Engineer License State and Number: Texas 18479
P. E. Designation: Research Supervisor

vi
Acknowledgments We greatly appreciate the long-term financial support from the Texas Department of
Transportation and the Federal Highway Administration that made this project possible. We are grateful for the active support of the project director Brian Merrill (BRG) and of Dr. Paul Virmani (FHWA). Highly valuable advice was given by Dr. Harovel Wheat of The University of Texas at Austin.

vii
Table of Contents
Chapter 1. Introduction................................................................................................................ 1 1.1 Background ............................................................................................................................1 1.2 Research Objectives ...............................................................................................................1 1.3 Corrosion of Prestressing Materials .......................................................................................2
1.3.1 Corrosion of Metal ......................................................................................................... 2 1.3.2 Passivity ......................................................................................................................... 2 1.3.3 Types of Corrosion ........................................................................................................ 3
1.4 Durability of Post-Tensioned Systems ..................................................................................3 1.5 Materials ................................................................................................................................5
1.5.1 Strand Tests .................................................................................................................... 5 1.5.2 Conventional Strand ....................................................................................................... 5 1.5.3 Hot Dip Galvanized Strand ............................................................................................ 5 1.5.4 Stainless Steel Strand ..................................................................................................... 6 1.5.5 Copper-clad Strand ........................................................................................................ 6 1.5.6 Stainless-clad Strand ...................................................................................................... 7 1.5.7 Flow-filled Epoxy-coated Strand ................................................................................... 7
1.6 Research Overview: Chapter Outline ....................................................................................8
Chapter 2. Tension Mechanical Testing Including Modulus Information .............................. 9 2.1 Overview ................................................................................................................................9 2.2 Specimen Development and Preparation .............................................................................10
2.2.1 Epoxy End Grips .......................................................................................................... 10 2.2.2 Development of Grip Length and Width ..................................................................... 10 2.2.3 Specimen Parts Preparation ......................................................................................... 10 2.2.4 Specimen Casting ......................................................................................................... 10
2.3 Specimen Casting ................................................................................................................11 2.3.1 Test Setup ..................................................................................................................... 11 2.3.2 Test Procedure ............................................................................................................. 11
2.4 Analysis and Results ............................................................................................................12 2.4.1 Strand Strength Requirements and Area Modifications .............................................. 12 2.4.2 Breaking and Yielding Strength ................................................................................... 13 2.4.3 Elastic and Secant Models ........................................................................................... 16
2.5 Summary ..............................................................................................................................19
Chapter 3. Passive Corrosion Exposure Testing ...................................................................... 21 3.1 Overview ..............................................................................................................................21 3.2 Exposed Strand Test ............................................................................................................21
3.2.1 Test Description ........................................................................................................... 21 3.2.2 Test Setup ..................................................................................................................... 22 3.2.3 Results of Exposed Strand ........................................................................................... 23
3.3 Grouted Strand Tests ...........................................................................................................26 3.3.1 Test Description ........................................................................................................... 26 3.3.2 Test Setup ..................................................................................................................... 27
Chapter 4. Accelerated Corrosion Testing ............................................................................... 33 4.1 Introduction ..........................................................................................................................33

viii
4.2 Electrochemical Theories ....................................................................................................33 4.2.1 Half Cell Reactions ...................................................................................................... 33 4.2.2 Mixed Potential Theory ............................................................................................... 34
4.3 Potentiostatic Accelerated Corrosion Testing ......................................................................36 4.4 Linear Polarization Resistance Corrosion Testing ...............................................................37 4.5 Potentiodynamic Accelerated Corrosion Testing ................................................................38 4.6 Testing Plan .........................................................................................................................40 4.7 Specimen Design .................................................................................................................41 4.8 Testing Equipment Setup/Test Procedure ............................................................................43 4.9 Results of Accelerated Active Corrosion Testing ................................................................46
4.9.1 Summary Phase I—Uncracked Grout Specimens ....................................................... 46 4.9.2 Summary Phase II—Cracked Grout Specimens .......................................................... 47
Chapter 5. Test Indications and Conclusions ........................................................................... 51 5.1 Major Trends ........................................................................................................................51
5.1.1 Large-scale Exposure Beams Half-cell Data ............................................................... 51 5.1.2 Exposed Strand Test .................................................................................................... 52 5.1.3 Grouted Strand Test ..................................................................................................... 53 5.1.4 Accelerated Active Corrosion Test .............................................................................. 54
5.2 Strand Type Recommendations ...........................................................................................56 5.3 Conclusions ..........................................................................................................................59
References .................................................................................................................................... 61

ix
List of Figures Figure 1.1: Passive Polarization Behavior5 ..................................................................................... 2
Figure 1.2: Examples of Uniform and Pitting Corrosion ................................................................ 3
Figure 1.3: Corroded Hot Dip Galvanized Duct ............................................................................. 4
Figure 1.5: 0.5 in. Conventional Strand .......................................................................................... 5
Figure 1.6: 0.5 in. Hot Dip Galvanized Strand ............................................................................... 6
Figure 1.7: 0.6 in. Stainless Steel Strand ........................................................................................ 6
Figure 1.9: 0.6 in. Stainless-clad Strand ......................................................................................... 7
Figure 2.1: Setup Used to Cast Ends onto the Strands ................................................................. 11
Figure 2.2: Strand Specimen after Failure Had Occurred ............................................................. 12
Figure 2.3: Load vs. Strain Plot for Conventional 0.5 in. Strand ................................................. 14
Figure 2.4: Stress vs. Strain Plot for Conventional 0.5 in. Strand ................................................ 16
Figure 2.5: Stress vs. Strain Plot for Stainless Steel 0.6 in. Strand .............................................. 17
Figure 2.6: Stress vs. Strain Plot Showing Results for Each Strand ............................................. 19
Figure 3.1: Specimens Used in Exposed Strand Test ................................................................... 22
Figure 3.2: Pipe Configuration with Capped Ends and Holes Drilled .......................................... 23
Figure 3.3: Corrosion Rating over Time for All Strands .............................................................. 24
Figure 3.4: Average Six-month Rating vs. Epoxy-coated Strand ................................................. 25
Figure 3.6: All the Strands after 6 Months ................................................................................... 26
Figure 3.7: Design of Different Types of Specimens ................................................................... 27
Figure 3.8: Final Configuration before Curing ............................................................................. 28
Figure 3.9: Grouted Strand Test Cell Setup .................................................................................. 29
Figure 3.10: Grouted Strand Test Complete Setup ....................................................................... 30
Figure 3.11: Potential vs. Time for the Representative Specimens .............................................. 31
Figure 4.1: Basic Setup2 ................................................................................................................ 34
Figure 4.2: Plot of Applied Potential vs. Log of Current Events .................................................. 35
Figure 4.3: Mixed Potential Plot2.................................................................................................. 35
Figure 4.4: Typical Plot from a Potentiostatic Accelerated Corrosion Test ................................. 36
Figure 4.5: Potentiodynamic Plots for All Strand Types .............................................................. 37
Figure 4.6: Plot of Linear Polarization Resistance2 ...................................................................... 38
Figure 4.7: Plot of Applied Voltage vs. Log of Current from Potentiodynamic Test14 ................ 39
Figure 4.8: Potentiodynamic Plots of all Strand Types ................................................................ 40
Figure 4.9: Specimen Design ........................................................................................................ 41
Figure 4.11: Chucks Used to Damage Epoxy Coating ................................................................. 42
Figure 4.12: Pre-Cracking Device ................................................................................................ 43
Figure 4.13: Computer, Potentiostat, and Multiplexer ................................................................. 44
Figure 4.14: Corrosion Cell .......................................................................................................... 45

x
Figure 4.15: Specimen before and after Casting Was Removed .................................................. 46
Figure 4.16: Bar Chart Showing Comparison of Times to Corrosion (Phase I)2—Uncracked ......................................................................................................................... 47
Figure 4.17: Times to Corrosion for Pre-Cracked Specimens ...................................................... 48
Figure 5.1: Six-month Rating vs. Epoxy-coated Strand ............................................................... 52
Figure 5.2: Average Weight Loss vs. Epoxy Coated .................................................................... 53
Figure 5.4: Comparison of Times to Corrosion for Normal Specimens2 ..................................... 55
Figure 5.5: Comparison of Times to Corrosion for Pre-Cracked Specimens3 .............................. 56

xi
List of Tables
Table 2.1: Testing Summary Showing Actual Areas of Strands .................................................... 9
Table 2.2: ASTM A 416 Requirements ........................................................................................ 13
Table 2.3: Ultimate Strengths ....................................................................................................... 15
Table 2.4: Yield Strengths ............................................................................................................ 15
Table 2.5: Elastic and Secant Modulus ......................................................................................... 18
Table 3.1: Corrosion Rating System ............................................................................................. 22
Table 3.2: Results of All Strands Relative to Epoxy-Coated Strands ........................................... 24
Table 3.3: Corrosion Potentials of Representative Specimens ..................................................... 31
Table 4.1: Testing Plan ................................................................................................................. 41
Table 4.2: Testing Variables ......................................................................................................... 45
Table 4.3: Summary of the Linear Polarization Resistance Results for all Phase I (Uncracked) ....................................................................................................................... 46
Table 4.4: Linear Polarization Resistance Results for all Phase II (Cracked) .............................. 48
Table 5.1: Least Corroded Specimens .......................................................................................... 51
Table 5.2: Most Corroded Specimen ............................................................................................ 51
Table 5.3: Corrosion Potential of Representative Specimens ....................................................... 54
Table 5.4: Comparative Results of Linear Polarization Resistance Tests .................................... 55
Table 5.5: Tensile Strength ........................................................................................................... 57
Table 5.6: Strand Rankings Based on Corrosion Resistance ........................................................ 58
Table 5.7: Strand Rankings Based on both Corrosion Resistance and Satisfaction of Mechanical Resistance ...................................................................................................... 58

xii

1
Chapter 1. Introduction
1.1 Background
With the increasing popularity of post-tensioned bridge construction in the United States, the need for corrosion protection is great. The prestressing steel elements of post-tensioned systems are very high strength and the seven-wire strands are quite vulnerable to corrosion attack. Several techniques are used during construction in order to prevent such corrosive action, including coating the prestressing strands with oil and grouting the ducts after placement. However, the post-tensioned strands are highly vulnerable even with these precautions. A different possible solution could be the use of materials other than the conventional steels used today. The ongoing research seeks to discover new materials that can match the durability of steel while preventing corrosion and be economically reasonable1-6. In an effort to further explore these options, the Texas Department of Transportation (TxDOT) and the Federal Highway Administration (FHWA) in 1993 began funding a research project (0-1405) to improve corrosion resistance of post-tensioned bridges. This research has already yielded improved construction methods and materials1-8.
The cost of corrosion of reinforced concrete structures is of concern in the United States with an estimated cost of $8.3 billion annually7. A major problem with post-tensioned systems is that detecting corrosion in the tendon is very difficult even when regular maintenance checks are made. Also, in order to be readily inspected, the ducts must be left ungrouted. This practice leaves the tendon exposed and vulnerable to atmospheric conditions that can be harsh, especially in a marine environment. Even with the ducts grouted, there is still no guarantee that the tendon will be protected from corrosive agents. The grout is placed after the tendon is tensioned and is only bonded to the tendon through curing. Because grout has similar properties to concrete and is weak in tension, the grout is susceptible to cracking. Any penetration of the outer duct can allow the corrosive agents to reach the tendon.
Apart from the cracking of the grout, the durability of the ducts in the post-tensioning system is also in question. The material, placement, and function failures of the duct and grout system are all potential problems possibly leading to the corrosion of the tendon found inside. The main issue in this report is the need to find a material for the strands that reflects the strength of conventional steel but is capable of resisting corrosion. A secondary issue being explored in another phase of this project is finding a duct system impervious to moisture and durable enough to outlast the wear and corrosion attack of normal use.
1.2 Research Objectives
This research project (0-4562), funded by TxDOT and the FHWA, focuses on developing new methods and materials for the construction of post-tensioned bridges. This project began in 2003 and is being conducted at Ferguson Structural Engineering. The research includes exploration of new materials for the strands and the ducts. Large-scale cracked post-tensioned concrete specimens are being tested through aggressive cycles of chloride exposure. Companion small-scale tests of strand or grout and strand were conducted on the proposed materials for the strands. These small-scale tests of the tendons are the focus of this report. They included both active accelerated corrosion tests and passive corrosion tests. The tests were designed to gather enough information on the proposed new materials to better understand and predict their use.

2
Autopsies have been conducted on approximately half of the large specimens and autopsies of the remaining specimens will be conducted at 6 years1. During the autopsies, both the corrosion of the tendon and the durability of the ducts are studied.
This report will document the mechanical properties and the corrosion resistance of these new post-tensioning strand materials. The materials utilized are strand systems that were available in 2005 when exposure tests began.
1.3 Corrosion of Prestressing Materials
1.3.1 Corrosion of Metal
The basic corrosion of metal is an electrochemical process made up of half-cell reactions. These half-cell reactions consist of an anodic and a cathodic reaction. Oxidation occurs on the anodic reaction while reduction occurs on the cathodic reaction. The regions where the anodic and cathodic processes are located have varying electrochemical potentials leading to the type of corrosion that will be present9. The electrochemical potential present from the reactions also allows the monitoring of the corrosion by the use of a voltmeter and a reference electrode when the material is covered, such as in the case of prestressing tendons. This monitoring can be used to determine the severity and rate of corrosion.
1.3.2 Passivity
Steel, in all its various forms, such as stainless, exhibits passivity in some degree in the active, passive, and transpassive states9. See Figure 1.1 for the different ranges. The state at which a metal is acting depends on the potential of the metal, which governs the corrosion rate9. Conventional steel in concrete exhibits a passive state, and a passive protective layer is formed. Grouting the ducts of a post-tensioning system helps create this passive layer5. Chlorides have been found to enter the concrete through cracking; they then break down this protective layer, causing the metal to enter a transpassive state and begin to corrode. This process motivated the research to find a material that can withstand chloride exposure and keep the passive protective layer longer. Some materials tested, such as the stainless steel, are developed with a natural passive protective layer that makes them appealing for use in corrosion resistance.
Figure 1.1: Passive Polarization Behavior5

3
1.3.3 Types of Corrosion
Metal can undergo many types of corrosion depending on the type of metal and its passivity capabilities, chemical exposure, exposure duration, exposure cycle, temperature, and concentration of corrosive agent. Some of the most common types of corrosion are uniform, galvanic, crevice, pitting, and blistering9. See Figure 1.2 for examples of uniform and pitting corrosion. Many times, the corrosion will start out as uniform and build up to create blisters, while in some instances the corrosion is local and will result in pitting or crevices.
Uniform Corrosion Pitting Corrosion
Figure 1.2: Examples of Uniform and Pitting Corrosion
1.4 Durability of Post-Tensioned Systems
The durability of the post-tensioning systems is a major contributor to successfully fighting corrosion. The problem is that the current methods are still susceptible to damage and corrosion. If the duct surrounding a post-tensioned strand fails, then corrosives such as chlorides may enter the duct and reach the tendon. The duct’s material itself is the first line of defense against corrosion. The most common materials used for ducts are hot dip galvanized steel and plastic. The problem with hot dip galvanized duct is that the zinc coating is a sacrificial element, which means that once the entire zinc coating has fully reacted, the steel will begin to corrode. This is an obvious long-term problem. Figure 1.3 shows the remains of a galvanized duct after 8 years of chloride solution exposure inside a post-tensioned concrete beam. The remains of the duct provide no tendon protection.

4
Figure 1.3: Corroded Hot Dip Galvanized Duct
The alternative is plastic duct. One problem with this material is that the tendons may rub against the ducts during stressing due to harping of the tendons10. This rubbing can cause the material to break down and eventually fail, allowing chlorides to enter. Apart from the material aspects, another issue of durability is splice details. Poor technology of splice designs allows failure at these points, and once again, the system is susceptible to chloride exposure. Another concern of durability is the anchorage of the system. The strands are tensioned and held using a hydraulic jack. When the jacks are released, the shortening of the strands are resisted by a system of wedges. Figure 1.4 shows a layout of a post-tensioned anchorage system.
Figure 1.4: Post-Tensioning Anchorage System
The force pulling on the strands can create interstitial channels in the strands5. The tendons are grouted, but if chlorides are able to penetrate, they can enter the ducts and reach the entire tendon through these channels. Also, the corrosion at these affected cross-sections increases the stress, and ultimately failure will occur at these points.
5
1.5 Materials
1.5.1 Strand Tests
The materials used for the different strand tests were chosen to compare a baseline conventional steel strand to other strands for optimal corrosion resistance. The materials selected for testing in this current program are seven-wire strands consisting of the following:
1. Conventional Strand (CN) (0.6 in)
2. Hot Dip Galvanized Strand (GV) (0.5 in)
3. Stainless Steel Strand (SS) (0.6 in)
4. Copper-clad Strand (CC) (0.5 in)
5. Stainless-clad Strand (SC) (0.6 in)
6. Flow-Filled Epoxy-coated Strand (EC) (0.5 in)
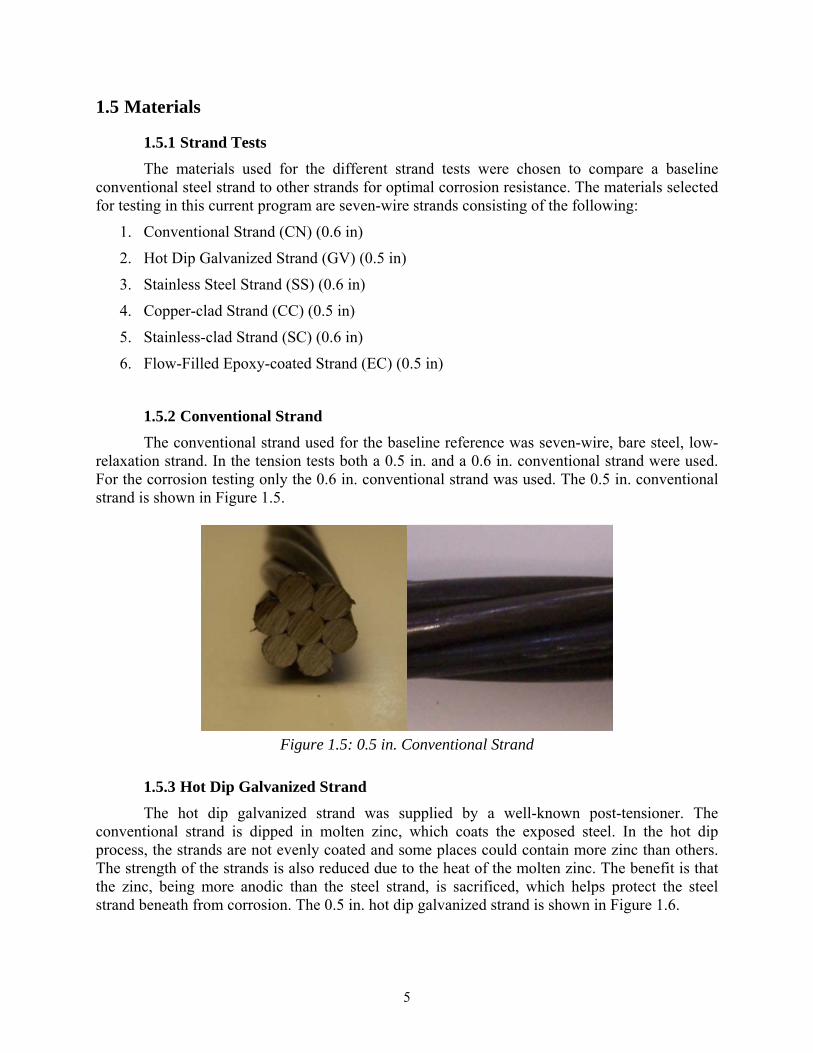
1.5.2 Conventional Strand
The conventional strand used for the baseline reference was seven-wire, bare steel, low-relaxation strand. In the tension tests both a 0.5 in. and a 0.6 in. conventional strand were used. For the corrosion testing only the 0.6 in. conventional strand was used. The 0.5 in. conventional strand is shown in Figure 1.5.
Figure 1.5: 0.5 in. Conventional Strand
1.5.3 Hot Dip Galvanized Strand
The hot dip galvanized strand was supplied by a well-known post-tensioner. The conventional strand is dipped in molten zinc, which coats the exposed steel. In the hot dip process, the strands are not evenly coated and some places could contain more zinc than others. The strength of the strands is also reduced due to the heat of the molten zinc. The benefit is that the zinc, being more anodic than the steel strand, is sacrificed, which helps protect the steel strand beneath from corrosion. The 0.5 in. hot dip galvanized strand is shown in Figure 1.6.

6
Figure 1.6: 0.5 in. Hot Dip Galvanized Strand
1.5.4 Stainless Steel Strand
The stainless steel strand shown in Figure 1.7 was provided by Techalloy Company, Inc. It was originally produced but then not used for a bridge project. Stainless steel is known for its corrosion resistance and is used widely in marine applications.
Figure 1.7: 0.6 in. Stainless Steel Strand
1.5.5 Copper-clad Strand
The copper-clad strands are comprised of individual steel wires encased in copper. The copper is metallurgically bonded to the steel so that the bond between the copper and the steel is very strong, which prevents it from separating. However, copper is a softer metal and its tensile strength significantly less than that of steel. Thus, the copper reduces the strength of the entire strand. However, copper and its alloys have good corrosion resistance. The 0.5 in. copper-clad strand is actually a 0.438 in. conventional steel strand clad to make the strand 0.5 in. in diameter. The 0.5 in. copper-clad strand shown in Figure 1.8 was produced by Copperweld and is not structural strand. However, Copperweld indicated that a structural strand could be produced if enough demand was present.

7
Figure 1.8: 0.5 in. Copper-clad Strand
1.5.6 Stainless-clad Strand
Stainless-clad strand provides the user with the strength of conventional steel together with the corrosion protection of stainless steel. Also, with only a thin coating of stainless steel, the cost is less than that of a solid stainless steel strand. The cladding process is similar to that of the copper and the steel-to-stainless steel bond is very strong. The 0.6 in. stainless-clad strand shown in Figure 1.9 was supplied by Dywidag Systems International (DSI).
Figure 1.9: 0.6 in. Stainless-clad Strand
1.5.7 Flow-filled Epoxy-coated Strand
The flow-filled epoxy-coated strand is superior to the standard epoxy-coated strand. The epoxy fills the interstitial areas, preventing moisture from infiltrating these areas—which prevents corrosion from occurring in these areas. The epoxy coating protects the steel strand from corrosion. However, if the epoxy is damaged, localized corrosion can occur. The epoxy-coated strand shown in Figure 1.10 was supplied by Sumiden Wire.

8
Figure 1.10: 0.5 in. Flow-filled Epoxy-coated Strand
1.6 Research Overview: Chapter Outline
This report is largely based on the master’s theses of Kalina3 and Mac Lean2. Both are available at no cost on the website http://fsel.engr.utexas.edu/publications/. Chapter 2 outlines the tension mechanical testing of the different strand types. The development of an epoxy end grip for use in tension testing of prestressing strands is described. These grips were used to test the strands shown in Section 1.5. The results of the tension tests, including the modulus information for each strand, are also discussed in this chapter. Conclusions from the testing are shown in the summary. Chapter 3 gives a description of the passive corrosion exposure tests conducted on individual strand types. The tests consist of an exposed strand test and a grouted strand test. It summarizes the two different tests conducted and presents their results. Chapter 4 examines the accelerated active corrosion testing including the addition of pre-cracking the elements. It describes why the potentiostatic corrosion testing was not a feasible testing technique. The potentiostatic tests were replaced by the linear polarization resistance tests. The accelerated corrosion tests were used to compare the corrosion properties of the various strand types. Chapter 4 gives the results of the linear polarization resistance and potentiodynamic tests for each strand type. Chapter 5 discusses the trends of all the tests conducted, summarizes the corrosion test results, and gives the conclusions and recommendations based on the results.

9
Chapter 2. Tension Mechanical Testing Including Modulus Information
2.1 Overview
Because some of the new exposure beam specimens were to be post-tensioned with new materials not previously used in the field, establishing the mechanical properties was important for each material. Tension tests were conducted to establish the breaking strength, yield strength, and modulus of elasticity of the various strand types. These properties were used to determine if the materials were able to meet all the specifications required of prestressing strand. Conventional 0.5 in. and 0.6 in. low-relaxation strands were tested along with the other strand types to provide a standard for comparison. The ASTM A416 (2006) and A370 (2005) guidelines were followed during testing and test preparation. Table 2.1 summarizes the testing along with the measured areas of each strand type. Before the mechanical tests could be performed, it was important to develop a safe, reliable, and easily repeatable test method, due to the number of tests required. This method also needed to be “universal:” it needed the capability to test all the different strand types. The strand diameters ranged from 0.5 in. to 0.6 in. Also, the material type ranged from hot dip galvanized to epoxy-coated. The main problem encountered during the strand tension testing was premature failure of one or more of the wires that make up the strand. Generally these failures occur at the grips primarily because applying equal force to all seven wires in the strand while using conventional grips is impossible. Therefore, in developing a test method, the primary concern was preventing these end failures. In addition to the gripping problems, there are also high stresses within the strands due to the fact that the strands can exceed 270 ksi. At these high stresses, any small indentations into the individual wires can cause the wires to fracture without warning. The standard grips on the test machines normally have teeth that embed themselves into the material being tested. These teeth help keep the material from slipping and normally help the test to run smoothly. But as mentioned earlier, any indentations in the wires can cause failure. Therefore, it is important to grip the strand indirectly.
Table 2.1: Testing Summary Showing Actual Areas of Strands
Tension Test Summary
Type Nominal Dia. (in) Area (in2) Number of Tests
Conventional 0.5 0.151 3 Galvanize Coated 0.5 0.152 3
Epoxy Coated 0.5 0.153 3 Copper Clad 0.5* 0.144 3
Stainless Clad 0.6* 0.217 3 Conventional 0.6 0.220 3 Stainless Steel 0.6 0.221 3
*includes cladding

10
All areas were calculated from the measurements of the diameters of the individual wires of each strand (including metallic coating). The copper-clad and the stainless-clad strand areas shown include the metallic coating. The copper-clad strand was actually 0.438 in. diameter conventional strand clad with copper to make it 0.5 in. diameter strand. So the actual area of the steel core was 0.108 in2. The stainless-clad strand was a 0.5 in. diameter conventional strand clad with stainless steel to make it a 0.6 in. strand. The diameters were measured using a highly precise set of calipers.
2.2 Specimen Development and Preparation
2.2.1 Epoxy End Grips
After reviewing many previous testing techniques2, it was decided to use a relatively simple epoxy grip system. A two-part Type V epoxy had already been provided by Unitex to seal the anchorages on the large beam specimens. The properties of this epoxy made it ideal for use to form grip ends. The epoxy had a high bonding strength, was not easily crushed, and was able to flow not only around the strand but also into any interstitial areas. Preliminary tension tests showed that the epoxy could withstand the stresses developed in the strands during testing.
2.2.2 Development of Grip Length and Width
Because gripping the epoxy itself is extremely difficult, it was not possible to perform tension tests on the actual epoxy. Instead, trial and error was used to find a suitable length and width of grip. Circular tubing was eventually chosen that was not easily crushed and had enough surface area for the epoxy bond. A diameter of 1 in. was chosen because it required the least amount of epoxy at the grip ends and there was still room to pour in the epoxy even when using the 0.6 in. diameter strands. Determining a grip length also required trial and error. The ASTM standard for tension testing of wire ropes and strand, ASTM A 931, does not have a requirement for length of strand nor does it have a requirement for grip length. The one requirement, however, is for the distance between the grips: “The length of test specimen shall not be less than 3 ft. (0.91 m) between sockets for wire ropes up to 1 in.” In order to adhere to this requirement it was decided that the distance between the grips in all specimens should be 36 in. The grip lengths were then varied to find a length that was suitable for testing. After a couple tests, a grip length of 18 in. for the 0.5 in. strands and a grip length of 28 in. for the 0.6 in. strands were chosen.
2.2.3 Specimen Parts Preparation
For epoxy to bond properly to any material, all surfaces must be clean and free of all dust and oil. The inside and outside of the pipes were thoroughly cleaned with acetone. The ends of the strands were sand blasted.
2.2.4 Specimen Casting
To make multiple specimens and increase production, a setup to cast three specimens at a time was built as shown in Figure 2.1. Many of the strands had a natural curvature. The setup held these strands straight so that they would be cast in the same position as they would be tested. Full details are given in Reference 2.

11
Figure 2.1: Setup Used to Cast Ends onto the Strands
2.3 Specimen Casting
2.3.1 Test Setup
With the gripping ends epoxied to the strands, the specimens were easily tested in a standard test machine using V-grips. The strain was measured using a standard 10 in extensometer with a 14 inch extension. The ASTM specification A370 (2005) requires that, when determining the elongation of strand used for prestressing concrete, a class D extensometer be used and it must have a gage length of no less than 24 in.
2.3.2 Test Procedure
Three specimens per strand type were cast so that three tests per strand type could be performed. The first test was to determine the breaking strength so that a limit for removing the extensometer could be established. This limit was around 90% of the breaking strength. While testing, the load vs. the strain was plotted on the computer in real time and this plot was also

12
taken into consideration before removing the extensometer. This was important so that the extensometer could be left on the specimen for the maximum amount of time. Once the failure load had been established and a benchmark value for removing the extensometer had been determined, the stress-strain tests were performed.
The load was applied at approximately 0.1 kips per second and the values of the load and elongation were monitored on the computer in real time. Once the load had reached the point where the strain data was sufficient and it was still safe to be near the specimen without the chance of failure, the extensometer was removed. The strand was then loaded to failure and once again the breaking strength and the mode of failure were recorded. A typical failure is shown in Figure 2.2.
Figure 2.2: Strand Specimen after Failure Had Occurred
2.4 Analysis and Results
Three tests were conducted per strand type, totaling 21 tests. The first test was to determine the breaking strength of the strand. The second test was to determine the yield strength and the modulus information. Finally, the third test was performed to confirm the results of the second test. This section will summarize the results of these 21 tests.
2.4.1 Strand Strength Requirements and Area Modifications
There is no defined specification for some of the strand types tested. The ASTM A 416/A 416M11 specification was thus used to compare all the strands and to provide a specific requirement that each strand must meet. Two of the strands, (the copper-clad and the stainless-clad) were comprised of an interior core of conventional steel clad with different metals. The exterior cladding was noticeably weaker than the core because of the type of metal used. Thus,

13
for comparison purposes both the area of the complete strand and the area of the conventional steel core were considered. The total area including the cladding is considered the nominal area and the area of only the steel core is considered the steel area. For the copper-clad strand, the steel area was found to be 0.108 in2. Because this area matched that for the strand designation no. 11, this designation was used for the copper-clad strand only considering the steel area. The stainless-clad strand was a 0.5 in. diameter structural strand clad with stainless steel. Therefore, the steel area used for comparison of the stainless-clad strand was 0.153 in2. Table 2.2 shows the yield and breaking strength requirements from ASTM A 41611.
Table 2.2: ASTM A 416 Requirements
Strand Designation
No.
Nominal Dia. (in)
Area (in2)
Minimum Breaking
Strength (kip)
Yield Strength / Minimum Load at 1% Extension (kip)
Low-Relaxation
Normal-Relaxation
Grade 250
9 0.375 0.080 20 18.00 17.00
11 0.438 0.108 27 24.30 23.00
13 0.500 0.144 36 32.40 30.60
15 0.600 0.216 54 48.60 45.90
Grade 270
9 0.375 0.085 23 20.70 19.55
11 0.438 0.115 31 27.90 26.35
13 0.500 0.153 41.3 37.17 35.10
15 0.600 0.217 58.6 52.74 49.80
2.4.2 Breaking and Yielding Strength
2.4.2.1 Analysis Method
The load at which the strands failed represents the breaking strength of the strand. The breaking stress can be easily calculated from the load at failure and the area of the strand.
Where σ = the stress in the strand P = force exerted on the strand by the test machine
A = cross-sectional area of the strand
The yield strength of prestressing strand, however, is not as well defined. Standard steel reinforcing bars have a well-defined yield point and the yield strength can easily be read off of a graph of load vs. strain. The load vs. strain plot of prestressing strand does not have a well-defined yield point. Two methods commonly used to find the yield point are the 1% extension method or the 0.2% offset method, both of which are generally accepted. In calculating the yield

14
strength of the strands the 1% extension method was used. This allows for easy comparison to the ASTM A 416 requirements. Figure 2.3 shows the 1% extension method.
Figure 2.3: Load vs. Strain Plot for Conventional 0.5 in. Strand
2.4.2.2 Results The results presented below are an average of the three tests performed on each strand.
The test results were so close that the averages basically represent the values obtained in each test. The breaking strength requirements for prestressing strand are shown in Table 2.2. The values in this table were used as benchmarks for comparing the obtained values. Table 2.3 shows the average breaking strength of each strand type.
The stainless steel strand performed very poorly and did not meet either requirement. The copper-clad strand was compared using its nominal area and also the steel area only. Using its nominal area, it did not meet the requirements for a 0.5 in. diameter strand. Even if the cladding is considered non-structural, the 0.438 in. diameter steel core still does not meet the ASTM requirements. The hot dip galvanized strand, although having the area of the Grade 270 conventional steel strand did not meet the strength requirements of the Grade 270 but met the requirements of the Grade 250. This was expected because during the galvanizing process the steel strand is exposed to high temperatures that reduce the strength of the strand. The stainless-clad strand did not meet the Grade 270 benchmark either when the stainless cladding was considered part of the structure of the strand. However, when the stainless steel was considered merely a non-structural cladding, it met the requirements for the 0.5 in Grade 270 strand. Stainless steel is known to be weaker than conventional steel due to its high carbon content. The stainless cladding on the strand was quite thick, which can reduce its strength.
Loa
d (
kip
)
Strain (in/in)
Load vs. Strain
1% extension
yield strength

15
Table 2.3: Ultimate Strengths
Type Nominal Dia. (in)
Area (in2)
Breaking Strength (kip)
Met Grade 250 requirement
Met Grade 270 requirement
Conventional 0.5 0.153 43.0 Yes Yes
Epoxy Coated 0.5 0.153 43.7 Yes Yes
Conventional 0.6 0.217 61.5 Yes Yes
Hot Dip Galvanized
0.5 0.153 40.9 Yes No
Stainless Clad (nominal area)
0.6 0.217 57.5 Yes No
Stainless Clad (steel area)
0.5 0.153 57.5 Yes Yes
Stainless Steel 0.6 0.217 48.9 No No
Copper Clad (nominal area)
0.5 0.144 25.9 No No
Copper Clad (steel area)
0.438 0.108 25.9 No No
Table 2.4 shows the values of the yield strength obtained from the 1% extension method.
All of the strand types except for the copper-clad and the stainless steel exhibited generally uniform elastic moduli. The copper-clad and stainless steel strands seemed to go into the inelastic range almost immediately. The 1% extension method was still used on both strand types but probably does not accurately represent the yield strength. The table compares the yield strengths obtained to the requirements for low and normal relaxation strands given in ASTM A 416. The results obtained for the yield strengths mirror those obtained for the breaking strength.
Table 2.4: Yield Strengths
Type Nominal Dia. (in)
Area (in2)
Breaking Strength (kip)
Met Grade 250 requirement
Met Grade 270 requirement
Conventional 0.5 0.153 43.0 Yes Yes
Epoxy Coated 0.5 0.153 43.7 Yes Yes
Conventional 0.6 0.217 61.5 Yes Yes
Hot Dip Galvanized
0.5 0.153 40.9 Yes No
Stainless Clad (nominal area)
0.6 0.217 57.5 Yes No
Stainless Clad (steel area)
0.5 0.153 57.5 Yes Yes
Stainless Steel 0.6 0.217 48.9 No No
Copper Clad (nominal area)
0.5 0.144 25.9 No No
Copper Clad (steel area)
0.438 0.108 25.9 No No

16
2.4.3 Elastic and Secant Models
The elastic modulus represents the slope of the elastic part of the curve of the stress-strain graph. For prestressing strand, this is generally taken from 10% of the breaking stress to just before the plot starts to curve (see Figure 2.4). The secant modulus is the slope of a line from the origin to any point on the curve (see Figure 2.5). Because prestressing strand is usually stressed to 0.6 PUlt, where PUlt is the maximum breaking strength, the secant modulus was calculated using the origin and this point. For the copper-clad and the stainless steel strands, there did not seem to be an elastic part to the curve, so the elastic modulus was not calculated. Thus the secant modulus for all strand types was calculated to get a comparison.
Figure 2.4: Stress vs. Strain Plot for Conventional 0.5 in. Strand
Str
ess
(ksi
)
Strain (in/in)
Stress vs. Strain
Rise
Run
Elastic Modulus = Rise/Run

17
Figure 2.5: Stress vs. Strain Plot for Stainless Steel 0.6 in. Strand
Most of the strands tested had an elastic modulus that was very close to that of steel, 29,000 ksi. The solid stainless steel strand had a secant modulus that was considerably less than that of steel. From its performance in the breaking and yield strength tests, it was expected that its modulus would be less. The stainless-clad strand had a lower elastic modulus if the nominal area was considered and a much larger modulus if only the steel area was considered. Stainless steel is a metal and thus is part of the structure. To consider it only a cladding would not be accurate. Thus, the modulus using the nominal area which is the entire area more accurately estimates the modulus. The same applies to the copper-clad strand. However, when only the steel core area is used to find the secant modulus for the copper-clad strand, the secant modulus is very close to that of steel. The elastic and secant moduli obtained from the tests are shown in Table 2.5. Also included in Figure 2.6 is a stress vs. strain plot of all seven-strand types, using their nominal and steel areas for comparison. The end of the individual plots does not represent failure but only the point at which the extensometer was removed. The great difference between the copper-clad and stainless steel strands from the other strands can be seen in Figure 2.6.

18
Table 2.5: Elastic and Secant Modulus
Type Nominal Dia.
(in) Area (in2)
Elastic Modulus (ksi)
Secant Modulus (ksi)
Conventional 0.5 0.153 28664 28609
Epoxy Coated 0.5 0.153 29249 29046
Conventional 0.6 0.217 29396 29378
Hot Dip Galvanized
0.5 0.153 28846 28830
Stainless Clad (nominal area)
0.6 0.217 27148 26725
Stainless Clad (steel area)
0.5 0.153 38505 37904
Stainless Steel 0.6 0.217 - 21116
Copper Clad (nominal area)
0.5 0.144 - 22024
Copper Clad (steel area)
0.438 0.108 - 29365

19
Figure 2.6: Stress vs. Strain Plot Showing Results for Each Strand
2.5 Summary
The main reason for performing the mechanical tests on the various strand types was to determine if the strands being exposed to corrosion testing are suitable for use in the field. Even if all the strand types were to perform well in corrosion testing, they can only be cleared for use if their yield and ultimate strengths and their elastic moduli surpass minimum requirements. From these initial tests, only the conventional, epoxy-clad, and stainless-clad showed promise at 270 ksi. The hot dipped galvanized and stainless-clad showed promise at 250 ksi. The stainless steel strand used in this study did not meet the requirements for use in the field. The copper-clad strand does not meet any of the requirements even if it is considered as a 0.438 in. diameter conventional strand with a non-structural cladding. These latter two strands are probably two of the better strands in terms of corrosion resistance and therefore more work needs to be done to develop strands that have their corrosive resistance properties but also can meet all the mechanical requirements. A recently introduced stainless steel strand is purported to meet A416 requirements but was not tested as part of this study.

20

21
Chapter 3. Passive Corrosion Exposure Testing
3.1 Overview
Along with the development of the large-scale beam specimens to test for corrosion, a need to know the corrosive properties of the strand types used is necessary. Several tests can be performed to determine these properties. This chapter summarizes the tests known as passive corrosion exposure testing. The term passive, when referring to electrochemical testing, refers to the type of test in which electrical impulses are recorded instead of applied. Two types of passive tests were conducted. The first test involves the bare strands undergoing a wet-and-dry cycle while they are exposed to a chloride solution. The strands are not encased in anything but left fully exposed to the solution. The second test involves casting the strands in a grouted encasement with a lead wire attached and then immersing the specimen in a chloride solution. The goal of this test is to take potential and current readings between the lead wire and a reference electrode. The data will then be compared over time to track the corrosion rate of each strand type.
3.2 Exposed Strand Test
The exposed strand test will allow the tracking of corrosion over several months. At the end, a weight loss will be calculated for each strand that will correlate to a relative corrosion rate among the different strand types.
3.2.1 Test Description
The exposed strand test involves taking each of the six types of tendons described in Chapter 1 and exposing them to a wet-and-dry cycle of a 5% chloride solution by weight. Three strands of each type were tested. The strands are placed in a plastic pipe that is closed off at the ends with holes drilled into it to allow the strands exposure to atmospheric conditions. Also, the holes are used to add and drain the solution. The ends of the strands are ground down and smoothed, and then initially weighed. Then the ends are covered with epoxy to shield the defects from solution. The strands are weighed a second time. At the end of testing, a final weight with the epoxy is recorded. A weight loss is calculated and correlated to produce a relative corrosion rate among the strand types.
The initial cycle is the wet cycle, which lasts for a week. At this time the solution is drained, and the strands begin the dry cycle that lasts for 3 weeks. At the end of 3 weeks, the strands are removed from the pipe for inspection. Each strand is designated by a numerical value which follows a corrosive rating system. Table 3.1 presents the rating system used. Note that half integers may be used if the corrosion level falls between two descriptions. Testing lasted approximately 6 months.

22
Table 3.1: Corrosion Rating System
3.2.2 Test Setup
Figure 3.1 shows all the strand types along with the ground ends. The specimens in Figure 3.1 are identified from left to right as stainless steel, hot dip galvanized, copper-clad, stainless-clad, flow-filled epoxy, and conventional steel. Notice the ends are ground down to round the cut edge.
Figure 3.1: Specimens Used in Exposed Strand Test
The length of each strand and corresponding pipe is 18 in. The pipe is PVC pipe with a 1.25 in. inside diameter. The pipe is then closed off, but not sealed, with an end-cap on each end. To allow the exposure to the atmosphere, three holes are drilled on one side of the pipe using a 1/8

23
in. drill bit. A fourth hole is drilled using a ½ in. drill bit to allow a funnel to be placed inside when filling the pipe with solution. Figure 3.2 shows the configuration.
Figure 3.2: Pipe Configuration with Capped Ends and Holes Drilled
The strands were kept centered in the pipe to allow even distribution of solution along the length of the pipe with an Armacell foam cell at each end.
3.2.3 Results of Exposed Strand
The exposed strand test was conducted for a period of 6 months. A weight loss rating and a corrosion rating of each strand indicate the corrosion resistance properties of the strands relative to each other. The corrosion rating system of Table 3.1 was used each month to rate strand corrosion. Note that if a strand’s corrosion rating was in between two integers, a half number could be designated. Detailed photos and measurements for all specimens are given in Reference 3. The results for each strand were determined based on both the weight loss and corrosion rating at 6 months. To determine the final weight, the strands were placed in an oven at 250 ˚F for 7 days to eliminate excess water followed by a light uniform brushing with a wire brush to remove any excess corrosion products.
The exposed strand test gave a great insight into the corrosion resistance of the different types of strands. The results showed trends that were expected, such as the epoxy-coated strand performing the best and the conventional strand the worst. The other strands followed similar trends between the corrosion ratings and the weight loss. The stainless-clad performed slightly better than the stainless steel based on the corrosion ratings and the weight loss. The copper-clad showed some variability between the two criteria with a slightly higher average six-month rating and a slightly lower average weight loss when compared to the stainless-clad and stainless steel. Also, the copper-clad had a higher average six-month rating than the hot dip galvanized, which can be explained by the small corrosion present at the ends due to the chloride penetration. Table 3.2 summarizes the results of average six-month rating and average weight loss compared relative to the epoxy-coated base strand.

24
Table 3.2: Results of All Strands Relative to Epoxy-Coated Strands Epoxy Coated
Stainless Clad
Stainless Steel Galvanized
Copper Clad Conventional
EC SC SS GV CC CN
AVG 6 Month Rating 1.5 1.5 1.7 2.0 3.0 7.0
vs. EC 1.00 1.00 1.13 1.33 2.00 4.67
AVG Weight Loss 0.60 1.07 1.10 2.03 1.03 10.13
vs. EC 1.00 1.78 1.83 3.39 1.72 16.89 Notice the similarities in trends of the strands between the average six-month rating and
the average weight loss. The only difference is the slightly lower average weight loss of the copper-clad as compared to the other strands. Figure 3.3 shows the corrosion rating over time among all the strands while Figure 3.4 shows the average six-month rating relative to the epoxy-coated strands. Figure 3.5 shows the average weight loss relative to the epoxy-coated strands. Note that the conventional strand has a rating of 16.89, and the plots of the ratings were terminated at 5 to better show the other strands. Finally, all the strands compared to each other at 6 months can be seen in Figure 3.6.
Figure 3.3: Corrosion Rating over Time for All Strands

25
Figure 3.4: Average Six-month Rating vs. Epoxy-coated Strand
Figure 3.5: Average Weight Loss vs. Epoxy-coated Strand

26
Figure 3.6: All the Strands after 6 Months
3.3 Grouted Strand Tests
The accelerated corrosion tests done by Mac Lean2 helped gather information on the corrosive behavior of the different tendon types in a relatively small amount of time. In order to get a feeling for how the corrosive activity builds over time, a test was developed that is similar to the accelerated tests in setup, but instead of applying a potential, it is recorded.
3.3.1 Test Description
The passive corrosion testing of grouted strands has very similar specimens as those of Mac Lean’s2 accelerated corrosion testing. The strands are placed in a clear pipe and grouted to imitate actual conditions where a tendon is grouted in a duct. Instead of having part of the strand exposed to allow a connection to apply potential, the strand is fully encapsulated within the pipe with the ends epoxied. Before the ends of the system are epoxied, a copper wire is attached to the strand to allow a connection for reading a current. This is similar to the copper wires attached to the tendons of the large-scale specimens. The grouted system is placed in a beaker containing a 5% chloride solution by weight. Over time, the strands undergo some corrosive activity, and an electrochemical process will occur. The system acts like a battery where a potential builds within the system. In the test a recording of potential and current is taken twice a day. The data is stored and can be used to compare the corrosive activity of the strands over a chosen period of time. The length of the test was approximately 4 months.

27
3.3.2 Test Setup
3.3.2.1 Specimen Preparation
The grouted strand test utilizes all the strand types summarized in Section 1.5.1 except for the flow-filled epoxy-coated. It was omitted from the test because the results of Mac Lean’s2 work showed that the epoxy-coated strand performed extremely well, and the data from this test would not prove to be useful. Also, the short time frame of the test would not yield enough results to analyze. Three specimens of each of the strand types were used, totaling 15 specimens. The strands were cut to length. Because the strands vary in diameter, the overall length of the pipe is different. This is a result of the length of the exposed grout region of the strand. The 0.6 in. diameter strands require the pipe to be bored out to have the same amount of grout cover as the 0.5 in. strands. Figure 3.7 shows the configuration of the two different systems. Manufacturing details are given in Reference 3.
Figure 3.7: Design of Different Types of Specimens
After the strands were cut, they were cleaned of debris, and the ends were ground. A 6 AWG gauge copper wire was attached to the top of each strand between two of the individual wires using duct tape. The wires can be seen in Figure 3.8. After the preparation of the specimens, the grout was mixed and poured into the pipe using a funnel. The grout used was SikaGrout 300 PT because it is a pre-mixed, non-bleed, high-flow grout. The water-to-cement ratio chosen was 0.3, to allow easy flowing into the pipes. The

28
tops of each specimen were left ungrouted a distance of 0.25 in. Immediately after pouring the grout, epoxy was poured to form a cap. Figure 3.8 shows the final stage of specimen preparation before curing.
Figure 3.8: Final Configuration before Curing
The specimens were cured in a fog room for 28 days. After curing, the plastic caps were removed and replaced with PVC end caps. Before the specimens were put into the setup, the middle section of the pipe was removed, exposing the grout.
3.3.2.2 Equipment Preparation The specimens were first immersed in a 5% chloride solution by weight in a 3000 mL beaker. In the system, the specimen acts as the working electrode accompanied by a counter electrode and a reference electrode. The counter electrode is a 0.05 in. platinum clad wire provided by Anomet products. The reference electrode is a saturated calomel electrode (SCE) manufactured by Fisher Scientific.
All the electrodes are held in place by the cell cover, which fits over the beaker. The platinum clad counter electrode was attached using the quick-dry epoxy. Figure 3.9 shows the complete setup of electrodes and wire attachments.

29
Figure 3.9: Grouted Strand Test Cell Setup
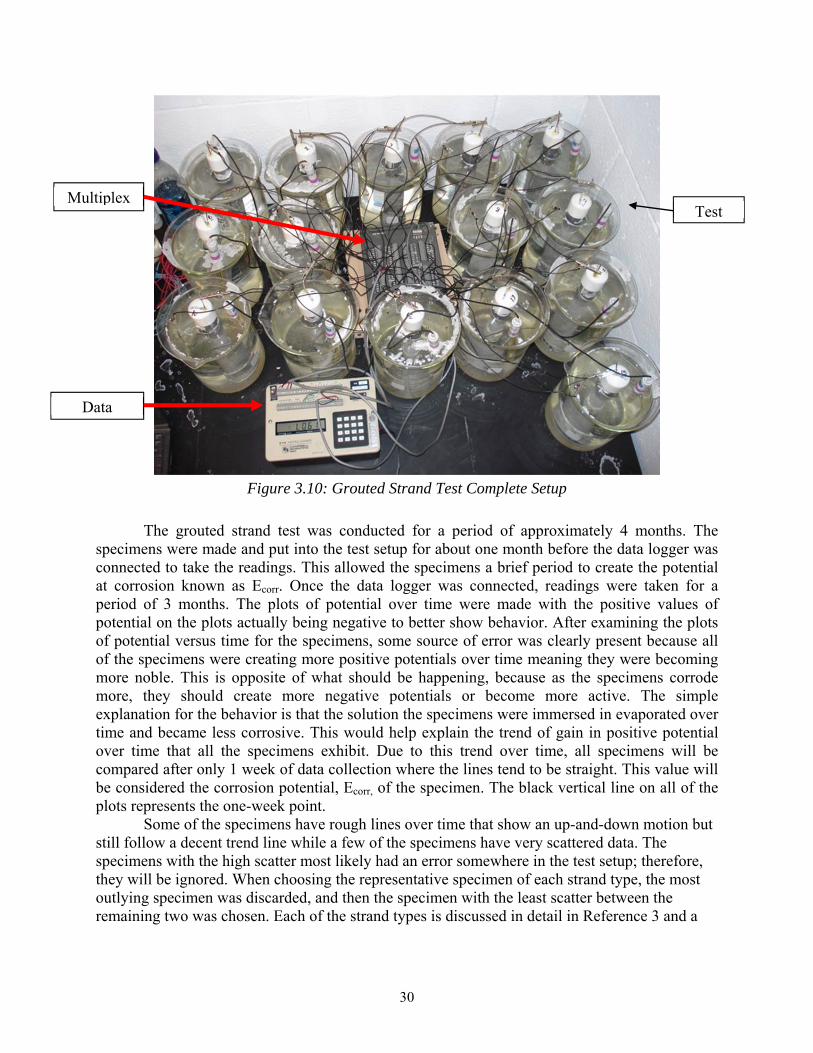
In order to gather data from the electromechanical processes, two multiplexers were used. One gathered potential and the other gathered current. The multiplexer for current has one common port shared by all the specimens and has a 20 kΩ resistor connected in series. Both multiplexers are then connected to a data logger, which is programmed to take data readings twice a day. The readings plot potential and current versus time to show how the specimens corrode relative to each other. Figure 3.10 shows the final test setup with the wires attached from the specimens to the multiplexer and data logger.
Working
Reference
Counter
Copper Wire For Current Reading
30
Figure 3.10: Grouted Strand Test Complete Setup
The grouted strand test was conducted for a period of approximately 4 months. The specimens were made and put into the test setup for about one month before the data logger was connected to take the readings. This allowed the specimens a brief period to create the potential at corrosion known as Ecorr. Once the data logger was connected, readings were taken for a period of 3 months. The plots of potential over time were made with the positive values of potential on the plots actually being negative to better show behavior. After examining the plots of potential versus time for the specimens, some source of error was clearly present because all of the specimens were creating more positive potentials over time meaning they were becoming more noble. This is opposite of what should be happening, because as the specimens corrode more, they should create more negative potentials or become more active. The simple explanation for the behavior is that the solution the specimens were immersed in evaporated over time and became less corrosive. This would help explain the trend of gain in positive potential over time that all the specimens exhibit. Due to this trend over time, all specimens will be compared after only 1 week of data collection where the lines tend to be straight. This value will be considered the corrosion potential, Ecorr, of the specimen. The black vertical line on all of the plots represents the one-week point. Some of the specimens have rough lines over time that show an up-and-down motion but still follow a decent trend line while a few of the specimens have very scattered data. The specimens with the high scatter most likely had an error somewhere in the test setup; therefore, they will be ignored. When choosing the representative specimen of each strand type, the most outlying specimen was discarded, and then the specimen with the least scatter between the remaining two was chosen. Each of the strand types is discussed in detail in Reference 3 and a
Data
MultiplexTest

31
final plot showing the representative specimens of each type will be plotted to show the relative corrosion properties among the strands.
Figure 3.11: Potential vs. Time for the Representative Specimens
Note from Figure 3.11 that all the representative specimens have constant potential versus time plots in the first week, representing the corrosion potential. These corrosion potentials can be found in Table 3.3.
Table 3.3: Corrosion Potentials of Representative Specimens CN CC GV SC SS
Ecorr (mVSCE) -875 -370 -1025 -360 -475
The corrosion potential is a measure of the corrosion tendency of the material with a smaller corrosion potential representing more noble behavior. Therefore, Figure 3.11 and Table 3.3 indicate that the best strand type is the stainless-clad strand and the worst is the hot dip galvanized. These results are valid because they follow the electromotive force (emf) table exactly in that the hot dip galvanized strand containing zinc is the most active, the conventional strand containing iron is slightly more noble than zinc, and finally, the copper-clad and stainless

32
alloys are the most noble. From the results of the grouted strand test, the specimen that performed the best is the stainless-clad strand.

33
Chapter 4. Accelerated Corrosion Testing
4.1 Introduction
The previous project (0-1405) demonstrated a need for early testing of the newly emerging post-tensioning systems15. Because substantial research had already been done in the grouting area, the next step would be to test the strands4,5,16,17. Testing the strands in the same form as they are used in the field was important. That is, they should be encased in grout and exposed to a salt water solution. The goal was not to get exact times to corrosion but to compare the different strand types side by side and rate their relative corrosion resistance. Complete details of the development and manufacturing of the specimens used for testing as well as the test setup and procedures used are found in References 2 and 3. Note that the specimen design and testing were very similar to that used by Schokker5 and Pacheco17. A summary of results are given in Chapter 5.
4.2 Electrochemical Theories
The main electrochemical theories behind the test setup are that of half-cell reactions and mixed potential theory and are summarized by Mac Lean2 and Kalina3. The test setup utilizes electrodes and an application of potential to measure the corrosive properties. The setup is much like that of a battery, where one element is allowed to corrode, undergoing an electrochemical process. The system consists of another electrode that is more stable, and between the two, the potential created from the corroding element can be measured through the knowledge of half-cell reactions.
4.2.1 Half Cell Reactions
Half-cell reactions are made up of two types of reactions: cathodic and anodic. The total reaction, which is made up of the two half-cell reactions, is known as the complete or total electrochemical cell. What makes the half-cell reactions appealing for corrosion monitoring is that it is possible to measure a current flow between them. The first step is to set up the electrodes in the system where the half-cell reactions will occur. The primary electrode in the test setup is the strand encased in grout, also known as the working electrode. In order to measure flow between the electrodes, the half-cell reactions must occur on this working electrode. To achieve this, the second electrode must be naturally more noble. This means that the chosen metal must have a higher emf potential. This electrode is known as the counter electrode and was deemed platinum (Pt) because of its high ranking on the Standard Electromotive Force Potentials Series9.
The half-cell potential (corrosion potential) of the working electrode (strand) can be measured by introducing another electrode into the system. This is known as a reference electrode, and the half-cell potential (corrosion potential) will be measured relative to the known electromotive force potential of the reference electrode. See Figure 4.1 for the system used in testing. An SCE was chosen as the reference electrode, which is a common reference for these tests and is also used in field applications such as Project 4562. The SCE has a potential versus a standard Hydrogen Electrode of +0.241.

34
Figure 4.1: Basic Setup2
4.2.2 Mixed Potential Theory
The theory behind the results of the tests is based on mixed potential theory. The relation of potential and current in a corroding system is not linear but in fact related exponentially9. This is described by the Butler-Volmer equation shown in Equation 4.19.
.
.
Equation 4-1
Where
i = current density (I/A where ‘I’ is the current and ‘A’ is the exposed area to the electrolyte) i0 = exchange current density (current flow per unit area between reactants and products at equilibrium) η = overpotential (η = E – E0, ‘E’ is the applied potential and E0 is the equilibrium potential) βa & βc = Tafel Constants The Tafel constants in this equation are found from the plot between the applied potential and the log of the current density. The Tafel constants are calculated as the slopes of the respective legs on the plot. Figure 4.2 shows the plot with the Tafel constants present.

35
Figure 4.2: Plot of Applied Potential vs. Log of Current Events
When the half-cell reactions, anodic and cathodic, of the working electrode (strand) are combined, the E0 and i0 become Ecorr and icorr, respectively, and there is a mixed result based on the mixed potential theory9. The values of Ecorr and icorr represent the corrosion potential and current density respectively for the combined cell. The plot of the mixed potential is highly ideal and does not occur in the field due to the presence of passivity. A plot of the mixed potential is shown in Figure 4.13.
Figure 4.3: Mixed Potential Plot2

36
4.3 Potentiostatic Accelerated Corrosion Testing
The standard method for testing grout corrosion resistance is potentiostatic accelerated corrosion testing. It basically involves applying a fixed potential of +200 mVSCE to the specimen immersed in a salt solution and waiting for the observed current in the circuit to spike18. The current spike means that corrosion has initiated and the time till this happens is considered the time to corrosion. The grouts are then rated according to their time to corrosion. A typical current vs. time plot for an accelerated corrosion test is shown in Figure 4.4. These tests are very time consuming and can take many weeks before results are known.
Figure 4.4: Typical Plot from a Potentiostatic Accelerated Corrosion Test
The +200 mVSCE was specified by Schokker5, reduced from the initial +600 mVSCE specified by Hamilton4. This value was chosen because it falls in the passive range of steel encased in grout and this is the common range that the prestressing strand is within in service. Also, it was initially thought that the grout needed to be pre-cracked4. Pre-cracking gave the salt solution a quick path to the strand. This idea was dismissed because the pre-cracking merely increased the variability of the test results. Thus, the standard accepted accelerated corrosion tests conducted today require that the specimens be crack and defect free, and the tests must be run at +200 mVSCE until corrosion has initiated. Initially it was thought that this test would be suitable for testing the different strand types. An attempt was made to adapt this potentiostatic accelerated corrosion test to the strand tests. However, in order for the test to be successful, the specimens would have to be run at the same overvoltage. That is, the potential picked for each strand type would have to be the same. Another thought to make the tests successful was to pick a different overvoltage for each strand type that fell within the passive range for that particular strand. However, it would have been very difficult to justify the overvoltage chosen and the results would be very skewed depending on the overvoltage chosen. Thus, potentiostatic testing for different strand types would probably have to be ruled out. To further explore this, it was decided that three potentiodynamic tests for each strand type be run to establish the corrosive behaviors. What was observed was a high variability in the potentiodynamic plots. A potentiodynamic plot showing one test from each strand type is shown in Figure 4.5. From this initial test, it was established that the potentiostatic test would not be a feasible option and would not give accurate results. The main reason was that there was no single potential that fell within each strands passive range. Also, there would be no justification for picking a different potential for each strand type because the results would be highly dependent on the potentials chosen.
Current, i
Time, ttime to corrosion, tcorr

37
The potentiostatic corrosion tests were thereby discarded as an equitable form of comparing the different strand types.
Figure 4.5: Potentiodynamic Plots for All Strand Types
4.4 Linear Polarization Resistance Corrosion Testing
Schokker had submitted a ballot proposal to PTI (Post-Tensioning Institute) for a change to the accepted accelerated corrosion testing method19. It would allow the accelerated corrosion tests to be done using the linear polarization resistance technique. This technique will greatly reduce the time required for testing grouts. A correlation between the polarization resistance, Rp, for the specimens measured using linear polarization resistance test and the time to corrosion, tcorr was found by Pacheco17. It is a linear relation where tcorr = 1.25 Rp, in which tcorr is in hours and Rp is in kΩcm2. Also noted was that this method works well for grouts with low to average corrosion protection17. The linear polarization resistance (LPR) test stems from polarization resistance theory in which the first part of the curve is linear. The test is similar to that of the potentiodynamic test described in the next section, except the applied potential range is less, usually around +/- 20 mV. This range does not cause damage because the specimen is not polarized. This allows the specimen to be retested if desired. The polarization resistance Rp is the slope of the initial linear portion of the overvoltage versus current plot9. This plot is found in Figure 4.6.

38
Figure 4.6: Plot of Linear Polarization Resistance2
Rp is defined as the change in overvoltage divided by the change in current of this initial portion, independent of how linear it actually is. This means that the values are chosen at the end of the proposed linear region even if the actual curve is not particularly linear. Also, the polarization resistance is inversely proportional to the corrosion rate which is dependent upon icorr. This relationship can be seen in Equation 4.2.
.
Equation 4-2
Note that Rp is also a function of the Tafel constants, which typically range between 112 and 224 mV2. Due to the different materials of the specimens being tested, the Tafel constants had to be calculated from the potentiodynamic plots of Mac Lean’s2 work. From work done by Pacheco17, the time to corrosion is related to the polarization resistance by tcorr = 1.25Rp, where tcorr is in hours, and Rp is in kΩcm2. This relationship will be used in the results to find the relative time to corrosion among the different strand types.
4.5 Potentiodynamic Accelerated Corrosion Testing
The theory behind potentiodynamic testing is that the potentials are applied in steps, and these steps depend on the specimen and what range of the curve is needed. At each specified step, the current is measured from the system. With these recordings, a plot of applied voltage versus current can be completed as shown in Figure 4.7.

39
Figure 4.7: Plot of Applied Voltage vs. Log of Current from Potentiodynamic Test14
Many values can be obtained from this plot. The point on the plot where the legs begin is the point at which corrosion occurs. The values obtained are potential at corrosion, Ecorr, and time to corrosion, icorr. From the slopes of the legs, the Tafel constants, βa and βc, are calculated9. The plot must be in semi-log to obtain the Tafel constants. The results from the test are from all the different ranges of passivity, which allows a complete description of the behavior and makes this test very appealing. Figure 4.15 shows a potentiodynamic plot of each of the strand types with uncracked grout. Large differences in icorr are obvious particularly with the epoxy-coated and galvanized strands.

40
Figure 4.8: Potentiodynamic Plots of all Strand Types
4.6 Testing Plan
Six different strand types were tested. In Phase I2, for each strand type, 10 potentiodynamic and 10 linear polarization resistance tests were performed with uncracked grout. In Phase II3, for each strand type three potentiodynamic and three linear resistance tests were performed but with cracked grout. The same specimens were used for both the linear polarization tests and the potentiodynamic tests. This was possible because the potential range that the specimens were exposed to during the linear polarization tests is very small, ±20 mV. This range does not polarize and damage the specimens, so it was possible to use the same specimens to conduct the potentiodynamic tests once the linear polarization tests had been completed. A list of the strands tested, including their diameters, is given in Table 4.1. Note that only one conventional strand type was used as opposed to the two used for tension testing. Because most standard conventional strands have similar chemical properties, it was decided that only one was needed for comparison. The 0.6 in. strand was chosen because it was a much newer strand and did not have visible signs of corrosion on its surface due to exposure to the atmosphere.

41
Table 4.1: Testing Plan
Type Nominal Dia. (in)
Area (in2)
Strand Designations
Epoxy Coated 0.5 0.153 EC
Conventional 0.6 0.220 CN
Hot Dip Galvanized 0.5 0.152 GC
Stainless Clad 0.6 0.217 SC
Stainless Steel 0.6 0.221 SS
Copper Clad 0.5 0.144 CC
4.7 Specimen Design
The design of the specimens is very similar to that of Pacheco17. However, to accommodate the different strand sizes, some modifications were needed to the specimens used in the standard accelerated corrosion tests. The specimens were designed to expose a fixed area of grout to the electrolyte, salt solution. Clear tubing was used so that the inside was visible while casting, which helped prevent defects in the area that would be exposed. Defects may greatly affect results in the potentiostatic tests because the tests are based on how long it takes for the electrolyte to make it through the grout cover to the strand surface. The linear polarization resistance and the potentiodynamic tests are not as affected by defects and small defects can be tolerated. The two specimens are shown in Figure 4.3. Complete details are given in References 2 and 3.
Figure 4.9: Specimen Design
One of the strand types had to be prepared a little differently. The flow-filled epoxy-coated strand is completely coated; if the coating is not damaged, there will be no chance for
1 2
1 2
3
3 2
2
4
4
A
B
A: specimen for 0.5 in strands 1. 25.4 mm (1 in) PVC end cap 2. Clear PVC tubing: 50.8 mm (2 in) in end cap & 101.6 mm (4 in) 3. Exposed Grout: 25.4 mm (1 in) dia., length 90 mm (3.5 in) 4. 12.7 mm (0.5 in) prestressing strand: length 305 mm (12 in)
B: specimen for 0.6 in strands
1. 25.4 mm (1 in) PVC end cap 2. Clear PVC tubing: 50.8 mm (2 in) in end cap & 101.6 mm (4 in) 3. Exposed Grout: 28 mm (1.1 in) dia., length 81.3 mm (3.2 in) 4. 15.2 mm (0.6 in) prestressing strand: length 305 mm (12 in)
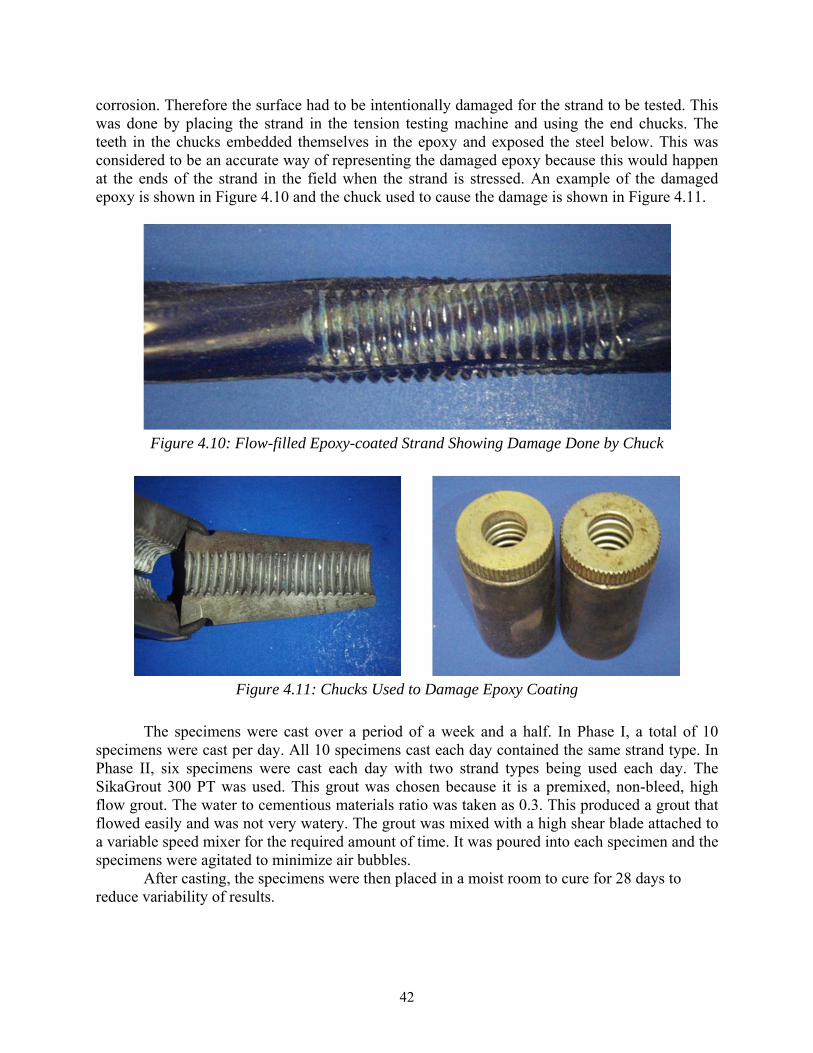
42
corrosion. Therefore the surface had to be intentionally damaged for the strand to be tested. This was done by placing the strand in the tension testing machine and using the end chucks. The teeth in the chucks embedded themselves in the epoxy and exposed the steel below. This was considered to be an accurate way of representing the damaged epoxy because this would happen at the ends of the strand in the field when the strand is stressed. An example of the damaged epoxy is shown in Figure 4.10 and the chuck used to cause the damage is shown in Figure 4.11.
Figure 4.10: Flow-filled Epoxy-coated Strand Showing Damage Done by Chuck
Figure 4.11: Chucks Used to Damage Epoxy Coating
The specimens were cast over a period of a week and a half. In Phase I, a total of 10 specimens were cast per day. All 10 specimens cast each day contained the same strand type. In Phase II, six specimens were cast each day with two strand types being used each day. The SikaGrout 300 PT was used. This grout was chosen because it is a premixed, non-bleed, high flow grout. The water to cementious materials ratio was taken as 0.3. This produced a grout that flowed easily and was not very watery. The grout was mixed with a high shear blade attached to a variable speed mixer for the required amount of time. It was poured into each specimen and the specimens were agitated to minimize air bubbles. After casting, the specimens were then placed in a moist room to cure for 28 days to reduce variability of results.

43
4.8 Testing Equipment Setup/Test Procedure
In Phase II the specimens3 were pre-cracked to allow the electrolyte to reach the strands easier. The device used for pre-cracking the specimens is shown in Figure 4.12. The device applies a uniform moment across the exposed grout region. The two supports for the exposed grout region (white plate and blades) are lowered down gradually using the all-threaded bolt. The system is deformation controlled, which allows for a uniform force and moment across the section. As a result, the variability in cracking is small among all the sections. The testing done at The Pennsylvania State University by Schokker and Pacheco18 was done using equipment supplied by Gamry Instruments. The equipment was highly recommended for its simplicity and software. So for the testing done on this project, the same type of equipment was used. The test setup used was the same as that used for performing a standard accelerated corrosion test. The test setup consists of a potentiostat connected to a computer and a standard corrosion cell. In this case the potentiostat was built into the computer. The potentiostat was supplied by Gamry Instruments and was installed in a HP Compaq computer. The Series G 750™ Potentiostat/Galvanostat/ZRA was installed and setup by Gamry Instruments. Also supplied by Gamry was an Electrochemical Multiplexer that is used to perform multiple tests at a time. The computer and the multiplexer are shown in Figure 4.13.
Figure 4.12: Pre-Cracking Device
Threaded Bolt
Top Reaction
Bottom Reaction

44
Figure 4.13: Computer, Potentiostat, and Multiplexer
The potentiostat is connected to a standard corrosion cell (Figure 4.14) used for corrosion testing. The cell is made up of three different electrodes immersed in an electrolyte, all contained in a beaker. The beaker is also covered to prevent outside elements from falling into the beaker and to support the reference and counter electrodes. There is a working electrode (strand specimen), a counter electrode (platinum-coated wire), and a reference electrode (SCE). The electrolyte is a 5% NaCl solution.

45
Figure 4.14: Corrosion Cell
The working electrode is the specimen being tested. In this case it is the prestressing strand encased in grout. The counter electrode was supplied by Anomet Products & Supercon Inc. It was a 0.05 in. diameter platinum clad wire. The reference electrode was an SCE manufactured by Fisher Scientific. It was a plastic, gel-filled electrode that does not need maintenance. As stated earlier, the linear polarization resistance tests were done before the potentiodynamic tests. Table 4.2 outlines the variables used in each of these tests.
Table 4.2: Testing Variables
Linear Polarization Resistance Potentiodynamic Initial E (mV) vs. Eoc -20 -500 Final E (mV) vs. Eoc 20 500
Scan Rate (mV/s) 0.5 0.5 Sample Period (s) 0.2 5

46
Once all the specimens had cured for 28 days in the moist room, they were removed for testing. The PVC casing was removed from the exposed area. Figure 4.15 shows an uncracked Phase I specimen before and after the casing was removed.
Figure 4.15: Specimen before and after Casting Was Removed
4.9 Results of Accelerated Active Corrosion Testing
Detailed plots of the results of the linear potential resistance tests and the potentiodynamic tests are given in References 2 and 3, which are available at no charge on Ferguson Structural Engineering Laboratory’s website (http://fsel.engr.utexas.edu/). The relative results of the uncracked grout (Phase I)2 specimen and the cracked grout (Phase II)3 specimens are given here.
4.9.1 Summary Phase I—Uncracked Grout Specimens
The conventional strand was used as a base value for comparison of the other strand types. Therefore, all the values were standardized versus the conventional value. A summary of the linear polarization resistance results is shown in Table 4.3.
Table 4.3: Summary of the Linear Polarization Resistance Results for all Phase I (Uncracked)
Conventional Copper
Clad
Flow Filled Epoxy Coated
Hot Dip Galvanized
Stainless Clad
Stainless Steel
Avg Polarization Resistance, Rp
AVG (kΩcm2) 10.82 11.68 1000 20.06 92.72 100.5
Vs. Conventional 1.00 1.08 92.4 1.85 8.57 9.28 Avg Corrosion Potential, Ecorr
AVG (mV vs. ref) -601 -298 -409 -687 -201 -243

47
Figure 4.16: Bar Chart Showing Comparison of Times to Corrosion (Phase I)2—Uncracked
The time to corrosion is not known for the conventional strand so a time to corrosion value cannot be listed for each strand type. They can only be compared side by side with the other strand types. Figure 4.16 clearly indicates that all the strand types tested performed better than the conventional base strand. The y-axis maximum value was capped at 15 to better show the comparison between all the strand types. The flow-filled epoxy-coated bar on the chart is therefore not shown full height to 92. The copper cladding does not help very much in prolonging the time till corrosion initiates. The hot dip galvanizing process delays the onset of corrosion but not by much; it appears to be twice as long as conventional. The stainless-clad and solid stainless steel performed very similarly, which was expected. For both, corrosion took about nine times as long to initiate as the conventional strand. The flow-filled epoxy-coated result is much larger than all the other results. The smaller area that was exposed to the grout is the major factor. This result only applies to ends where the strand is gripped and also where there are tears in the epoxy coating. If the epoxy coating is not damaged, there would be no possibility for corrosion initiating.
4.9.2 Summary Phase II—Cracked Grout Specimens
The Phase II results with the cracked grout specimens are given in Table 4.4 and the trends are shown in Figure 4.17. Very surprisingly and in contradiction to the Phase I (uncracked) results, neither the galvanized coating nor the copper cladding protected the strand as compared to the conventional strand. The source of this discrepancy is unknown but it is disconcerting. Both the stainless steel and stainless cladding provided very substantial protection in this series.

48
Table 4.4: Linear Polarization Resistance Results for all Phase II (Cracked)
CN CC GV SC SS
Polarization Resistance, Rp (kΩcm2)
Normal 10.82 11.68 20.06 100.50 92.72
Pre-Cracked 22.48 3.68 2.69 93.37 89.59
Rp vs. CN Normal 1 1.08 1.85 9.29 8.57
Pre-Cracked 1 0.16 0.12 4.15 3.99
Corrosion Potential, Ecorr (mV vs Ref)
Normal -601 -298 -687 -201 -243
Pre-Cracked -333 -343 -805 -258 -274
Figure 4.17: Times to Corrosion for Pre-Cracked Specimens
The results show that two clusters of results. The copper-clad and the hot dip galvanized strands performed very similarly, having a time to corrosion that is about 15% that of conventional strand while stainless-clad and stainless steel strands performed similarly, having a time to corrosion that is four times greater than that of conventional strand. The stainless-clad and stainless steel strands performed as expected, showing the best corrosion resistant properties. The copper-clad and hot dip galvanized strands did not perform as expected, demonstrating much worse corrosion properties. In Chapter 5, Figure 5.414 displays the results of Mac Lean’s work, presenting the relative time to corrosion of normal specimens that are not pre-cracked.
The general trend is that if a specimen had a higher polarization resistance, it also had a lower corrosion potential. All the specimens followed this trend, which helps to validate the results. When looking at the normalized values of the polarization resistance, it is clear that the

49
copper-clad and hot dip galvanized strand results did not follow that of the Phase I (uncracked) results. Not only did the results show a worse time to corrosion, but they are also considerably lower. Also, the hot dip galvanized strand was worse than the copper-clad strand for the pre-cracked specimen, which did not agree with Phase I.
When comparing the normalized results of the stainless-clad and stainless strands, it is seen that the trend of the pre-cracked specimens agreed with those of Phase I. While the pre-cracked specimens have normalized values less than half of the respective values of the uncracked tests, they still follow the overall trend. The stainless-clad strand also outperformed the stainless strand by a small amount which agrees well with Phase I.

50

51
Chapter 5. Test Indications and Conclusions
5.1 Major Trends
The results of each test show major trends among the strand types. For each test conducted, the trends of the strand types are summarized herein. An examination of the results indicates definite trends in strand corrosion resistance.
5.1.1 Large-scale Exposure Beams Half-cell Data
The large-scale exposure beams of Project 4562 undergo a wet and dry cycle of exposure to a chloride solution. Every month, half-cell readings are taken of the specimen to try and predict the corrosion activity in the beam. A ranking of the most and least likely corroded beams was tabulated by Kalina3 as shown in Tables 5.1 and 5.2.
Table 5.1: Least Corroded Specimens
Beam # Duct*Type Tendon** Type 1) 5.3 P2 SS 2) 5.2 P2 SC 3) 7.1 FE CN 4) 4.2 P1 SS 5) 2.4 P1 CC 6) 3.3 P2 CC 7) 3.2 P2 GV 8) 3.4 P1 GV 9) 3.1 P2 CN
*FE is fully encapsulated, GV is galvanized, P1is one-way ribbed plastic, P2 is two-way ribbed plastic **CC is Copper Clad, CN is Conventional, GV is Galvanized, SS is Stainless Steel, SC is Stainless Clad
Table 5.2: Most Corroded Specimen
Beam # Duct Type Tendon Type 1) 7.3 FE GV 2) T.1 GV CN 3) 2.2 GV GV 4) 1.4 GV CN 5) 1.2 GV CC 6) 1.1 GV CN
These two tables indicate that the duct most likely to corrod is the hot dip galvanized and
least likely to corrode is the two-way ribbed plastic. When considering strands, the most likely corroded are the conventional and the hot dip galvanized strands. The least likely corroded are split between the stainless steel and stainless-clad strands. The copper-clad strand has a result that puts it somewhere in between these two clusters.

52
5.1.2 Exposed Strand Test
The exposed strand test involved the bare strands undergoing a wet and dry cycle where the strands were exposed to a chloride solution. The test was conducted for 6 months where a weight loss was calculated for each strand. Also, a monthly corrosion rating was associated with each strand. From these results, the strands were normalized and compared to the epoxy-coated strand, which served as the base strand. A comparison of the average six-month rating and average weight loss are shown in Figures 5.1 and 5.2 respectively.
Figure 5.1: Six-month Rating vs. Epoxy-coated Strand

53
Figure 5.2: Average Weight Loss vs. Epoxy Coated
Obviously the best strand type is the epoxy-coated, and the worst is the conventional strand. This result was expected. The next best strands are the stainless-clad and stainless steel, which exhibit similar properties. The copper-clad and hot dip galvanized exhibited some variability among the different systems with the copper-clad strands having a smaller weight loss than the stainless-clad and stainless steel strands, but a larger corrosion rating at 6 months. The hot dip galvanized strands performed better than the conventional strand in the average six-month rating but showed more weight loss. From these observations, the epoxy-coated strand performed best followed by the stainless-clad and stainless steel. The copper-clad strands performed slightly better than the hot dip galvanized due to the second best weight loss. Clearly, the conventional strand is the worst strand in both cases.
5.1.3 Grouted Strand Test
The grouted strand test involved the strands being encased in grout inside a PVC tube with both bare ends epoxied to help prevent corrosion. The specimens were immersed in a chloride solution and monitored for potential over time as they electrochemically produce a potential. The potential corrosion is described as the potential versus time for the first week where the plots are constant. The corrosion potential is then used as a comparison to verify which strands have the best corrosion resistance. A lower value of corrosion potential corresponds to better resistance properties. Figure 5.3 shows the potential versus time of the representative specimens of each strand type while Table 5.3 has the corresponding corrosion potentials of these representative specimens.

54
Figure 5.3: mVsce vs. Time for the Representative Specimens
Table 5.3: Corrosion Potential of Representative Specimens
CN CC GV SC SS Ecorr (mVSCE)
-875 -370 -1025 -360 -475
Figure 5.3 and Table 5.3 indicate that the best specimen is the stainless-clad strand, and
the worst specimen is the hot dip galvanized strand. The copper-clad strand exhibits similar behavior to the stainless-clad strand, and the stainless steel strand follows closely behind these. The conventional strand is slightly better than the hot dip galvanized strand.
5.1.4 Accelerated Active Corrosion Test
The accelerated active corrosion test specimens are very similar to the grouted test specimens except the bare strands are left out of the specimen to be able to attach to the electronic equipment used in analyzing them. The tests conducted on the specimens are the potentiodynamic test used to gather the Tafel constants and the linear polarization resistance test used to gather the polarization resistance of each specimen. The polarization resistance is then used to look at the relative time to corrosion against the base conventional strand. Two methods

55
were used during the testing: (1) the normal exposed area method carried out by Mac Lean2 (the Phase I specimens) and (2) the method of pre-cracking the exposed area to allow the chloride solution to penetrate the grout faster used by Kalina3 (the Phase II specimens). The relative times to corrosion of the normal and pre-cracked sections were analyzed to determine the trend associated with the testing sequence. Table 5.4 shows a side-by-side comparison of the results between the normal and pre-cracked specimens. The normal specimens of Phase I are shown in Figure 5.4 and the pre-cracked specimens of Phase II in Figure 5.5.
Table 5.4: Comparative Results of Linear Polarization Resistance Tests
CN CC GV SC SS EC
Polarization Resistance, Rp (kΩcm2)
Phase I Normal
10.82 11.68 20.06 100.50 92.72 1000
Phase II Pre-Cracked
22.48 3.68 2.69 93.37 89.59 144163
Rp vs CN
Phase I Normal
1 1.08 1.85 9.29 8.57 92.42
Phase II Pre-Cracked
1 0.16 0.12 4.15 3.99 6413
Corrosion Potential, Ecorr (mV vs Ref)
Phase I Normal
-601 -298 -687 -201 -243 -409
Phase II Pre-Cracked
-333 -343 -805 -258 -274 -207
Figure 5.4: Comparison of Times to Corrosion for Normal Specimens2
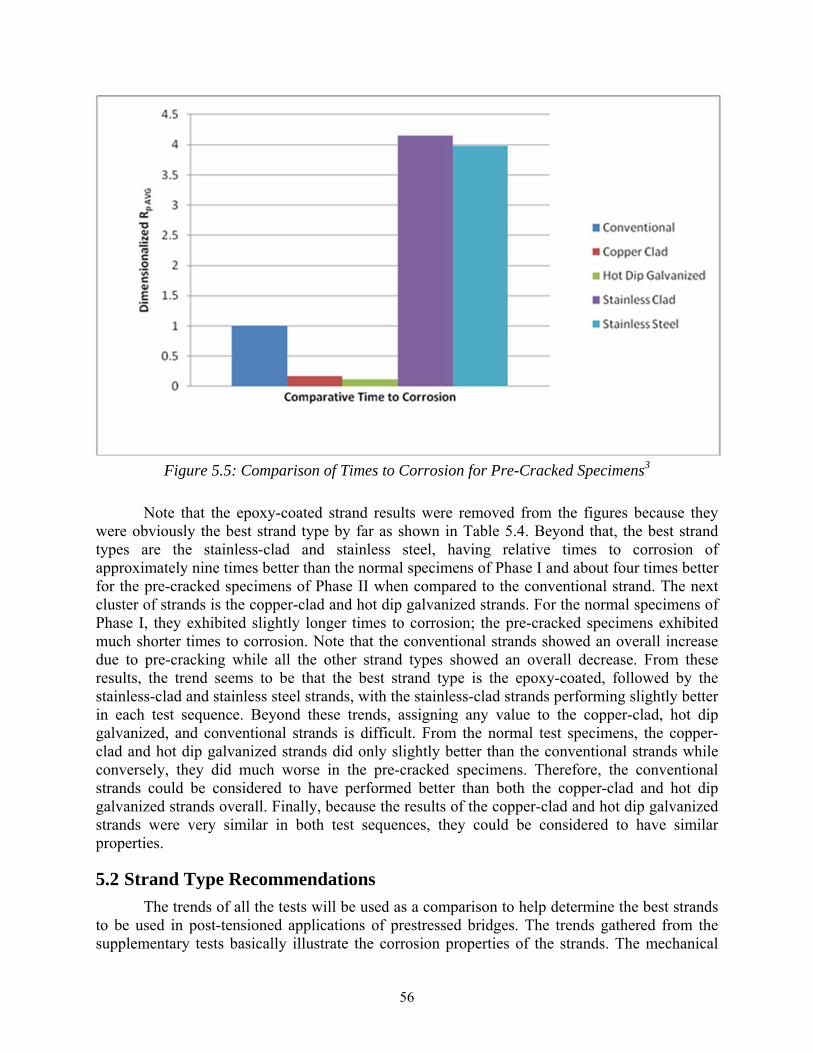
56
Figure 5.5: Comparison of Times to Corrosion for Pre-Cracked Specimens3
Note that the epoxy-coated strand results were removed from the figures because they were obviously the best strand type by far as shown in Table 5.4. Beyond that, the best strand types are the stainless-clad and stainless steel, having relative times to corrosion of approximately nine times better than the normal specimens of Phase I and about four times better for the pre-cracked specimens of Phase II when compared to the conventional strand. The next cluster of strands is the copper-clad and hot dip galvanized strands. For the normal specimens of Phase I, they exhibited slightly longer times to corrosion; the pre-cracked specimens exhibited much shorter times to corrosion. Note that the conventional strands showed an overall increase due to pre-cracking while all the other strand types showed an overall decrease. From these results, the trend seems to be that the best strand type is the epoxy-coated, followed by the stainless-clad and stainless steel strands, with the stainless-clad strands performing slightly better in each test sequence. Beyond these trends, assigning any value to the copper-clad, hot dip galvanized, and conventional strands is difficult. From the normal test specimens, the copper-clad and hot dip galvanized strands did only slightly better than the conventional strands while conversely, they did much worse in the pre-cracked specimens. Therefore, the conventional strands could be considered to have performed better than both the copper-clad and hot dip galvanized strands overall. Finally, because the results of the copper-clad and hot dip galvanized strands were very similar in both test sequences, they could be considered to have similar properties.
5.2 Strand Type Recommendations
The trends of all the tests will be used as a comparison to help determine the best strands to be used in post-tensioned applications of prestressed bridges. The trends gathered from the supplementary tests basically illustrate the corrosion properties of the strands. The mechanical

57
properties of the strand types were determined, as discussed in Chapter 2 and shown here in Table 5.5.
Table 5.5: Tensile Strength
Type Nominal Diameter
(in)
Area (in2)
Breaking Strength
(kips)
Met Gr. 250 Requirement
Met Gr. 270 Requirement
Conventional 0.6 0.217 61.5 Yes Yes Epoxy Coated 0.5 0.153 43.7 Yes Yes
Hot Dip Galvanized
0.5 0.153 40.9 Yes No
Copper Clad (Nominal Area)
0.5 0.144 25.9 No No
Copper Clad (Steel Area)
0.438 0.108 25.9 No No
Stainless Clad (Nominal Area)
0.6 0.217 57.5 Yes No
Stainless Clad (Steel Area)
0.5 0.153 57.5 Yes Yes
Stainless Steel 0.6 0.217 48.9 No No
Table 5.5 makes it clear that the conventional and epoxy-coated strands meet both Grade 250 and Grade 270 requirements for ultimate strength while the copper-clad and the stainless steel strands do not meet either of the requirements. The hot dip galvanized strands meet the Grade 250 requirement but not the Grade 270 requirement. Note that the stainless-clad strand meets both requirements when the stainless cladding is not considered but does not meet the Grade 270 requirement when the cladding is considered. Because the stainless-clad is a structural metal, it will be considered in the final area, which means the stainless-clad strands meet only the Grade 250 requirement. A ranking system of the strands was created for each test sequence based on corrosion resistance properties. Table 5.6 outlines these rankings with 1 having the best corrosion resistance properties and 6 having the worst. Note that epoxy-coated strands were not used in the large-scale exposure beams and will not be included in the ranking. Also note that the epoxy-coated strands were excluded from the grouted strand test because of the knowledge that they would outperform the other types.

58
Table 5.6: Strand Rankings Based on Corrosion Resistance
Test Best
1 2 3 4 5
Worst 6
Half-Cells SS SC CC GV CN N/A Exposed Strand
EC SC SS CC GV CN
Grouted Strand
SC CC SS CN GV N/A
Accelerated (Normal)
EC SC SS GV CC CN
Accelerated (Pre-Cracked)
EC SC SS CN CC GV
Overall EC SC SS CC GV CN
The overall rankings in Table 5.6 present the final order of strand types in terms of
corrosion resistance. As was expected, epoxy-coated strands performed the best and conventional strands the worst. The next cluster present in all the trends is the stainless-clad and stainless steel strands, with stainless-clad performing better than stainless steel. The final cluster of copper-clad and hot dip galvanized was also paired together throughout the trends with copper-clad performing better. When combining the rankings based on corrosion resistance with the values of ultimate strength, the overall rankings are not the same, as some of the strands are not able to meet any of the mechanical properties. This refers to the stainless steel and copper-clad strands, which perform well in corrosion resistance but not in mechanical strength. Including mechanical strength requirements casts the results in a different light, as shown in Table 5.7. If Grade 270 requirements are needed, then the only two strands available to use are the conventional and the epoxy-coated strand. In this case, the epoxy-coated strand is the obvious choice for corrosion resistance. If Grade 250 requirements are needed, then the stainless-clad and hot dip galvanized strand can also be considered. Again, the epoxy-coated strand is the first choice followed by stainless-clad, then hot dip galvanized, and finally conventional strand. Therefore, based on all the tests including the mechanical tests, clearly the epoxy-coated strand outperforms the others in corrosion resistance and is the best choice for long life in very aggressive environments in the post-tensioned application. Relative cost comparisons will be given in a later report in this series.
Table 5.7: Strand Rankings Based on both Corrosion Resistance and Satisfaction of Mechanical Resistance
Grade Best
1 2 3
Worst 4
250 EC SC GV CN
270 EC CN - -
59
5.3 Conclusions
The tests were conducted on large-scale beam specimens to gain insight into the behavior of the strands before the final autopsy. The previous section elaborates on the major trends of the tests and gives them a ranking. Following are some final conclusions from these tests that will help predict the strand behavior of the large-scale beams:
The epoxy-coated strand dominated the others in corrosion resistance along with meeting all industry requirements for mechanical properties.
The conventional strand was the worst of all types in resisting corrosion but met all industry requirements for mechanical properties.
The stainless-clad and stainless steel strands behaved similarly to one another throughout all the corrosion tests, performing very well and only slightly behind the epoxy-coated strand.
The stainless steel strand did not meet any of the requirements for mechanical properties, making it insufficient. Further research must be done to improve these aspects.
The stainless-clad strand met the Grade 250 but not the Grade 270 requirements for mechanical properties, making it a valid choice in a field application.
The copper-clad and hot dip galvanized strand followed similar trends throughout the corrosion tests, but overall, the copper-clad strand performed better. Both strand types performed worse than the stainless-clad and stainless steel strands.
The copper-clad strand did not meet any of the requirements for mechanical properties, making it insufficient. Further research must be done to improve these aspects. Before the testing started, the manufacturer had indicated that a structural grade strand could be produced if enough demand was present.
The hot dip galvanized strand met the Grade 250 but not the Grade 270 requirements for mechanical properties.

60
61
References
1. Ahern, M.E. (2005). Design and Fabrication of a Compact Specimen for Evaluation of Corrosion Resistance of New Post-Tensioning Systems. MSc. Thesis, The University of Texas at Austin, The Ferguson Structural Engineering Laboratory, http://fsel.engr.utexas.edu/.
2. Mac Lean, S. (2008). Comparison of the Corrosion Resistance of New and Innovative
Prestressing Strand Types used in the Post-Tensioning of Bridges. MSc. Thesis, The University of Texas at Austin. The Ferguson Structural Engineering Laboratory, http://fsel.engr.utexas.edu/.
3. Kalina, R.D. (2009) Comparative Study of the Corrosion Resistance of Different
Prestressing Strand Types for Use in Post-Tensioning of Bridges, MSc. Thesis, The University of Texas at Austin, The Ferguson Structural Engineering Laboratory, http://fsel.engr.utexas.edu/.
4. Hamilton, H.R. (1995) Investigation of Corrosion Protection Systems for Bridge Stay
Cables. PhD Dissertation, The University of Texas at Austin.
5. Schokker, A.J. (1999). Improving Corrosion Resistance of Post-Tensioned Substructures Emphasizing High Performance Grouts. PhD Dissertation, The University of Texas at Austin.
6. Turco, G.P. (2007). Durability Evaluation of Post-Tensioned Concrete Beam
Specimens after Long-Term Aggressive Exposure Testing. MSc. Thesis, The University of Texas at Austin.
7. Turco, G.P., Salas, R.M., Schokker, A.J., West, J.S., Breen, J.E., and Kreger, M.E.
(2007). Project Technical Report 0-4562-2, Durability Evaluation of Post-Tensioned Concrete Beam Specimens after Long-Term Aggressive Exposure Testing. Center for Transportation Research, The University of Texas at Austin.
8. West, J.S. (1999). Durability Design of Post-Tensioned Bridge Substructures. PhD
Dissertation, The University of Texas at Austin.
9. Jones, D.A. (1996). Principals and Prevention of Corrosion. Prentice Hall (Second Edition).
10. Collins, M.P., and Mitchell, D. (1997). Prestressed Concrete Structures. Response
Publications.
11. ASTM A 416/A 416M (2006). Standard Specification for Steel Strand, Uncoated Seven-Wire for Prestressed Concrete. American Society for Testing and Materials, West Conshohocken, PA.

62
12. ASTM A 370 (2005). Standard Test Methods and Definitions for Mechanical Testing of Steel Products. American Society for Testing and Materials, West Conshohocken, PA.
13. ASTM A 931 (2002). Standard Test Method for Tension Testing of Wire Ropes and
Strand. American Society for Testing and Materials, West Conshohocken, PA.
14. Salcedo-Rueda, E., Schokker, A.J., Breen, J.E., and Kreger, M.E. (2003). Project Summary Report, Bond and Corrosion Studies of Emulsifiable Oils Used for Corrosion Protection in Post-Tensioned Tendons.
15. Salas, R.M., Schokker, A.J., West, J.S., Breen, J.E., and Kreger, M.E. (2004). Project
Summary Report 0-1405-S, Durability Design of Post-Tensioned Bridge Substructure Elements. Center for Transportation Research, The University of Texas at Austin.
16. Koester, B.D. (1995). Evaluation of Cement Grouts for Strand Protection using
Accelerated Corrosion Tests. MSc. Thesis, The University of Texas at Austin.
17. Pacheco, A.R. (2003). Evaluating the Corrosion Protection of Post-Tensioning Grouts: Standardization of an Accelerated Corrosion Test. PhD Dissertation, The Pennsylvania State University.
18. Pacheco, A.R., Schokker, A.J., and Hamilton, H.R. (2006). Development of a
Standard Accelerated Corrosion Test for Acceptance of Post-Tensioning Grouts on Florida. University of Florida.
19. Schokker, A.J. (2007). Modifications to the PTI Specification for Grouting of Post-
Tensioned Structures. PTI Ballot Proposal.