comparative multi-omics for generating new disease
TRANSCRIPT

©2016 MFMER | slide-1
Comparative Multi-omics for Generating New Disease Insights and Novel Target Discovery Nilüfer Ertekin-Taner, M.D., Ph.D. Professor of Neurology and Neuroscience Mayo Clinic Florida NIA-AA Symposium Enabling Precision Medicine for Alzheimer’s Disease Through Open Science
July 19th, 2018
©2016 MFMER | slide-2
Ertekin-Taner Lab
Health Sciences Research
Research IT
Mariet Allen* Minerva Carrasquillo*
Xue Wang* Thuy Nguyen Sarah Lincoln Kim Malphrus Joseph Reddy
Samantha Strickland Tulsi Patel
Olivia Conway Helene Moral
Jez Burgess Lili N’songo
Michaela Kachadoorian Joanna Siuda
Morgane Corda Jenny Bredenburg
Nji Nijkem Jens Watzlawik
Charlotte Ho Xin Que
Yan Asmann Julia Crook Dan Serie
Curt Younkin Andy Cook
Steven G. Younkin Dennis Dickson
Neil Graff-Radford Ronald C. Petersen
Neuroscience/ Neurology
AMP-AD U01 University of Florida
Todd Golde Jada Lewis
Paramita Chakrabarty Yona Levites
Institute for Systems Biology
Nathan Price Cory Funk
Hongdong Li
Tom Beach (Banner)
Acknowledgements
M2OVE-AD RF1 Guojun Bu
Kejal Kantarci Alfredo Quiñones-Hinojosa
©2016 MFMER | slide-3
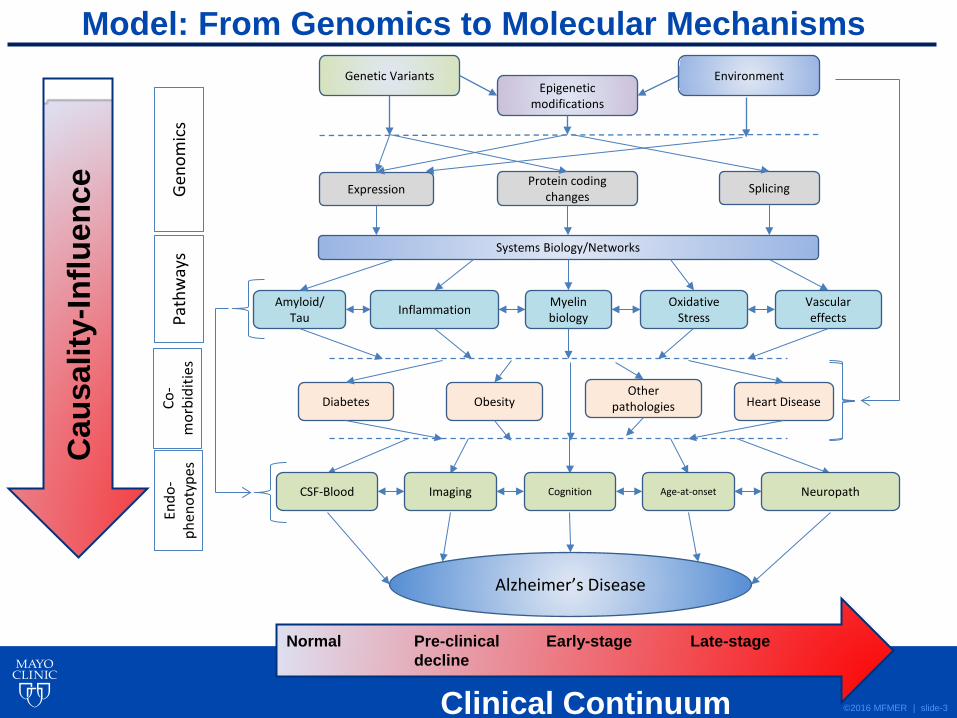
Model: From Genomics to Molecular Mechanisms Genetic Variants Environment
Epigenetic modifications
Expression Splicing Protein coding changes G
enom
ics
Amyloid/ Tau Inflammation Vascular
effects
Systems Biology/Networks
Oxidative Stress
Myelin biology Pa
thw
ays
Diabetes Heart Disease Obesity Other
pathologies Co-
mor
bidi
ties
CSF-Blood Imaging Cognition Age-at-onset Neuropath
Endo
-ph
enot
ypes
Normal Pre-clinical Early-stage Late-stage decline
Clinical Continuum
Cau
salit
y-In
fluen
ce
Alzheimer’s Disease

©2016 MFMER | slide-4
Original Aim 1: To detect transcript alterations in innate immunity genes
in mice and humans.
-RNAseq human and mice brains. -Differential expression. -Protein/Nanostring validation -Expression quantitative trait loci (eQTL).
Original Aim 2: To assess AD risk conferred by variants in innate
immunity genes from Aim 1.
-Test eQTL for effects on AD risk -Functionally annotate AD risk variants for effects on gene expression.
-Transcription factor networks.
Original Aim 3: To manipulate innate immune states in vivo.
-rAAV based genetic manipulation in mice and cells.
-Evaluate Aß, tau, neurodegeneration outcomes in model systems.
Original Aim 4: To determine
outcome of gene manipulation in wild type mice.
Behavioral studies in nontransgenic mice.
• Pathologic specificity (Tau vs. Amyloid), • Regional specificity (CER vs. TCX) • Temporal change (Mouse expression) • Cell composition dependent vs. not • Differential expression, intron retention, networks • Integrative –omics analysis (expression, genetic variants, protein)
Aims: AMP-AD U01 AG046193
Amyloid beta TauAD yes yesPSP no yesPathologic Aging yes noControl no no
PathologyDiagnosis

Todd Golde, UF
Approach: Target Discovery

©2016 MFMER | slide-6
Data Generation
rTG4510: n=36 P301L: n=24 APPPS1: n=24 CRND8: n=88
AD PSP Path Aging Control TotalMayo Clinic Brain Bank (Dennis Dickson) 84 84 0 31 199BannerSunHealth (TomBeach) 0 0 29 49 78Mayo Clinic Brain Bank (Dennis Dickson) 86 84 0 34 204BannerSunHealth (TomBeach) 0 0 28 46 74
DiagnosisTissue RegionTissue Source
TCX
CER
Human RNAseq: n= 555 Mouse RNAseq: n= 172
Trizol+Qiagen RNeasy Dnase + Agilent QC
University of Florida Mayo Clinic Florida
Mayo Clinic Medical Genome Facility: TruSeq Library + Illumina HiSeq2000 (101 bp, PE, 3 samples/lane)
ISB - SNAPR alignment - Filter by Phred scores -
normalize to CPM
Mayo – MAPRSeq Pipeline – CQN normalization –
Variant calls
Institute for Systems Biology
Mayo Clinic Florida

©2016 MFMER | slide-7
Data Analysis
Data Processing Data QC and sources of variation
Profiling (DEG) Human and mouse brain transcript profiling Cell type composition analyses
Networks Co-expression networks TReNa Intron Retention
Omics Integration eQTL WGS

Human –Omics Data
R01 AG032990 P50 AG0016574 R01 NS080820
U01 AG046139
Carrasquillo et al., Nat Gen, 2009.
Zou et al., PLoS Genet, 2012.
Allen et al., Neurol Genet, 2015; Acta Neuropath, 2016.
• Gene expression on >1,300 brain samples (AD, PSP, controls).
• GWAS genotypes on >2,400. • WGS on >300.

©2016 MFMER | slide-9
Data Deposition

©2016 MFMER | slide-10
Outcomes • Conserved brain myelination networks are altered in AD and PSP
(Allen et al., Alzheimer’s and Dementia, 2017). - Comparative -omics, mechanism, novel targets.
• An intronic variant at the TREM locus is associated with higher brain TREM2 and TREML1 levels and resides in a TF binding site (Carrasquillo et al., Alzheimer’s and Dementia, 2016). - Omics integration, directionality, mechanism.
• Many AD candidate risk genes have strong eQTL and/or differential expression in brain (Allen et al, Neurology Genetics 2015, 2017; Ridge et al., Genome Medicine, 2017; Mukherjee et al., Alzheimer’s and Dementia, 2017).
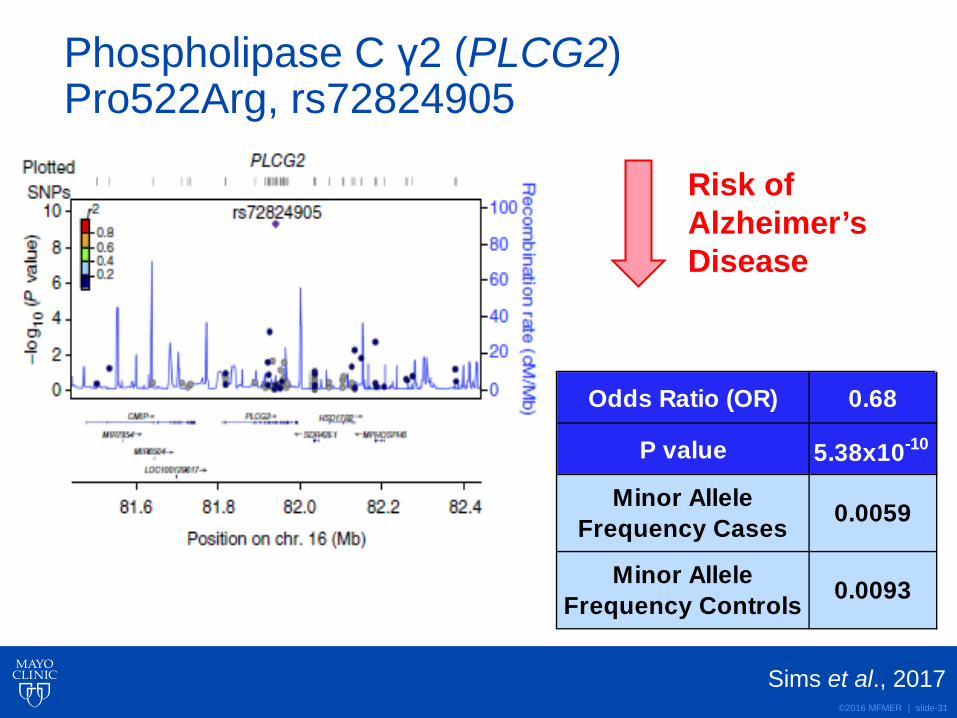
• AD risk genes PLCG2, ABI3 and TREM2 have higher levels in AD brains, Aß models and reside in immune networks (Sims et al., Nature Genetics, 2017).
• Modulation of innate immunity proteins influences Aß and tau pathophysiology (Chakrabarty et al., Neuron, 2015; Li et al., FASEB, 2015).
• Differentially expressed genes/pathways in AD vs. other diagnoses are enriched for immune pathway genes.
• Immunity co-expression networks are enriched for AD risk genes.

©2016 MFMER | slide-11
Comparative Multi-omics and Convergent
Neurodegenerative Disease Mechanisms:
Myelination
©2016 MFMER | slide-12
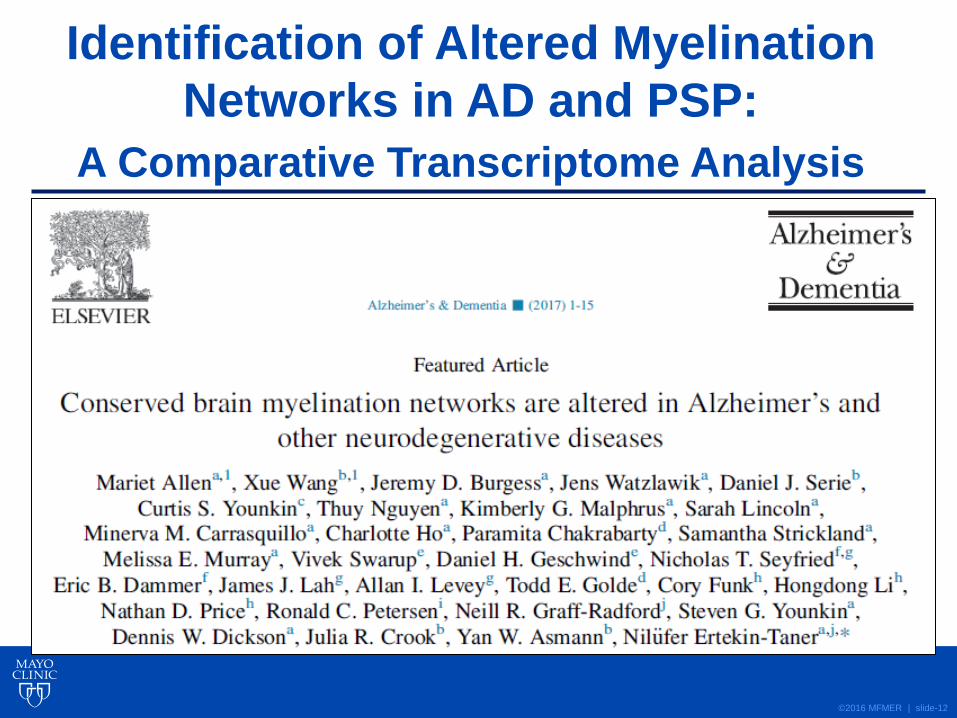
Identification of Altered Myelination Networks in AD and PSP:
A Comparative Transcriptome Analysis

©2016 MFMER | slide-13
Comparative Transcriptome Analysis: Rationale
Comparative transcriptome analysis of distinct neurodegenerative diseases can uncover disease
pathways that are unique or common to these diseases.
• AD ≠ PSP AND [(∆AD vs. Con) ≠ (∆PSP vs.Con)] →
uniquely perturbed pathways • [(∆AD vs. Con) ~ (∆PSP vs. Con)] → commonly perturbed pathways

©2016 MFMER | slide-14
Diagnostic Groups
Amyloid beta TauAD yes yesPSP no yes
PathologyDiagnosis
• Plaques (Aβ)+Tangles (tau). • Dementia: Memory,
language, others. - APP, PSEN1, PSEN2 - APOE ε4 - 20 GWAS loci genes - TREM2, PLD3
Alzheimer’s Disease (AD) Progressive Supranuclear Palsy (PSP)
- MAPT (H1 haplotype) - 6 other GWAS loci (MOBP etc.)
NFT
TA
CB
• Tangles+ tau-positive glial lesions.
• Parkinsonian disorder: Falls, eye movement. (Dickson et al,
2007)

©2016 MFMER | slide-15
Comparative Transcriptome Analysis: Approach
AD PSP AD PSP AD PSP ControlN 181 97 173 96 80 82 76
Females (%) 94 (52%) 40 (42%) 88 (51%) 37 (39%) 49 (61%) 33 (40%) 38 (50%)Age: Mean (SD) 74 (5.6) 72 (5.3) 73 (5.7) 72 (5.0) 83 (8.6) 74 (6.5) 84 (9.3)RIN: Mean (SD) 6.3 (0.8) 7.0 (1.0) 7.1 (1.0) 7.1 (1.0) 8.6 (0.6) 8.5 (0.5) 7.6 (1.0)
Mayo Clinic eGWAS (WG-DASL) Mayo Clinic RNAseq
Transcriptome profiling Temporal Cortex (TCX) Cerebellum (CER) Temporal Cortex (TCX)
Discovery and Replication Cohorts
Transcriptome Profiling: Multi-variable linear regression analysis in R controlled for covariates (age, sex, RIN, APOE, plate for discovery; age, sex, RIN, tissue source, flowcell for replication cohort analyses).
Network Analysis: Weighted Gene Co-expression Network Analysis (Langfelder&Horvath BMC Bioinform, 2008). Gene expression residuals after accounting for covariates.
Goal: Discover common and distinct dysregulated expression networks and key molecules that underlie disease pathways in AD and PSP.

©2016 MFMER | slide-16
Comparative Transcriptome Analysis: Cell Type Adjustment
Covariates included
• Age at death • Gender • RIN • Source • Flowcell/plate • Celltype markers
Simple M
odel
Com
prehensive Model
GeneID GeneName Chr CelltypeENSG00000129226 CD68 chr17 MicroglialENSG00000174059 CD34 chr1 EndothelialENSG00000205927 OLIG2 chr21 OligodendroglialENSG00000131095 GFAP chr17 AstrocyticENSG00000111674 ENO2 chr12 Neuronal
Cell type markers

©2016 MFMER | slide-17
Myelination Networks Are Up In AD vs. PSP Temporal Cortex (TCX) – Discovery Cohort
• TCX co-expression networks enriched for oligodendrocyte transcripts and myelination related biological processes are higher in AD vs. PSP.
• This association persists even when adjusting for five CNS cell-specific transcripts (surrogate for cell type composition).

©2016 MFMER | slide-18
Myelination Networks Are Up In AD vs. PSP Temporal Cortex (TCX) – Discovery Cohort
Simple Model Comprehensive Model

©2016 MFMER | slide-19
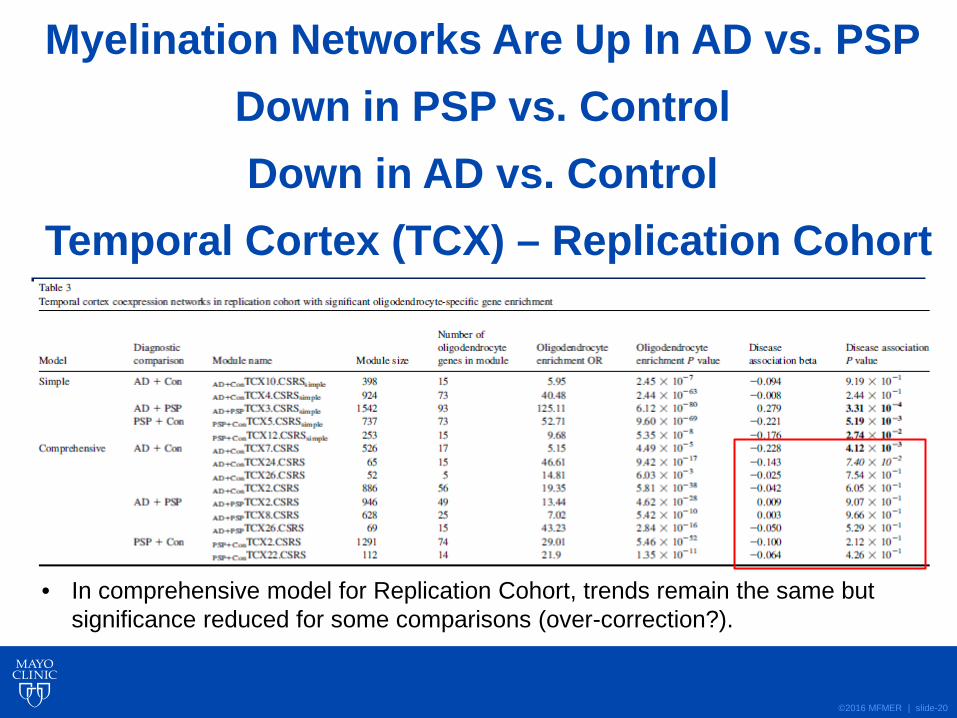
Myelination Networks Are Up In AD vs. PSP Down in PSP vs. Control Down in AD vs. Control
Temporal Cortex (TCX) – Replication Cohort
• TCX myelination network expression is replicably higher in AD vs. PSP. • This appears to be due to greater reduction in myelination network gene levels
in ‘PSP vs. Control’ than ‘AD vs. Control’.
©2016 MFMER | slide-20
Myelination Networks Are Up In AD vs. PSP Down in PSP vs. Control Down in AD vs. Control
Temporal Cortex (TCX) – Replication Cohort
• In comprehensive model for Replication Cohort, trends remain the same but significance reduced for some comparisons (over-correction?).

©2016 MFMER | slide-21
Myelination Networks Harbor AD and PSP Risk Genes Discovery Cohort
Replication Cohort
Myelination genes: MOG, PLP1, PLLP, CNP, MOBP PSP risk genes: SLCO1A2, MOBP AD risk/related genes: BACE1, PSEN1, BIN1, CR1

©2016 MFMER | slide-22
Myelination Network Perturbations Are Validated at Protein Level
Gene Name|UniProt ID Gene Symbol log2FC.PSPvsAD p.PSPvsAD FDR.PSPvsADMBP|P02686 MBP -0.283166459 0.004054992 0.013873479MBP|H7BYR8 MBP -0.44204852 0.006880439 0.021600988CNP|P09543 CNP -0.230290189 0.008508914 0.025767751MOG|C9JTE0 MOG -0.169774747 0.080079509 0.159454749PLP1|P60201 PLP1 -0.138230067 0.19583294 0.324337773BIN1|O00499 BIN1 -0.005061693 0.881080053 0.931413656
Proteome Data of Mayo TCX Samples from Emory/UCLA (84 AD vs. 83 PSP)

Rigor and “External” Reproducibility
(Allen, Ertekin-Taner et al.) (McKenzie, Zhang et al.)
376 AD, 173 non-AD CER, DLPFC, VC 261 AD, 179 PSP, 76 Control (2 cohorts) TCX
Mayo Discovery Cohort Mount Sinai
Replication of Network Structure: Myelination genes: PLP1, PLLP, CNP, MOBP AD risk/related genes: BACE1, PSEN1, BIN1, UNC5C o myelin, o key driver, o AD risk genes (replicable)
(Lake, Zhang et al.)
6 brains CER, FC, VC
Replication of Myelination genes: Myelination genes: PLP1, MOG, MBP AD risk/related genes: MEF2C o myelin
UCSD

©2016 MFMER | slide-24
Hypothetical development of axo-myelinic synapse (Micu et al., Nat Rev NSci, 2018)
Potential Mechanisms of Myelin Dysregulation • Hypoperfusion:
• Protesostasis (Tau, Aß, α-Syn):
Spread of hypoperfusion in AD MAG:PLP1 reduced and VEGF increased in AD
(Love&Miners, Acta Neuropath, 2016)
MSA, α-Syn
(Croisier&Graber, 2006)
PSP, Tau
(Dickson et al., 2006)
AD, Aß plaque (*), demyelinated axon (arrow)
(Mitew et al., 2010)
• Disrupted axo-myelin transmission:
• Neurotransmitters, inflammation:
(Haroutunian, Bartzokis et al., Glia,
2014)

©2016 MFMER | slide-25
Novel Target Discovery: Myelin Therapeutic Hypothesis: Promoting Myelination and Oligodendrocyte Health
We and others have recently implicated oligodendrocyte and myelin dysfunction as an early event in AD (and PSP), perhaps even preceding evidence for overt neuronal dysfunction. If this is the case, promoting oligodendrocyte health and myelination may be a key target for intervention in AD (and other neurodegenerative diseases).
gene symbolPredicted
therapeutic direction
Modules GO_Module Modules GO_Module Modules GO_Module Modules GO_Module
MOG agonism MM5 axon ensheathment MM20 axon ensheathment MM8 NA MM11 axon ensheathment
MOBP agonism MM10 NA MM48 NA MM33 NA MM11 axon ensheathment
SLCO1A2 unknown MM10 NA MM48 NA MM8 NA MM1 NA
UNC5C agonism MM5 axon ensheathment MM22 cell-cell signaling MM2 NA MM24 cell-cell signaling
PLP1 agonism MM5 axon ensheathment MM20 axon ensheathment MM2 NA MM11 axon ensheathment
PLLP agonism MM10 NA MM48 NA MM8 NA MM11 axon ensheathment
BIN1 unknown MM5 axon ensheathment MM1 chromosome organizationMM2 NA MM8 NA
gene symbolPredicted
therapeutic direction
Consistency of TCX and CER
Consistency of Simple vs.
Comprehensive Models
FDR Direction FDR Direction FDR Direction FDR Direction
MOG agonism No No 8.68E-01 HighInAD 5.95E-01 LowInAD 8.16E-01 LowInAD 7.33E-01 LowInAD
MOBP agonism Yes Yes 1.21E-01 LowInAD 1.50E-02 LowInAD 7.77E-02 LowInAD 3.17E-02 LowInADSLCO1A2 unknown Yes Yes 7.52E-01 LowInAD 9.11E-01 LowInAD 1.80E-01 LowInAD 9.67E-01 LowInAD
UNC5C agonism No Yes 6.95E-01 HighInAD 1.41E-01 LowInAD 7.78E-01 HighInAD 5.53E-01 LowInAD
PLP1 agonism No Yes 3.25E-01 HighInAD 9.28E-01 LowInAD 8.17E-01 HighInAD 8.68E-01 HighInAD
PLLP agonism Yes Yes 7.35E-01 LowInAD 6.29E-02 LowInAD 5.76E-01 LowInAD 9.43E-02 LowInAD
BIN1 unknown Yes Yes 8.25E-01 HighInAD 3.58E-01 HighInAD 9.12E-01 HighInAD 9.30E-01 LowInAD
Mayo-UF-ISB Targets: Class Myelin-
OligodendrocyteDEG Comparison Summary AD vs Control_Simple_TCX_DEG
AD vs Control_Simple_CER_D
EG
AD vs Control_Comprehensive_
TCX_DEG
AD vs Control_Comprehensive_ CER_DEG
Mayo-UF-ISB Targets: Class Myelin-
OligodendrocyteADvsControl_Simple_TCX ADvsCon_Simple_CER
AD vs Control_Comprehensiv
e_TCX
AD vsCon _Comprehensive_CER

©2016 MFMER | slide-26
Conclusions and Implications • Myelination networks are down in both AD and PSP, but more
so in PSP. • Convergent pathway for multiple neurodegenerative diseases. • Tau-related (especially 4R), disrupted neuron-glia interaction, other? • Role of aging and high metabolic demand of maintaining myelin.
• Myelination networks are reproducible, validated and their alterations are unlikely to be due to cell population changes.
• TCX is a relatively unaffected region in PSP. • Similar findings even after adjusting for cell populations. • Internal, external replications, including single cell type data.
• Myelination networks harbor AD and PSP risk genes. • Mechanistic implications for these genes and their variants.
• Implications for (Combination) Therapy. • Myelin repair/remyelination. • Maintenance of microglial, astrocyte function (myelin debris removal) • APOE/lipid metabolism/cerebrovascular health

©2016 MFMER | slide-27
Comparative Multi-omics and Divergent Neurodegenerative
Disease Mechanisms:
Innate Immunity

©2016 MFMER | slide-28
Sims et al., 2017

©2016 MFMER | slide-29
Sims et al., 2017

©2016 MFMER | slide-30
Abelson Interactor Protein 3 (ABI3) Ser209Phe, rs616338
Risk of Alzheimer’s Disease
Sims et al., 2017
Odds Ratio (OR) 1.43
P value 4.56x10⁻¹⁰
Minor AlleleFrequency Cases
Minor AlleleFrequency Controls
0.011
0.008
©2016 MFMER | slide-31
Phospholipase C γ2 (PLCG2) Pro522Arg, rs72824905
Risk of Alzheimer’s Disease
Sims et al., 2017
Odds Ratio (OR) 0.68
P value 5.38x10⁻¹⁰
Minor AlleleFrequency Controls 0.0093
Minor AlleleFrequency Cases 0.0059

©2016 MFMER | slide-32
Conclusions and Implications • Innate immunity/microglial networks are up only in AD, but
not in PSP. • Divergent pathway between AD vs. PSP (primary tauopathy). • AD (Aβ) specificity?
• Innate immunity networks are reproducible and validated though their changes are likely due to microgliosis in AD pathology-affected regions.
• Observed only in AD vs. control, in TCX and simple model. • Findings disappear after adjusting for cell populations.
• Innate immunity networks harbor AD risk genes. • Mechanistic implications for these genes and their variants.
• Implications for Therapy. • Innate immunity may be a viable AD-specific target. • Opposite direction of risk associations between AD and PSP for some
innate immunity AD risk genes may be multifactorial and should raise caution about targeting innate immunity in non-AD degenerative diseases.

©2016 MFMER | slide-33
Mayo Clinic/University of FL/ISB Ertekin-Taner/Golde/Price
• RNAseq, WGS/GWAS: Differential expression, eQTL, network, brain region-specific association, cell-type specific transcriptome analyses
Columbia/Rush DeJager/Bennett
Mount Sinai Zhang et al.
• Proteome
Emory Levey et al.
• Metabolome
Duke Kaddurah-Daouk et al.
• Antemortem data
ADNI
- ADSP ADGC IGAP - MODEL-AD
- Synapse Knowledge Portal, Mangravite et al. - AMP-AD Industry Partners
• Annotate disease genes and variants.
• Prioritize disease models by variants and mechanism.
Drug Targets • Replication in independent
cohorts • Validation in model systems • Identification of timing of
alterations with respect to disease progression
• Discovery of mechanisms of alteration
• Identification of beneficial vs. detrimental direction of effect.
Open Science • Wide sharing of data. • Data visualization tools • Education of research
community
• Simplified schematic depiction of the ongoing and planned collaborations with AMP-AD and other partners.
• Blue arrows: Shared samples. Green arrows: Shared data. Red arrows: Expected outcomes. • Data generated by the teams are shown in white boxes below the relevant teams. • This figure highlights the specific data types shared with and by our team and is not a full inventory of
all data by all groups. Our team also widely shares rAAV tools and mouse brain data with all teams (not shown).
AMP-AD Interactive Collaborations