comparative genomics for biological discovery lior pachter dept. mathematics, u.c. berkeley...
Post on 21-Dec-2015
215 views
TRANSCRIPT

Comparative genomics for biological discovery
Lior PachterDept. Mathematics, U.C. Berkeley
February 3, 2004

QuickTime™ and aTIFF (Uncompressed) decompressor
are needed to see this picture.
From: Hardison RC (2003) Comparative Genomics. PLoS Biol 1(2): e58.
Comparative Genomics

February 2001 December 2002
QuickTime™ and aTIFF (LZW) decompressor
are needed to see this picture.
Rat 2004Picture credit: G.Bourque, P. Pevzner, G. Tesler and the Rat Genome Sequencing Consortium

State of the Genomes (Jan 2004)
QuickTime™ and aTIFF (Uncompressed) decompressorare needed to see this picture.QuickTime™ and aTIFF (Uncompressed) decompressorare needed to see this picture.
QuickTime™ and aTIFF (Uncompressed) decompressorare needed to see this picture.QuickTime™ and aTIFF (Uncompressed) decompressorare needed to see this picture.
QuickTime™ and aTIFF (Uncompressed) decompressorare needed to see this picture.QuickTime™ and aTIFF (Uncompressed) decompressorare needed to see this picture.
QuickTime™ and aTIFF (Uncompressed) decompressorare needed to see this picture.QuickTime™ and aTIFF (Uncompressed) decompressorare needed to see this picture.QuickTime™ and aTIFF (Uncompressed) decompressorare needed to see this picture.
QuickTime™ and aTIFF (Uncompressed) decompressorare needed to see this picture.QuickTime™ and aTIFF (Uncompressed) decompressorare needed to see this picture.
v3 v6 v2 v3 v34 v3.1 v0.1 v1 v0 ---- ----
0.36Gb
0.35Gb
1.7 Gb
2.5 Gb
2.9 Gb
2.8 Gb
2.4*Gb
2.9*Gb
1.2 Gb
3* Gb
1.7 Gb
Aligned (multiple) Working on it As soon as released

http://www.ncbi.nlm.nih.gov/Genbank/genbankstats.html

Outline
VISTA/AVID tools for comparative genomics
Related biological stories
Human/Mouse/Rat
Phylogenetic Shadowing
QuickTime™ and aTIFF (Uncompressed) decompressor
are needed to see this picture.

http://www-gsd.lbl.gov/vista
Processed ~ 11000 queries on-line, distributed > 560 copies of the program in 34 countries

VISTA/AVID package
• AVID: Program for global alignment of DNA fragments of any length
` N. Bray and L. Pachter, MAVID: Constrained Ancestral Alignment of Multiple Sequences, Genome Research, in press.
N. Bray, I. Dubchak, L. Pachter, AVID: A Global Alignment Program , Genome Research, 13 (2003) p 97 - 102.
• VISTA: Visualization of alignment and various sequence features for any number of species
C. Mayor, M. Brudno, J.R. Schwartz, A. Poliakov, E. M. Rubin, K. A. Frazer, L. Pachter and I. Dubchak, VISTA: Visualizing global DNA sequence alignments of arbitrary length, Bioinformatics, 16 (2000), p 1046-1047.

Aligning large genomic regions
• Long sequences lead to memory problems• Speed becomes an issue• Long alignments are very sensitive to
parameters• Draft sequences present a nontrivial problem• Accuracy is difficult to measure and to achieve
References for other existing programs:Glass:Domino Tiling, Gene Recognition, and Mice. Pachter, L. Ph.D. Thesis, MIT (1999)Human and Mouse Gene Structure: Comparative Analysis and Application to Exon Prediction. Batzoglou, S., Pachter, L., Mesirov, J., Berger, B., Lander, E. Genome Research (2000).MUMmerDelcher, A.L., Kasif S., Fleischmann, R.D., Peterson J., White, O. and Salzberg, S.L.Alignment of whole genomes. Nucleic Acids Research (1999)PipMakerPipMaker: A Web Server for Aligning Two Genomic DNA Sequences. Scott Schwartz, Zheng Zhang, Kelly A. Frazer, Arian Smit, Cathy Riemer, John Bouck, Richard Gibbs, Ross Hardison, and Webb Miller. Genome Research (2000)DIALIGNMultiple DNA and protein sequence alignment based on segment-to-segment comparisonB. Morgenstern, A. Dress and T. Werner, Proc. Natl. Acad. Sci. USA 93 (1996)

Variations on Sequence Alignment
Find the best OVERALL alignment.Global alignment
Find ALL regions of similarity.Local alignment
Find the BEST region of similarity.Optimal local alignment

Very fastVery fast global alignment of megabases of global alignment of megabases of sequence.sequence.
Provides detailsProvides details about ordered and oriented about ordered and oriented contigs, and accurate placement in the finished contigs, and accurate placement in the finished sequence.sequence.
Full integrationFull integration with repeat maskingwith repeat masking..
AVID- the alignment engine behind VISTA
• ORDER and ORIENT • FIND all common k-long words (k-
mers)• ALIGN k-mers scoring by local
homology• FIX k-mers with good local homology• RECURSE with smaller k (shorter words)

Visualization
tggtaacattcaaattatg-----ttctcaaagtgagcatgaca-acttttttccatgg || | |||| | | || || | | | |||||| | || | | || tgatgacatctatttgctgtttcctttttagaaactgcatgagagcctggctagtaggg
Window of length L is centered at a particular nucleotide in the base sequence
Percent of identical nucleotides in L positions of the alignment is calculated and plotted
Move to the next nucleotide

Finding conserved regions with percentage and length cutoffs
Conserved segments with percent identity X and length Y - regions in which every contiguous subsegment of length Y was at least X% identical to its paired sequence. These segments are merged to define the conserved regions.
Output:11054 - 11156 = 103bp at 77.670% NONCODING13241 - 13453 = 213bp at 87.793% EXON14698 - 14822 = 125bp at 84.800% EXON

Conserved NonCoding SequencesConserved NonCoding Sequences
VISTA PlotVISTA Plot
Human Sequence (horizontal Human Sequence (horizontal axis)axis)
% Identity% Identity
KIF GeneKIF Gene
0k0kb b
10kb 10kb
100%100%
7575
5050QuickTime™ and aTIFF (Uncompressed) decompressorare needed to see this picture.

Liver enhancer
human/mouse 75%
50/100%
human/rabbit
50/100%
75%
human/chicken 75%
50%
human/rat
50/100%
75%
75%human/pig
50/100%
100%
75%
50/100%
human/macaque
Apolipoprotein AI gene
Multi-Species Comparative Analysis (mVISTA)

J Mol Cell Cardiol 34, 1345-1356 (2002)Myocardin: A Component of a Molecular Switch for Smooth Muscle Differentiation. J. Chen, C. M. Kitchen, J. W. Streb and J. M. Miano
University of Oxford
VSTA used to solve the gene structures of rat and human myocardin.
Some results obtained with VISTASome results obtained with VISTA

Blood, 100, 3450-3456 (2002)Deletion of the mouse -globin regulatory element (HS 26) has an unexpectedly mild phenotype E. Anguita, J. A. Sharpe, J. A. Sloane-Stanley, C. Tufarelli, D. R. Higgs, and W. G. Wood University of Oxford.
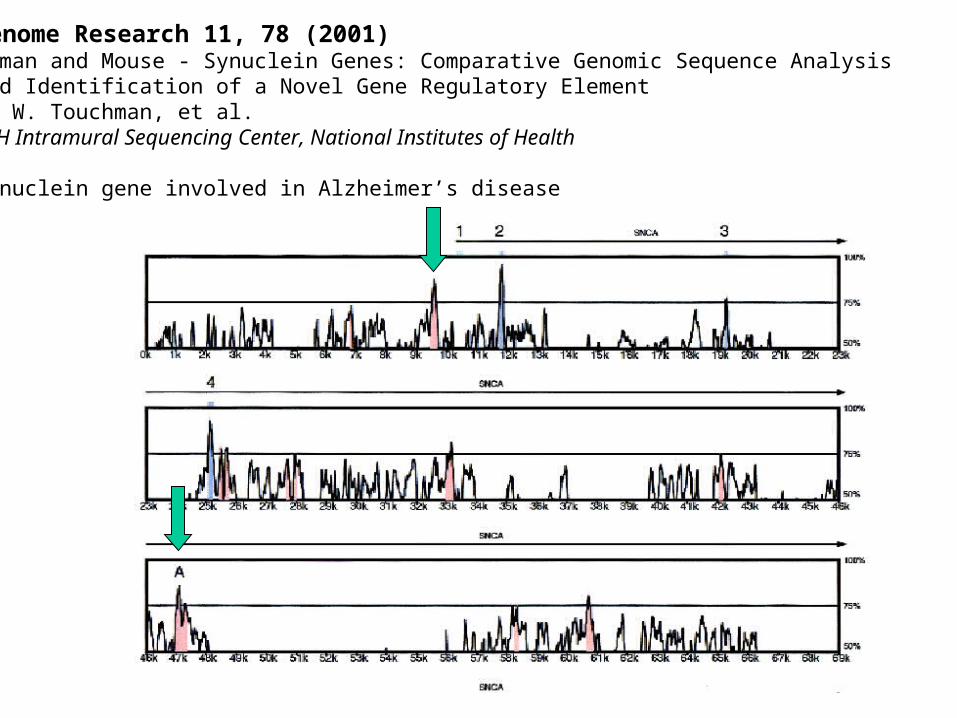
Genome Research 11, 78 (2001)Human and Mouse - Synuclein Genes: Comparative Genomic Sequence Analysisand Identification of a Novel Gene Regulatory ElementJ. W. Touchman, et al. NIH Intramural Sequencing Center, National Institutes of Health
Synuclein gene involved in Alzheimer’s disease

EMBO reports 4:143 (2003) The kangaroo genome. Leaps and bounds in comparative genomics M. J. Wakefield and J. A. Marshall GravesResearch School of Biological Sciences, The Australian National University, Canberra, ACT 0200, Australia
‘The kangaroo genome is a rich and unique resource for comparative genomics, a treasure trove of comparative genomics data’.
Phylogenetic footprinting of 3’ untranslated region of the SLC16A2 gene
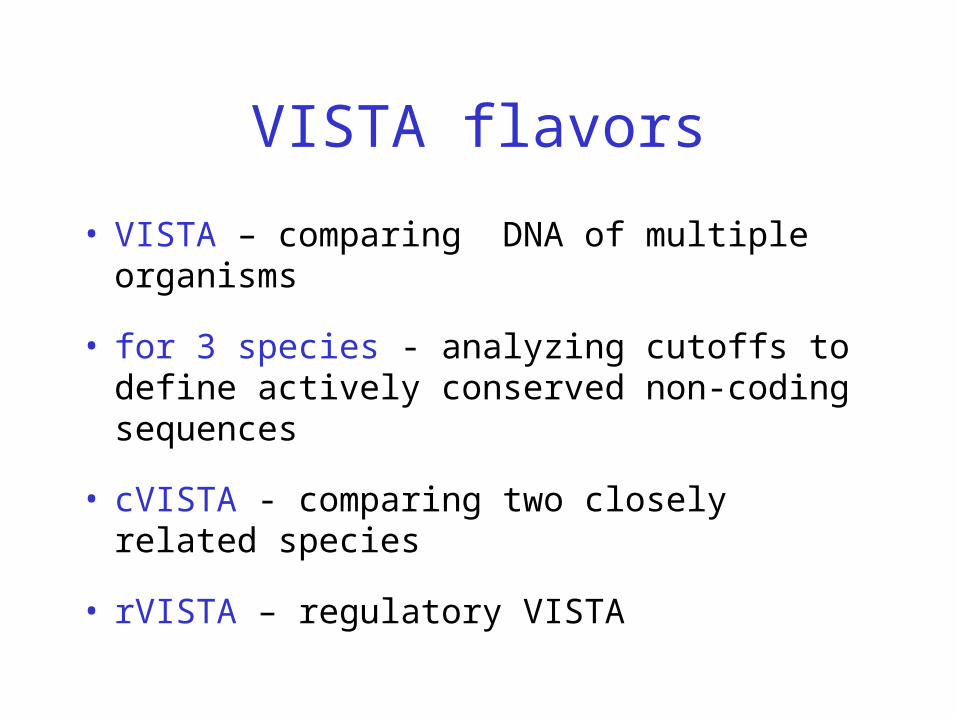
VISTA flavors
• VISTA – comparing DNA of multiple organisms
• for 3 species - analyzing cutoffs to define actively conserved non-coding sequences
• cVISTA - comparing two closely related species
• rVISTA – regulatory VISTA

Identifying non-coding sequences (CNSs) involved in transcriptional regulation

rVISTA - prediction of transcription factor binding sites
• Simultaneous searches of the major transcription factor binding site database (Transfac) and the use of global sequence alignment to sieve through the data
• Combination of database searches with comparative sequence analysis reduces the number of predicted transcription factor binding sites by several orders of magnitude

Human TGATTTCTCGGCAGCAAGGGAGGGCCCCATGACAAAGCCATTTGAAATCCCAGAAGCAATTTTCTACTTACGACCTCACTTTCTGTTGCTGTCTCTCCCTTCCCCTCTGMouse TGATTTCTCGGCAGCCAGGGAGGGCCCCATGACGAAGCCACTCGAAATCCCAGAAGCAATTTTCTACTTACGACCTCACTTTCTGTTGCTCTCTCTTCCTCCCCCTCCADog TGATTTCTCGGCAGCAAGGGAGGGCCCCATGACGAAGCCATTTGAAATCCCAGAAGCGATTTTCTACCTACGACCTCACTTTCTGTTGCGCTCACTCCCTTCCCCTGCARat TGATTTCTCGGCAGCCAGGGAGGGCCCCATGACGAAGCCACTCGAAATCCCAGAAGCAATTTTCTACTTACGACCTCACTTTCTGTTGTTCTCTCTTCCTCCCCCTCCACow TGATTTCTCGGCAGCCAGGGAGGGCCCCATGACGAAGCCATTTGAAATCCCAGAAGCAATTTTCTACTTACGACCTCACTTTCTGTTGCGTTCTCTCCCTTCCCCTCCTRabbit TGATTTCTCGGCAGCCAGGGAGGGCCCCACGAC-AAGCCATTCAAAATCCCAGAAGTGATTTTCTACTTACGACCTCACTTTCTGTTG----CTCTCTCCTTCCCTCCA
Ikaros-2 Ikaros-2 NFAT Ikaros-2
20 bp dynamic shifting window
>80% ID
1. Identify potential transcription factor binding sites for each sequence using library of matrices (TRANSFAC)
2. Identify aligned sites using AVID
3. Identify conserved sites using dynamic shifting window
Percentage of conserved sites of the total 3-5%
Regulatory VISTA (rVISTA)

~1 Meg region, 5q31
Coding Noncoding
Human interval Transfac predictions for GATA sites 839 20654
Aligned with the same predicted site in the mouse seq. 450 2618
Alligned sites conserved at 80% / 24 bp dynamic window 303 731
Random DNA sequence of the same length 29280

GATA-3 Conserved (4)
GATA-3 (28)
2 Exp. Verified GATA-3 Sites
IL 5


AP-1-conservedNFAT-conserved
GATA-3-conserved
100%
75%
50%
A
B
C
Ik-2-AllIk-2-Aligned
Ik-2-conserved
100%
75%
50%
AP-1-AllNFAT-All
AP-1-AlignedNFAT-Aligned
AP-1-ConservedNFAT-Conserved
100%
75%
50%

Main features of AVID
• Alignments up to several megabases
• Works with finished and draft sequences
• Fast
• Accurate for close and distant organisms

Main features of VISTA
• Clear , configurable output
• Ability to visualize several global alignments on the same scale
• Available source code and WEB site

Large scale VISTA/AVID applications:
Cardiovascular comparative genomics database http://pga.lbl.gov
Berkeley Genome Pipeline – comparing the human and mouse genome
http://pipeline.lbl.gov/
Multiple whole genome comparisons using MAVIDhttp://bio.math.berkeley.edu/genome/

Automatic computational system for Automatic computational system for comparative analysis of pairs of genomescomparative analysis of pairs of genomes http://pipeline.lbl.gov
Alignments (all pair-wise combinations):
Human Genome: (Golden Path Assembly)Mouse assemblies: Arachne, Phusion (2001) MGSC v3 (2002)Rat assemblies: November 2002, February 2003
----------------------------------------------------------D. Melanogaster vs D. Pseudoobscura February 2003

Main modules of the system
Visualization Analysis of conservation
Mapping and alignment of mouse contigs against the human genome

Tandem Local/Global Alignment Approach•Finding a likely mapping for a contig
•Multi-step verification of potential regions by global alignment

The ratio of the number of bp on each human chromosome covered by alignments of the reversed mouse genome and the number of base pairscovered by the actual mouse genome.
Specificity test

Apolipoprotein(a) region. The expressed gene is confined toA subset of primates. Our method is the only one to predict that apoa(a) has NO homology in the mouse.

VistaBrowser

Input your own sequence to align against the Input your own sequence to align against the Reference Genomes: Reference Genomes: Human, Mouse, Rat, Human, Mouse, Rat, D.MelanogasterD.Melanogaster

GenomeVISTAGenomeVISTA
Opposum BAC versus Human GenomeOpposum BAC versus Human Genome

Examples of Results
• Understanding the structure of conservation • Identification of putative functional sites • Discovery of new genes
• Detection of contamination and misassemblies
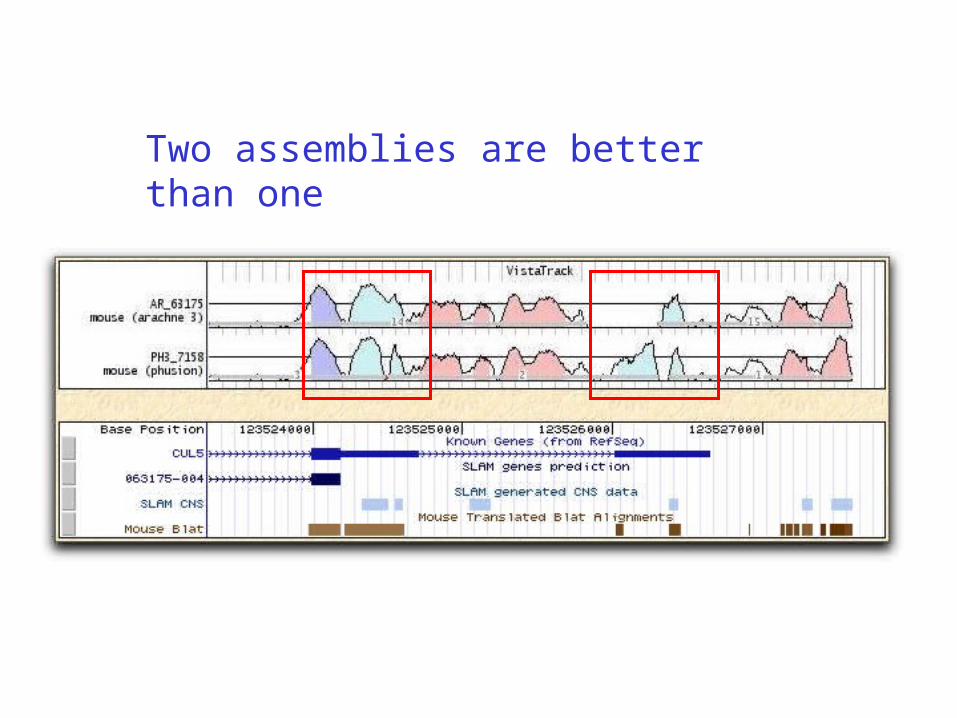
Two assemblies are better than one

Zoom InZoom In
Gene Name
Identification of a New Apo Gene on Human 11q23Identification of a New Apo Gene on Human 11q23
Highly Conserved RegionHighly Conserved Region
ApoA4ApoA4 ApoC3ApoC3 ApoA1ApoA1

Identification of a New Apo Gene on Human 11q23Identification of a New Apo Gene on Human 11q23
New Gene (ApoA5)New Gene (ApoA5)Pennacchio LA et al.Pennacchio LA et al.Science. 2001, 294:169-73Science. 2001, 294:169-73..

Finding regulatory regions
Muscle Specific Regulatory Region: human beta enolase intronic enhancer
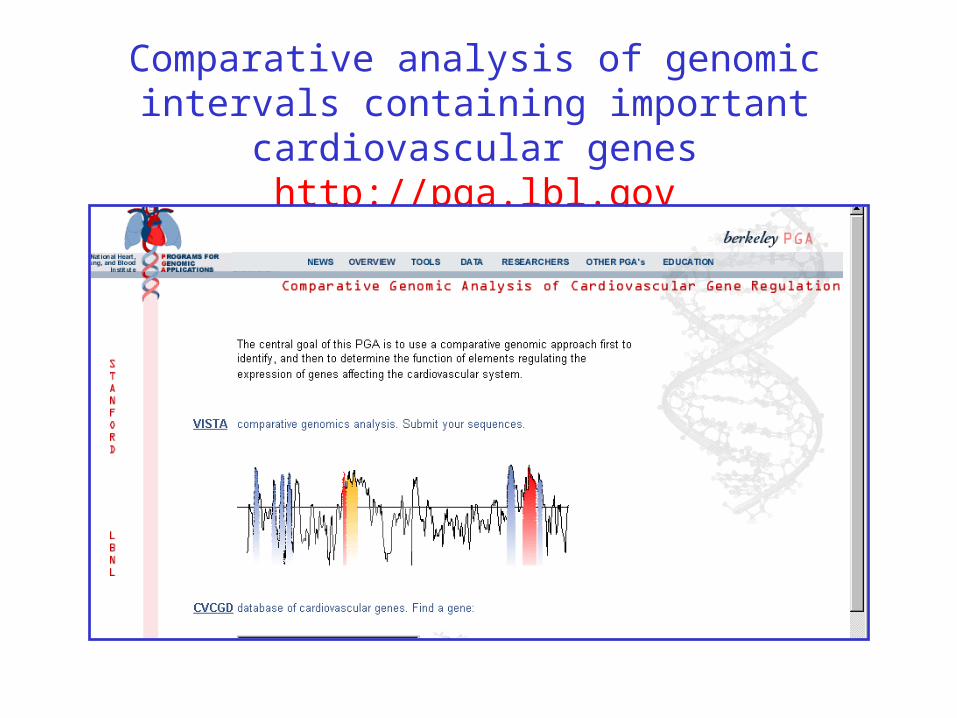
Comparative analysis of genomic intervals containing important cardiovascular genes
http://pga.lbl.gov

http://pga.lbl.gov/cvcgd.html

Example of CVCGD entry

Short annotation of the region

Detailed annotation in AceDB format

VISTA plot of the region
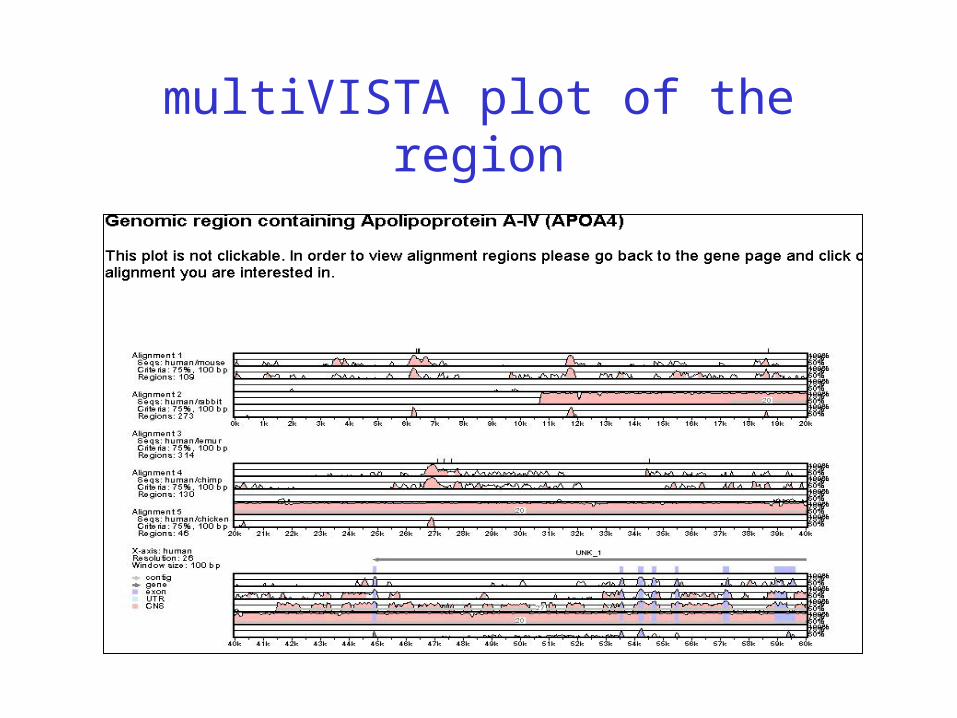
multiVISTA plot of the region

Alignment

Conserved regions

Comparing the human, mouse and rat
• Design a computational scheme for multiple genome
mapping (Construction of Homology Maps)
• Move from pair-wise to multiple DNA alignment (MAVID)
• Novel visualization and browsing techniques (KBROWSER)

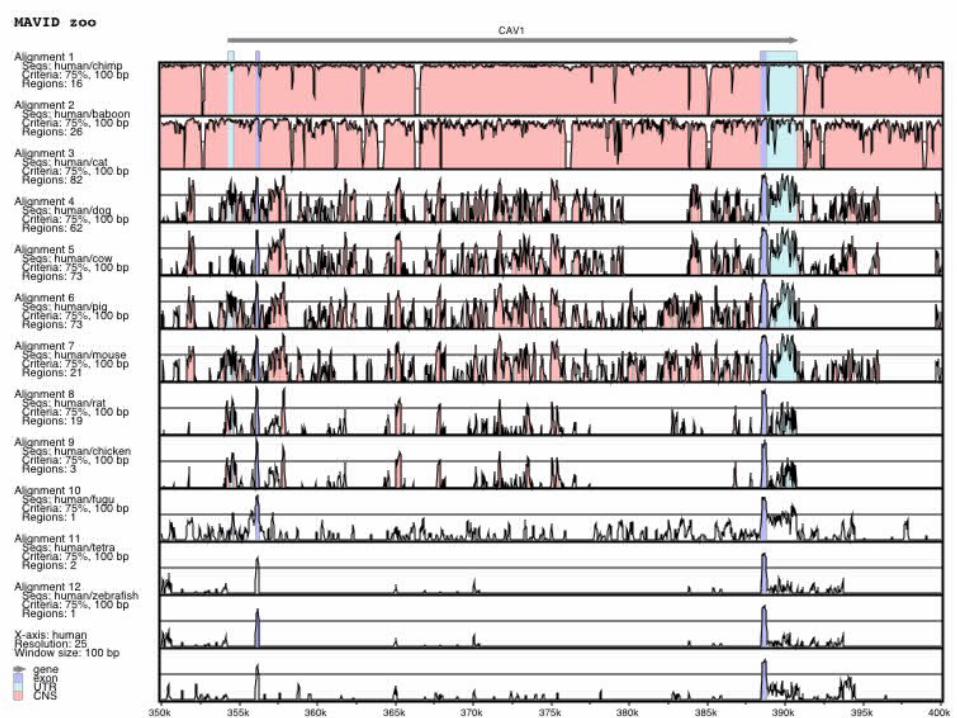
MAVID architecture overview
AVIDML ancestor

Nicolas Brayhttp://baboon.math.berkeley.edu/mavid/


QuickTime™ and aTIFF (LZW) decompressorare needed to see this picture.

Human-Mouse-Rat
Human: April 03Mouse: Feb. 03 Rat: June 03
Homology map (Colin Dewey)~500 HMR blocks
Annotation
Conservation
…..
MAVID
Computer cluster
Result:
3-way alignment of human-mouse-ratFoundation for further analysis
Can be browsed athttp://hanuman.math.berkeley.edu/kbrowser/

QuickTime™ and aTIFF (Uncompressed) decompressorare needed to see this picture.
QuickTime™ and aTIFF (Uncompressed) decompressorare needed to see this picture.
QuickTime™ and aTIFF (Uncompressed) decompressorare needed to see this picture.

Human
Mouse Rat
th
tm tr
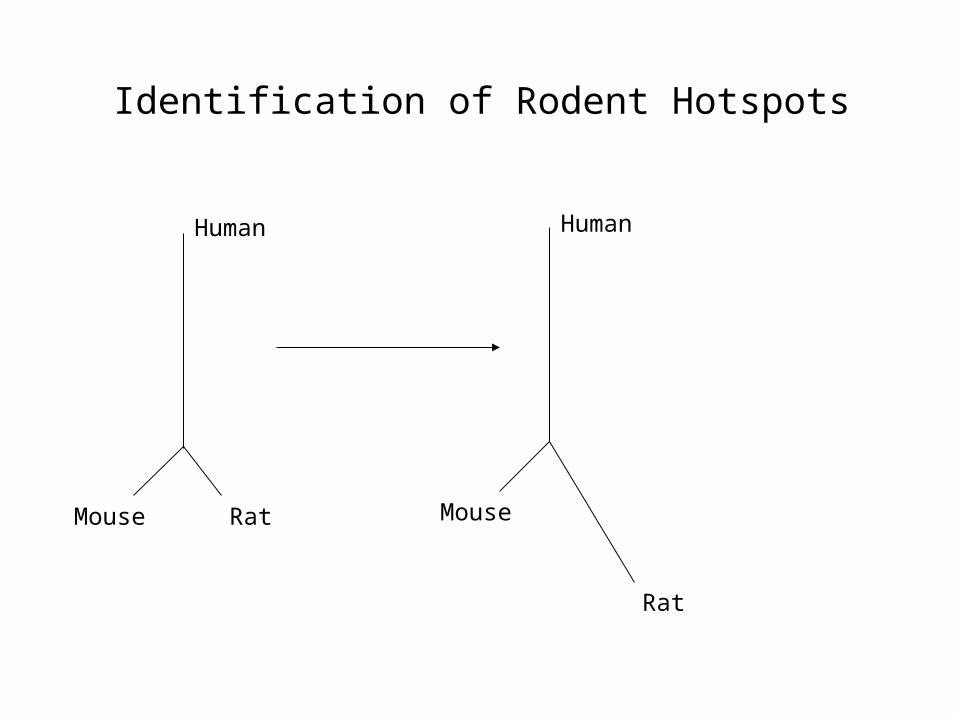
Identification of Rodent Hotspots
Human
Mouse
Rat
Human
Mouse Rat

QuickTime™ and aTIFF (Uncompressed) decompressorare needed to see this picture.

http://bio.math.berkeley.edu/slam/

SLAM components• Splice site detector
– VLMM
• Intron and intergenic regions– 2nd order Markov chain
– independent geometric lengths
• Coding sequence– PHMM on protein level
– generalized length distribution
• Conserved non-coding sequence– PHMM on DNA level

SLAM input and output
• Input:– Pair of syntenic sequences (FASTA).
• Output:– CDS and CNS predictions in both sequences.– Protein predictions.– Protein and CNS alignment.

Input:

Output:

QuickTime™ and aTIFF (Uncompressed) decompressorare needed to see this picture.

QuickTime™ and aTIFF (Uncompressed) decompressorare needed to see this picture.

Summary statistics
# of SLAM human/mouse genes 29370# of SLAM human/rat genes 25427
# of SLAM genes identical in human, mouse, and rat 3698# of SLAM human/mouse/rat genes overlapping
human RefSeq2478
% of SLAM human/mouse/rat genes with correctstructure (out of genes overlapping human RefSeq)
36%
# of novel (not overlapping with human Ensembl,RefSeq, or Known genes) SLAM human/mouse/rat
genes
924
# of SLAM human/mouse/rat genes tested 48 ortholog pairs (48human, 48 rat)
% of SLAM human/mouse/rat genes verified 73% (29 pairs verified inboth human and rat, 6verified only in rat)

QuickTime™ and aTIFF (Uncompressed) decompressor
are needed to see this picture.
From: Hardison RC (2003) Comparative Genomics. PLoS Biol 1(2): e58.
Comparative Genomics


Example: LXR- exon 3
100%
75%
50%
Human: chromosome 1113 other primate sequences (~2kb each)

• Begin with a multi-FASTA file
• No phylogenetic tree • No alignment• No annotation

Nicolas Brayhttp://baboon.math.berkeley.edu/mavid/


Non-conserved likelihood calculation

Conserved likelihood calculation
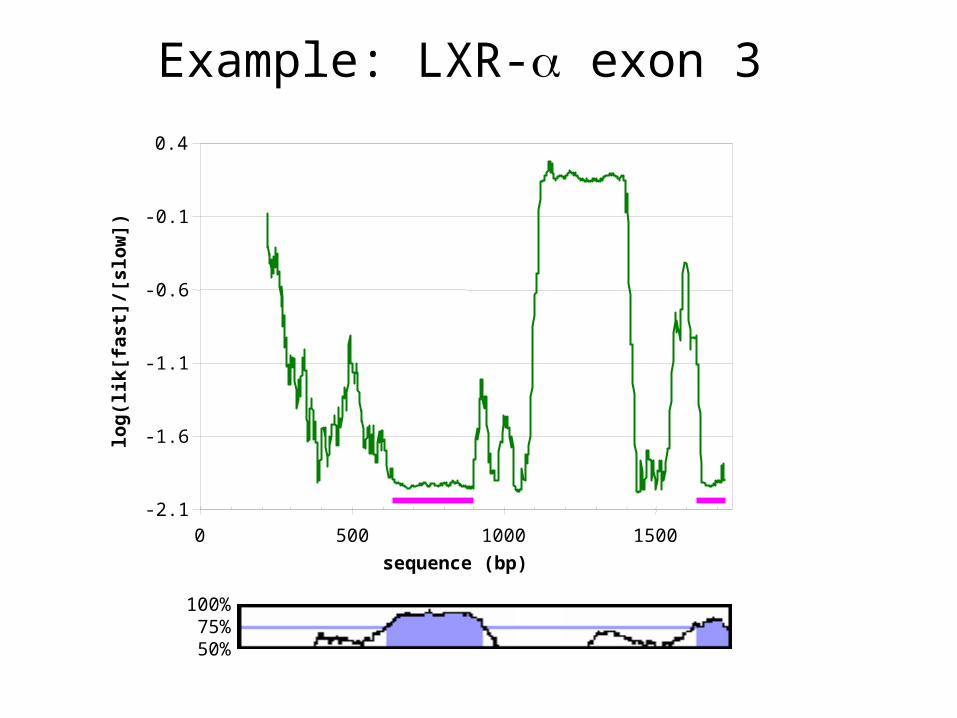
Example: LXR- exon 3
100% 75%50%
-2.1
-1.6
-1.1
-0.6
-0.1
0.4
0 500 1000 1500
sequence (bp)
log
(lik
[fas
t]/[
slo
w])

Which primates should we sequence?
0.25
0
Primates

80 60 40 20 0million years
Rodents
LemursLorises
Tarsioids
CebuellaCallithrixCallimicoSaguinisLeontopithecus
SamiriCebusAotus
CallicebusPitheciaChiropotesCacajao
AlouattaLagothrixBrachytelesAteles
AllenopithecusMiopithecusErythrocebusChlorocebusCercopithecusMacacaMandrillusCercocebusLophocebusPapioTheropithecus
ProcolobusPiliocolobusColobusSemnopithecusKasiTrachypithecusPresbytisNasalisSimiasPygathrixRhinopithecus
HylobatesPongoGorillaPanHomo
New-worldmonkeys
Old-worldmonkeys
Hominoids
Prosimians

k-MST problem
Given a phylogenetic tree on n leaves, and an integer k<n, find the subtree of maximum weightspanning k leaves.
The clamped k-MST problem is to find the subtreeof maximum weight spanning k leaves whereone of the leaves is human.

80 60 40 20 0million years
Rodents
LemursLorises
Tarsioids
CebuellaCallithrixCallimicoSaguinisLeontopithecus
SamiriCebusAotus
CallicebusPitheciaChiropotesCacajao
AlouattaLagothrixBrachytelesAteles
AllenopithecusMiopithecusErythrocebusChlorocebusCercopithecusMacacaMandrillusCercocebusLophocebusPapioTheropithecus
ProcolobusPiliocolobusColobusSemnopithecusKasiTrachypithecusPresbytisNasalisSimiasPygathrixRhinopithecus
HylobatesPongoGorillaPanHomo
New-worldmonkeys
Old-worldmonkeys
Hominoids
Prosimians

-0.5
0.5
1.5
2.5
3.5
4.5
log(lik[fast]/lik[slow])
250 500 750 1000 1250 1500 1750 2000 2250
Phylogenetic shadowing of the apo(a) promoter
conservednon-conserved
TATA HNF-1 EXON
sequence position (bp)

Gel-shift assay to assess DNA-protein interactions
nuclear extract non-conserved elements conserved elements
DNA-proteincomplex
unbound DNA

Gel-shift assay to assess DNA-protein interactions
nuclear extract non-conserved elements conserved elements
DNA-proteincomplex
unbound DNA

nuclear extract non-conserved elements conserved elements
DNA-proteincomplex
unbound DNA
Gel-shift assay to assess DNA-protein interactions

Gel-shift analysis of conserved elements in the apo(a) promoter
1 2 3 4 5 6 7 8 9 10-1 10-2
Non-conserved elements1 2 3 4 5 6 7
Conserved elements
0
5
10
15
20
25
30
35
C1 C2 C3 C4 C5 C6 C7 C8 C9 C10.1 C10.2 N1 N2 N3 N4 N5 N6 N7
oligonucleotide
%oligonucleotide shifted

Summary and Conclusions - Phylogenetic Shadowing

• Alignment problem is tractable• Trees can be constructed accurately• Total tree weight is sufficient for distinguishing conserved from non-conserved regions• Likelihood calculations are reliable because alignment are good• Can decide a-priori which organisms should be sequenced• Annotation of primate-specific elements is possible• Annotation of coding exons is accurate• Annotation of regulatory elements is possible• Sequencing is easier because comparative mapping and assembly techniques can be applied

Web sites
• MAVID alignment programhttp://bio.math.berkeley.edu/mavid/
• SLAM comparative gene prediction program http://bio.math.berkeley.edu/slam/mouse/
• VISTA
http://www-gsd.lbl.gov/vista/
• KBROWSERhttp://hanuman.math.berkeley.edu/kbrowser/
• SHADOWERhttp://bonaire.lbl.gov/shadower/

Credits(M)AVIDNicolas Bray
VISTA Projects and PGA Michael Brudno Olivier Couronne Inna Dubchak Kelly FrazerGaby Loots Chris Mayor Ivan Ovcharenko Alexander
PoliakovEddy Rubin
Homology MappingColin Dewey
Evolutionary HotspotsVon Bing Yap
KBROWSERKushal Chakrabarti
Phylogenetic ShadowingDario Boffelli Keith Lewis Michael JordanJon McAuliffe Ivan Ovcharenko Eddy Rubin
Gene FindingMarina Alexandersson Simon Cawley Sourav ChatterjiColin Dewey Richard Gibbs Jia Qian Wu