comparative financial performance assessment of islamic ... · pdf filebank limited(mbl),...
TRANSCRIPT

ISSN: 2308-5096(P) ISSN 2311-620X (O)
[International Journal of Ethics in Social Sciences
Vol.4, No. 1, June 2016]
Comparative Financial Performance Assessment of Islamic
Banks and Traditional Banks in Bangladesh
Norkutubul Alam Bhuiyan1
Abstract
This paper has looked into the comparative performance assessment of
Islamic banks and Traditional banks in Bangladesh for the period 2010-
2014. Financial ratios have been employed to measure the capital
adequacy, Assets quality, Management efficiency, profitability, liquidity
performance of five Islamic banks and five traditional banks. The study
found that the performance of the both of the banking sector in Bangladesh
is satisfactory as almost all of the sample banks has at least more than 11%
risk weighted asset, the classified loan to total loan of this sector is
decreasing gradually and also found that profitability is being increasing
significantly over last five years and the overall the study found Islamic
banking sector has better capital adequacy, Asset quality management
ability, Management efficiency, Profitability and Liquidity position than
Traditional banking sector.
Key Words: Financial Performance, Commercial Banks, ROA, ROE, EPS, P/E Ratio, Islamic Banks etc.
1. Introduction
Banks are the key financial establishments that play a dynamic role in the country’s economy.
Globalization in the banking sector has thrown up opportunities as well as challenges.
Competition is getting edge day by day. It paces with the continuous development occurring
in the tremendous competitive environment.
The existence of banking sector is not a new matter, as its existence was long ago. But the
new thing is that how it is operating and presenting its activities for the purpose of serving
customer requirements to increase their well being in the sense of wealth. Banks also provide
many services for clients to make their life easy in a busy environment. In this competitive
environment in today’s world, banks increase their facilities in favor of their customers to
1. PhD. Research Fellow, JJT University, Rajasthan, India

International Journal of Ethics in Social Sciences, Vol. 4, No. 1, June 2016 114
retain them and capture more share of the market to be leader. Interest is one of the main
factors in attracting customers and also one of the significant factors in increasing extra
income from providing loans besides other service income. So, it can be said that
conventional banking systems are interest-based system.
Bangladesh is one of the largest Muslim countries of the world. The people of this country are
deeply committed to Islamic way of life mentioned in the Quran and Sunnah. But it is not
easy for the people to establish and designed their economic lives in accordance with Shariah.
The very objective of Shariah to promote the welfare of the people that lies in safeguarding
their faith, their life, their prosperity and their wealth. In this regard to establish a banking
world that run according to the Shariah, the concept of Islamic banking arises.
In Bangladesh there are 47 banks are working very successfully. Their current performance
and financial position are quite satisfactory. If we look at the banking sector of Bangladesh,
then four categories of bank are available like nationalized commercial Banks, Private
commercial banks, foreign commercial banks, Development Finance Institutions. As well as
banking sectors can also be categorized into traditional bank and Sharia based Islami bank. As
both types of banks in Bangladesh are now in a stable position and performing very smoothly,
so it is very important to analyze the current growth and financial position. This paper has
been initiated to analyze the financial performance of the some selected banks in both
categories of bank in Bangladesh through various statistical as well as financial and
accounting Techniques.
2. Objectives of the Study
Though a lot of studies have been completed on performance analysis of banking industry in
home and aboard but the chances for further study is still remained open for researcher. The
specific objectives of the study are as follows.
To assess the comparative growth and development of the selected banks.
To find out the financial performance and financial position of the sample banks.
To pin point the causes of poor financial performance and suggest some measure
measures to overcome the problems.
3. Research Methodology
This study is exclusively based on secondary source of information. The relevant data and
information were collected from Stock Exchanges, Annual Reports of different commercial
banks of Bangladesh, Bangladesh Bank, Securities and Exchange Commission and web sites
of the respective commercial banks. In addition to the study purpose, different published

Comparative Financial Performance Assessment of Islamic Banks and Traditional Banks ..... 115
articles, books, newspaper, and websites have also been reviewed and consulted. For
analyzing purposes various financial and accounting ratios also have been used like capital
adequacy ratios, Assets quality ratios, Management efficiency ratios, Profitability ratios such
as Return on assets, return on equity, earning per share, price earnings ratio, and Liquidity
ratios. It would be also used simple average trend analysis for the analysis of the performance.
The following Islami banks are selected for the study. The banks are Islami Bank of
Bangladesh Limited (IBBL), Social Islami Bank Limited (SIBL), Al-Arafah Islami Bank
(AIAIB), Shahjalal Islami Bank Limited (ShaIBL), First security Islami Bank Limited
(FSIBL), and out of the traditional bank, it is selected Prime Bank limited (PBL), Mercantile
Bank Limited(MBL), Dutch Bangla Bank Limited (DBBL), Bank Asia Limited (BAL),
National Bank Limited (NBL), The sample banks cover only private Islamic banks that are
incorporated in Bangladesh and Private Commercial banks and most of the banks are within
2nd
generation. So out of the 30 banks, the study has covered 10 banks purposively and the
Sample represents 33.33% of total population.
This study is mainly based on data from secondary sources. The relevant data and information
were collected from Stock Exchanges, As a source of data, annual reports of the concern
banks have been selected because, annual reports are published and communicated by the
banks compulsorily in every year. Schedule banks statistics Bangladesh Bank, Securities and
Exchange Commission and web sites of the respective commercial banks also have been used
for study purpose. In addition different published articles, books, newspaper, and websites
have also been reviewed and consulted. For analyzing purposes, statistical measures;
Descriptive statistics like mean, standard deviation, growth percentage & coefficient of
variation.
4. Model Building
=
Ratio Analysis Performance
Capital Adequacy
Asset Quality
Profitability
Management
Efficiency
Liquidity ratio

International Journal of Ethics in Social Sciences, Vol. 4, No. 1, June 2016 116
5. Review of Literature
Tanbir and Kashfia in their article “Performance Evaluation of Selected Private Bank in
Bangladesh” analyzed the development and growth of selected private commercial Banks of
Bangladesh. The writers observed that all the selected commercial banks are able to achieve a
stable growth of branches, employees, deposits, loans & advances, net income, and earnings
per share during the period of 2002-2006.
Salma and Sarahat published an article “Performance Evaluation of Agricultural Banks in
Bangladesh” and found that the performance of this sector has a major impact on the overall
economic development of the country. For efficient performance of this sector proper credit
facilities and adequate support is essential both from government and private sector.
Mabwe and Robert in investigate the performance of South Africa’s commercial banking
sector for the period 2005- 2009 in their article “A Financial Ratio Analysis of Commercial
Bank Performance in South Africa”. The study found that overall banking performance was
increased considerably in the first two years of the study. A significant change in trend is
noticed at the onset of the global financial crisis in 2007, reaching its peak during 2008-2009.
This resulted in falling profitability, low liquidity and deteriorating credit quality in the South
African Banking sector.
Ahasan described in his study “A comparative analysis on different scheduled banks
performance in Bangladesh: A wake up call for NCBs and DFIs” that over the years NCBs
owns the highest number of branches but perform very poorly whereas FCBs possess the least
number of branches but with outstanding performance. It is also revealed that from 2004
PCBs outperforming NCBs and taking over most of their business with their highly
competitive services.
Analysis and Finding:
2.2 Performance Assessment through Ratio Analysis
2.2.1. Capital Adequacy Ratio: Capital adequacy enables a bank to meet any financial
unfavorable situation due to credit risk, market risk, interest rate risk, FX risk. Capital
adequacy protects the interest of depositors of a bank. Capital adequacy is determined with on
the basis of some ratios. Among these ratios, Capital to Risk Weighted Assets (CRAR) is
most important. In this ratio, capital is determined against total risk weighted assets.
Comparative Financial Performance Assessment of Islamic Banks and Traditional Banks ..... 117
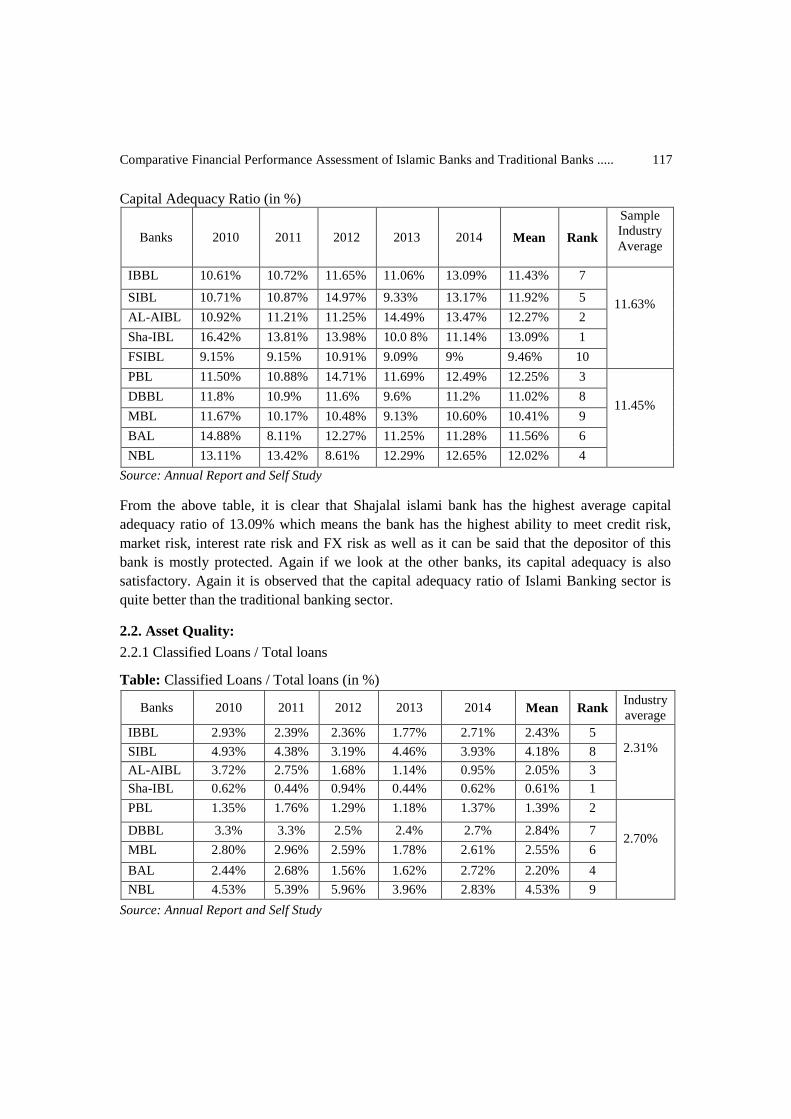
Capital Adequacy Ratio (in %)
Banks 2010 2011 2012 2013 2014 Mean Rank
Sample
Industry
Average
IBBL 10.61% 10.72% 11.65% 11.06% 13.09% 11.43% 7
11.63% SIBL 10.71% 10.87% 14.97% 9.33% 13.17% 11.92% 5
AL-AIBL 10.92% 11.21% 11.25% 14.49% 13.47% 12.27% 2
Sha-IBL 16.42% 13.81% 13.98% 10.0 8% 11.14% 13.09% 1
FSIBL 9.15% 9.15% 10.91% 9.09% 9% 9.46% 10
PBL 11.50% 10.88% 14.71% 11.69% 12.49% 12.25% 3
11.45% DBBL 11.8% 10.9% 11.6% 9.6% 11.2% 11.02% 8
MBL 11.67% 10.17% 10.48% 9.13% 10.60% 10.41% 9
BAL 14.88% 8.11% 12.27% 11.25% 11.28% 11.56% 6
NBL 13.11% 13.42% 8.61% 12.29% 12.65% 12.02% 4
Source: Annual Report and Self Study
From the above table, it is clear that Shajalal islami bank has the highest average capital
adequacy ratio of 13.09% which means the bank has the highest ability to meet credit risk,
market risk, interest rate risk and FX risk as well as it can be said that the depositor of this
bank is mostly protected. Again if we look at the other banks, its capital adequacy is also
satisfactory. Again it is observed that the capital adequacy ratio of Islami Banking sector is
quite better than the traditional banking sector.
2.2. Asset Quality:
2.2.1 Classified Loans / Total loans
Table: Classified Loans / Total loans (in %)
Banks 2010 2011 2012 2013 2014 Mean Rank Industry
average
IBBL 2.93% 2.39% 2.36% 1.77% 2.71% 2.43% 5
2.31% SIBL 4.93% 4.38% 3.19% 4.46% 3.93% 4.18% 8
AL-AIBL 3.72% 2.75% 1.68% 1.14% 0.95% 2.05% 3
Sha-IBL 0.62% 0.44% 0.94% 0.44% 0.62% 0.61% 1
PBL 1.35% 1.76% 1.29% 1.18% 1.37% 1.39% 2
2.70% DBBL 3.3% 3.3% 2.5% 2.4% 2.7% 2.84% 7
MBL 2.80% 2.96% 2.59% 1.78% 2.61% 2.55% 6
BAL 2.44% 2.68% 1.56% 1.62% 2.72% 2.20% 4
NBL 4.53% 5.39% 5.96% 3.96% 2.83% 4.53% 9
Source: Annual Report and Self Study

International Journal of Ethics in Social Sciences, Vol. 4, No. 1, June 2016 118
Classified loan is that loan which falls in danger of default. Classified loans have unpaid
interest and principal outstanding and it is unclear whether the bank will be able to recoup the
loan proceeds from the borrower. So, every company wants to minimize this type of loans.
The bank that has lower rate of classified loan to total loan is in better position in market.
From the table, it is seen that Sha-IBL has minimum rate of classified loan to total loan where
NBL has the highest rate. Moreover the rate of classified loan to total of Islami Banking
sector is lower than that of Traditional bank.
2.3 Credit /Asset quality:
2.3.1. Non-performing loan to total loan
Bank name 2010 2011 2012 2013 2014
Average of
NLL of sample
bank
Rank
Average of NLL
of Sample
Industry
Al arafah IB 0.037 0.029 0.016 0.011 .009 0.0204 or
2.04%
3
0.0141 or 1.41% Shah Jalal IB .006 .004 .009 0.01 0.01 0.0078 or
0.78%
1
Prime Bank 0.013 0.016 0.012 0.011 0.013 0.013 or
1.3%
2
0.0189 or
1.81% Mercantile
Bank
0.028 0.028 0.025 0.017 0.026 0.0248 or
2.48%
Source: Annual Report and Self Study
From the above calculation, it is understood that out of the two different types of banks,
Average NLL of islami bank is better than traditional bank as the Average percentage is
0.0189% and 0.0141% respectively. Again if we look at the individual bank we observed that
among the Islami bank Nonperformance Loan to Total Loan Sh-IBL is the first position and
Al-AIBL IB is the second position and then among the traditional bank Mercantile bank is the
first position, and Prime bank is the second position. Overally out of four banks Shahjalal
bank has the highest NLL andMercantile bank has the lowest.
2.3.2. Provision for Loan Losses to NPL
Provision for Loan Losses to NPL = Provision for Loan Losses / NPL
Source: Annual Report and Self Study
Bank name 2010 2011 2012 2013 2014
Average of
sample
bank
Rank
Average of
Sample
Industry
Al Arafah IB 0.2 0.4 0.2 0.2 0.1 0.22 0.74 or 74%
Shah Jalal IB 1.6 2.4 1.1 0.6 0.6 1.26
Prime Bank 0.6 0.5 0.5 0.6 0.4 0.52
0.49 or 49% Mercantile
Bank
0.6 0.4 0.5 0.5 0.3 0.46

Comparative Financial Performance Assessment of Islamic Banks and Traditional Banks ..... 119
Since the above calculation shown that out of the two different types of banks, Average rate
of Provision for loan losses, traditional bank is better than islami bank as the Average
percentage is 0.74% and 0.49% respectively where lower the rate of provision better the
position. Yet again if we look at the individual bank we observed that among the Islami bank
Provision for Loan Losses to NPL Shahjalal is the first position, Al Arafah is the second
position and then among the traditional bank Prime bank is the first position and Mercantile is
the second position. Overally, out of four banks Shahjalal has the highest Provision for loan
losses and Al Arafah has the lowest.
2.3.3. NPL to Equity Capital
NPL to Equity Capital= Nonperforming Loans / Total Equity Capital
Source: Annual Report and Self Study
From the overhead calculation, It is noticed that out of the two different types of banks,
Average NPL to Equity capital islami bank is better than traditional bank as the average
percentage is 0.196% and 0.153% respectively. Again if we look at the individual bank we
observed that among the Islame bank NPL to Equity Capital Al Arafah is the first position,
Shajalal IB is the second position and then traditional bank, Mercantile bank is the first
position, Prime bank is the second position. An overall out of four banks Mercantile bank has
the highest NPL to Equity capital and Shahjalal IB has the lowest.
2.3.4. NPL Loans to Total Assets
NPL Loans to Total Assets = Nonperforming Loans / Total Assets
Source: Annual Report and Self Study
Bank name 2010 2011 2012 2013 2014 Average of
sample bank
Average of
Sample
Industry
Al arafah IB 0.42 0.30 0.17 0.06 0.06 0.202 0.153 or 15.3%
Shah Jalal IB 0.04 0.04 0.08 0.17 0.19 0.104
Prime Bank 0.18 0.20 0.09 0.08 0.09 0.128 0.196 or 19.6%
Mercan Ban 0.30 0.36 0.29 0.16 0.21 0.264
Bank name 2010 2011 2012 2013 2014
Average of
sample
bank
Rank
Average of
Sample
Industry
Al Arafah IB 0.028 0.022 0.012 0.008 0.007 0.0154 3 0.012 or 1.2%
Shah Jalal IB 0.005 0.003 0.007 0.014 0.014 0.0086 1
Prime Bank 0.009 0.012 0.009 0.008 0.009 0.0094 2 0.0139 or 1.39%
Mercan Ban 0.019 0.022 0.019 0.014 0.018 0.0184 4

International Journal of Ethics in Social Sciences, Vol. 4, No. 1, June 2016 120
From the above calculation, It is seen that out of the two different types of banks, Average
NPL Loans to Total Assets islami bank traditional bank is better than traditional bank as the
Average percentage is 0.0139% and 0.012% respectively. Another time if we look at the
individual bank we observed that among the Islame bank NPL to Total Assets Al Arafah IB is
the first position, Shahjalal IB is the second position and then traditional bank Mercantile
bank is the first position, prime bank is the second position. An overall out of four banks
Mercantile bank has the highest NPL Loans to Total Assets and Shahjalal bank has lowest.
2.3.5. Provision for Loan Losses (PLL) to Total Loans:
Provision for Loan Losses to Total Loans (PLL) = Provision for Loan Losses / Total Loans
Source: Annual Report and Self Study
From the above calculation, it is seen that out of the two different types of banks, Average
Provision for Loan Losses to Total Loans islami bank is better than traditional bank as the
Average percentage is 0.0096 and 0.00872 respectively. Again if we look at the individual
bank we observed that among the Islame bank Provision for Loan Losses to Total Loans
IBBL is the first position, Al Arafah is the second position,Shahjalal is the third position and
traditional banks Mercantile is the first position,Bank Asia is the second position and Prime
bank is the third position. An overall out of six banks IBBL has the highest Provision for
Loan Losses to Total Loans and Shahjalal bank has the lowest.
2.3.6. Provision for loan Losses to Equity Capital
Provision for loan Losses to Equity Capital = PLL/ Equity Capital
Bank name 2010 2011 2012 2013 2014 Average of
sample bank
Average of
Sample Industry
IBBL 0.99 0.93 0.92 0.94 0.94 0.944
0.9172 or 91.97% Social IB 0.83 0.83 0.84 0.82 0.80 0.824
Al Arafah IB 0.99 0.93 0.94 0.99 0.94 0.958
Shah Jalal IB 0.91 0.96 0.93 0.97 0.97 0.948
FSIBL 0.79 0.97 0.91 0.94 0.95 0.912
Prime Bank 0.81 0.85 0.83 0.93 0.87 0.858
0.846 or 84.6% DBBL 0.70 0.81 0.71 0.81 0.79 0.764
Mercan Ban 0.81 0.88 0.83 0.88 0.78 0.836
Bank Asia 0.94 0.94 0.95 0.92 0.87 0.924
National ban 0.76 0.84 0.85 0.89 0.90 0.848
Source: Annual Report and Self Study
Bank name 2010 2011 2012 2013 2014 Average of
sample bank
Average of
Sample
Industry
IBBL 0.02 0.02 0.02 0.01 0.02 0.018
0.00872 or
0.872% Al Arafah IB 0.010 0.011 0.004 0.002 0.001 0.0056
Shah Jalal IB 0.001 0.0008 0.002 0.004 0.005 0.00256
Prime Bank 0.008 0.009 0.007 0.005 0.005 0.0068
0.0096 or
0.96% Mercan Ban 0.017 0.013 0.013 0.009 0.008 0.012
Bank Asia 0.014 0.016 0.007 0.004 0.009 0.01

Comparative Financial Performance Assessment of Islamic Banks and Traditional Banks ..... 121
From the above calculation, it is seen that out of the two different types of banks, Average
Provision for loan Losses to Equity Capital traditional bank is better than islami bank as the
Average percentage is 0.1022% and 0.0099% respectively. Again if we look at the individual
bank we observed that among the Islami bank Provision for loan Losses to Equity Capital
IBBL is the first position, Al Arafah is the second position, Shahjalal is the third position and
traditional bank Mercantile is the first position, Bank Asia is the second position and Prime
bank is the third position. An overall out of six banks Mercantile has the highest Provision for
loan Losses to Equity Capital and Shahjalal has the lowest.
2.4. Management Efficiency
2.4.1. Tax Management Efficiency
The ratio Management Efficiency means the efficiency of BCBL management to save their
expense taxes
Tax Management Efficiency = Net Income after Taxes / Net Income before Taxes
Bank name 2010 2011 2012 2013 2014
Average of
sample
bank
Average of
Sample
Industry
IBBL 0.37 0.42 0.52 0.53 0.47 0.462
0.506 or 50.6% Al arafah IB 0.08 0.53 0.54 0.68 0.56 0.478
Shah Jalal IB 0.53 0.52 0.59 0.70 0.49 0.566
FSIBL 0.52 0.55 0.50 0.55 0.47 0.518
Prime Bank 0.59 0.50 0.60 0.55 0.53 0.554
0.5195 or 51.95% DBBL 0.46 0.46 0.53 0.54 0.47 0.492
Mercan Ban 0.45 0.39 0.48 0.58 0.57 0.494
Bank Asia 0.56 0.54 0.58 0.48 0.53 0.538
Source: Annual Report and Self Study
From the above calculation, it is seen that out of the two different types of banks, Average
Tax Management Efficiency traditional bank is better than islami bank as the Average
percentage is 0.5195% and 0.506% respectively. Another time if we look at the individual
bank we observed that among the Islame bank Shahjalal bank is the first position, FCIB is the
second position, Al Arafah is third position, IBBL is the fourth position and traditional bank
prime bank is the first position, Bank Asia is the second position, Mercantile is the third
position, DBBL is the fourth position. An overall out of eight banks Shahjalal has the highest
Tax Management Efficiency and IBBL has the lowest.
International Journal of Ethics in Social Sciences, Vol. 4, No. 1, June 2016 122
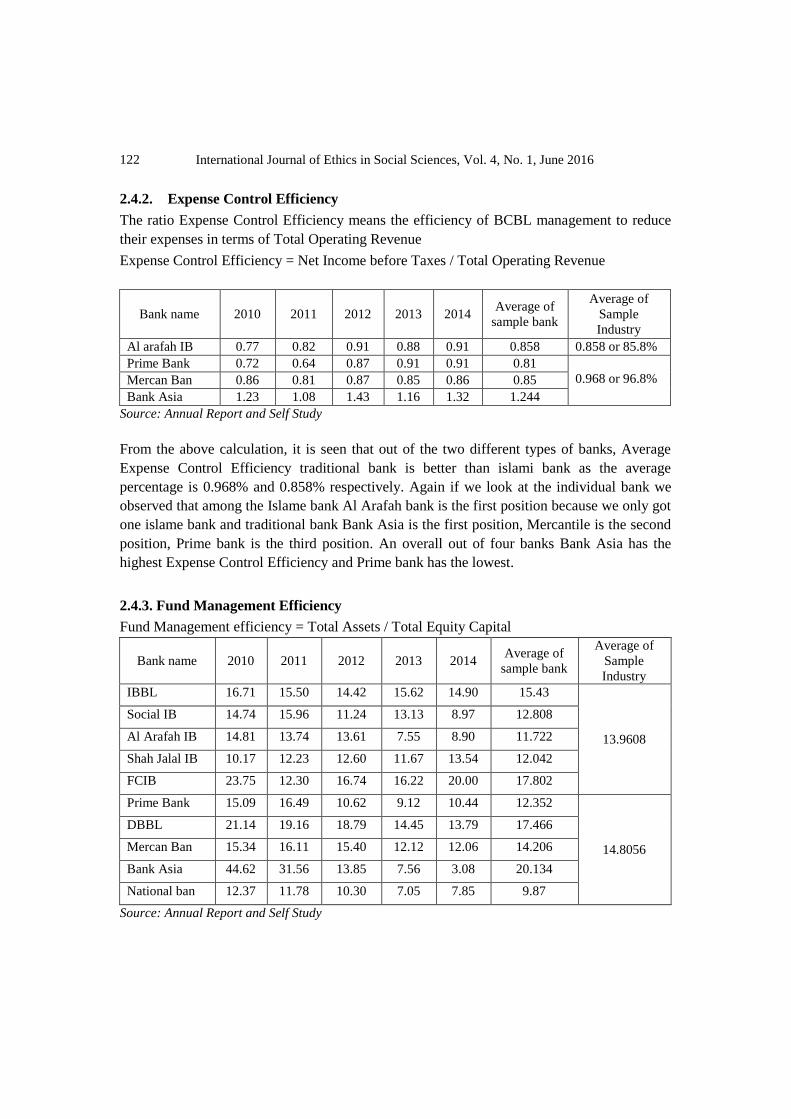
2.4.2. Expense Control Efficiency
The ratio Expense Control Efficiency means the efficiency of BCBL management to reduce
their expenses in terms of Total Operating Revenue
Expense Control Efficiency = Net Income before Taxes / Total Operating Revenue
Bank name 2010 2011 2012 2013 2014 Average of
sample bank
Average of
Sample
Industry
Al arafah IB 0.77 0.82 0.91 0.88 0.91 0.858 0.858 or 85.8%
Prime Bank 0.72 0.64 0.87 0.91 0.91 0.81
0.968 or 96.8% Mercan Ban 0.86 0.81 0.87 0.85 0.86 0.85
Bank Asia 1.23 1.08 1.43 1.16 1.32 1.244
Source: Annual Report and Self Study
From the above calculation, it is seen that out of the two different types of banks, Average
Expense Control Efficiency traditional bank is better than islami bank as the average
percentage is 0.968% and 0.858% respectively. Again if we look at the individual bank we
observed that among the Islame bank Al Arafah bank is the first position because we only got
one islame bank and traditional bank Bank Asia is the first position, Mercantile is the second
position, Prime bank is the third position. An overall out of four banks Bank Asia has the
highest Expense Control Efficiency and Prime bank has the lowest.
2.4.3. Fund Management Efficiency
Fund Management efficiency = Total Assets / Total Equity Capital
Bank name 2010 2011 2012 2013 2014 Average of
sample bank
Average of
Sample
Industry
IBBL 16.71 15.50 14.42 15.62 14.90 15.43
13.9608
Social IB 14.74 15.96 11.24 13.13 8.97 12.808
Al Arafah IB 14.81 13.74 13.61 7.55 8.90 11.722
Shah Jalal IB 10.17 12.23 12.60 11.67 13.54 12.042
FCIB 23.75 12.30 16.74 16.22 20.00 17.802
Prime Bank 15.09 16.49 10.62 9.12 10.44 12.352
14.8056
DBBL 21.14 19.16 18.79 14.45 13.79 17.466
Mercan Ban 15.34 16.11 15.40 12.12 12.06 14.206
Bank Asia 44.62 31.56 13.85 7.56 3.08 20.134
National ban 12.37 11.78 10.30 7.05 7.85 9.87
Source: Annual Report and Self Study

Comparative Financial Performance Assessment of Islamic Banks and Traditional Banks ..... 123
From the above calculation, it is seen that out of the two different types of banks, Average
Fund Management efficiency traditional bank is better than islami bank as the Average
percentage is 14.8056% and 13.9608% respectively. Again if we look at the individual bank
we observed that among the Islame bank FCIB is the first position, IBBL is the second
position, Social is the third position, Shahjalal is the fourth position, Al Arafah is the fifth
position and traditional bank Bank Asia is the first position, DBBL is the second position,
Mercantile is the third position, Prime bank is the fourth position, National bank is the fifth
position. An overall out of ten banks Bank Asia has the highest Fund Management efficiency
and National bank has the lowest.
2.5. Profitability:
2.5.1. Return on Assets (ROA)
Table: 1 Return on Assets
Name of
Banks 2010 2011 2012 2013 2014
Average
Growth
(%)
Rank
Average
growth of
sample
Industry
IBBL 0.84 1.27 1.34 1.47 1.35
14.89%
Growth(%) - 51.19 5.51 7.29 -8.16 11.17 5
AL-AIBL 1.15 1.80 1.77 2.65 2.06
Growth(%) - 56.52 -1.66 44.63 -22.26 15.45 3
Sha-IBL 2.60 2.26 2.08 3.01 1.26
Growth(%) - -13.07 -7.96 44.71 -58.13 -6.89 9
FSIBL 0.47 0.61 1.56 1.89 1.75
Growth(%) - 29.78 155.73 21.15 -7.40 39.85 1
PBL 1.99 1.30 2.37 2.22 2.07
9.47%
Growth(%) - -34.67 82.30 -6.32 -33.3 1.60 8
DBBL 1.01 1.49 1.60 1.65 1.92
Growth(%) - 47.52 7.38 3.12 16.36 14.88 4
MBL 1.20 1.10 1.22 1.64 1.49
Growth(%) - -8.33 10.90 34.42 -9.14 5.57 6
BAL 2.11 1.87 2.18 2.22 1.72
Growth(%) - -11.37 16.57 1.83 -22.52 3.00 7
NBL 2.40 2.36 2.52 6.05 4.01
Growth(%) - -1.66 6.77 140.07 -33.71 22.29 2
Source: Annual Report and Self Study

International Journal of Ethics in Social Sciences, Vol. 4, No. 1, June 2016 124
From the above calculation, It is seen that out of the two different types of banks, the Average
growth of Return on Assets of islami bank is better than traditional bank as the average
growth of islami bank is 14.89% where traditional bank has 9.47% in this regard and if seen
at the individual bank, then it is observed that FSIBL is on of the first position, 2nd
ranking
bank position in hold by NBL and last ranking bank is Sha-IBL.
2.5.2. Return on Equity (ROE)
Table: 2 Return on Equity
Name of
Banks 2010 2011 2012 2013 2014
Average
Growth
(%)
Rank
Average
growth of
sample
Industry
IBBL 13 19.02 16.93 19.00 17.42
1.99%
Growth(%) - 46.30 -10.99 12.22 -8.31 7.84 2
AL-AIBL 17.05 24.70 24.10 20.01 18.34
Growth(%) - 44.87 -2.43 -16.97 -8.34 3.43 3
Sha-IBL 23.21 25.58 25.10 30.71 13.18
Growth(%) - 10.21 -1.88 22.35 -57.08 -5.28 7
PBL 30.68 20.58 30.19 32.12 19.61
1.14%
Growth(%) - -32.92 46.69 6.39 -38.94 -3.75 5
DBBL 24.02 29.56 30.28 32.25 30
Growth(%) - -23.06 2.43 6.80 -6.97 -4.16 6
MBL 18.45 17.75 18.80 19.84 17.95
Growth(%) - -3.79 5.91 5.53 -9.52 -0.37 4
BAL 31.36 23.00 32.03 32.12 19.61
Growth(%) - -27.15 39.26 .28 -38.94 -5.32 8
NBL 31.57 28.38 27.53 48.96 29.96
Growth(%) - -10.10 -2.99 77.84 38.80 20.71 1
Source: Annual Report and Self Study
From the above calculation, It is seen that out of the two different types of banks, the Average
growth of Return on Equity of islami bank is better than traditional bank as the average
growth of islami bank is 1.99% where traditional bank has1.14% by the way and if look at the
individual bank, then it is observed that is on of the first position NBL, 2nd
ranking bank
position in hold by IBBL and the last ranking bank BAL.

Comparative Financial Performance Assessment of Islamic Banks and Traditional Banks ..... 125
2.5.3. Earning Per Share:
Table: 3 Earning Per Share
Name of
Banks 2010 2011 2012 2013 2014
Average
Growth
(%)
Rank
Average
growth of
sample
Industry
IBBL 3.00 4.33 4.59 4.46 4.84
6.20%
Growth(%) - 44.22 6.00 -2.83 8.52 11.18 4
SIBL 17.60 17.20 18.39 2.15 1.81
Growth(%) - -2.27 6.91 -88.30 -15.81 -19.89 9
AL-AIBL 2.51 3.72 2.00 4.14 3.73
Growth(%) - 48.20 -46.23 107 -9.90 19.81 1
Sha-IBL
Growth(%)
FSIBL 3.20 7.35 1.42 1.61 1.71
Growth(%) - 129.68 -80.68 13.38 6.21 13.72 2
PBL 6.16 4.33 7.83 5.69 4.70
3.67%
Growth(%) - -29.70 80.83 -27.33 -17.39 1.28 7
DBBL 23.74 5.48 5.69 10.01 10.75
Growth(%) - -76.92 3.83 75.92 7.39 2.04 6
MBL 30.05 28.53 30.67 41.04 34.90
Growth(%) - -5.05 7.50 34.52 -14.96 4.40 5
BAL 52.02 39.38 61.88 64.26 36.5
Growth(%) - -24.29 57.13 3.85 -43.18 -1.30 8
NBL 5.33 7.27 4.69 7.97 7.07
Growth(%) - 36.40 -35.49 69.93 -11.29 11.91 3
Source: Annual Report and Self Study
From the above calculation, It is seen that out of the two different types of banks, the Average
growth of Earning per share of islami bank is better traditional bank as the average growth of
islami bank is 6.20% where traditional bank has 3.67% % incidentally and if we look at the
individual bank, then it is observed that AL-AIBL is on of the first position, 2nd
ranking bank
position in hold by FSIBL and last ranking bank SIBL.

International Journal of Ethics in Social Sciences, Vol. 4, No. 1, June 2016 126
2.5.4. Price Earnings Ratio (P/E ratio)
Price to Earnings Ratio = Market Price Per share /Earning per Share
Bank name 2010 2011 2012 2013 2014
Average of
P/E ratio of
sample
bank
Average of
P/E ratio of
Sample
Industry
IBBL 17.88 10.78 12.87 13.29 11.27 13.218
14.26 Al arafah IB 14.62 9.53 11.23 13.24 10.13 11.75
Shah Jalal IB 10.58 8.55 12.24 17.04 12.38 12.158
FCIB N/A 23.74 15.39 25.21 15.37 19.9275
Prime Bank 15.01 12.46 8.38 16.60 9.47 12.384
17.568 DBBL 28.5 78.7 34.42 22.9 15.0 35.904
Mercan Ban 13.83 12.21 12.88 14.14 9.97 12.606
Bank Asia 10.03 9.73 6.90 8.34 10.48 9.096
National ban 28.03 13.95 13.78 24.04 9.45 17.85
Source: Annual Report and Self Study
From the above calculation, It is seen that out of the two different types of banks, the Average
P/E of traditional bank is better than islami bank as the Average percentage is 17.56% and
14.26% respectively. Again if we look at the individual bank, we observed that among the
Islamic bank Price Earnings ratio of FCIB is the first position, IBBL is the second position,
shajalal IB is the third position, AI Arafah IB is the fourth position and then among the
traditional bank DBBL is on the first position, National bank is second position, Mercantile
bank is third position, Prime bank is the fourth position and Bank Asia is on the fifth position.
Overally, out of Nine Banks, DBBL has the highest P/E ratio and Bank Asia has the
lowest P/E.
2.6. Operating Efficiency:
2.6.1. Net Interest Margin (NIM)
Net Interest Margin (NIM) = Net Interest Income/ Total Assets.
Source: Annual Report and Self Study
Bank name 2010 2011 2012 2013 2014
Average of
NIM sample
bank
Average of
NIM of Sample
Industry
IBBL 0.02% 0.03% 0.02% 0.02% 0.03% 0.024%
0.045 or 4.5% Al arafah IB 0.02% 0.03% 0.02% 0.01% 0.37% 0.09%
Shah Jalal IB 0.03% 0.02% 0.02% 0.02% 0.02% 0.022%
Prime Bank 0.02% 0.01% 0.01% 0.02% 0.02% 0.016%
0.0239 or
2.39%
Mercan Ban 0.02% 0.02% 0.03% 0.03% 0.02% 0.024%
Bank Asia .008% 0.01% 0.02% 0.05% 0.07% 0.0316%
National ban 0.02% 0.03% 0.02% 0.02% 0.03% 0.024%

Comparative Financial Performance Assessment of Islamic Banks and Traditional Banks ..... 127
From the above calculation, it is seen that out of the two different types of banks, the Average
NIM islami bank is better than traditional bank as the Average percentage is 0.045% and
0.0239% respectively. Again if we look at the individual bank we observed that among the
Islamic bank Net Interest Margin of Al Arafah IB is the first position, IBBL is the second
position, Shajalal is the third position and then among the traditional bank Asia bank is the
first position, Mercantile bank and National bank is the second position, Prime bank is the
third position. Overalls out of Seven Banks, AL Arafah has the highest NIM and Prime has
the lowest NIM.
2.6.2. Net Noninterest Margin: operating performance ratio
Net Noninterest Margin = Net Noninterest Income/ Total Assets.
Bank name 2010 2011 2012 2013 2014
Average of
NNIM
sample bank
Average of
NNIM of
Sample
Industry
Al Arafah IB 0.004% 0.007% 0.008% 0.02% 0.03% 0.0138% 0.0138 or
1.38%
Prime Bank 0.01% 0.01% 0.02% 0.01% 0.01% 0.012%
0.0664 or
6.64% Mercan Ban 0.25% 0.05% -0.13% 0.15% 0.87% 0.238%
Bank Asia .001% .0006% -.002% .002% -.003% -0.00028%
National ban 0.01% 0.01% .009% 0.03% 0.02% 0.0158%
Source: Annual Report and Self Study
From the above calculation, It is seen that out of the two different types of banks, the Average
NNIM traditional bank is better than islami bank as the Average percentage is 0.0664% and
0.0138% respectively. Traditional bank is better because here we only found one islami bank
NNIM. Again if we look at the individual bank observed that among the Islamic bank Net
Interest Margin Al Arafa IB I only got it and then among the traditional bank mercantile bank
is the first position, National bank is the second position, Prime bank is the third position, and
Bank Asia is the list position.
International Journal of Ethics in Social Sciences, Vol. 4, No. 1, June 2016 128
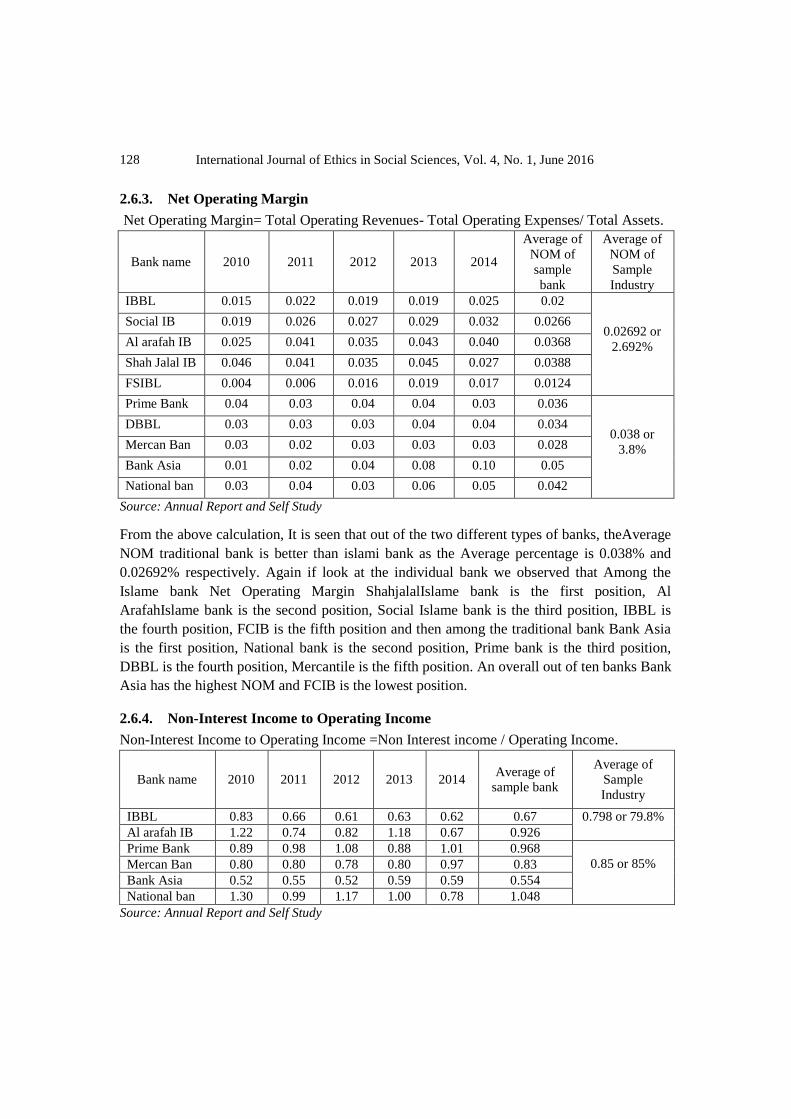
2.6.3. Net Operating Margin
Net Operating Margin= Total Operating Revenues- Total Operating Expenses/ Total Assets.
Bank name 2010 2011 2012 2013 2014
Average of
NOM of
sample
bank
Average of
NOM of
Sample
Industry
IBBL 0.015 0.022 0.019 0.019 0.025 0.02
0.02692 or
2.692%
Social IB 0.019 0.026 0.027 0.029 0.032 0.0266
Al arafah IB 0.025 0.041 0.035 0.043 0.040 0.0368
Shah Jalal IB 0.046 0.041 0.035 0.045 0.027 0.0388
FSIBL 0.004 0.006 0.016 0.019 0.017 0.0124
Prime Bank 0.04 0.03 0.04 0.04 0.03 0.036
0.038 or
3.8%
DBBL 0.03 0.03 0.03 0.04 0.04 0.034
Mercan Ban 0.03 0.02 0.03 0.03 0.03 0.028
Bank Asia 0.01 0.02 0.04 0.08 0.10 0.05
National ban 0.03 0.04 0.03 0.06 0.05 0.042
Source: Annual Report and Self Study
From the above calculation, It is seen that out of the two different types of banks, theAverage
NOM traditional bank is better than islami bank as the Average percentage is 0.038% and
0.02692% respectively. Again if look at the individual bank we observed that Among the
Islame bank Net Operating Margin ShahjalalIslame bank is the first position, Al
ArafahIslame bank is the second position, Social Islame bank is the third position, IBBL is
the fourth position, FCIB is the fifth position and then among the traditional bank Bank Asia
is the first position, National bank is the second position, Prime bank is the third position,
DBBL is the fourth position, Mercantile is the fifth position. An overall out of ten banks Bank
Asia has the highest NOM and FCIB is the lowest position.
2.6.4. Non-Interest Income to Operating Income
Non-Interest Income to Operating Income =Non Interest income / Operating Income.
Bank name 2010 2011 2012 2013 2014 Average of
sample bank
Average of
Sample
Industry
IBBL 0.83 0.66 0.61 0.63 0.62 0.67 0.798 or 79.8%
Al arafah IB 1.22 0.74 0.82 1.18 0.67 0.926
Prime Bank 0.89 0.98 1.08 0.88 1.01 0.968
0.85 or 85% Mercan Ban 0.80 0.80 0.78 0.80 0.97 0.83
Bank Asia 0.52 0.55 0.52 0.59 0.59 0.554
National ban 1.30 0.99 1.17 1.00 0.78 1.048
Source: Annual Report and Self Study

Comparative Financial Performance Assessment of Islamic Banks and Traditional Banks ..... 129
From the above calculation, It is seen that out of the two different types of banks, Average
Non-Interest Income to Operating Income traditional bank is better than islami bank as the
Average percentage is 0.85% and 0.798% respectively. Again if look at the individual bank
we observed that among the Islame bank Non-Interest to Operating Income Al Arafah IB is
the first position, IBBL is the second position and then traditional bank National bank is the
first position, prime bank is the second position, Mercantile bank is the third position, Bank
Asia is the fourth position. An overall out of seven banks National bank has the highest Non-
Interest Income to Operating income and Bank Asia has lowest.
2.6.5. Interest Income to Operating Income
Interest Income to Operating Income = Interest Income / Operating Income.
Source: Annual Report and Self Study
From the above calculation, it is seen that out of the two different types of banks, Average
Interest Income to Operating Income islami bank is better than traditional bank as the
Average percentage is 2.78% and 2.362% respectively. Again if look at the individual bank
we observed that among the Islame bank Interest Income to Operating Income IBBL is the
first position, Al Arafah IB is the second position, Shahjalal IB is the third position and then
traditional bank Mercantile bank is the first position, Bank Asia is the second position, prime
bank is the third position, National bank is the fourth position. An overall out of seven banks
IBBL has the highest Interest Income to Operating Income and National bank has lowest.
2.6.6. Interest Expense to Interest Income
Interest Expense to Interest Income = Interest Expense / Interest Income.
Bank name 2010 2011 2012 2013 2014 Average of
sample bank
Average of Sample
Industry
IBBL 0.64 0.62 0.61 0.58 0.57 0.604
0.650 or 65% Al arafah IB 0.73 0.64 0.67 0.73 0.58 0.67
Shah Jalal IB 0.60 0.60 0.70 0.72 0.73 0.67
Prime Bank 0.73 0.78 0.77 0.64 0.75 0.734
0.6985 or 69.85% Mercan Ban 0.70 0.72 0.70 0.67 0.75 0.708
Bank Asia 0.74 0.75 0.72 0.65 0.75 0.722
National ban 0.66 0.62 0.64 0.58 0.65 0.63
Source: Annual Report and Self Study
Bank name 2010 2011 2012 2013 2014 Average of
sample bank
Average
of sample
Industry
IBBL 3.85 3.07 3.28 2.93 3.09 3.244
2.78 Al arafah IB 3.85 2.74 2.52 1.50 2.40 2.602
Shah Jalal IB 2.26 2.34 2.70 1.81 3.37 2.496
Prime Bank 2.20 2.36 2.05 1.97 2.24 2.164
2.362 Mercan Ban 3.21 3.54 3.52 2.69 3.06 3.204
Bank Asia 2.32 2.61 2.38 1.97 2.70 2.396
National ban 1.94 1.85 2.06 1.07 1.50 1.684

International Journal of Ethics in Social Sciences, Vol. 4, No. 1, June 2016 130
From the above calculation, it is seen that out of the two different types of banks, Average
Interest Expense to Interest Income traditional income is better than islami bank as the
average percentage is 0.6985% and 0.650% respectively. Again if appearance at the
individual bank we observed that among the Islame bank Interest Expense to Interest Income
Al Arafah IB & Shajalal IB is the first position, IBBL is the second position and then
traditional bank Prime bank is the first position, Bank Asia is the second position, Mercantile
bank is the third position, National bank is the fourth position. An overall out of seven banks
Prime bank has the highest Interest Expense to Interest Income and IBBL has the lowest.
2.7. Liquidity Ratio:
2.7.1. Loan to Deposits
The ratio Loan to Deposits means the percentage of total deposits used to giving loan.
Loan to Deposits = Total Loans / Total Deposits.
Source: Annual Report and Self Study
From the above calculation, it see that out of the two different types of banks, Average Loan
to Deposits islami bank is better than traditional bank as the Average percentage is 0.9172%
and 0.846% respectively. Again if we look at the individual bank we observed that among the
Islame bank Loan to Deposits Al Arafah is the first position, Shahjalal is the second position,
IBBL is the third position, FCIB is the fourth position, Social bank is the fifth position and
traditional bank Asia bank is the first position, Prime bank is the second position, National
bank is the third position, Mercantile bank is the fourth position, DBBL is the fifth position.
An overall out of ten banks Al Arafah has the highest Loan to Deposits and social bank has
the lowest.
2.7.2. Net Loans to Total Assets
The ratio Net Loans to Total Assets means the portion of total Assets used to giving loan.
Net Loans to Total Assets = Net Loans / Total Assets.
Bank name 2010 2011 2012 2013 2014 Average of
sample bank
Average of
Sample Industry
Al Arafah IB 0.73 0.72 0.73 0.71 0.72 0.722 0.731 or 73.1%
Shah Jalal IB 0.72 0.74 0.74 0.76 0.74 0.74
Prime Bank 0.71 0.67 0.70 0.74 0.69 0.702 0.708 or 70.8%
Mercan Ban 0.69 0.75 0.71 0.75 0.67 0.714
Source: Annual Report and Self Study
Bank name 2010 2011 2012 2013 2014 Average of
sample bank
Average of Sample
Industry
IBBL 0.28 0.23 0.21 0.16 0.24 0.224
0.1022 or 10.22% Al Arafah IB 0.12 0.12 0.04 0.01 0.008 0.0596
Shah Jalal IB 0.008 0.007 0.02 0.03 0.05 0.023
Prime Bank 0.09 0.10 0.05 0.03 0.04 0.062
0.099 or 9.9% Mercan Ban 0.19 0.17 0.15 0.08 0.07 0.132
Bank Asia 0.15 0.19 0.07 0.05 0.06 0.104
Comparative Financial Performance Assessment of Islamic Banks and Traditional Banks ..... 131
From the above calculation, it see that out of the two different types of banks, Average Net
Loans to Total Assets islami bank is better than traditional bank as the Average percentage is
0.731% and 0.708% respectively. Again if we look at the individual bank we observed that
among the Islame bank Shahjalal bank is the first position, Al Arafah is the second position
and traditional bank Mercantile bank is the first position and Prime bank is the second
position. An overall out of four banks Shahjalal has the highest Net Loans to Total Assets and
Prime bank has the lowest.
Findings and conclusion
In terms of the average growth of number of branches top position is held by FSIBL and the
last position is IBBL. Where in case of the number of employees 1st position is said by
DBBL and the bottom position is carried by IBBL. Again in the growth of Paid up Capital
bottom most position is by DBBL and the last position is Sha-IBL. Further more, it is seen
that growth of Total Assets position is held by Sha-IBL and the last position is IBBL. More
over, in term of the Investment position is said by Sha-IBL and the last position is IBBL. In
term of last five year survey Operating Profit, first position bank is FSIBL and the last
position is PBL. Last five year survey Capital Adequacy first position bank is Sha-IBL and
lowest position is FSIBL. In term of highest position Asset quality bank is NBL and the
lowest position bank is Sha-IBL. Additionally, in term of nonperformance loan to total loan
Sha-IBL is the 1st position and MBL is the lowest position. Where in case of provision for
loan losses to NPL AL-AIBL is the first position and the bottom position is carried by PBL.
Last five year survey NPL to equity capital first position bank is Sha-IBL and the last position
bank is MBL. Further more, it is seen that NPL loans to total assets the first position bank is
Sha-IBL and the last position bank is MBL. Where in case of provision for loan losses to total
loans Sha-IBL is the first position and BAL is the lowest position. In terms of the average of
sample industry provision for loan losses to equity capital is the first position bank is DBBL
and the last position bank is AL-AIBL. The growth of Return on Assets position is held by
FSIBL and the last position is Sha-IBL. Average of sample industry tax management
efficiency FSIBL is the first position and IBBL is the lowest position. Average of sample
industry expense control efficiency BAL is the first position and the last position bank PBL.
In term of highest position fund management efficiency bank is BAL and the lowest position
bank is NBL. The growth of Return on Equity first position bank is NBL and the last position
bank is BAL. In this survey see Earning per Share first position bank is AL-AIBL and the last
position bank is SIBL. Price earnings ratio highest position bank is DBBL and the lowest
position bank is NBL. Average of sample industry net interest margin AL-AIBL is the highest
position and lowest position bank is PBL. Further more, it is seen that net noninterest margin
the first position bank is MBL and the lowest position is BAL. In terms of the average of
sample industry net operating margin highest position bank BAL and the lowest position is
FSIBL. Where in case of the non-interest income to operating income NBL is the first
position and the lowest position bank is BAL. Interest income to operating income top

International Journal of Ethics in Social Sciences, Vol. 4, No. 1, June 2016 132
position is IBBL and bottom position is NBL. Further, in term of interest expense to interest
income top position is PBL and the bottom position is IBBL.
So, Over ally, it can be said that the performance of the both of the banking sector in
Bangladesh is satisfactory as almost all of the sample banks has at least more than 11% risk
weighted asset, the classified loan to total loan of this sector is decreasing gradually. On the
other hand, profitability is being increasing significantly over last five years. However, if it is
compared to the Islamic Banking sector and Traditional banking sector, it is found that
Islamic banking sector has better capital adequacy, Asset quality management ability,
Management efficiency, Profitability and Liquidity position than Traditional banking sector.
So in fine it can be said that the performance of Islamic Bank in Bangladesh is more pleasing
than Traditional Bank.
Reference:
Al Shammari, M., & Salimi, A. 1998. Modeling the operating efficiency of banks, A parametric
methodology. Journal of Logistic Information Management, Vol. 11. pp. 5-17.
Dutta, D. D. K. & Bhattacharjee, D. M. K. 2001. The assessment of financial and operating
performance of the cement industry: A case study of confidence cement ltd. The Chittagong
University, Journal of Commerce, Vol. 16, pp. 1-16.
Hye, D.M.A. & Rahman, M.A. 1997. Performance of Selected Private Sector General Insurance
Companies in Bangladesh, Chittagong University Studies (Commerce), Vol. 13, pp. 137-160.
Jahangir, N., Shill, S., & Haque, M. A. J. 2007. Examination of Profitability in the Context of
Bangladesh Banking Industry, ABAC Journal, Vol. 27, No. 2, pp. 36-46.
LIN, W.C., LIU, C.F., & CHU, C.W. 2005. Performance efficiency evaluation of the Taiwan’s
shipping Industry: An application of DEA, Proceeding of the Transportation Studies, Vol. 5, pp.
467-476.
Ohlson, J.A. 1980. Financial Ratios and the Probabilistic Prediction of Bankruptcy. Journal
of Accounting Research, Vol.19, No. 1, pp. 61-80.
Pandey, I.M. 1979. Financial Management, Vikas Publishing House Pvt. Ltd, New Delhi, pp.
109-116.
Prasanna, 1995. The Investment Game, New Delhi, McGraw Hill Publishing Co. Limited, pp.172
Shaikh, M. A. H., & Miah, M. A.S. 1979. Financial Position and Performance analysis of Bangladesh
Shilpa Bank, Islamic University Studies (part C), Vol. 1, No. 2, December, p p.
207-225.
Sina, M. A., & Matubber, M. A. A. 1998. Financial Statement Analysis of Khulna Newsprint Mills
Limited, Islamic University Studies (part C), Vol. 1, No. 2, December, pp.179-189.
Samad, A. 2004. Bahrain Commercial Bank’s Performance during 1994-2001. Credit and Financial
Management Review, 10 (1), pp. 33-40
Salauddin, A. 2001. Profitability of Pharmaceutical Companies of Bangladesh. Journal of Commerce,
Chittagong University, Vol. 16, pp. 54-64.