comparative evaluation of mitochondrial antioxidants in
TRANSCRIPT

INTRODUCTION
Reactive oxygen species (ROS), when produced in excess by oxidative phosphorylation, overwhelms the antioxidant capacity of the of the target cell, resulting in oxidative stress [1]. ROS accumulation can be di-rectly associated with reversible or irreversible cell
injury and initiate formation of a microenvironment favorable for carcinogenesis [2]. ROS-activated mi-croenvironment may contribute to the formation of newly activated pre-neoplastic cells or may enable the clonal proliferation of latent pre-neoplastic cells lead-ing to carcinogenesis [1]. Several metabolic altera-tions have been observed in cancerous cells such as
Kurume Medical Journal, 66, 15-27, 2019
Comparative Evaluation of Mitochondrial Antioxidants in Oral Potentially Malignant Disorders
SUMITA BANERJEE, SAIKAT MUKHERJEE *, SANJIB MITRA ** AND PALLAV SINGHAL †
Department of Oral Pathology and Microbiology, Dental College, Regional Institute of Medical Sciences, Imphal 795004, * Department of Biochemistry, Manipur University, Imphal 795003,
** Department of Oral Pathology, Burdwan Dental College and Hospital, Burdwan 713101, † AL-FALAH School of Medical Sciences and Research Center, AL- Falah University, Dhauj 121004, India
Received 22 November 2018, accepted 25 March 2019J-STAGE advance publication 1 May 2020
Edited by JINGO KUSUKAWA
Corresponding Author: Saikat Mukherjee, Department of Biochemistry, Manipur University, Imphal, Manipur 795003, India. Tel: +91-8132821691, E-mail: [email protected]
Abbreviations: ANOVA, Analysis of variance; df, Degrees of freedom; DTNB, Dithiol(2-nitrobenzoic acid) (DTNB); GLRX2, Glutaredoxin2; GPx, Glutathione Peroxidase; GSH, Reduced Glutathione; GSSG, Oxidized glutathione; MnSOD, Manganese superoxide dismutase; NADPH, Nicotinamide adenine dinucleotide phosphate; OL, Oral Leukoplakia; OLP, Oral Lichen Planus; OSCC, Oral Squamous Cell Carcinoma; OSMF, Oral Submucous Fibrosis; p value, Probability Value; ROS, Reactive Oxygen Species; SD, Standard Deviation; SOD2, Superoxide Dismutase2; SPSS, Statistical Package for Social Sciences; TNB, Titrobenzoic acid; TXN2, Thioredoxin2; VDAC1, Voltage Dependent Anion Channel1.
This is “Advance Publication Article”
Original Article
Summary: Various endogenous mitochondria-associated antioxidants protect mitochondria from oxidative stresses such as Superoxide Dismutase 2 (SOD2), Catalase, Glutaredoxin 2 (GLRX2), educed Glutathione (GSH), Glutathione Peroxidase (GPx), and Thioredoxin 2 (TXN2). They protect mitochondria from Reactive Oxygen Species (ROS). Excess ROS causes mitochondrial DNA damage and respiratory chain dysfunction leading to car-cinogenesis. In an earlier study we found complex alterations of mitochondrial antioxidants in different stages of oral squamous cell carcinoma. Here, we profiled mitochondrial antioxidants in different oral potentially malignant disorders such as oral leukoplakia (OL), oral lichen planus (OLP), and oral submucous fibrosis (OSMF). Mitochondria was prepared from oral tissues from OL, OLP, and OSMF patients. Biochemical assays and immu-noblotting were performed to investigate expression of various mitochondrial antioxidants. Catalase was expressed as Control> OL > OSMF > OLP. GLRX 2 was expressed as OLP> OL >Control >OSMF. GPX1 and GPX4 were expressed as Control >OSMF> OLP > OL. GSH increased in OL and OSMP, but decreased in OLP. SOD2 was expressed as Control >OSMF> OLP > OL. PRX3 was expressed as OL > OLP > OSMF > Control. TXN2 expression was nearly the same in all groups except OL, which showed elevated expression. We conclude that endogenous mitochondria-associated antioxidants show different levels of expressions in various oral poten-tially malignant disorders.
Key words mitochondrial antioxidants, oral precancerous disorders, oral leukoplakia, oral lichen planus, oral submucous fibrosis

16 BANERJEE ET AL.
Kurume Medical Journal Vol. 66, No. 1 2019
mitochondrial dysfunction [3]. Oxidative stress causes severe mitochondrial DNA damage with subsequent progressive respiratory chain dysfunction thereby pro-moting carcinogenesis [4]. Oral cancer is one of the most common cancers that can occur de-novo or may be preceded by precancerous lesions or conditions like oral leukoplakia (OL), oral submucous fibrosis (OSMF), and oral lichen planus (OLP) [5]. Significant alterations of cytosolic antioxidant levels have already been investigated in different oral precancerous pa-thologies [5,6], but profiling of endogenous mito-chondria-associated antioxidants in those oral poten-tially malignant disorders have not yet been reported. The various antioxidants that regulate ROS and redox-sensitive pathways in the mitochondria are manganese superoxide dismutase (MnSOD or SOD2), mitochon-drial glutaredoxin 2 (GLRX2), reduced glutathione (GSH), glutathione peroxidase (Gpx), catalase, and thioredoxin 2 (TXN2) [7]. Earlier, we reported altera-tions in the levels of various mitochondrial antioxi-dants in the mitochondrial redox landscape as a result of stress response programs within oral squamous cell carcinoma tissue. We obtained our earlier results by means of immunoblotting and biochemical assays [8]. We found significant alterations of various mitochon-drial antioxidants in oral tissues at different stages of oral cancer. This led us to investigate whether mito-chondrial antioxidants also differ in oral precancerous lesions. The pathogenesis differs in various oral po-tentially malignant disorders like OL, OLP, and OSMF. Therefore, we decided to find out if altered mitochondrial antioxidant levels play any significant role in the pathogenesis of those oral potentially ma-lignant disorders. In our current study, we investi-gated the levels of these antioxidants in tissue samples of OL, OLP, and OSMF patients of different age groups and compared them with control patients to get an insight into the pathogenesis of the diseases in rela-tion to mitochondrial antioxidants.
MATERIAL AND METHODS
Patient SelectionThe study was conducted in the outpatient depart-
ment of Burdwan Dental College. The study subjects were 12 newly diagnosed patients with oral leukopla-kia (OL), 14 cases of oral lichen planus (OLP) and 12 cases of oral submucous fibrosis (OSMF) who had not received any previous treatment for the same. The provisional diagnosis of OL was made with the clini-cal appearance of a whitish patch or plaque which could not be characterized clinically or pathologically
as any other disease, and was not associated with any physical or chemical agent except the use of tobacco [9]. Confirmatory diagnosis of the lesion was done histopathologically, thereby excluding other specific disorders. All OL patients had positive tobacco (smok-ing and/or chewing) or alcoholic history. A provisional diagnosis of OLP was made based on its clinical ap-pearance, and the final diagnosis was confirmed histo-pathologically. There was no positive association of a specific habit among the OLP patients, but psycho-logical stress had a common association. Clinical di-agnosis of OSMF was made on the basis of definite features like blanching of mucosa, palpable fibrous band on the buccal mucosa, shrunken uvula, restricted mouth opening, and reduced tongue protrusion. The confirmatory diagnosis was made by biopsy. OSMF patients had the habit of chewing areca nut with or without tobacco. Twenty age- and sex-matched con-trol subjects were selected and tissue specimens were obtained by vestibuloplasty. Patients suffering from a systemic disease such as diabetes, hypertension, gout (serum uric acid levels >than 7.2 mg/dl), hepatic dis-eases (serum GGT levels >45 U/L), cardiovascular diseases, and adrenal dysfunctions were excluded from the study. All subjects were interviewed before being clinically examined in the outpatient depart-ment. A questionnaire was prepared to obtain data on demographic factors, types of habits, frequency, and duration of habits (Table 1). The study was indepen-dently reviewed and approved by the Ethical Commit-tee, Burdwan Dental College & Hospital in the year 2013, and written consent was obtained from all the subjects after detailed explanation of the study objec-tives and methodologies. The patients gave voluntary consents to the study and the experiments were con-ducted in full accordance with standard ethical princi-ples.
Tissue Sample Collection and Preparation of Mito-chondria
Surgically resected tissues were collected from each oral precancerous patient category and kept im-mersed in an isotonic homogenization buffer. Purifica-tion of mitochondria from the tissue samples was car-ried out as described earlier by differential centrifugation (Beckman Coulter, Indianapolis, IN, USA) [9,10]. To check the purity of the mitochondrial fractions as obtained from various tissues, the crude homogenate and the mitochondrial fractions were im-munoblotted against various protein markers like PCNA (nuclear marker), α- tubulin (cytosolic mark-er), Calreticulin & Calnexin (Endoplasmic reticulum)
16

17
Kurume Medical Journal Vol. 66, No. 1 2019
PROFILING OF MITOCHONDRIAL ANTIOXIDANTS IN ORAL POTENTIALLY MALIGNANT DISORDERS
to rule out contamination of cytosol, nucleus, and en-doplasmic reticulum. The fractions were also immu-noblotted with anti VDAC1, anti TOMM20, anti TIM44, and anti COX IV to confirm successful isola-tion of mitochondria. Oral tissue mitochondria from control group was collected by vestibuloplasty.
Measurement of mitochondrial Reduced Glutathione (GSH) content
The chemicals were purchased from Sigma-Al-drich (Bangalore, India). The contents of mitochon-drial oxidized glutathione (GSSG) and reduced glu-tathione (GSH) were measured by Ellman’s method. Briefly, GSH reduces 5, 5’-dithiol (2-nitrobenzoic acid) (DTNB) to 5-thio-2-nitrobenzoic acid (TNB) and gets oxidized to GSSG. GSSG then gets reduced to glutathione (GSH) by glutathione reductase in pres-ence of NADPH in a coupled reaction. Measurement of TNB was done by a UV -VIS Spectrophotometer at 412 nm.
Catalase activity assayCatalase activity in the mitochondrial extracts of
oral tissues of OL, OLP, and OSMF patients was de-termined at 25°C [11]. Catalase oxidizes methanol to formaldehyde (HCHO) in the presence of hydrogen peroxide. HCHO then oxidizes 4-amino-3-hydra-zine-5 mercapto-1.2.24 triazole (Purpald) resulting in a change of color to purple, which was read in an UV-VIS Spectrophotometer at 540 nm.
Measurement of mitochondrial lipid peroxide con-tent
Mitochondrial lipid peroxide content was meas-ured according to the method described by Ogura et al [12]. Briefly, thiobarbituric acid reacted with the breakdown products of mitochondrial lipid resulting in formation of a chromogen that was detected spec-trophotometrically at 532.5 nm.
Measurement of Superoxide Dismutase activity Superoxide Dismutase activity was measured ac-
cording to standard methodology [13]. Briefly, a red fomazan dye is produced from 2-(4-indophenol)-3-(4-nitrophenol)-5phenyltetrazolium chloride after it gets reduced by superoxide radicals generated by xanthine oxidase. The reduction rate of superoxide anion has a linear relation to Xanthine Oxidase activity and is in-hibited by superoxide dismutase. Superoxide dis-mutase activity is measured by the degree of inhibition of this reaction. [13]
Measurement of Glutathione Peroxidase activityGlutathione peroxidase activity is measured ac-
cording to standard methodology [14]. Briefly, Glu-tathione peroxidase catalyzes oxidation of glutathione. As oxidized glutathione gets reduced, NADPH is oxi-dized and gets converted into NADP. This oxidation-reduction is observed at 340 nm and activity of glu-tathione peroxidase is measured.
Western BlottingAntibodies were purchased either from Sigma-
Aldrich (Bangalore, India) or Abcam (Abcam, Cam-bridge, MA, USA). Total tissue homogenate (50 μg protein) and total mitochondrial extract (100 μg pro-tein) were separated on 10% Tris-Glycine SDS-PAGE using Mini Protean Polyacrylamide Gel Electrophore-sis (Bio-Rad Laboratories Inc. , Hercules, CA, USA), blotted onto nitrocellulose membrane (Amersham Pharmacia Biotech/GE Healthcare, Kolkata, India), and then probed with polyclonal rabbit anti PCNA, anti α-tubulin, anti-Calreticulin, anti-Calnexin, anti TOMM20, anti TIM44, anti Cytc, anti SOD2, anti-Catalase, anti GLRX2, anti PRX3, anti TXN2, anti GPX1, and anti GPX4 antibodies at 1:2000 dilutions for 2 hours at 4°C in parallel sets. Incubation with sec-ondary antibody was done using mouse anti-rabbit IgG secondary antibody conjugated to horseradish peroxidase (HRP), at 1:10,000 dilutions for 1 hour at room temperature. Immunoblotted protein bands were detected by Chemiluminescence method using ECL kit (Amersham Pharmacia Biotech/ GE Healthcare, Kolkata, India). VDAC1 was taken as the loading con-trol and incubation was done with polyclonal antiV-DAC1 (Voltage Dependent Anion Channel1) antibody. Relative quantifications of the various protein bands were done with respect to the loading controls using Image J software on the western blot films.
Statistical analysisStatistical analysis was performed using SPSS
(Statistical Package for Social Sciences) Version 15.0 Statistical Analysis Software (Chicago, IL, USA). The different biochemical parameters were compared be-tween case and control groups by using independent student t- test. The values were expressed as mean ± SD. One way ANOVA (Analysis of variance) test was used to compare the parameters in different precancer-ous lesions. P<0.05 was considered to be statistically significant. Tukey HSD test was performed to obtain statistical difference in mean values between different precancerous groups. P<0.05 was taken to be signifi-

18 BANERJEE ET AL.
Kurume Medical Journal Vol. 66, No. 1 2019
cant.
RESULTS
The mitochondrial fractions prepared by differen-tial centrifugation from various tissues were found to be pure without any cytosolic, nuclear, and other orga-nelle contamination as checked by immunoblotting with various organellar marker specific antibodies such as anti PCNA, anti αTubulin, anti Calnexin, anti Calreticulin, anti VDAC1, anti TOMM20, anti TIM44, and anti COX IV (Figure1).The expression levels of mitochondrial antioxidants and mitochondrial lipid peroxide content were investigated in control and pre-cancerous tissue samples either/or by biochemical as-says and western blotting of mitochondrial extracts. The concentration/activities of reduced glutathione, lipid peroxide, and catalase were measured by a bio-chemical approach (Figure 2). The concentration of reduced glutathione increased in OL (12.4 ± 0.432 mM) and in OSMF (12.5 ± 0.638 mM) and deceased in OLP (10.2 ± 0.374 mM) when compared to control mitochondria (11.3 ± 0.716 mM). Mitochondrial lipid peroxide content increased in all precancerous tissues viz OL (2.02 ± 0.165 nmol/mg of protein), OLP (2.25 ± 0.198 nmol/mg of protein) and OSMF (1.87 ± 0.172 nmol/mg of protein) when compared to control (1.57 ± 0.286 nmol/mg) group. The activity of cata-lase decreased significantly in all three precancerous lesions compared to the control group. The catalase activity was found to get reduced in OL (3.1± 0.156 U/mg/min), OLP (1.39±0.118 U/mg/min) and OSMF (3.91± 0.142 U/mg/min) when compared to control (6.4 ±0.268 U/mg/min). ANOVA analysis found that expression levels of reduced glutathione, mitochon-drial lipid peroxide content, and catalase varied sig-nificantly across OL, OLP, and OSMF patients (Sup-plementary Table 1). For correlation analysis among OL, OLP and OSMF groups, post hoc Tukey’s HSD test was applied on reduced glutathione, lipid perox-ide, and catalase using the values obtained from the SPSS software. A p value < 0.05 indicates statistical significance. Levels of glutathione showed significant changes between control and OL, control and OLP, and control and OSMF groups. Within intragroup comparisons, statistically significant changes in glu-tathione levels were observed between OL and OLP, OLP, and OSMF but non-significant changes were ob-served between OL and OSMF (Supplementary Table 2). Mitochondrial lipid peroxide content showed sta-tistically significant changes when control group was
compared separately with OL, OLP, and OSMF. Intra-group comparisons of mitochondrial lipid peroxide content showed no statistically significant changes between OL and OSMF, but these changes were sig-nificant in the other groups (Supplementary Table 3).
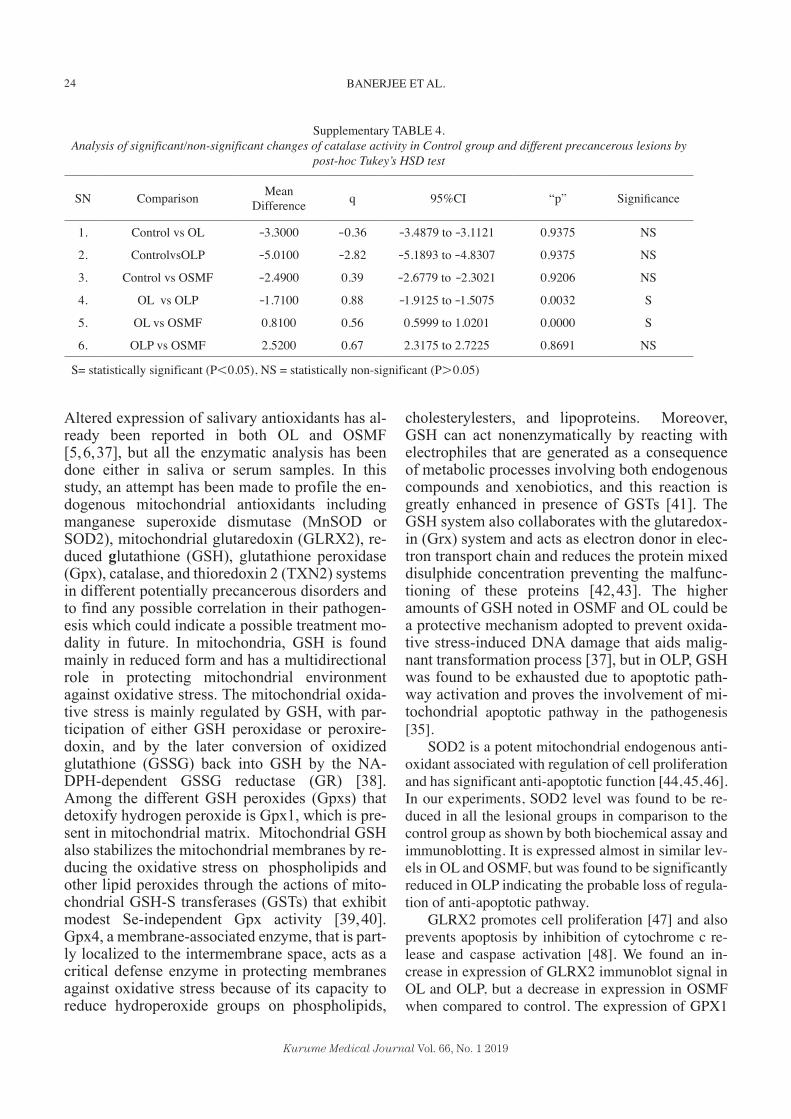
We did post hoc Tukey HSD test on catalase activ-ity across these various groups. When the control group was compared individually to all precancerous groups, no significant changes were observed. How-ever, intra precancerous group comparison of catalase activity showed statistically significant changes be-tween OL and OLP, OL and OSMF, and OLP and OSMF (Supplementary Table 4).
We also tested the expression levels of various an-tioxidant proteins in the control group and different precancerous groups by immunoblotting. Immunob-lotting with anti-catalase antibody showed a decrease in catalase expression levels in OL, OLP, and OSMF
Fig. 1. Purity of oral tissue mitochondria as tested by Immunoblotting against different mitochondrial pro-tein markers in the entire blot membrane. Total tissue homogenate is indicated by “H” and Mitochondrial fraction obtained after differential centrifugation is indicated as “M” (A) PCNA, Nuclear Marker (B) α Tubulin, Cytosolic Marker (C) Calreticulin, Endoplasmic Reticulum Marker (D) Calnexin, Endoplasmic Reticulum Marker (E) VDAC1, Mitochondrial Marker (F) TOMM20, Mitochondrial marker (G) TIM44, Mitochondrial marker (H) COX IV, Mitochondrial marker.

19
Kurume Medical Journal Vol. 66, No. 1 2019
PROFILING OF MITOCHONDRIAL ANTIOXIDANTS IN ORAL POTENTIALLY MALIGNANT DISORDERS
when compared with controls. Quantification of im-munoblot signals of catalase was done using Image J software (Table 2). Among the groups, mean expres-sion levels of catalase was in the order of Control> OSMF> OL> OLP (Table 2)
The expression levels of SOD2 decreased across precancerous groups in comparison to the control group and the mean expression level was in the order of Control >OSMF> OLP > OL (Figure 3). Similar findings were also observed for SOD2 activity in bio-chemical assay (Supplementary Figure 1A). SOD2 activity decreased in the order Control >OSMF> OLP > OL.
For GLRX2, there was an increase in immunoblot signal in OL and OLP, but a decrease in expression in OSMF when compared to control. The expression lev-els were in the order of OLP> OL >Control >OSMF.
The immunoblot patterns of GPX1 and GPX4 were similar. The expression levels of both GPX1 and GPX4 were less in OL, OLP, and OSMF when com-pared with controls. Comparison with Image J soft-ware revealed the order of expression as Control >OSMF> OLP > OL. Similarly, activity of mito-chondrial glutathione peroxidase decreased in the fol-lowing order Control >OSMF> OLP > OL as shown by biochemical assay (Supplementary Figure 1B).
PRX3 and TXN2 showed different patterns in im-munoblots. For PRX3, the mean expression levels
were in the order of OL > OLP > OSMF > Control. For TXN2, OL group showed the highest expression, whereas Control, OLP, and OSMF showed similar levels of expression.
For catalase, the control group showed the highest expression in immunoblots, and there was a decrease in OL, OLP, and OSMF in the order of Control > OL > OSMF > OLP. VDAC1 was used as a loading con-trol in mitochondrial immunoblot analysis, and its lev-els were unchanged in control and other precancerous groups.
DISCUSSION
Precancerous lesions have broadly been used in literature to describe a group of lesions that have the potential to develop into cancer [15]. Initially, these group of lesions were termed as precancerous lesions and conditions, but in the 2005 WHO meeting held in London a common terminology was adopted, i.e., “Potentially malignant disorders.” This new terminol-ogy indicates that not all disorders described under this group may convert into malignancy [16]. In a clinicopathological study conducted by Phookan et al, oral leukoplakia (OL) was reported as the most com-mon potentially malignant disorder involving 20.65% of patients. On the other hand, oral submucous fibrosis (OSMF) and oral lichen planus (OLP) had very simi-
Fig. 2. Analysis of concentration/activities (mean ± SD) of reduced glutathione, lipid peroxide and cata-lase in control group and different precancerous groups. A) Reduced Glutathione Concentration (mM) in Control, Oral Leukoplakia (OL), Oral Lichen Planus (OLP) and Oral Submucous Fibrosis (OSMF) groups B) Lipid Peroxide Content (nmol/mg of pro-tein) in Control group, Oral Leukoplakia (OL), Oral Lichen Planus (OLP) and Oral Submucous Fibrosis (OSMF) groups C) Catalase activity (Units/mg/min) in control group, Oral Leukoplakia (OL), Oral Lichen Planus (OLP), and Oral Submucous Fibrosis (OSMF) groups. n= No. of Individuals.

20 BANERJEE ET AL.
Kurume Medical Journal Vol. 66, No. 1 2019
lar distribution (0.62% of patients) [17]. The etiology of potentially malignant disorders of the oral cavity is multifactorial and not fully understood [18]. Tobacco
chewing, smoking and alcoholism can be directly as-sociated with oral leukoplakia although several other factors are also contributory [19]. OSMF can mainly
Fig. 3. Expression levels of mitochondrial antioxidants in various stages of Oral Leukoplakia, Oral Submucous Fibrosis, and Oral Lichen Planus. (A) Catalase, CAT (B) Glutaredoxin 2, GLRX2 C) Glutathione Peroxidase(GPX4) & Glutathione Peroxidase 1 (GPX1) (D) Peroxiredoxin3 (PRX3), Thioredoxin2 (TXN2) (E) Superoxide Dismutase 2, (SOD2) (F)Voltage-Dependent Anion Channel 1(VDAC1) as a housekeeping protein in mitochondrial immunoblot analysis. Lane 1: Control Group. Lane 2: Oral Leukoplakia group. Lane 3: Oral Lichen Planus group. Lane 4: Oral Sub Mucous Fibrosis Group.
Supplementary Fig. 1. Analysis of SOD2 activity (Units/min/mg of protein) and Glutathione Peroxidase activity (Units/min/mg of protein) in control and oral precancerous groups. (A) Activity of SOD2 in control group and Oral Leukoplakia (OL), Oral Lichen Planus (OLP), and Oral Submucous Fibrosis (OSMF) groups. n= No. of Individuals (B) Activity of Glutathione Peroxidase in control group and Oral Leukoplakia (OL), Oral Lichen Planus (OLP), and Oral Submucous Fibrosis (OSMF) groups. n= No. of Individuals.

21
Kurume Medical Journal Vol. 66, No. 1 2019
PROFILING OF MITOCHONDRIAL ANTIOXIDANTS IN ORAL POTENTIALLY MALIGNANT DISORDERS
be associated with chewing of areca nut, the main component of betel quid. Other than that, ingestion of chilies, alterations of immunity, genetic contribution, and nutritional deficiency are also major contributory factors [15]. OLP is considered an immune-mediated T cell disorder [20]. OLP can be associated with ge-netic background, response to the dental materials, several drugs, infectious agents, autoimmunity, immu-nodeficiency, food allergies, stress, habits, trauma, diabetes, hypertension and much more [21,22,23]. On the other hand, histologically, the tissues are found to react quite differently in response to threatening agents. Histopathologically, the hallmark of OL is epi-thelial hyperplasia and hyperkeratosis of ortho- or parakeratotic type of the epithelium, with various de-grees of chronic inflammatory infiltrates in lamina propria. It also can be associated with various degrees of epithelial dysplasia [24]. OSMF shows a variable
degree of fibrosis of the sub-epithelial connective tis-sue, associated with inflammatory changes. The epi-thelial thickness in OSMF is variable [25]. Typical histopathological examination of the OLP biopsy re-veals hyper orthokeratosis or hyperparakeratosis, with acanthosis, which is thickening of the granular layer with intercellular edema. Subepithelially, there is mononuclear infiltration of the T-cells and histiocytes forming a typical band like appearance. The intraepi-thelial T-cells and degenerating keratinocytes form eosinophilic homogeneous globules, also known as civette bodies. Ultrastructurally, the civette bodies are apoptotic keratinocytes revealing DNA fragmentation in these cells [26]. Histological specimens from OLP patients in our study also revealed basal cell degenera-tion (Supplementary Figure 2). We also found a sig-nificant increase of apoptotic marker Caspase 3 in OLP compared to control group (Supplemental Figure 3). Whatever differences there are in the basic pathology of these different premalignant le-sions, one common association has been noted i.e. oxidative stress leading to reactive oxygen species (ROS) and free radical generation [27]. The gen-eration of ROS is associated with damage to pro-tein, carbohydrate, lipid, and nucleotides, finally contributing to malignant transformation. On the other hand, there is a strong association between ROS production and mitochondrial dysfunction [28]. The mitochondrial DNA (mtDNA) is more sensitive to ROS-induced damage than nuclear DNA. Mutated mtDNA contributes to malfunction
Supplementary Fig. 3. Immunoblotting of apoptotic marker Caspase 3 in Control (C) group and Oral Lichen Planus (OLP) patients. β-actin is the loading control.
Supplementary Fig. 2. Histological analysis of oral mucosa at 40x magnification. (A) Control group, X indicates intact basal cells. (B) Oral Lichen Planus (OLP) patients, Y indicates apoptotic body formation and X indicates subepithelial lymphocytic aggregation.

22 BANERJEE ET AL.
Kurume Medical Journal Vol. 66, No. 1 2019
of the subunits of respiratory complexes that in turn increase ROS production creating a vicious cycle [29,30,31,32]. A direct association between oxidative stress and OLP has been established [33] and it is postulated that oxidative stress may con-stitute a significant pathogenic mechanism in OLP and its complications. The deleterious effects of oxidative stress influence the basic mechanisms of
signal transfer and transduction, resulting in the dysfunction of keratinocytes and their impaired ap-optosis [34]. Oxidative stress has been found di-rectly contributing to the apoptosis of the basal ke-ratinocytes by altering mitochondrial regulation and the regulation is dependent on CD8+ lympho-cytes, which in turn occurs through their influence on nuclear factor kappa B activity (NF-kB) [35,36].
Supplementary TABLE 1.ANOVA test on the concentration/activity levels of reduced glutathione, lipid peroxide, and catalase as derived in Table 2
Sum ofsquares
Degrees of freedom (df ) Mean of square F p Significance
Reduced Glutathione 47.41 3 15.80 47.23 0.000 S
Lipid Peroxide 4.033 3 1.344 27.04 0.000 S
Catalase expression 222.1 3 74.03 1964 0.000 S
S= statistically significant (P<0.05), NS = statistically non significant (P>0.05)
TABLE 1.Clinical and demographic details of the precancerous subjects
Characteristics Oral Leukoplakia patients (n=12) Oral Lichen Planuspatients (n=14)
Oral Submucous Fibrosis patients (n=12)
Sex Male :7Female : 5
Male: 6Female:8
Male: 9Female: 3
AgeMean 52.69±5.35 34.73±3.82 43.13±7.39
Habits
Smoker and chewers (n=5)Only tobacco chewers (n=3)
Active smokers (n=2)Smoking and alcohol (n=1)
Tobacco chewers and alcohol (n=1)
No habit associated (n=9)Smoking (n=3)
Tobacco chewers (n=2)
Betel leaf+arecanut+tobacco(n=8)
Areca nut +lime (n=2)Areca nut only (n=2)
Duration of HabitsMean 10.34±3.12 years 6.23± 8.16 years 8.03±2.48 years
Sites affected
Buccal mucosa (n=6)Lower labial mucosa including
attached gingiva inrelation to lower aneriors. (n=4)
Floor of the mouth (n=2)
Buccal mucosa (n=7)Labial mucosa (n=4)
Generalized attached gingiva (n=3)
Buccal mucosa (n=8)Tongue, limited tongue potrution
(n=2)Soft palate and uvula (n=2)
Clinical diagnosis Homogenous leukoplakia (n=10)Speckled leukoplakia (n=2)
Reticular (8)Ulcerative(6)
stage I (n=8)Stage II (2)Stage III (3)
Histopathologicaldiagnosis
No dysplasia (n=3)Mild dysplasia (n=6)
Moderate dysplasia (n=2)Severe dysplasia (n=1)
Oral lichen planus(no dysplasia)
(n=14)Oral submucous fibrosis (n=12)

23
Kurume Medical Journal Vol. 66, No. 1 2019
PROFILING OF MITOCHONDRIAL ANTIOXIDANTS IN ORAL POTENTIALLY MALIGNANT DISORDERS
Supplementary TABLE 2.Analysis of significant/non-significant changes of reduced glutathione in Control group and different precancerous lesions
by post-hoc Tukey’s HSD test
SN Comparison Mean Difference q 95%CI “p” Significance
1. Control vs OL 1.1000 -0.60 0.5398 to 1.6602 0.0000 S
2. ControlvsOLP 1.1000 -2.49 1.6346 to -0.5654 0.0000 S
3. Control vs OSMF 1.2000 0.56 0.6398 to 1.7602 0.0000 S
4. OL vs OLP -2.2000 0.52 -2.8036 to -1.5964 0.0000 S
5. OL vs OSMF 0.1000 0.78 -0.5264 to 0.7264 0.9743 NS
6. OLP vs OSMF 2.3000 0.39 1.6964 to 2.9036 0.0000 S
S= statistically significant (P<0.05), NS = statistically non-significant (P>0.05)
TABLE 2.Mean Relative Expression Levels of various mitochondrial oxidants in control and Oral Leukoplakia, Oral Lichen Planus and
Oral Submucous Fibrosis patient samples as quantified by Image J after normalizing to the loading control marker, mitochondrial marker, VDAC1.
ExperimentalGroups Loading Control proteinVDAC1 CAT GLRX2 GPX4 GPX1 PRX3 TXN2 SOD2
ControlPatient 100 98±0.32 90±0.57 95±0.43 85±0.32 150±0.65 102±0.70 85±0.2
OLPatient 100
75.35±0.56
146.17±0.43
48.58±0.46
25.284±0.55
432.15±0.67
146.11±0.87
40.8±0.44
OLPPatient 100
45.76±0.32
225.29±0.65
76.75±0.65
61.32±0.21
354.74±0.89
75.72±0.43
24.41±0.98
OSMFPatient 100
84.56±0.45
40.96±0.32
80.84±0.34
69.45±0.33
212.70±0.54
106.0±0.86
38.20±0.73
Supplementary TABLE 3.Analysis of significant/non-significant changes of lipid peroxide in Control group and different precancerous lesions by
post-hoc Tukey’s HSD test
SN Comparison Mean Difference q 95%CI “p” Significance
1. Control vs OL -0.45 1.114 -2.97 to 2.07 0.0000 S
2. ControlvsOLP -0.68 1.683 -3.2 to 1.48 0.0000 S
3. Control vs OSMF -0.30 0.70 -2.94 to 1.34 0.0000 S
4. OL vs OLP -0.23 0.504 -3.07 to 2.16 0.0000 S
5. OL vs OSMF 0.15 0.317 -2.80 to 3.1 0.8213 NS
6. OLP vs OSMF 0.38 0.833 -2.46 to 3.22 0.0000 S
S= statistically significant (P<0.05), NS = statistically non-significant (P>0.05)
24 BANERJEE ET AL.
Kurume Medical Journal Vol. 66, No. 1 2019
Altered expression of salivary antioxidants has al-ready been reported in both OL and OSMF [5,6,37], but all the enzymatic analysis has been done either in saliva or serum samples. In this study, an attempt has been made to profile the en-dogenous mitochondrial antioxidants including manganese superoxide dismutase (MnSOD or SOD2), mitochondrial glutaredoxin (GLRX2), re-duced glutathione (GSH), glutathione peroxidase (Gpx), catalase, and thioredoxin 2 (TXN2) systems in different potentially precancerous disorders and to find any possible correlation in their pathogen-esis which could indicate a possible treatment mo-dality in future. In mitochondria, GSH is found mainly in reduced form and has a multidirectional role in protecting mitochondrial environment against oxidative stress. The mitochondrial oxida-tive stress is mainly regulated by GSH, with par-ticipation of either GSH peroxidase or peroxire-doxin, and by the later conversion of oxidized glutathione (GSSG) back into GSH by the NA-DPH-dependent GSSG reductase (GR) [38]. Among the different GSH peroxides (Gpxs) that detoxify hydrogen peroxide is Gpx1, which is pre-sent in mitochondrial matrix. Mitochondrial GSH also stabilizes the mitochondrial membranes by re-ducing the oxidative stress on phospholipids and other lipid peroxides through the actions of mito-chondrial GSH-S transferases (GSTs) that exhibit modest Se-independent Gpx activity [39,40]. Gpx4, a membrane-associated enzyme, that is part-ly localized to the intermembrane space, acts as a critical defense enzyme in protecting membranes against oxidative stress because of its capacity to reduce hydroperoxide groups on phospholipids,
cholesterylesters, and lipoproteins. Moreover, GSH can act nonenzymatically by reacting with electrophiles that are generated as a consequence of metabolic processes involving both endogenous compounds and xenobiotics, and this reaction is greatly enhanced in presence of GSTs [41]. The GSH system also collaborates with the glutaredox-in (Grx) system and acts as electron donor in elec-tron transport chain and reduces the protein mixed disulphide concentration preventing the malfunc-tioning of these proteins [42,43]. The higher amounts of GSH noted in OSMF and OL could be a protective mechanism adopted to prevent oxida-tive stress-induced DNA damage that aids malig-nant transformation process [37], but in OLP, GSH was found to be exhausted due to apoptotic path-way activation and proves the involvement of mi-tochondrial apoptotic pathway in the pathogenesis [35].
SOD2 is a potent mitochondrial endogenous anti-oxidant associated with regulation of cell proliferation and has significant anti-apoptotic function [44,45,46]. In our experiments, SOD2 level was found to be re-duced in all the lesional groups in comparison to the control group as shown by both biochemical assay and immunoblotting. It is expressed almost in similar lev-els in OL and OSMF, but was found to be significantly reduced in OLP indicating the probable loss of regula-tion of anti-apoptotic pathway.
GLRX2 promotes cell proliferation [47] and also prevents apoptosis by inhibition of cytochrome c re-lease and caspase activation [48]. We found an in-crease in expression of GLRX2 immunoblot signal in OL and OLP, but a decrease in expression in OSMF when compared to control. The expression of GPX1
Supplementary TABLE 4.Analysis of significant/non-significant changes of catalase activity in Control group and different precancerous lesions by
post-hoc Tukey’s HSD test
SN Comparison Mean Difference q 95%CI “p” Significance
1. Control vs OL -3.3000 -0.36 -3.4879 to -3.1121 0.9375 NS
2. ControlvsOLP -5.0100 -2.82 -5.1893 to -4.8307 0.9375 NS
3. Control vs OSMF -2.4900 0.39 -2.6779 to -2.3021 0.9206 NS
4. OL vs OLP -1.7100 0.88 -1.9125 to -1.5075 0.0032 S
5. OL vs OSMF 0.8100 0.56 0.5999 to 1.0201 0.0000 S
6. OLP vs OSMF 2.5200 0.67 2.3175 to 2.7225 0.8691 NS
S= statistically significant (P<0.05), NS = statistically non-significant (P>0.05)

25
Kurume Medical Journal Vol. 66, No. 1 2019
PROFILING OF MITOCHONDRIAL ANTIOXIDANTS IN ORAL POTENTIALLY MALIGNANT DISORDERS
and GPX4 were similar in immunoblots showing re-duced expression of both the enzymes in the lesional groups in comparison to the control group. The maxi-mum reduction was found in OL. Both GPX1 and GPX4 have anti tumorigenic property and decreased level of GPX1 can be correlated with increased cancer risk [49].
PRX3 have a protective role in hypoxic condition and it prevents hypoxia- induced apoptosis [50]. In OSMF, due to progressive fibrosis, there is constric-tion of the blood vessels in advanced stages leading to the creation of a hypoxic microenvironment [51]. The increased level of PRX3 in OSMF compared to con-trol group might contribute to the atrophic nature of the epithelium. Similar increased levels of PRX3 are also observed in OL and OLP, which may correlate with the proliferative nature of the epithelium in OL and OLP.
The proliferative cells have a constant requirement for DNA synthesis and this phenomenon correlates with the increased level of TXN2 in OL [52].
Oxidative stress can affect the biological mem-brane by lipid peroxidation and the breakdown prod-ucts of lipid peroxides may serve as “oxidative stress second messengers,” due to their prolonged half-life and their ability to diffuse from their site of formation, compared to free radicals. The lipid peroxidation and the breakdown products can lead to changes in the functional integrity of the membrane lipid bilayer and can dramatically alter cell function [53]. Altered levels of lipid peroxidation have been reported in many pre-cancerous and cancerous lesions [54,55,56]. In our study, we found an increased level of mitochondrial lipid peroxide content in OL, OLP, and OSMF patients in comparison to the control group.
Catalase has a protective role in cancer progres-sion and invasion [57]. p53, the tumor suppressor gene and its downstream targets, p53-inducible ribonucleo-tide reductase (p53R2) and p53-inducible gene 3 (PIG3), are reported to interact with catalase for effi-cient regulation of intracellular ROS, depending on stress intensity [58]. The antioxidant functions of p53 are mediated by p53R2, which maintains increased catalase activity and thereby protects against endoge-nous ROS. After genotoxic stress, high levels of p53 and PIG3 cooperate to inhibit catalase activity, leading to a shift in the oxidant/antioxidant balance toward anti oxidative status. In our study, we found reduction of catalase activity in OLP, which can play an impor-tant role in oxidative stress generation. Similarly re-duction in catalase activity in OL and OSMF in com-parison to control group as shown in our study indicate
loss of catalase mediated protective mechanism under oxidative stress.
CONCLUSION
Our data shows mitochondrial antioxidants differ in expression in various oral potentially malignant dis-orders. Detailed investigation of these molecular play-ers in the context of the mitochondrial redox landscape can help us in understanding the pathogenesis of oral leukoplakia, oral lichen planus, and oral submucous fibrosis.
CONFLICTS OF INTEREST: The authors declare no con-flicts of interests.
ACKNOWLEDGEMENTS: The authors wish to thank all par-ticipants who joined the study.
REFERENCES1. Klaunig JE, Yong X, Senberg J, Bachowski S, Kolaja KL
et al. The Role of Oxidative Stress in Chemical Carcinogenesis. Environmental Health Perspectives 1998; 106(Suppl 1):289-295.
2. Toyokuni S. Molecular Mechanisms of Oxidative Stress-induced Carcinogenesis: From Epidemiology to Oxygenomics. IUBMB Life 2008; 60(7):441-447.
3. Warburg O. On respiratory impairment in cancer cells. Science 1956; 124(3215):269-270.
4. Servais S, Couturier K, Koubi H, Rouanet JL, Desplanches D et al. Effect of voluntary exercise on H2O2 release by subsarcolemmal and intermyofibrillar mitochondria. Free Radic Biol Med 2003; 35(1):24-32.
5. Gurudath S, Ganapathy K, D S, Pai A, Ballal S et al. Superoxide Dismutase and Glutathione peroxidase in oral submucous fibrosis, oral leukoplakia, and oral cancer: A comparative study. Asian Pac J Cancer Prev 2012; 13(9):4409-4412.
6. Shetty SR, Babu S, Kumari S, Shetty P, Vijay R et al. Serum Glutathione Levels in Oral Leukoplakia and Oral Squamous Cell Carcinoma- A Clinicopathological Study. American Journal of Cancer Prevention 2013; 1(1):1-3.
7. Casagrande S, Bonetto V, Fratelli, M, Gianazza E, Eberini I et al. Glutathionylation of human thioredoxin: A possible crosstalk between the glutathione and thioredoxin systems. Proc Natl Acad Sci USA 2002; 99(15):9745-9749.
8. Banerjee S, Mukherjee S, Mitra S, and Singhal P. Altered expression of mitochondrial antioxidants in oral squamous cell carcinoma. J Oral Sci 2017; 59(3):439-446.
9. Kokoszka J, Coskun P, Esposito L and Wallace D. Increased mitochondrial oxidative stress in the Sod2 (+/-) mouse results in the age-related decline of mitochondrial function culminating in increased apoptosis. Proc Natl Acad Sci. USA 2001; 98:2278-2283.

26 BANERJEE ET AL.
Kurume Medical Journal Vol. 66, No. 1 2019
10. Kim A. A Panoramic Overview of Mitochondria and Mitochondrial Redox Biology. Toxicol Res 2014; 30(4):221-234.
11. Johansson LH and Borg LA. A spectrophotometric method for determination of catalase activity in small tissue sam-ples. Anal Biochem 1988; 174:331-336.
12. Ogura R, Sakanashi T, Nagata O, Sugiyama M, Kajiyama K et al. Assay for Lipid Peroxide content in Mitochondria by the Thiobarbituric Acid Reaction. The Kurume Medical Journal 1987; 34(2):53-58.
13. Spitz DR and Oberley LW. An assay for superoxide dis-mutase activity in mammalian tissue homogenates. Anal Biochem. 1989; 179(1):8-18.
14. Paglia DE and Valentine WN. Studies on the quantitative and qualitative characterization of erythrocyte glutathione peroxidase. J Lab Clin Med 1967; 70(1):158-69.
15. Dsouza C, Pawar U, and Chaturved P. Precancerous lesions of Oral Cavity. Otorhinolaryngology Clinics: An International Journal 2009; 1(1):7-14.
16. Huber MA. A review of premalignant oral conditions. Tex Dent J 2006; 123(6):502-509.
17. Scully C. Oncogenes, onco-suppressors, carcinogenesis and oral cancer. Br Dent J 1992; 173:53-59.
18. Reichart PA and Philipsen HP. Oral erythroplakia: a review. Oral Oncol 2005; 41:551-561.
19. Carnelio S, Rodrigues GS, Shenoy R, and Fernandes D. A Brief Review of Common Oral Premalignant Lesions with Emphasis on Their Management and Cancer Prevention. Indian J Surg 2011; 73(4):256-261.
20. Kumar A, Bagewadi A, Keluskar V, and Singh M. Efficacy of lycopene in the management of oral submucous fibrosis. Oral Surg Oral Med Oral Pathol Oral Radiol Endod 2007; 103(2):207- 213.
21. Lin HJ and Lin JC. Treatment of oral submucous fibrosis by collagenase: effects on oral opening and eating function. Oral Dis 2007; 13(4):407-413.
22. Rajendran R, Rani V, and Shaikh S. Pentoxifylline therapy: a new adjunct in the treatment of oral submucous fibrosis. Indian J Dent Res 2006; 17(4):190-198.
23. Chang YM, Tsai CY, Kildal M and Wei FC. Importance of coronoidotomy and masticatory muscle myotomy in surgi-cal release of trismus caused by submucous fibrosis. Plast Reconstr Surg 2004; 113(7):1949-1954.
24. Shafer, Hine M, Levy B. Shafer’s text book of oral pathol-ogy.in: Rajendran R, Sivapathasundharam, editors. Chapter 2, Benign and malignant tumours of the oral cavity; Elsevier publication. 7th ed. 2012. Page 91-92.
25. Jani YV and Dudhia BB. The clinicohistopathologic study of oral submucous fibrosis: A new staging system with treatment strategies. Journal of Indian Academy of Oral Medicine & Radiology 2016; 28 (2):111-118.
26. Krupaa RJ, Sankari SL, Masthan KM and Rajesh E. Oral lichen planus: An overview. J Pharm Bioallied Sci 2015; 7(Suppl 1):S158-61.
27. Fiaschi AI, Cozzolino A, Ruggiero G, and Giorgi G. Glutathione, ascorbic acid and antioxidant enzymes in the tumor tissue and blood of patients with oral squamous cell carcinoma. Eur Rev Med Pharmacol Sci 2005; 9(6):361-367.
28. Pagano G, Talamanca AA, Castello G, Cordero MD,
d’Ischia M et al. Oxidative stress and mitochondrial dys-function across broad-ranging pathologies: toward mito-chondria-targeted clinical strategies. Oxidative Medicine and Cellular Longevity 2014; 541230.
29. Kenyon C. The plasticity of aging: insights from long-lived mutants. Cell 2005; 120(4):449-460.
30. Dufour and Larsson NG. Understanding aging: revealing order out of chaos. Biochim Biophysica Acta 2004; 1658(1-2):122-132.
31. Wallace DC. A mitochondrial paradigm of metabolic and degenerative diseases, aging, and cancer: a dawn for evolu-tionary medicine. Annu Rev Genet 2005; 39:359-407.
32. Balaban RS, Nemoto S, and Finkel T. Mitochondria, oxi-dants, and aging. Cell 2005; 120(4):483-495.
33. Rekha VR, Sunil S, and Rathy R. Evaluation of oxidative stress markers in oral lichen planus. J Oral Max Path. 2017; 21(3):387-393.
34. Sankari SL, Babu NA, Rajesh E and Kasthuri M. Apoptosis in immune-mediated diseases. J Pharm Bioallied Sci 2015; 7 (Suppl. 1):200-202.
35. Li XR, Guo J, and Li XM. The expression and changes of apoptosis protein Bcl-2 and Bax in oral lichen planus. Shanghai Kou Qiang Yi Xue 2015; 24:65-469.
36. Vered M, Furth E, Shalev Y, and Dayan D. Inflammatory cells of immunosuppressive phenotypes in oral lichen pla-nus have a proinflammatory pattern of expression and are associated with clinical parameters. Clin Oral Invest 2013; 17(5):1365-1373.
37. Hegde M, Hingad N, Deshmukh R, Goyal G, and Khan S. Oral precancerous lesions show increased levels og gluta-thione compared to cancerous tissue. Current Nutrition & Food Science 2010; 6(3):223-226.
38. Morales A, Colell A, Ruiz CG, and Fernandez-Checa JC. Mitochondrial Glutathione, a Key Survival Antioxidant. Antioxid Redox Signa 2016; 11(11):2685-2700.
39. S Orrenius, V Gogvadze, and B Zhivotovsky. Mitochondrialoxidative stress: implications for cells death. Annu Rev Pharmacol Toxico 2007; l 47:143-183.
40. Chen J, Schenker S, and Henderson GI. 4-Hydroxynonenal detoxification by mitochondrial glutathione S-transferase is compromised by short-term ethanol consumption in rats. Alcohol Clin Exp Res 2002; 26(5):1252-1258.
41. Hayes JD, Flanagan JU, and Jowsey IR. Glutathione trans-ferases. Annu Rev Pharmacol Toxicol 2005; 45:51-88.
42. Herrero E and Ros J. Glutaredoxins and oxidative stress defense in yeast. Methods Enzymol 2002; 348:136-146.
43. Koehler CM, Beverly K and Leverich EP. Redox pathways of the mitochondrion. Antioxid Redox Signal 2006; 8(5-6):813-822.
44. St. Clair DK and Holland JC. Complementary DNA encod-ing human colon cancer manganese superoxide dismutase and the expression of its gene in human cells. Cancer Res 1991; 51:939-943.
45. Huang P, Feng L, Oldham EA, Keating MJ, and Plunkett. Superoxide dismutase as a target for the selective killing of cancer cells. Nature 2000; 407(6802):390-395.
46. Oberley LW. Anticancer therapy by overexpression of superoxide dismutase. Antioxid Redox Signal 2001; 3(3), 461-472.
47. Lillig CH, Lönn ME, Enoksson M, and Fernandes AP.

27
Kurume Medical Journal Vol. 66, No. 1 2019
PROFILING OF MITOCHONDRIAL ANTIOXIDANTS IN ORAL POTENTIALLY MALIGNANT DISORDERS
Holmgren Short interfering RNA-mediated silencing of glutaredoxin 2 increases the sensitivity of HeLa cells toward doxorubicin andphenyl arsine oxide. Proc Natl Acad Sci USA 2004; 101(36):13227-13232.
48. Enoksson M, Fernandes AP, Prast S, Lillig CH, Holmgren A et al. Overexpression of glutaredoxin 2 attenuates apop-tosis by preventing cytochrome c release. Biochem Biophys Res Commun 2005; 327(3):774-779.
49. Chen Y, Zhang H, Huanjiao, JZ, Weidong J and Wang M. Mitochondrial Redox Signaling and Tumor Progression. Cancers (Basel) 2016; 8(4):40.
50. Lo M, Ling V, Low C, Wang YZ and Gout PW. Potential use of the anti-inflammatory drug, sulfasalazine, for target-ed therapy of pancreatic cancer. Curr Oncol 2010; 17(3):9-16.
51. Sudarshan R, Annigeri RG, and Vijaybala GS. Pathogenesis of Oral Submucous Fibrosis: The past and current concepts. International Journal of Oral and Maxillofacial Pathology 2012; 3(2):27-36.
52. Fink EE, Mannava S, Bagati A, Bianchi-Smiraglia A, Nair JR et al. Mitochondrial thioredoxin reductase regulates major cytotoxicity pathways of proteasome inhibitors in multiple myeloma cells. Leukemia 2016; 30(1):104-111.
53. Dix TA and Aikens J. Mechanisms and biological rele-vance of lipid peroxidation initiation. Chem Res Toxicol 1993; 6(1):2-18.
54. Metgud R and Bajaj S. Evaluation of salivary and serum lipid peroxidation, and glutathione in oral leukoplakia and oral squamous cell carcinoma. J Oral Sci 2014; 56(2):135-142.
55. Hammer A, Ferro M and Tillian HM. Effect of oxidative stress by iron on 4-hydroxynonenal formation and prolifer-ative activity in hepatomas of different degrees of differen-tiation. Free Rad Biol and Med 1997; 23(1):26-33.
56. Canuto RA, Muzio G, Maggiora M, Biocca ME and Dianzani MU. Glutathione-S-transferase, alcohol dehydro-genase and aldehyde reductase activities during di- ethylni-trosamine-carcinogenesis in rat liver. Cancer Letters 1993; 68(2-3):177-183.
57. Goh J, Enns L, Fatemie S, Hopkins H, Morton J et al. Mitochondrial targeted catalase suppresses invasive breast cancer in mice. BMC Cancer 2011; 11:191-202.
58. Kang MY, Kim HB, Piao C, Lee KH, Hyun JW et al. The critical role of catalase in prooxidant and antioxidant func-tion of p53. Cell Death Differ 2013; 20(1):117-129.