comparative analysis of two attachment variants of
TRANSCRIPT

COMPARATIVE ANALYSIS OF TWO ATTACHMENT
VARIANTS OF BUTYRIVIBRIO FIBRISOLVENS
Djarot Sasongko Hami Seno
Thesis submitted for the degree of
Doctor of Philosophy
in the Department of Animal Sciences
The University of Adelaide
November 1, 2002

1
CHAPTER 1
INTRODUCTION AND LITERATURE REVIEW
1.1 Introduction
One of the major limitations to production-efficiency in the livestock industries is
the low rate of plant-material digestion, in which carbohydrate breakdown is the
fundamental digestive process and the primary rate-limiting step. It has been
suggested that bacterial attachment to plant carbohydrate may be both a
precondition and a trigger for fibre digestion in the rumen (Lee 1980, Kudo et al.
1987). An understanding of the control and regulation of rumen bacterial
attachment to surfaces, particularly to carbohydrate commonly found in plant
fibre, is essential for improving plant fibre digestion within the rumen. This
approach may be more effective in enhancing plant polysaccharide degradation
than introducing additional cellulase genes (Kudo et al. 1987).
Among ruminal bacteria, Butyrivibrio fibrisolvens is one of the most
metabolically versatile species, as almost all strains of this species are able to
grow on simple or complex sugars. A large number of isolates have been obtained
from both ruminal and caecal portions of the gastrointestinal tracts of a variety of
animals. Some of the B. fibrisolvens strains have been shown to adhere to the
epithelium of the roof of the dorsal rumen (Bauchop et al. 1975, Dehority 1975,
Dehority and Grubb 1981) and cellulosic substrates (Rasmussen et al. 1989).

2
Extracellular polymer production of various B. fibrisolvens strains have been
reported, comprising teichoic acids (Sharpe et al. 1975, Hewett et al. 1976) and
extracellular polysaccharides (Stack 1988; Stack and Ericsson 1988; Stack et al.
1988a,b; Stack and Weisleder 1990). Various enzymatic activities related to plant
fibre degradation have been identified in most B. fibrisolvens strains and the
corresponding genes have been cloned in Escherichia coli (Romaniec et al. 1987a,
Sewell et al. 1989, Berger et al 1990, Hazlewood et al. 1990a, Mannarelli et al.
1990a, Rumbak et al. 1991, Utt et al. 1991, Dalrymple et al. 1996). However, no
detailed study has been reported regarding the attachment of B. fibrisolvens to
surfaces.
In this project the aim is to study the attachment of B. fibrisolvens to surfaces,
using strain E14 (originally isolated from Alaskan Reindeer) (Orpin et al. 1985).
For this purpose, two different variants, denoted sticky (S) and loose (L),
discovered recently in our laboratory (Nili and Brooker 1995), were employed.
The sticky variant sticks firmly on agar during the early stage of growth and can
only be removed without by scraping the agar. On the other hand the L variant
can be easily removed at all stages of growth.
1.2 Literature review
This literature review discusses i) rumen function and fibre digestion ii) the
species concept of Butyrivibrio fibrisolvens, iii) the Butyrivibrio fibrisolvens strain
to be used in the current project, iv) the mechanisms and the factors affecting
bacterial attachment to surfaces, v) bacterial attachment within the rumen, vi)
attachment in Butyrivibrio fibrisolvens, vii) possible ligands of Butyrivibrio
3
fibrisolvens which may be involved in its attachment to surfaces, viii) teichoic
acids, ix) extracellular polysaccharides, x) genetic manipulation in Butyrivibrio
fibrisolvens, and xi) aims of this project.
1.2.1. Rumen function and fibre digestion
1.2.1.1 The rumen and its microbial ecosystem
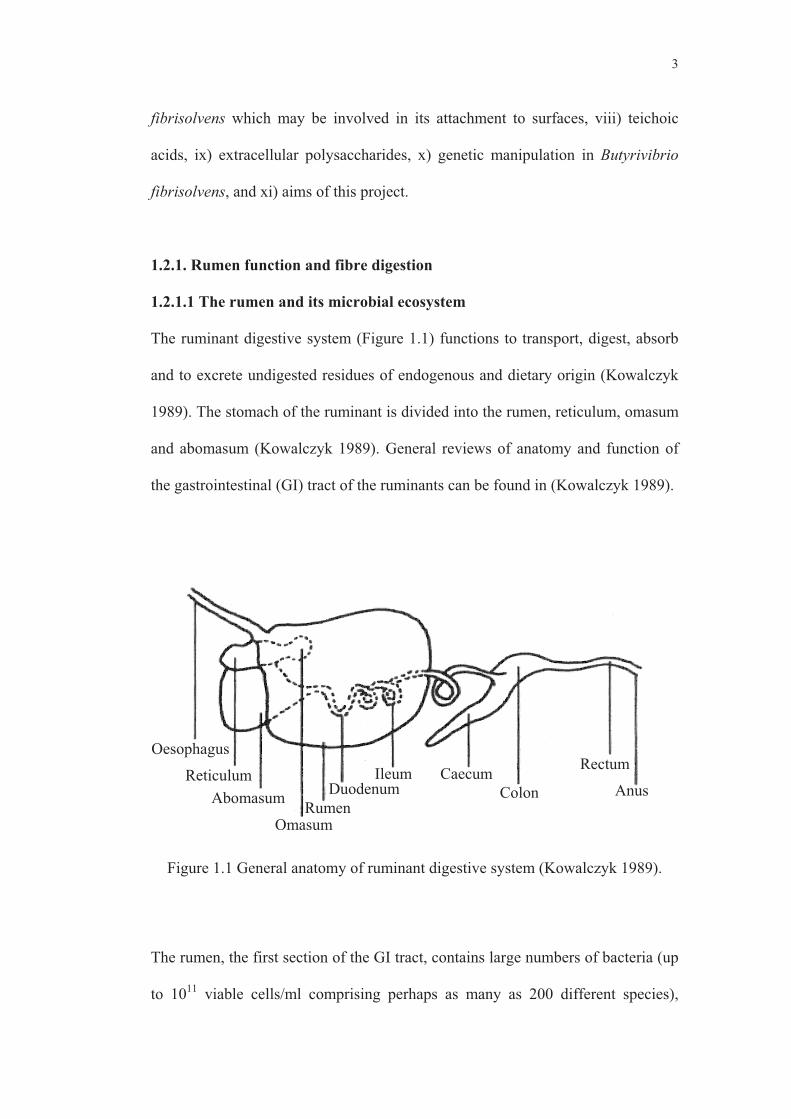
The ruminant digestive system (Figure 1.1) functions to transport, digest, absorb
and to excrete undigested residues of endogenous and dietary origin (Kowalczyk
1989). The stomach of the ruminant is divided into the rumen, reticulum, omasum
and abomasum (Kowalczyk 1989). General reviews of anatomy and function of
the gastrointestinal (GI) tract of the ruminants can be found in (Kowalczyk 1989).
Figure 1.1 General anatomy of ruminant digestive system (Kowalczyk 1989).
The rumen, the first section of the GI tract, contains large numbers of bacteria (up
to 1011 viable cells/ml comprising perhaps as many as 200 different species),
Oesophagus
Reticulum
Abomasum
Omasum
Ileum Duodenum
Rumen
CaecumColon
Rectum
Anus
4
protozoa (104-106/ml spread over 25 genera), anaerobic rumen fungi (zoospore
population densities of 103-105/ml divided into five genera), and bacteriophages
(107-109 particles/ml) (Hobson 1988, Klieve and Swain 1993, Hespell et al. 1997,
Orpin and Joblin 1997, Stewart et al. 1997, Williams and Coleman 1988,
Kowalczyk 1989, Mackie et al. 2000). The rumen bacteria include the species
listed in Table 1.1.
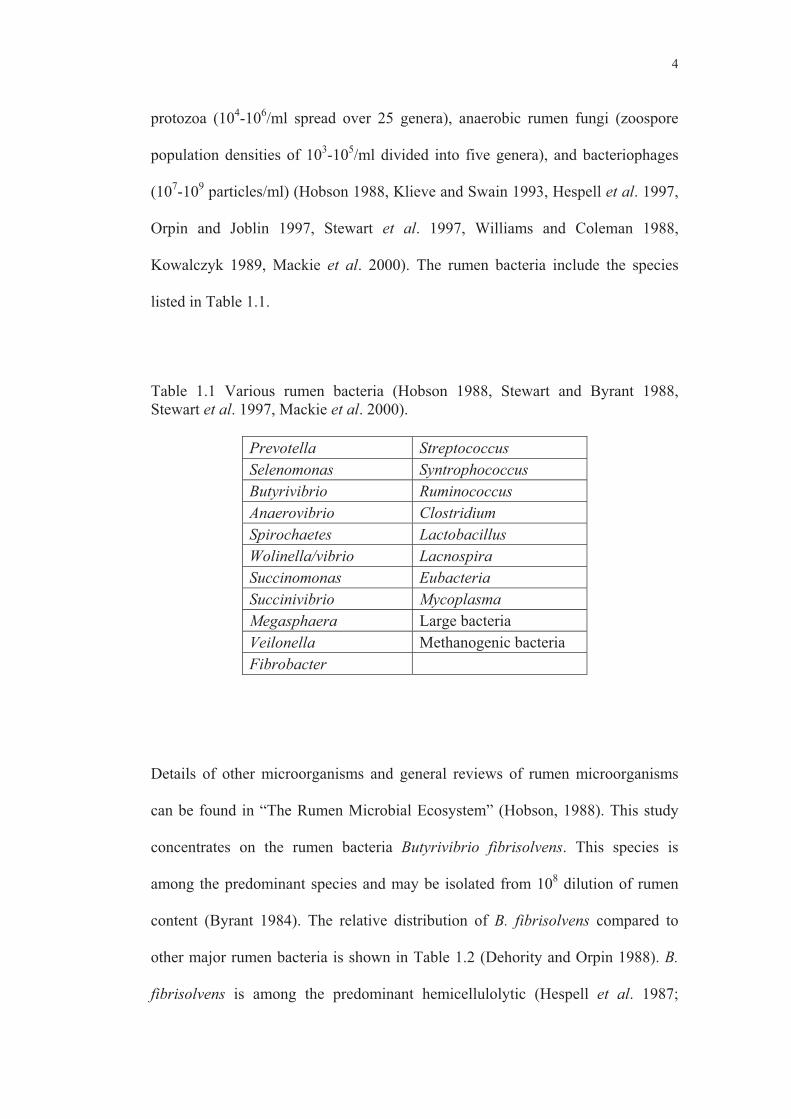
Table 1.1 Various rumen bacteria (Hobson 1988, Stewart and Byrant 1988, Stewart et al. 1997, Mackie et al. 2000).
Prevotella Streptococcus Selenomonas Syntrophococcus Butyrivibrio Ruminococcus Anaerovibrio Clostridium Spirochaetes Lactobacillus Wolinella/vibrio Lacnospira Succinomonas Eubacteria Succinivibrio Mycoplasma Megasphaera Large bacteria Veilonella Methanogenic bacteria Fibrobacter
Details of other microorganisms and general reviews of rumen microorganisms
can be found in “The Rumen Microbial Ecosystem” (Hobson, 1988). This study
concentrates on the rumen bacteria Butyrivibrio fibrisolvens. This species is
among the predominant species and may be isolated from 108 dilution of rumen
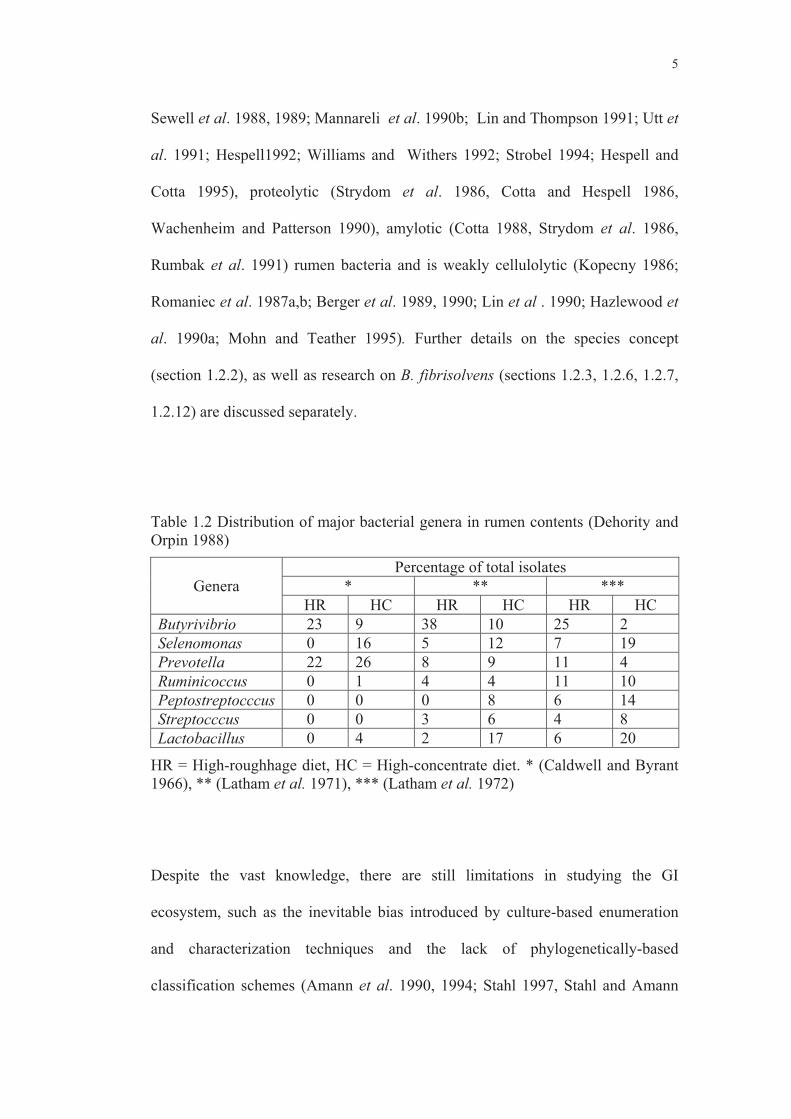
content (Byrant 1984). The relative distribution of B. fibrisolvens compared to
other major rumen bacteria is shown in Table 1.2 (Dehority and Orpin 1988). B.
fibrisolvens is among the predominant hemicellulolytic (Hespell et al. 1987;
5
Sewell et al. 1988, 1989; Mannareli et al. 1990b; Lin and Thompson 1991; Utt et
al. 1991; Hespell1992; Williams and Withers 1992; Strobel 1994; Hespell and
Cotta 1995), proteolytic (Strydom et al. 1986, Cotta and Hespell 1986,
Wachenheim and Patterson 1990), amylotic (Cotta 1988, Strydom et al. 1986,
Rumbak et al. 1991) rumen bacteria and is weakly cellulolytic (Kopecny 1986;
Romaniec et al. 1987a,b; Berger et al. 1989, 1990; Lin et al . 1990; Hazlewood et
al. 1990a; Mohn and Teather 1995). Further details on the species concept
(section 1.2.2), as well as research on B. fibrisolvens (sections 1.2.3, 1.2.6, 1.2.7,
1.2.12) are discussed separately.
Table 1.2 Distribution of major bacterial genera in rumen contents (Dehority and Orpin 1988)
Genera Percentage of total isolates
* ** *** HR HC HR HC HR HC
Butyrivibrio 23 9 38 10 25 2 Selenomonas 0 16 5 12 7 19 Prevotella 22 26 8 9 11 4 Ruminicoccus 0 1 4 4 11 10 Peptostreptocccus 0 0 0 8 6 14 Streptocccus 0 0 3 6 4 8 Lactobacillus 0 4 2 17 6 20
HR = High-roughhage diet, HC = High-concentrate diet. * (Caldwell and Byrant 1966), ** (Latham et al. 1971), *** (Latham et al. 1972)
Despite the vast knowledge, there are still limitations in studying the GI
ecosystem, such as the inevitable bias introduced by culture-based enumeration
and characterization techniques and the lack of phylogenetically-based
classification schemes (Amann et al. 1990, 1994; Stahl 1997, Stahl and Amann

6
1997, Mackie et al. 2000). New techniques using DNA, 16SrRNA, 18SrRNA,
DGGE (denaturing gradient gel electrophoresis) or TGGE (temperature gradient
gel electrophoresis) of PCR amplified DNA have been developed to study the
molecular ecology and diversity in gut microbial ecosystems (Pace et al. 1986;
Amann et al. 1990, 1995, 1996; Flint et al. 1990; Ning et al. 1991; Muyzer et al.
1993, 1998; Ludwig et al. 1994; Poulsen et al. 1994, 1995; Cann et al. 1996;
Mackie and Dore 1997; Muyzer and Smalla 1998; Zoetendahl et al. 1998; Amann
and Kuhl 1998; DeLong et al. 1989; Simpson et al. 1999; Ward 2000; Mackie et
al. 2000). General reviews of these techniques can be found in Mackie et al.
(2000).
1.2.1.2 Digestion, fermentation and metabolism of plant carbohydrates
The rumen represents a mobile self-sustaining fermentation system for plant
materials, and ruminants gain their energy from the digestion of fibre due to the
action of bacteria, fungi and protozoa in their rumen, allowing ruminants to
subsist on fibrous, low protein feeds which are indigestible by most non-ruminant
animals (Kowalczyk 1989, Mackie et al. 2000). Rumen microorganisms can also
transform many toxic ingredients to harmless compounds, and therefore ruminants
are able to digest many plants which are toxic to monogastric animals, including
humans (Gregg et al.1994, Dawson and Allison 1988, Forsberg et al. 2000).
However, some plants contain antinutritive or toxic compounds; such as alkaloids
(pyrrolizidine, cyanogenic and coumarin glycosides), terpenes (saponins), simple
acids (fluoroacetate and oxalate), amino acids (mimosine and indospicine), and
polyphenols (tannins); which inhibit ruminant digestion or affect the nutritive
value of forages, and therefore overall animal productivity (Chesson et al. 1982,

7
Hemken et al. 1884, Jones and Megarrity 1986, Dawson and Allison 1988). The
toxic metabolites may be due to conversion of innocuous compounds by rumen
bacteria (i.e. the production of cyanide from cyanogenic glycosides) or inability of
the rumen microorganisms to metabolise the compounds responsible (Gregg et
al.1994, Dawson and Allison 1988).
A number of studies have been carried out to investigate the microbial enzyme
systems that degrade the relatively insoluble cellulose, hemicellulose, pectin and
starch, which occur in plant forage, as well as protein (Cheng et al. 1989). The
breakdown of cellulose and other resistant polysaccharides is the most important
digestive process occurring in the rumen (Bauchop 1980; Cheng et al. 1983,
1989). The digestion and metabolism of plant carbohydrates may be classified
into three stages (Figure 1.2). In the first stage, complex carbohydrates (cellulose,
hemicellulose, starch) are broken down into simple sugars such as hexose or
pentose by extracellular microbial enzymes (Beguin 1990, Ward 2000).
Cellulose is the main carbohydrate component of plant cell walls, comprising 40-
59% of the dry mass of vascular plants (Cheng et al. 1989, Tomme et al. 1995,
Forsber et al. 2000). The breakdown of cellulose is one of the most important
digestive processes occurring in the rumen; Ruminococcus flavefaciens, R. albus
and Fibrobacter succinogenes are the predominant cellulolytic bacteria in the
rumen ecosystem and are extremely efficient in breaking down cellulose (Krause
et al. 1999, Weimer et al. 1999, Forsberg et al. 2000). The major molecular
paradigm of bacterial cellulolysis and adhesion to cellulose is based on the
cellulosome concept of Clostridium thermocellum (Forsberg et al. 2000).

8
Cellulosome-like structures have been found in rumen cellulolytic
microorganisms such as R. albus, R. flavifaciens, F. succinogens (Leatherwood
1973, Lamed et al. 1987, Miron et al. 1989, Forsberg et al. 2000). B. fibrisolvens
H17C produces multi-enzyme aggregates, composed of several endoglucanases or
xylanases, or both (Doerner and White 1990, Lin and Thompson 1991). Cellulose
is degraded by one or more �-1,4-glucanases to the disaccharide cellobiose which
is then converted either to glucose or glucose-1-phosphate (Doerner and White
1990, Beguin 1990, Lin and Thompson 1991, Forsberg et al. 2000).
Figure 1.2. Pathways of carbohydrate metabolism in the rumen (Czerkawski 1986, Dijkstra et al. 1992, Sauvant and Van Migen 1995) Stage 1, 2 and 3 are breakdown of complex carbohydrate to simple sugar, fermentation of simple sugar and pyruvate metabolism, respectively.
Cellulose, starch, soluble sugar
Pectin Hemicellulose
Hexoses Pentoses
Pyruvate
Acetyl-CoA
Formate
Embeden -Meyerhofpathway
CO 2 + H 2
Methane Acetate Butyrate Propionate
Cellulose, starch, soluble sugar
Pectin Hemicellulose
Hexoses Pentoses
Pyruvate
Acetyl-CoA
Formate
Embeden -Meyerhofpathway
CO 2 + H 2
Methane Acetate Butyrate Propionate
Stage:
1
2
3

9
Hemicellulose is the second major plant polysaccharide (20-30%), and its
predominant polymer is mainly a pentosan or xylan, which is composed of xylose
with arabinose side chains (Hespell et al. 1987). Although representing a
relatively high proportion of the total carbohydrate in forage, its contribution to
animal dietary energy is often decreased due to its low overall digestion (Wedig et
al. 1989, Hespell and Cotta 1995). The major xylanolytic bacteria in the rumen
are B. fibrisolvebs and Prevotella ruminicola (Hespell et al.1987, Hespell 1992,
Hespell and Cota 1995). The major products of hemicellulose breakdown are
pentoses which are formed by enzymic action upon the �-1,4 linkages to produce
xylose (Coen and Dehority 1970, Hespell and Cota 1995). Uronic acids may be
produced from pectins, which are first hydrolysed to pectic acid and methanol by
pectinesterase (Osborne 1989). The pectic acid is then attacked by
polygalacturonidases to produce galacturonic acids, which in turn yield xylose
(Dehority and Scott 1967, Osborne 1989).
Starch is one of the most important components of the ruminant diet, and a
number of digestive disorders are often associated with high starch diets, such as
lactic acid accumulation (lactate acidosis) (Styler 1976). Knowing the nature and
regulation of amylolytic enzymes would therefore assist in improving starch
digestion efficiency and in controlling these digestive disorders. Molecular studies
and amino acid sequence of �-amylases have been reported for S. bovis and C.
butyricum (Walker and Hope 1964); R. amylophilis or B. amylophylus (McWethy
and Hartman 1977); and B. fibrisolvens (Cotta 1988). Starch and dextrans are first
converted to maltose and isomaltose by the action of amylases, and then to

10
glucose by maltases and maltose phosphorylases (McWethy and Hartman 1977,
Cotta 1988, Rumbak et al. 1991).
In the second stage, the simple sugars produced extracellularly from the first stage
of carbohydrate digestion are then rapidly utilized by the microorganisms and
subsequent metabolism of these sugars intracellularly (Yarlett et al. 1985). The
primary path of sugar fermentation in rumen microbes is the Embden-Meyerhof-
Parnas (EMP) pathway, and is the primary source of energy for the formation of
the high energy phosphate bonds of ATP that are utilised by rumen microbes for
maintenance and growth (Yarlett et al. 1985, Williams and Coleman 1988). Two
phosphate bonds of ATP are formed during the conversion of hexoses to 2
pyruvate and 2 NADH (2 phosphate bonds of ATP are used to convert hexoses to
triose-phosphates and four are formed to convert the triose-P’s to pyruvate and
NADH) (Yarlett et al. 1985, Williams and Coleman 1988, Russell and Wallace
1988). This yield is therefore substantially less than that of aerobic respirations,
(28-38 moles ATP/ mole glucose), however the actual growth yield may differ to
this theoretical energy yield (Williams and Coleman 1988, Russell and Wallace
1988).
In the third stage, the pyruvate and NADH2 derived from hexose and pentose
fermentation are further metabolized, and this process varies greatly depending on
the microbes involved and incubation conditions (Dehority and Orpin 1988,
Weimer et al. 1999). The main end products of pyruvate metabolism are the short-
chain volatile fatty acids acetate, propionate and butyrate, as well as carbon
dioxide and methane; while succinate and lactate are important intermediates

11
(Huhtanen and Gall1953, Roche et al. 1970, Styler 1976, Yarlett et al. 1985,
Willem and Coleman 1988, Forster et al. 1996). Although in general, the
predominant acid is acetic, the relative proportions of the volatile fatty acids in the
rumen liquor vary with diet. High cellulose diets induce higher levels of acetate
while diets high in concentrates result in a decrease in acetate or rise in propionate
proportion (Latham et al. 1972, Roche et al. 1973). The molar ratios (moles
acetate: propionate: butyrate) are usually near 65: 25: 10 with roughage diets and
50: 40: 10 for concentrate diets (Latham et al. 1972, Roche et al. 1973, Owens
and Goetsch 1986, MacKenzie et al. 1987). Most of the acid produced is absorbed
directly from the rumen, reticulum and omasum, although some may pass through
the abomasum and be absorbed in the small intestine (Williams and Coleman
1988, Kowalczyk 1989). Some of the products of carbohydrate digestion are also
used by bacteria and protozoa to form their own structural polysaccharides,
especially under conditions of surplus carbohydrate (Czerkawski 1986, Owens
and Goetsch 1986, Williams and Coleman 1988, Miron et al. 1994, Hespell et al.
1997).
1.2.1.3 The importance of microbial attachment to fibre digestion
Within the rumen, as much as 75% of microbial cells are associated with feed
particles (Cheng et. 1989). Microbial adhesion to plant material is important to the
process of digestion in ruminants (Kauri and Kushner 1985). Adhesion is the
essential first step in the digestion of insoluble nutrients and enabling
microorganisms to be retained within the rumen as well as avoiding washout with
the fluid fraction of digesta (Kauri and Kushner 1985, Cheng et al. 1989). Once a
microbial population has been established on the surface of insoluble nutrients, it
12
will then be followed by the secretion of specific enzymes within the complex
digestive microbial consortia that form within adherent biofilms on the surfaces of
plant materials (Kudo et al. 1987, Cheng et al. 1989). These degradative enzyme
complexes function optimally in the multi-species consortia that develop within
these adherent populations, and govern the rate of fibre digestion (Bayer 1986,
Cheng et al. 1989; Bhat et al. 1990, 1994).
Direct examinations and in vitro studies have shown that rumen microorganisms
must be attached to insoluble plant substrates to effect the digestion of the plant
materials (Kauri and Kushner 1985, Kudo et al. 1987, Cheng et al. 1989). The
primary colonizers are bacteria, while fungi are seen to colonize surfaces of plant
tissue which are more resistant to digestion, and protozoa are associated with the
plant tissues whose components they are digesting (Williams and Coleman 1988,
Cheng et al. 1989, Tomme et al. 1995). The association of protozoa with readily
digestible feeds such as cereal grains, as well as with tissues which resist digestion
such as the parenchyma bundle sheath of forages have been reported (Bauchop
1975, Cheng et al. 1989, Hespell et al. 1997). Since most of the nutrient-rich
tissues of plants are internal, the overall rates of plant digestion depend upon
microbial access to these tissues (Dinsdale et al. 1978, Cheng et al. 1989,
Bloomquist, et al. 1996). External plant tissues are only poorly colonized by
rumen microorganisms and physical disruption (e.g., chewing) is necessary to
allow optimal microbial access to inner tissues that are avidly colonised. Thus, it
can be said that both grain and forage materials are digested inside out, with the
bacterial attack being initiated against the innermost elements of the plant

13
materials, while the outermost components are much more slowly digested
(Cheng et al. 1989, Tomme et al. 1995, Wilson and Mertens 1995).
The digestion of cellulose fibre is carried out by highly structured consortia of
several different strains of bacteria, and cellulolytic fungi are always spatially
associated with Mycoplasma (Cheng et al. 1989, Tomme et al. 1995, Orpin. and
Joblin 1997). Similarly, rumen protozoa are often found associated with
cellulolytic bacteria and methanogens (Williams and Coleman1988, Cheng et al.
1989, Hespell et al. 1997). In vitro studies of cellulolytic mechanisms and in vivo
direct observations of rumen inocula showed that the process of cellulose
digestion is key to the chemical nature of the glycocalyx of each species. Once
established, the adherent microbial populations develop highly organized
multispecies consortia within which the very high rates of cellulose digestion
occur in the rumen (Kudo et al. 1987, Cheng et al. 1989, Tomme et al. 1995).
Microbial attachment, consortia formation (Stanton and Canale-Parola 1980,
Kudo et al. l986, Wood et al. 1986) and sequestration are not accidental, and are
integral and desirable characteristics in a multi-compartment system (Czerkawski
and Cheng 1988). In fact there is a great deal of correspondence between the
spatial distribution of microorganisms and their function in the rumen (Williams
and Strachan 1984). Direct examination of cellulose surfaces undergoing rapid
cellulolysis shows that a spatial hierarchy of microorganisms exists within the
consortia (Chesson and Forsberg 1988, Czerkawski and Cheng 1988 ). Complex
substrate transformations usually involve microbial consortia in which two or
more species combine their enzymatic activities to degrade the substrates

14
(Czerkawski and Cheng 1988 ). The rate and extent of attack on cellulose in pure
cultures of bacteria or fungi never achieve the rates of cellulose digestion as
observed in the rumen; while in mixed cultures (e.g. F. succinogenes plus
Treponema bryantii or F. succinogenes plus Butyrivibrio sp.), approaches that
seen in the rumen, and combinations of rumen fungi and methanogenic bacteria
are similarly effective (Wood et al. 1986, Czerkawski and Cheng 1988). Cellulose
is rapidly colonized by primary cellulose-degrading organisms and subsequently
colonized by secondary consortium organisms that do not degrade cellulose but
‘drive’ the digestive process by end-product removal (Chesson and Forsberg
1988, Czerkawski and Cheng 1988 ).
Although starch is more readily digested in the rumen than fibre, the development
of microbial consortia is also pivotal for the digestion of starch in the rumen. Pure
starch granules exposed to rumen fluid are colonized by a mixed bacterial
population of which a large proportion of the organisms are amylolytic, and
adherent starch digesting bacteria possess a greater amylolytic activity than those
which remain free in the rumen fluid (Walker and Hope 1964, Cotta 1988, Cheng
et al. 1989). The major factor which controls the rate of digestion in cereal grains
is not the characteristics of the starch, but rather the properties of the protein
matrix that surrounds the starch granule (Cheng et al. 1989). In maize, the protein
matrix is extremely resistant to colonization and impedes the development of
microbial consortia (Cheng et al. 1989, Forsberg et al. 2000). Therefore,
microbial digestion of the protein matrix and starch occurs at a very slow rate. On
the other hand, the protein matrix of barley is rapidly colonized by a variety of
proteolytic and amylolytic rumen bacteria and thus the rate of digestion of the

15
protein matrix and starch proceeds at a rapid rate (Cheng et al. 1989). The
development of microbial consortia differs and is dependent upon the type of
cereal grain; in maize, starch granules were colonized by a consortia of which a
Gram positive cocci resembling Sarcina was the major organism, whereas a Gram
negative rods were the predominant bacteria in the consortia which colonized
barley starch granules (Walker and Hope 1964, Cheng et al. 1989).
The mechanisms and factors affecting bacterial attachment to surfaces (section
1.2.4), bacterial attachment within the rumen (section 1.2.5), and attachment of B.
fibrisolvens (section 1.2.6) are discussed separately.
1.2.2 The species concept of Butyrivibrio fibrisolvens
B. fibrisolvens is an anaerobic, curved, rod-shaped and butyric acid-forming
bacterium (Hungate 1950, Huhtanen and Gall 1952, Byrant 1984, Stack 1988). Its
cell walls stain Gram negative by standard techniques but contain typical
compounds (lipoteichoic and glycerol teichoic acids) characteristic of Gram
positive bacterial cell walls (Sharpe et al. 1975, Hewett et al. 1976). Furthermore,
ultrastructural determinations of two representative strains of Butyrivibrio, using
electron microscopy, showed that they were of the Gram positive morphological
type, but very thin (12-18 nm), possibly accounting for the tendency to stain Gram
negatively (Cheng and Costerton 1977). Cell shapes vary (between 0.4-0.8 �m in
diameter and 0.3-3.0 �m in length) from one strain to another (Margherita et al.
1964) and the cells are motile using a monotrichous polar or subpolar flagella.
16
However, unflagellated (nonmotile) strains have also been reported (Shane et
al.1969, Byrant 1984).
Moore (1976) has described and differentiated the genus into B. fibrisolvens and
B. crossotus (the differences between these two strains are shown in Table 1.3).
However the taxonomic criteria are not very precise and it has been suggested that
they should be further revised, as there is tremendous diversity in morphology,
nutritional requirements, fermentation substrates and products among various
isolates of B. fibrisolvens (Stack 1988). Several researchers have attempted to
classify isolates as to their relatedness based on one or more phenotypic
characteristics. Examples are differences in the patterns of short-chain volatile
fatty acids produced or consumed during growth (Shane et al. 1969), nutritional
requirements (Roche et al. 1973), immunochemical properties (Margherita and
Hungate 1963, Margherita et al. 1964, Sharpe et al. 1975, Hazlewood et al. 1986),
esterase activity (Hespell and O’Bryan-Shah 1988), neutral sugar composition of
the EPS produced (Stack 1988), and biochemical or genetic analysis (G + C
content and hybridization level between DNA) or both (Mannarelli 1988,
Mannarelli et al. 1990b). The mol % G + C of B. fibrisolvens DNA is 36-41
(Byrant 1984). Attempts to classify the genus using a phylogenetic analysis have
also been reported (Forster et al 1996).
Most strains of B. fibrisolvens are able to grow on simple sugars as well as on
cellulose, hemicellulose, starches, pectin, mannans, and even intact forages
(Dehority and Scott 1967, Coen and Dehority 1970, Hespell 1991, Miron and
Ben-Ghedalia 1993, Miron et al. 1994, Hespell and Cotta 1995). This species is

17
Table 1.3 Characteristic differences between B. fibrisolvens and B. crossotus
(Moore 1976, Byrant 1984).
Characteristics B. fibrisolvens B. crossotus
Flagella Monotrichous lopotrichous Antigenic structure Diverse not determined Cell size 0.3-0.8 �m,1.0-5.0 �m larger in diameter H2 production + - CO2 production + not determined
Fine structure of cells thin cell wall (Gram positive) not determined
Energy sources : - - - - - -
Maltose galactose, inulin, salicin lactose starch esculin, trehalose glycerol, inositol, mannitol
+ + + not determined not determined -
+ - not determined + - -
Esculin hydrolysis not determined - Fermentation substrates : - -
glucose and fructose sucrose, cellobiose and xylose
+ +
weak -
Acids produced from fermentation (from glucose or cellobiose in B. fibrisolvens and from maltose in B. crossotus) :
- -
butyrate, formate lactate, acetate
+ not determined
+ +
also one of the most common ruminal bacteria (Byrant 1959, Hungate 1988,
Byrant 1974) and a large number of isolates have been obtained in both ruminal or
cecal portions of the gastrointestinal tracts of sheep (Shane et al. 1969, van
Glyswyk and Roche 1970, Dehority and Grubb 1981), goats (Dehority and Grubb
1977), cattle (Margherita and Hungate 1963), pigs (Stack 1988), Alaskan reindeer
(Dehority 1975), other ruminant animals (Stack 1988), and human, rabbit or horse
faeces (Moore and Holdeman 1974, Moore et al. 1976, Rumney et al. 1995).

18
A number of enzymatic activities have been reported from various strains of B.
fibrisolvens. These include xylanolytic (Dehority 1966, Hespell et al. 1987,
Sewell et al. 1988, Mannarelli et al. 1990a, Lin and Thompson 1991, Williams
and Withers 1992, Hespell 1992, Hespell and Cotta 1995), pectinolytic (Dehority
1969), cellulolytic (Shane et al. 1969, Kopechny 1986, Romaniec 1987a),
lipolytic (Hazlewood and Dawson 1979, Hazlewood et al 1983), proteolytic
(Fulghum and Moore 1963, Strydom 1986, Cotta and Hespell 1986), esterase
(Hespell and O’Bryan-Shah 1988), cinnamoyl esterase (Dalrymple et al. 1996,
McSweeney et al. 1998), amylolytic (Cotta 1988, Rumbak et al. 1991) and
branching enzyme (Rumbak et al. 1991) activities. However, none of these
activities have been related to attachment of B. fibrisolvens to surfaces.
1.2.3 Butyrivibrio fibrisolvens strain used in this project
The strain to be used in the current project is B. fibrisolvens E14, which was
originally isolated from Alaskan Reindeer. The sticky (S) and loose (L) variants
were originally reported by Nili (1996), in studies on amino acid utilization by
this strain. At early stages of growth, the S variant sticks firmly to agar surfaces
and cannot be removed without scraping the agar. In contrast, the L variant can be
easily removed from agar surfaces at all stages of growth. Previous comparative
studies of chromosomal DNA (EcoR I and Hae III digested) and protein
(cytoplasmic fraction) profiles, as well as other biochemical tests, showed no
significant difference between the two variants. Biochemical tests that were
carried out included volatile and non-volatile fatty acid analyses, semiquantitative
(plate) assays of endoglucanase activity, capsular determination and identification
19
of various enzymes produced. The S variant was found to produce more EPS
(based on the glucose content of a crude EPS preparation) (Nili 1996).
The current project, results of which are presented in this thesis, was carried out to
further examine the two variants as a model for attaching and non attaching
bacteria, and to study the attachment of B. fibrisolvens to surfaces.
1.2.4 Mechanisms and factors affecting bacterial attachment to surfaces
Studies on the mechanism and significance of microbial attachment have been
carried out in a variety of ecological situations, such as roots and other plant
surfaces (Dazzo 1980), oral surfaces (Newman 1980, Barber et al. 1993,
Bloomquist et al. 1996), soil and sediments (Marshall 1980), viruses (Bitton
1980), fresh water systems (Paerl 1980), the marine environment (Fletcher
1980a,b) and as in the present study, the rumen (Costerton et al. 1978, Morris and
Cole 1987, Rasmussen et al. 1989, Miron et al. 2001). In general, the factors that
affect bacterial attachment to surfaces are intimate contact, short-range attractive
forces, and the surface structures of both bacterium and the substratum.
Attachment of microbial cells to surfaces requires intimate contact. However both
the cell surface and the substratum usually carry a net negative charge that results
in an electrical repulsion barrier when these surfaces come close together (Verwey
and Overbeek 1948). Short range attractive forces such as ionic bonding, van der
Waals forces, and hydrophobic and hydrogen bonding are thought to be the
balancing forces that overcome the repulsion between like charges (Marshall
1980). Although individually weak, these forces become effective when

20
quantitatively increased (Corpe 1980). Other mechanisms to overcome the
repulsion barrier are dictated by the surface structures of substrata and bacteria,
and have been reported in a number of bacterial species (Jones et al. 1969,
Fletcher and Floodgate 1973, Marshall 1976, Newman 1980, Lee 1980) in various
environments. However, extracellular-structure-bearing cells are not necessarily
attached to surfaces.
The molecules involved in such attachment mechanisms are often called the
binding molecules, those of bacterial surface, the ligands, while those of substrata
are referred to as receptors (Ofek and Beachey 1980).
The possible bacterial structures (ligands) that may be involved in attachment to
surfaces are flagella, fimbriae (pili), extracellular polymers, attachment proteins,
or combinations of these types of bacterial surface structures. Very often, bacterial
extracellular polymer (EP) is identical to extracellular polysaccharide (EPS),
which is a term used to describe polymers secreted by bacteria, but not necessarily
for attachment purposes. Although in many cases, these polymers are one and the
same, some bacteria, including many strains of B. fibrisolvens, produce other
polymers such as teichoic- and lipoteichoic acids (Sharpe et al.1975, Hewett et
al. 1976, Ofek and Beachey 1980).
Fimbriae and EPS are among the bacterial surface structures that could
conceivably participate in the attachment process to bridge the gap caused by like-
charge repulsion forces, and allow anchoring of the bacterium to the surfaces
(Jones et al. 1969, Corpe 1980, Lee 1980). For fimbriated bacteria, fimbriae (pili)

21
may be involved in primary adhesion. Attachment to surfaces, which is a primary
step in substratum colonisation, is assisted by the secretion of EPS (Hultgren et al.
1993), and the formation of a biofilm leads to subsequent cell growth and EPS
biosynthesis (Cheng et al. 1989). However, bacterial adhesion is not always
associated with polymeric fimbriae. Monomers or simple oligomers attached to
surfaces are also found in many adhesins such as in the marine prokaryote
Hyphomonas, where EPS alone appears to be the primary adhesin and EPS-
variants are unable to perform attachment (Quintero and Weiner 1995). This
phenotype (EPS-), which often results from stable spontaneous gene deletions or
rearrangements, has also been found in a number of bacterial species (P.
solanacearum, V. cholerae and H. influenzae) (Jonnes 1980; Kuo et al. 1985;
Hoiseth et al. 1985, 1986; Huang and Schell 1995). Pseudomonas fluorescens
produces a compact polysaccharide that allows adhesion to almost any surface
(Fletcher and Floodgate 1973; Fletcher 1980a, 1986; Gilbert et al. 1989, 1990),
while dextran, produced in a similar manner by Streptococci salivarius, facilitates
adhesion to a tooth surface (Newman 1980; Griffin et al. 1995, 1996). The
extensions of filaments from Lactobacillus fermenti are thought to reinforce
primary adhesion (Fuller 1975, Fuller and Brooker 1975). Polymer fibrils are also
seen in many other examples of attachment within the gut or rumen, such as
attachment of Torulopsis pintolopessi (Savage 1980), Enterobacteriaceae (Doig
and Trust 1994) and Streptococcus bovis (Whitehead 1992).
The secretion and the conformation of the adhesive macromolecular surface
materials may be influenced by physiological and environmental conditions
(temperature, pH, Eh, specific ions, ionic strength, availability of nutrients and

22
surface active materials) which are known to affect growth and viability of
organisms (Corpe 1980, Fletcher 1991).
In addition to cell-specific factors (intimate contact, short-range attractive forces,
and the surface structures of both bacterium and the substratum), there are also
other factors that must be considered in studying the effect of bacterial attachment
to surfaces on nutrient utilization. These include culture age, nutrient diffusion,
and cell mobility (Marshall et al. 1971; Costerton and Irvin 1981, 1985;
Kjeleberg et al. 1982; Gordon et al. 1983; Morisaki 1983, Fletcher 1985,1986,
1991; Leigh and Coplin 1992).
Culture age-dependant attachment has been reported for Pseudomonas (Fletcher
1977, 1980a); Streptococci (Ørstavik 1977, Fletcher 1980b); and Bacillus
mycoides as well as Serratia marcescens (Zvyagintsev et al.1977, Fetcher 1991).
Although not specifically related to attachment, B. fibrisolvens OB156 has also
been reported to have culture age-dependent characteristics (Beard et al. 1995).
The ability to attach to surfaces should enhance substrate utilization since this
would provide a constantly renewed supply of nutrients (Costerton and Irvin
1981, Leigh and Coplin 1992). However, direct substrate transport and diffusion
effects may reduce the advantage of attachment in soluble and simple substrates
(Fletcher 1991). Low-molecular weight solutes in the medium are always in
equilibrium, with both adsorption and desorption continuously occurring. Each
time a substrate is taken up by the cell, a diffusion gradient would be established,
which would continuously deliver fresh substrate to the cell (Marshall et al. 1971;
23
Fletcher 1980b, 1991; Leigh and Coplin 1992). Diffusion effects may or may not
be eliminated at low concentrations of substrates. (Marshall et al. 1971; Fletcher
1980b, 1985, 1986; Kjeleberg et al. 1982; Gordon et al. 1983; Morisaki 1983). In
this context, significant effects of microbial attachment on nutrient depletion
have been reported (Doran and Bailey 1986, 1987; Galazzo et al. 1987) ).
Mobility of attached cells would be less than unattached cells, and this may
decrease the statistical probability of bacterial collision with substratum, and
therefore could be a disadvantage for attached cells growing on soluble substrates
(Fletcher 1980a,b).
1.2.5 Bacterial attachment within the rumen
Within the rumen, the possible substrata to which bacteria may adhere are the
rumen epithelium, solid plant materials, or other organisms. Along with rumen
bacterial ligands, the surface structures of these three components, which mostly
carry a net negative charge, dictate the nature and mechanism of attachment
within the rumen.
The epithelial cell surfaces are lined with polysaccharide and other materials that
may be involved in a very specific mechanism of attachment determined by
complementary molecular structures contributed by both the host and the
microbial cells (Lee 1980). The outer surfaces of epithelial cells are composed of
thousands of fine microvilli coated with a conspicuous layer of fine filaments
radiating from the outer leaflet of the plasma membranes called the glycocalyx or
the mucus perimatrix. This is rich in glycoproteins and polysaccharides (Ito 1965,

24
Bennett 1963, Swift and Makherjee 1976), as well as acid mucopolysaccharide
(Arbuckle 1971, Hoskin and Zamcheck 1968). Observations of sections of
intestinal surfaces by electron microscopy clearly showed thread-like structures
between the epithelium and adsorbed bacteria, like those between the hydrophobic
end of Flexibacter cells and araldite surfaces (Marshall and Cruickshank 1973).
This adhesion is inhibited by periodate or proteolytic enzymes, (Fuller and
Brooker 1974), Concanavalin A (Con A) (Fuller 1975, Sharon and Lis 1972),
detergent treatment and heating (Lee 1980), and the addition of chondroitin
sulfate A and gastric mucin (Suegara et al. 1975). These findings provide
evidence for the involvement of mucopolysaccharides and/or glycoproteins with
exposed glucose, mannose, fructose or arabinose moieties on the bacterial surface,
in the specific attachment to epithelial cells in the gut (Lee 1980). In the
colonization of lung tissue surfaces by P. aeroginusa, the preference for a specific
strain of P. aeroginusa has been reported for rat lung tissue (Ceri et al. 1986) or
human epithelial cell receptors (Doig et al. 1987).
The fact that different bacterial populations occur at different regions within the
rumen or other animal tissues, and that this is due, at least in one part, to
differences in surface structures, also provides evidence that epithelial cell
surfaces are involved in determining the nature and the mechanism of attachment.
Location specificities are also seen in various environments, such as in
filamentous organisms in the mouse small bowel, where bacteria are found only in
the lower duodenum or ileum and only attach to cells on the intervillous floor or
the villus, but not deep in the intestinal crypts. Similarly, spirochetes in the
monkey, cat, or guinea-pig large bowel only attach to the outer surface, not in the

25
crypts (Lee 1980). Differential reactivities of cell surfaces and secretory
components have also been reported with various lectins, such as those of
Dolichos biflorus (Etzler and Kabat 1970), wheat-germ agglutinin (Dazzo 1980),
and Ricirrus communis (Nicholson and Blaustein 1972). Furthermore, sometimes
there is even interspecies specificity, as seen in avian/rat lactobacilli which only
attach to avian/rat epithelial cells (Fuller 1973, Suegara et al. 1975).
Adhesion of ruminal bacteria to solid plant material depends on the properties of
the bacterial cell surfaces and the structurally complex substrates, which may
consist of layers of lignin, hemicellulose and cellulose in plant cell walls or of
protein coats surrounding starch grains. Complex structural barriers and resistance
to digestion are often interposed between the microbes and their respective
substrate. For successful access to preferred nutrient substrates, adhesive and
degradative capacities must be used in combination by the rumen microorganisms
in order to digest plant cell walls or protein coats. In addition, various enzyme
activities are often required. For example, Fibrobacter succinogenes produces
hemicellulase (xylanase) activity to digest complex cell walls and to expose the
cellulose for digestion, and S. bovis expresses a protease to digest the starch grain
protein coat and expose the readily fermentable starch. In addition, no single
organism is capable of digesting all the available substrates within the rumen.
Therefore a series of interrelated consortia that work together in fibre digestion is
essential amongst the rumen microbial populations. Examples are the increased
rate of cellulose digestion in vitro by Treponema and Ruminococcus species in
coculture (Kudo et al. 1987), or the inhibition of cellulose digestion by ruminal
fungi in the presence of R. flavefaciens (Bernalier et al. 1993).

26
Intimate contact between cell surfaces and insoluble substrates can bring cell-
bound enzymes into contact with their substrates, ensuring effective digestion and
the immediate availability of the degradation products to be used by the organism
(Morris and Cole 1987). However the thickness of the EPS-protein glycocalyx
secreted by each organism dictates the differences in spatial organisation. A
cellulosome complex that comprises enzymic and non-enzymic moieties mediates
the attachment of the highly cellulolytic non ruminal Clostridia to cellulose,
whereas the equivalent process in ruminal Clostridia remains unknown. A
complex EPS-protein matrix mediates starch digestion by amylolytic S. bovis
(Bayer and Lamed 1986). The nature and mechanisms of each rumen
microorganism’s relationship with insoluble substrates varies from one strain to
another. For example, R. flavifaciens adheres at a short distance from the cellulose
fibril surface, whereas F. succinogens adheres very closely (Cheng et al . 1989).
The physicochemical properties of the substrate influences the affinity for
cellulase (Lee et al. 1982). This enzyme-substrate system is heterogeneous, since
native cellulosic materials are water-insoluble substrates, and several steps are
involved in the hydrolysis reaction. One of the important parameters that governs
the rate of enzymatic hydrolysis is the system of adsorption between the enzymes
and substrates. For subsequent catalytic hydrolysis, direct physical contact or the
adsorption of enzyme molecules on susceptible sites of the cellulose surface is a
prerequisite (Lee et al. 1982). The distribution coefficient, the half-saturation and
maximum adsorption constants are thought of as the adsorption parameters, which
vary with the pretreatment and the source of cellulose, and are correlated with the
27
specific surface area (Lee et al. 1982) and the crystallinity (Ghose and Bisaria
1979) of the polysaccharides.
A specific binding reaction (adherence) will occur rapidly when cellulose is
exposed to a cellulolytic microorganism and it can be competitively inhibited by
specific functional group substitutions, as in methyl cellulose. This indicates that
specific surface area modifications affect the adsorption parameters (Lee et al.
1982). The absence of a cellulose-cellulase adherence system will reduce or
completely inhibit cellulose hydrolysis, as shown when adherence defective
mutants of F. succinogenes were unable to digest cellulose, although the mutants
retained their full complement of cellulase enzymes (�-1,4-endoglucanase,
cellobiosidase, cellobiase). The breakdown did not even occur at elevated levels
of cellulase, which again demonstrated the importance of adherence (Gong and
Forsberg 1989).
R. albus numbers among the most predominant bacterial species involved in
forage degradation in the reticulorumen of ruminants, and are known for their
high cellulose binding capacity; the adhesion process may represent an important
primary step for subsequent degradation of insoluble cellulosic substrates by R.
albus (Kim et al. 1999, Miron et al. 2001, Morrison and Miron 2000). Complex
mechanisms in the adhesion of R. albus SY3 to cellulose may involve glycocalyx
exopolysaccharides, cellulosome-like structures, cell-surface glycanases/
glycoproteins, or fimbrial proteins (Miron et al. 2001).

28
The slime glycocalyx layer surrounding R. albus has been suggested to be
involved in adhesion of these bacteria to cellulose (Cheng et al. 1977). This layer
is composed of glycoproteins, and removal of glycocalyx carbohydrate by
periodate oxidation significantly decreased adhesion of R. albus cells to cellulose
(Pell and Schofield 1993), suggesting that surface carbohydrate components may
also be involved in the adhesion of R. albus to cellulose (Pell and Schofield 1993).
However, whether the glycocalyx exopolysaccharide moieties are directly
involved in the adhesion process remains to be seen (Miron et al. 2001)
Electron microscopic observations (Miron et al. 1989, Kim et al. 1999) and
comparative studies with adhesion-defective mutants (Miron et al. 1998, Reddy
and Morrison 1998, Morrison and Miron 2000) revealed that protuberance-like
structures were observed to be associated with cellulosomes on the surface of R.
albus, similar to those in Clostridium thermocellum (Bayer and Lamed 1986) and
other cellulolytic micro-organsims (Lamed et al. 1987), while adhesion-defective
mutants lacked such structures on the surface.
Studies on the distribution of glycanase-related components in R. albus SY3
(Miron et al. 2001) revealed that most of the glycanases (cellulases and xylanases)
were associated with capsular and cell-wall fractions, as those in Fibrobacter
succinogenes (McGavin et al. 1990) and F. intestinalis (Miron and Forsberg 1998,
1999). Most of the bacterial enzyme activities were not integrated into
cellulosome-like complexes, while in adhesion-defective mutants, the true
cellulase activity appeared to be entirely confined to the cell membrane fractions,
and overall glycanase activity was lower. Effective substrate degradation may be

29
facilitated by direct contact between the surface glycanases and the cellulosic
substrate, And surface glycanases may directly or indirectly be involved in
bacterial adhesion (Miron et al. 2001).
Cellulase activity of R. albus SY3 has been reported to be cell-associated, and
appeared in an unstable high molecular mass 1500 kDa complex that could be
disrupted by dissociating agents into discrete low molecular mass proteins (Wood
et al. 1982). Phenylpropanoic acid or phenylacetic acid were reported as factors in
the rumen fluid to stabilize R. albus 8 cellulases and to prevent dissociation of
surface organelles (Stack and Hungate 1984; Pegden et al. 1998). In contrast,
Miron et al. (2001) found that only a small portion of the cellulolytic and
xylanolytic activity in R. albus SY3 envelopes and extracellular fluids were
associated with cellulosome-like complexes. The glycanases may have been
dissociated from a cellulosome-like complex during isolation of subcellular
fractions, due to weak cohesin-dockerin affinity interaction. Genetic analysis,
however, also support the presence of additional noncellulosomal glycanases,
such as those of endoglucanases celA and celB of R. albus SY3, endoglucanases I,
II, III and IV of R. albus F-40, as well as several xylanases; which lacked
dockerin-like domains, and therefore would not be integrated as part of a
cellulosome-like complex (Poole et al. 1990; Karita et al. 1997; Nagamine et al.
1997; White et al. 1997; Ohara et al. 2000). Whether the cellulosome-like
complexes of the ruminococci contain a cellulose-binding domain on a scaffoldin
subunit, or whether the molecular basis for delivering ruminococcal cellulosomes
to the subunit involves an alternative mechanism(s), remains unknown (Miron et
al. 2001).

30
Microscopic examination of R. albus strains suggested that fimbriae-like
structures may be involved in cell adhesion to cellulose (Stack and Hungate 1984,
Pegden et al. 1998, Kim et al. 1999). The gene sequence of one of the cellulose-
bound proteins found in R. albus 8 (Pegden et al. 1998; Reddy and Morrison
1998; Larson et al. 1999), referred to as cellulose-binding protein type C (cbpC),
belongs to the Pil family, and it was suggested that the binding of CbpC to
cellulose may be mediated via a fimbrial-like mechanism. A number of other R.
albus strains, including SY3, were also shown to possess the cbpC gene and
fimbriae-like protein homologue(s) (Morrison and Miron 2000; Pegden et al.
1998). The finding that similarly-sized protein bands failed to react with
adhesion-related antibodies suggests that the low molecular mass fimbrial proteins
mediate cell adhesion of R. albus SY3 in a manner distinct from either a
cellulosome-related adhesion mechanism or the involvement of cell-surface
glycoproteins (Miron et al. 2001).
1.2.6 Attachment of Butyrivibrio fibrisolvens
Bauchop et al. (1975) have demonstrated the existence of a specific bacterial
population associated with epithelial surfaces. The morphology and the density of
the bacteria were found to vary with the sampling sites. The most dense bacteria
were primarily rod-shaped cells, which covered the epithelium of the roof of the
dorsal rumen. In estimating the magnitude of the adherent population in this
region, Dehority and Grubb (1981) found that the very dense cover of rod-shaped
bacteria is primarily comprised of the genera Butyrivibrio and Prevotella.
Rasmussen et al. (1989) also reported the attachment of several B. fibrisolvens
strains to cellulose substrates, although this was not necessarily followed by
31
cellulolysis. However, the type of attachment was not described in detail, ie.
whether by an interaction between cell and cellulose surfaces or just simply
adhesion interaction. Scanning Electron Microscopy (SEM) of several strains of
B. fibrisolvens (Cheng et al. 1989) showed extracellular structures extending from
the cell surface, which seemed to mediate cell-to-cell association. There has not
been any other report concerning the attachment of B. fibrisolvens to surfaces.
Thus the mechanism and control of attachment remains unclear.
1.2.7 Possible extracellular structures of Butyrivibrio fibrisolvens that
may be involved in attachment
Amongst bacterial extracellular structures (flagella, fimbriae, extracellular
polymer and attachment proteins), extracellular polymer and attachment proteins
are the most likely ligands that may be involved in the attachment of B.
fibrisolvens to surfaces. B. fibrisolvens variants S and L used in this project have
no fimbriae or flagella. Therefore, only extracellular polymer and attachment
proteins will be investigated in this study. Since no major differences were
observed in the cytoplasmic protein profiles of S and L variants (Nili and Brooker
1995), the current studies will be more focused on the extracellular polymer.
The term extracellular polymer (EP) is often confused with extracellular
polysaccharide (EPS). It is true that in many environments these two structures are
almost equivalent. However, for Gram positive bacteria, which commonly
produce other polymers such as teichoic acids, the terminology has become
confused. Both EPS and teichoic acids have been reported to play roles in
bacterial attachment in various environments. Usually the term bacterial
32
glycocalyx is used to describe the complex structure of the extracellular matrix.
Many strains of B. fibrisolvens have been reported to produce both EPS and
teichoic acids. It is so far unclear which of these two polymers, or both are
involved in attachment. This will be discussed separately in the next section.
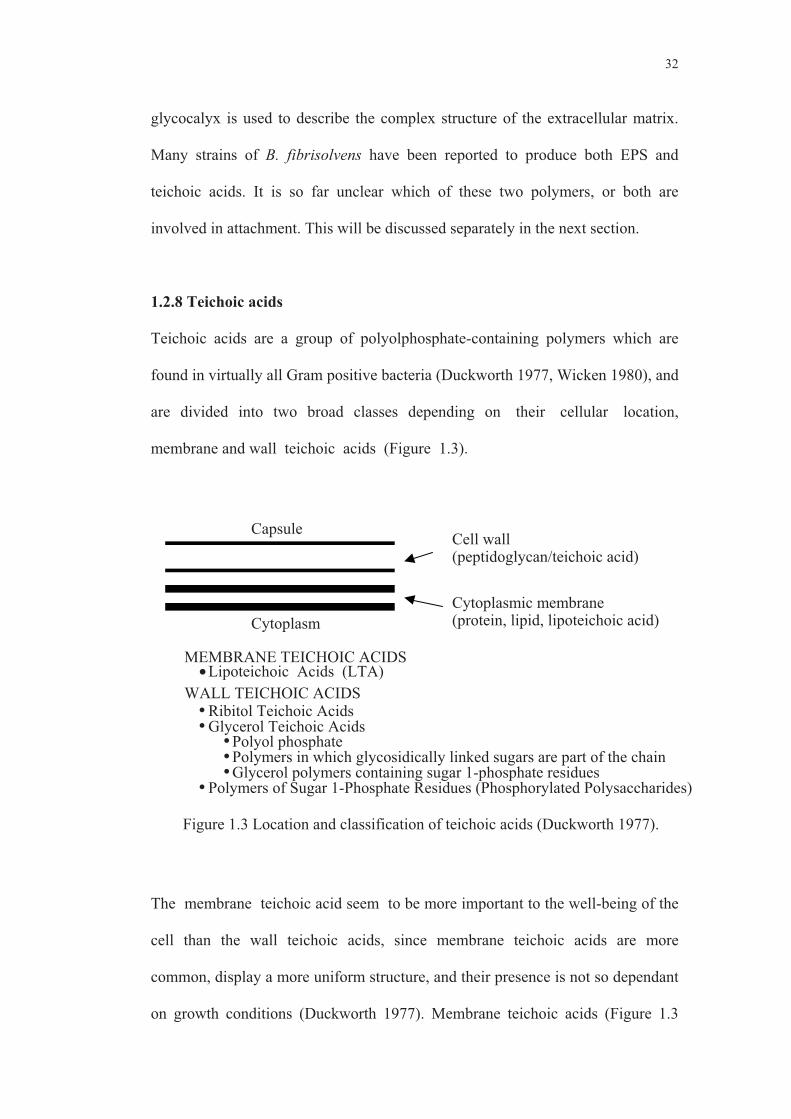
1.2.8 Teichoic acids
Teichoic acids are a group of polyolphosphate-containing polymers which are
found in virtually all Gram positive bacteria (Duckworth 1977, Wicken 1980), and
are divided into two broad classes depending on their cellular location,
membrane and wall teichoic acids (Figure 1.3).
The membrane teichoic acid seem to be more important to the well-being of the
cell than the wall teichoic acids, since membrane teichoic acids are more
common, display a more uniform structure, and their presence is not so dependant
on growth conditions (Duckworth 1977). Membrane teichoic acids (Figure 1.3
Figure 1.3 Location and classification of teichoic acids (Duckworth 1977).
WALL TEICHOIC ACIDS
��
� �
Glycerol polymers containing sugar 1-phosphate residues
Capsule
Cytoplasm
Cell wall(peptidoglycan/teichoic acid)
Cytoplasmic membrane(protein, lipid, lipoteichoic acid)
MEMBRANE TEICHOIC ACIDS�Lipoteichoic Acids (LTA)
� Ribitol Teichoic Acids
Glycerol Teichoic Acids
Polyol phosphatePolymers in which glycosidically linked sugars are part of the chain
� Polymers of Sugar 1-Phosphate Residues (Phosphorylated Polysaccharides)

33
and 1.4A and B) are known as lipoteichoic acids (LTA). They always appear as
polymers of glycerol phosphate units joined together by phosphodiester bonds and
are covalently linked to lipid residues (Dukworth 1977, Wicken 1980). While wall
teichoic acids are less common, they have considerable structural diversity and are
subject to replacement by altered culturing conditions (Wicken and Knox 1975,
Duckworth 1977). Wall teichoic acids display a full range of structural types
containing glycerol phosphate, ribitol phosphate and sugar 1-phosphate (Figure
1.3 and 1.5), and are covalently linked to peptidoglycan (Duckworth 1977).
Lipoteichoic acids are not only located randomly around the cytoplasm membrane
(Huff et al. 1974, Duckworth 1977). Their presence within the cell is also not
static as seen in Figure 1.4C (Van Driel et al. 1973). At a later stage in
their growth, the intracellular LTA are also exported to the cell wall and then
released to the medium as acetylated (amphipathic and able to form micellar) or
deacetylated extracellular LTA as can be seen in Figure 1.4D (Wicken 1980).
LTA are found in either cell wall or extracellular fractions (Duckworth 1977,
Wicken 1980).
Teichoic acids (Wall and LTA) and extracellular polysaccharides form very
complex structures at the cell surface (Figure 1.6), and are difficult to separate or
identify in terms of individual components. Usually in reports of extracellular
polysaccharides, teichoic acids are regarded as being the non-carbohydrate
fraction. However, the teichoic acids themselves also contain a carbohydrate
fraction (Figure 1.4A, 1.4B and 1.5), which appears in carbohydrate or

34
C H 2
C H 2
HR 'OPO H
O
O
O
C H 2O
P
O H
O
C H 2
O
C H 2O H
PO H
O
O H
O H
HR O
O H O
C H 2O H
O H
O H
O
O
C H 2O R '
C H 2
O
O R 'H
Figure 1.4 Structures (A & B), location (C) and biosynthesis (D) of LTA (Wicken and Knock 1975, Duckworth 1977, Wicken 1980).
Glu = Glucose Gal = Galactose
H1�6 1�2
-Glu-Gal-Glu-
H1�6 1�2
-Glu-Gal-Glu-H1�6 1�2
-Glu-Gal-Glu-
HGalGalGal GalGalGal 1�2
-Glu-Glu-HGalGalGal GalGalGal
HGalGalGal GalGalGal 1�2
-Glu-Glu-
H
Glu�Glu
Glu�Glu
Glu�Glu P
�-Glu-Glu-
1�2
Glu�Glu
Glu�Glu
Glu�Glu
H
Glu�Glu
Glu�Glu
Glu�Glu P
�-Glu-Glu-
1�2
Glu�Glu
Glu�Glu
Glu�Glu
Glu�Glu
Glu�Glu
Glu�Glu P
�-Glu-Glu-
1�2
Glu�Glu
Glu�Glu
Glu�Glu
HGluGlu Glu
-Glu-Glu-HGluGlu Glu
-Glu-Glu-
= -O-CH2-CHOH-CH2-O-P-OH
O= -O-CH2-CHOH-CH2-O-P-
OH
O= Glycerol residue
P = Phosphate group = Fatty acid ester
H
Gal� 1�2
Glu
Gal� 1�2
GluGal 1�2-Gal-Glu-H
Gal� 1�2
Glu
Gal� 1�2
GluGalH
Gal� 1�2
Glu
Gal� 1�2
GluGal 1�2-Gal-Glu-
intracellular LTA
micelle
A
B
C
D
Lactobacillus fermentum
Lactobacillus casei
Lactobacillus helveticus
Streptococcus lactis
Streptococcus faecalis
membrane
wall
(deacetylated LTA) acetylated LTA
extracellular LTA
transient LTA

35
Figure 1.5 Structures of various wall teichoic acids (Duckworth 1977).
C H 2 O
C H 2
HH OPO H
O
O
C H 2 O
PO H
OHH O
n
C H 2O
CH2
PO
OH O
OH
NHAc n
OAla
PO
OH
O
CH2
HHO
CH2O
O
O
OH
CH2O
CH2
POH
O
O
HHO
CH2O
O
OH
OH
OHn
C H 2 O
HC H 2
O HO HHO HH
PO H
O
O
C H 2 O
PO H
OHC H 2 O H
O HO HHO HH
3 6
B.1. Polyol phosphate chains
B.2. Polymers in which glycosidically linked sugars are part of the chain
A. RIBITOL TEICHOIC ACIDS
B. GLYCEROL TEICHOIC ACIDS
B.3. Glycerol polymers containing sugar 1-phosphate residues
C. POLYMERS OF SUGAR 1-PHOSPHATE RESIDUES (PHOSPHORYLATED POLYSACCHARIDES)
CH2
POH
O
O
OH
OH
NHAc
O
CH2
POH
O
O
OH
OH
NHAc
OP
OH
OO O
CH2O
OH
OH
OH
CH2OH
OH
O
NHAc
OP
OH
OO O
35

36
monosaccharide analysis of extracellular polysaccharides, and leads to biased
results.
Figure 1.6 Extracellular polymers extended from cell surface (Duckworth 1977).
I and II are perpendicular and parallel arrangement of the glycan chains in bacterial cell walls. a, b, c and d are glycan, wall teichoic acids, membrane teichoic acids (LTA) and polysaccharides (EPS), respectively. For EPS producing bacteria, the extracellular polymer network will be very complex, EPS may associate with a, b or c. Other components (polymer-associated protein, metal and other secreted material) are not presented.
LTA also form closely associated complexes with both protein and
polysaccharides. Proteins or contaminating nucleic acids can be easily removed
using proteinases or nucleases, but it is difficult to separate the polysaccharides
although various techniques such as organic solvent extraction or chromatography
a
b d
c
I
II

37
(simple gel permeation, ion exchange, lectin- or hydrophobic affinity) have been
applied (Wicken 1980).
LTA are considered more relevant to antigenic determinants (serology) or
bacterial attachment to surfaces, and have been reported in various environments.
These polymers have been used for classification in Lactobacillus
fermenti and Streptococcus faecalis, based on the reactivity with specific
antiserum to the polyglycerophosphate backbone of LTA (Wicken et al. 1963;
Knox et al. 1970, Wicken and Knock 1970, 1971, 1975; Wicken 1980), and is
commonly used to detect the presence of LTA produced by a microorganism.
B. fibrisolvens have been reported to contain both wall and membrane teichoic
acids (Sharpe et al . 1975, Markham et al. 1975, Hewett et al. 1976). However,
the biological role of these polymers in B. fibrisolvens has been neglected. The
most recent analysis of extracellular polymers in B. fibrisolvens stressed the
importance of EPS but avoided the possibility that the examined strains may also
produce teichoic acids, which are very difficult to separate during purification.
In attempting to classify B. fibrisolvens based on serological activity (reacting
toward antiserum of phospho-glycerophosphate determinants), Sharpe et al.
(1975) found that 33 out of 52 strains tested gave unexpectedly strong positive
results. Further analysis showed that the LTA isolated from these organisms
contained phosphorous, glycerol, hexose and ester-linked amino acids. Hewett et
al. (1976) found that 3 strains (No’s 37, IL6-3I and 49) produced LTA and 2
strains (D1 and 7A) did not. Two types of LTA were identified in the 3 positive
strains, acetylated LTA which consisted of a conventional 1,3-phosphodiester–

38
linked chain of glycerol phosphate joined covalently to a glycolipid, and a non-
micellar deacetylated LTA with lower molecular weight which had similar
chemical constituents but lacked fatty acid esters. The presence of 2 forms of LTA
(in bacterial extracts and in the external medium) have been reported for other
bacteria (Markham et al. 1975, Wicken and Knox 1975, Joseph and Shockman
1975).
1.2.9 Extracellular polysaccharides (EPS)
Bacterial EPS are either hetero- or homopolysaccharides, generally composed of
repeating structures, and are mostly anionic or negatively charged. However,
neutral homopolysaccharides are also commonly found (Sutherland 1985).
Heterogeneity in molecular size is found even in homopolysaccarides produced by
either Gram positive or Gram negative bacteria (levan/homopolymer of fructose,
glucans, dextran or bacterial cellulose). The molecular size of Klebsiella
aerogenes EPS ranges between 105 - 106 daltons while the smallest EPS (glucans
of A. tumefaciens and Rhizobium sp.) has a molecular size of 103 daltons
(Sutherland 1982). The non-carbohydrate substituents, monosaccharide
components, and linkage types are thought to be factors affecting structural
diversity amongst bacterial EPS (Kenne and Linberg 1983), which varies with
either the growth phase or the growth conditions used, and are frequently present
in non-stoichiometric amounts (Sutherland 1982, Sherwood et al. 1984).
The ability of bacteria to produce EPS has been identified in a variety of
ecological niches, and is considered to be a direct and logical response to selective
pressure in the natural environment of the microorganism (Dudman 1977). Thus

39
the functions ascribed to EPS are often of a protective nature (Whitfield 1988). It
has been reported that EPS plays protective roles against desiccation and
predation by protozoans, and has significant effects on diffusion (both into and
out of the cell) properties through the presence of a gelled polysaccharide layer
around the cell (Dudman 1977). It also is reported to act as an antibacterial agent
(Costerton et al. 1987). Furthermore, the penetration of both useful and toxic
metal ions may be affected or controlled by anionic EPS binding or interactions
(Dudman 1977). This has considerable practical importance in the corrosion of
metallic surfaces (Costerton et al. 1987) or in the use of EPS as a metal chelating
agent (Stack 1988).
The roles for EPS in cellular recognition have been observed in several situations
such as the specificity of certain Rhizobium sp. for some leguminous plant groups
with which they form symbiotic relationships. Plant lectins (polysaccharide
binding proteins) may direct the establishment of the symbiotic association and its
specificity for a particular Rhizobium and cell surface polysaccharides may
determine which species can form such associations (Dudman 1977, Whitfield
1988). Even subtle changes in the non-carbohydrate substituents of EPS during
the growth cycle (Sherwood et al. 1984), or mutant strains (Gardiol et al. 1987)
can be recognized by lectins such as trifolin.
The roles of EPS in microbial adherence are seen in a variety of environments
where survival depends on attachment to surfaces (Griffin et al. 1995). In some
systems other cellular factors (eg. pili) may also be involved in the initial adhesive
interaction. However, in many systems (Hyphomonas, Pseudomonas

40
solanacearum, Vibrio cholerae, Haemophilus influenzae, and others), EPS alone
appears to be the primary adhesin and therefore EPS- variants do not attach to
surfaces (Brooker et al. 1993, Quintero and Weiner 1995).
Most strains of B. fibrisolvens are reported to produce heteropolysaccharides
having pseudoplastic (thickening) properties (Cheng et al. 1977, Stack 1988, Ha
et al. 1991). The yield ranges from 2-4 mg/L to over 500 mg/L, but even for a
given strain the yields are often variable (Stack et al. 1988a). This production can
be influenced by nitrogen nutrition (Wachenheim and Patterson 1990), and further
manipulation of cultural conditions may lead to enhancement for large scale
production (Wachenheim and Patterson 1988, Ha et al. 1991). Several unusual
sugars are found as common constituents, such as L-altrose (Stack 1987, Stack et
al. 1988a), 4-O-(1-carboxyethyl)-D-galactose (Stack et al.1988b) and 4-O-(1-
carboxyethyl)-L-rhamnose (Stack and Weisleder 1990). EPS remains relatively
stable even after cell lysis and death, indicating that it has no function as a storage
polysaccharide. Furthermore, L-monosaccharide incorporation into the EPS may
have a protective role such as preventing recognition and subsequent hydrolysis
by glycanase and glycosidase enzymes present in the GI tract (Stack and Ericson
1988). Further physical and chemical characterization has revealed that EPS is
associated with replaceable mono- and divalent metal ions with different
affinities, which may lead to its use as a commercial metal chelating agent (Ha et
al. 1991). EPS also contains one or more acidic sugar components such as
lactyl-galactose or 4-O-(-carboxyethyl)-D-galactose which may present as
carboxylate groups capable of being disproportionately neutralized by basic metal
ions, or as metal-carboxylate conjugates, or as free carboxylic acids (Ha et al.
41
1991). Disproportionality and viscosities are pH dependent. Therefore the degree
of neutralization may reflect the viscosity differences among EPSs and their
rheological properties may be controllable by pH adjustment (Ha et al. 1991).
EPS production, as well as the rheological, physical and chemical properties of a
variety of B. fibrisolvens strains have been reported. However, it is still unclear
how these bacteria adhere to surfaces, whether or not EPS is involved in the
attachment, and what gene(s) are responsible for the biosynthesis of its EPS or
attachment proteins. This was mainly due to difficulties in developing suitable
vectors and a transformation system for this species. However, recent research has
successfully developed cloning vectors and gene transfer systems capable of
replication and expression in this species (Berger et al. 1989, 1990; Lin et al.
1990; Hazlewood et al.1990a,b; Rumbak et al. 1991; Ware et al. 1992;
Whitehead 1992, Hefford et al. 1993; Brooker and Lum 1993; Brooker and
Miller 1995). One such system (Beard et al. 1995) will be used in the current
research presented in this thesis.
1.2.10 Extracellular polymer biosynthesis
Although EP compositions of various B. fibrisolvens strains (either as EPS or
teichoic acids) have been reported, mechanisms of biosynthesis remain unknown.
This section describes EP biosynthesis in various microorganisms for comparison.

42
1.2.10.1 Biosynthesis of teichoic acids
1.2.10.1.1 Biosynthesis of wall teichoic acids
In the synthesis of poly-ribitol phosphate in S. aureus or Lactobacillus plantarum,
the ribitol phosphate units were transferred from CDP-ribitol to LTA onto which
the ribitol phosphate chain was assembled, and the assembled poly-ribitol
phosphate was then transferred from the glycerol phosphate chain of the acceptor
to the glycan chains of peptidoglycan (Fiedler and Glaser 1974, Duckworth 1977).
Some of the glycerol phosphate residues might be transferred to the glycan
together with the poly-ribitol phosphate, since glycerol phosphate chains were
present between the glycan and the ribitol teichoic acid. Since the precursor of this
linkage unit (tri-glycerol phosphate) was CDP glycerol, it is also possible that the
glycerol phosphate residues were added from CDP-glycerol, during total acceptor
biosynthesis (Braca and Glaser 1972, Hancock and Baddiley 1972, Fiedler and
Glasser 1974, Duckworth 1977). Similarly in the synthesis of poly-glycerol
phosphate in Bacillus licheniformis and B. subtilis, except UDP-glycerol was used
as substrate instead of UDP-ribose (Glaser and Burger 1964, Mauck and Glaser
1972, Duckworth 1977).
Sugar residue addition to the wall-glycerol or –ribitol teichoic acids has been
known for sometime, B. subtilis enzyme can also transfer glucose residues from
UDP-glucose to the free hydroxyl groups of a polymer to form �-D-
glucopyranosyl-substituted-glycerol polymer (Glaser and Burger 1964,
Duckworth 1977). Enzyme systems of various S. aureus strains were also able to
incorporate N-acetylglucosamine from UDP-acetylglucosamine into poly-ribitol
phosphate, and CDP-ribitol may serve as the acceptor, since the addition of CDP-

43
ribitol results in a much greater rate of N-acetylglucosamine incorporation
(Mauck and Glaser 1972, Glaser and Burger 1964, Ishimoto and Strominger 1966,
Duckworth 1977).
In the biosynthesis of poly-glucosyl glycerol phosphate in Bacillus licheniformis,
glucose from UDP-glucose was transferred to a phospholipid (Hancock and
Baddiley 1972), forming a glucose-phosphate-lipid complex. Glycerol phosphate
from CDP-glycerol was then incorporated to form a glycerol-phosphate-glucose-
phosphate-lipid, and the glycerol phosphate unit was then added to this growing
polymer chain (Hancock and Baddiley 1972, Duckworth 1977). Similarly, in
biosynthesis of Staphylococci lactis cell wall teichoic acid, N-acetylglucosamine
l-phosphate residues from UDP-N-acetylglucosamine is transferred to a
phospholipid (Hussey and Baddiley, 1972). The repeating unit of the polymer was
assembled by transferring a glycerol phosphate residue from CDP-glycerol to a
4-hydroxyl group of N-acetylglucosamine. This repeating unit was then
transferred to a growing teichoic acid chain, and the lipid phosphate was released.
The lipids may participate as those in the biosynthesis of peptidoglycan, but the
nature of the lipid moiety has not been directly established (Archibald 1974,
Duckworth 1977). Phosphorylated polysaccharide in S. lactis is also synthesized
by incorporating N-acetylglucosamine 1-phosphate (from UDP-N-acetylglucosa-
mine) to a phospholipid intermediate and so onto the growing polysaccharide
chain (Brooks and Baddiley 1969). The non-reducing end of the phosphorylated
polysaccharide is extended in the same direction as in conventional teichoic acids
(Brooks and Baddiley 1969, Duckworth 1977).
44
The synthesis of teichoic acid and peptidoglycan may be related (Mauck and
Glaser 1972). In S. lactis, wall teichoic acid is linked to glycan chains, which are
being synthesised at the same time as the teichoic acid is being produced. The
peptidoglycan, to which teichoic acid was already linked, may serve as the export
unit. However, these polymers may also be linked to pre-existing cell wall
structures or linked to a cell wall disaccharide that is then attached to pre-existing
cell wall material (Mauck and Glaser 1972, Duckworth 1977).
1.2.10.1.2 Biosynthesis of lipoteichoic acids
The wall teichoic acids (WTA) are synthesized at the membrane and therefore
need a lipid anchor for their solubilisation, i.e. the intermediate is either an
isoprenoid phosphate or a LTA carrier (Duckworth 1977). In contrast, the LTA
has a lipid residue as part of their structure and therefore do not necessarily need a
lipid residue for their solubilisation. In this case, the lipid end of the LTA should
be synthesized first to provide an anchor point for the growing molecule within
the membrane (Duckworth 1977). Therefore, the biosynthesis of the LTA and the
WTA may be through completely different mechanisms. Unlike wall teichoic
acids, LTA could not be biosynthesized from CDP-glycerol (Glaser and Lindsay
1974). Van Golde et al. (1973) observed that for phosphatidyl glycerol and
cardiolipin of E. coli, both phosphate and glycerol from this lipid were
incorporated into a group of related polysaccharides. These polymers possessed a
polyglucose backbone substituted with equal amounts of glycerol and phosphate,
and closely resembled the teichoic acids of Gram positive organisms. In LTA
biosynthesis of S. aureus (Glaser and Lindsay 1974) and S. sanguis (Emdur and
Chiu 1974), glycerol was transferred from the chloroform/methanol extractable

45
phosphatidyl glycerol to a water-soluble polymer, which was a lipoteichoic acid-
like compound that may participate as the acceptor in WTA biosynthesis. LTA
may be required as the precursors of the bridging regions between peptidoglycan
and other wall polymers. However, the extent to which LTA normally occurs
(approx. 2-3 % of the cell weight) and the fact that some WTA-lacking bacteria
still have LTA, make it unlikely that this is their only function, but it is not clear
whether all LTA fractions can act as acceptor or whether carrier molecules are
different in location or structural respects (Duckworth 1977). Various functions of
LTA have been reported, such as controlling the availability of cations at the
membrane; protecting cell-autolysis; maintaining the repulsive charges on the
surface of unicellular organisms; serological activity; or acting as a binding ligand
in cell attachment to surfaces (Knox and Wicken, 1973, Wicken and Knox 1975,
Duckworth 1977, Ofek and Beachey 1980, Sutherland 1985, Fletcher 1991,
Griffin et al. 1995, Kranenburg et al. 1997).
1.2.10.2 Extracellular polysaccharides biosynthesis
Based on the site and the nature of the precursors, EPS biosynthesis is classified
into two categories, synthesis outside the cell or at the cell membrane. However
some exceptions (other systems) have also been reported (Whitfield 1988).
Synthesis outside the cell, such as levans or dextrans of several Gram positive
cocci are catalysed by a series of extracellular (glycosyl transferase) enzymes,
which require sucrose or an alternative oligosaccharide as an activated precursor
(Sutherland 1982, Whitfield 1988, Kranenburg et al. 1997). This process has been
found to be complicated, as polymers are variable in branching degree and contain
both �1�3 and �1�6 linkages (Whitfield 1988).

46
The essential process of synthesis at the cell membrane in Gram negative or Gram
positive bacteria is shown in Figure 1.7 (Troy et al. 1979, Sutherland 1985,
Whitfield 1988, Kranenburg et al. 1997). During precursor synthesis, nucleotide
diphosphate or monophosphate sugars serve as activated glycosyl donors, and
synthesis is catalysed by cytoplasmic or loosely-associated-cytoplasmic-
membrane enzymes, allowing spatial organization with glycosyl transferase
enzymes (Sutherland and Norval 1970).
GRAM POSITIVE GRAM NEGATIVE
����������������� ��������������������� Cell wall C. Elongation of Outer D. Translocation of complete growing membrane polysaccharide to the cell polysaccharide surface ����������������� ��������������������� Periplasm C. Assembly and elongation B. Assembly of of growing polysaccharide Cytoplasmic lipid - linked ��������������������� membrane intermediate Cytoplasmic B. Assembly of lipid - linked membrane intermediate ����������������� ��������������������� Cytoplasm A. Precursor synthesis Cytoplasm A. Precursor synthesis Figure 1.7 Possible mechanisms of EPS biosynthesis and assembly (Whitfield 1988).
To assemble the EPS repeating units, sugars are sequentially transferred to lipid-
linked intermediates. Some of the polymerisation may take place at the lipid
intermediate level, but the precise role of lipid, in many cases, is unknown
(Sutherland 1985, Whitfield 1988, Griffin et al. 1995, Kranenburg et al. 1997).

47
It has been suggested that the lipid is involved in facilitating the accuracy and
ordered formation of the repeating unit structure, solubilization of hydrophilic
oligosaccharides in a hydrophobic membrane domain, transport across the
membrane, regulation of priorities in polysaccharide synthesis on the basis of lipid
availability, or a combination of these events (Troy 1979, Sutherland 1982,
Whitfield 1988). The lipid involved is undecaprenol phosphate lipid which is
identical to the lipid carrier in peptidoglycan and lipopolysaccharide biosynthesis
in a variety of bacteria (Troy et al. 1970, Troy 1979, Sutherland 1982, Whitfield
1988, Kranenburg et al. 1997).
During assembly and/or elongation of polysaccharide, nascent oligosaccharides
are transferred directly from lipid intermediates (Troy and McCloskey 1979) to
endogenous acceptors consisting of growing EPS chains in the cell wall (Smith et
al. 1961, Troy 1979). The role played by active protein synthesis in the assembly
of new acceptors has not been resolved. However, protein-synthesis inhibition
also inhibits (both in vitro and in vivo) the initiation of synthesis of new acceptors,
but not the elongation of pre-existing acceptors, suggesting that initiation and
elongation reactions may be discrete processes (Whitfield et al. 1984a,b;
Whitfield and Troy 1984; Whitfield 1988; Kranenburg et al. 1997). In the
addition of phospholipids that anchor some EPS to the cell surface, is still not
known whether the polysaccharide is assembled on the anchor molecule or
whether this component is added after complete polymerisation (Troy 1979,
Sutherland 1982, Whitfield 1988).
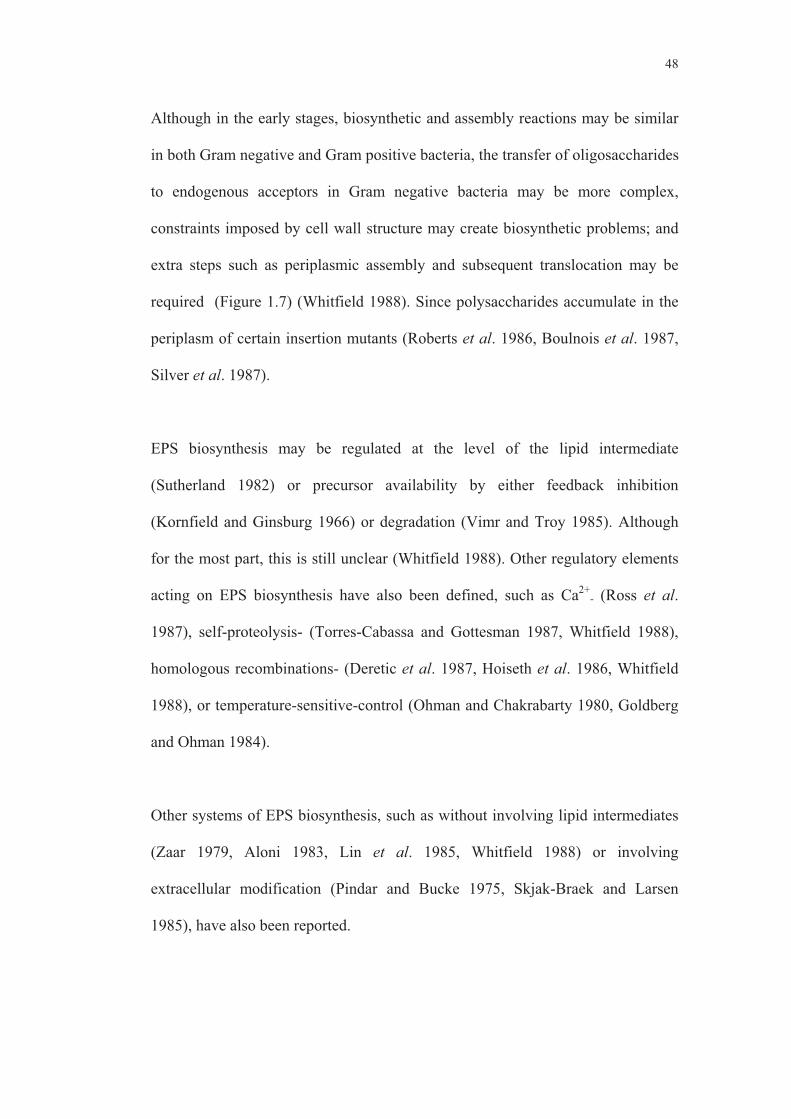
48
Although in the early stages, biosynthetic and assembly reactions may be similar
in both Gram negative and Gram positive bacteria, the transfer of oligosaccharides
to endogenous acceptors in Gram negative bacteria may be more complex,
constraints imposed by cell wall structure may create biosynthetic problems; and
extra steps such as periplasmic assembly and subsequent translocation may be
required (Figure 1.7) (Whitfield 1988). Since polysaccharides accumulate in the
periplasm of certain insertion mutants (Roberts et al. 1986, Boulnois et al. 1987,
Silver et al. 1987).
EPS biosynthesis may be regulated at the level of the lipid intermediate
(Sutherland 1982) or precursor availability by either feedback inhibition
(Kornfield and Ginsburg 1966) or degradation (Vimr and Troy 1985). Although
for the most part, this is still unclear (Whitfield 1988). Other regulatory elements
acting on EPS biosynthesis have also been defined, such as Ca2+- (Ross et al.
1987), self-proteolysis- (Torres-Cabassa and Gottesman 1987, Whitfield 1988),
homologous recombinations- (Deretic et al. 1987, Hoiseth et al. 1986, Whitfield
1988), or temperature-sensitive-control (Ohman and Chakrabarty 1980, Goldberg
and Ohman 1984).
Other systems of EPS biosynthesis, such as without involving lipid intermediates
(Zaar 1979, Aloni 1983, Lin et al. 1985, Whitfield 1988) or involving
extracellular modification (Pindar and Bucke 1975, Skjak-Braek and Larsen
1985), have also been reported.

49
1.2.11 Extracellular polymer-biosynthetic genes
The genes encoding EP biosynthesis may be encoded by plasmid, chromosome, or
both. In Lactococcus lactis, EP biosynthesis is controlled by a plasmid-dependent
gene cluster (Kranenburg et al. 1997), and in E. coli is clustered within the
chromosome (Roberts et al. 1986, Boulnois et al. 1987), while in R. melioti is
divided between the chromosome and plasmid (Leigh et al. 1985). The common
features of EP biosynthetic genes are regulator, polymerase (chain length
determination and biosynthesis of the oligosaccharide repeating units), export, and
glycosyl transferase proteins (Kranenburg et al. 1997). The assembly of the
repeating unit is usually catalysed by specific glycosyl transferase, and in many
cases, is essential since a single gene disruption results in an EP-deficient mutant
(Brown et al. 1992, Morona et al. 1994, Kranenburg et al. 1997).
EP biosynthetic genes may be arranged in a single or multiple clusters
(Kranenburg et al. 1997). An example of a plasmid-dependent EP-gene cluster is
that of Lactococcus lactis, a 12 kb region containing 14 genes, which is
transcribed as a single polycistronic mRNA (Kranenburg et al. 1997). Similar
EP-gene clusters have also been reported from Salmonella (Jiang et al. 1991),
Shigella flexneri (Morona et al. 1994), Streptococci (Rubens et al. 1993, Kolkman
et al. 1996), and Rhizobium meliloti (Stingele et al. 1996). For further discussion
on EP biosynthethic genes cluster can be found in Kranenburg et al. (1997).
In some cases, EP biosynthetic genes may also be arranged in multiple clusters,
such as in X. xampestris (Harding et al. 1987, Thorne et al. 1987) and Klebsiella
K20 (Whitfield 1988). The biosynthesis of S. typhimurium EP is also known to

50
involve either plasmid or chromosomal DNA (Markovittz 1977, Whitfield 1988),
while alginate biosynthesis system in P. aeruginosa is controlled by at least two
regions in the chromosomal DNA (Fyfe and Govan 1980).
1.2.12 Genetic manipulation in Butyrivibrio fibrisolvens
Increased productivity in the livestock industries could be obtained through
improvements in the nutrition and health of ruminant animals. The benefits to
animal production that might result from genetic manipulation of rumen bacteria
have drawn considerable attention (Teather 1985, Forsberg et al. 1986, Gregg et
al. 1987, Orpin et al. 1988, Russell and Wilson 1988, Brooker and Miller 1995).
However, progress has been somewhat slow because of a lack of the basic tools,
such as stable vectors and efficient DNA delivery systems. Amongst rumen
bacterial species, B. fibrisolvens (Ware et al. 1992, Whitehead 1992, Beard et al.
1995) and Prevotella ruminicola ( Klieve et al. 1994) are the most frequently
considered as recipients of new genetic material. Although the development of
vectors for P. ruminicola is showing great promise, progress has been much
slower for B. fibrisolvens because there is a shortage of genetic information
available on this species (Beard et al. 1995).
Various genes of B. fibrisolvens have been successfully cloned in Escherichia
coli, including those genes encoding xylosidase (Sewell et al. 1989), �-glucanase
(Romaniec et al. 1987a; Mann 1986; Berger et al. 1989; Berger et al. 1990;
Hazlewood et al. 1990a,b), xylanase (Mannarelli et al. 1990a), xylosidase and
arabinosidase (Utt et al. 1991), �-amylase (Rumbak et al. 1991), branching
enzymes (Rumbak et al. 1991) and cinnamoyl ester hydrolase (Dalrymple et al.

51
1996). However, there has been only limited success reported in the transfer of
DNA into B. fibrisolvens. Examples are the transfer of the broad-host range
plasmids RP4 from E. coli (by conjugation, imparting ampicillin resistance to the
recipient strain) (Teather 1985) and pRK248 (by PEG treatment of spheroplasts)
(Hazlewood and Teather 1988). However these studies were not pursued because
of plasmid instability. Electroporation of B. fibrisolvens with recombinant
plasmids and measurements of plasmid stability have demonstrated plasmid
maintainance over a number of generations (Ware et al 1992), but the lack of a
suitable selectable marker in the plasmid (a cryptic plasmid pBf1 from B.
fibrisolvens AR10) has made it difficult to employ it as a practical DNA transfer
vector. Transformation of B. fibrisolvens by conjugation using the Enterococcus
faecalis plasmid pAM�1 has been demonstrated by Hespell and Whitehead
(1991), but the large size of pAM�1 (26.5 kb) makes it difficult to manipulate as a
transformation vector. Although the feasibility of the system has been
successfully demonstrated by electroporating an E. coli/B. subtilis shuttle vector
into B. fibrisolvens (Whitehead 1992), the transformation efficiency was low (25
transformants/�g DNA), and the use of this vector to transfer additional DNA has
yet to be reported. However, since most B. fibrisolvens strains produce
extracellular polysaccharide with various degrees of viscosity (Stack 1988, Ha et
al. 1991), it has been suggested that the higher viscosity exopolysaccharides
produced by some strains would interfere with their ability to be transformed
using electroporation. Therefore, electroporation protocols developed for one
strain may not necessarily be appropriate for other strains of B. fibrisolvens (Clark
et al. 1994).
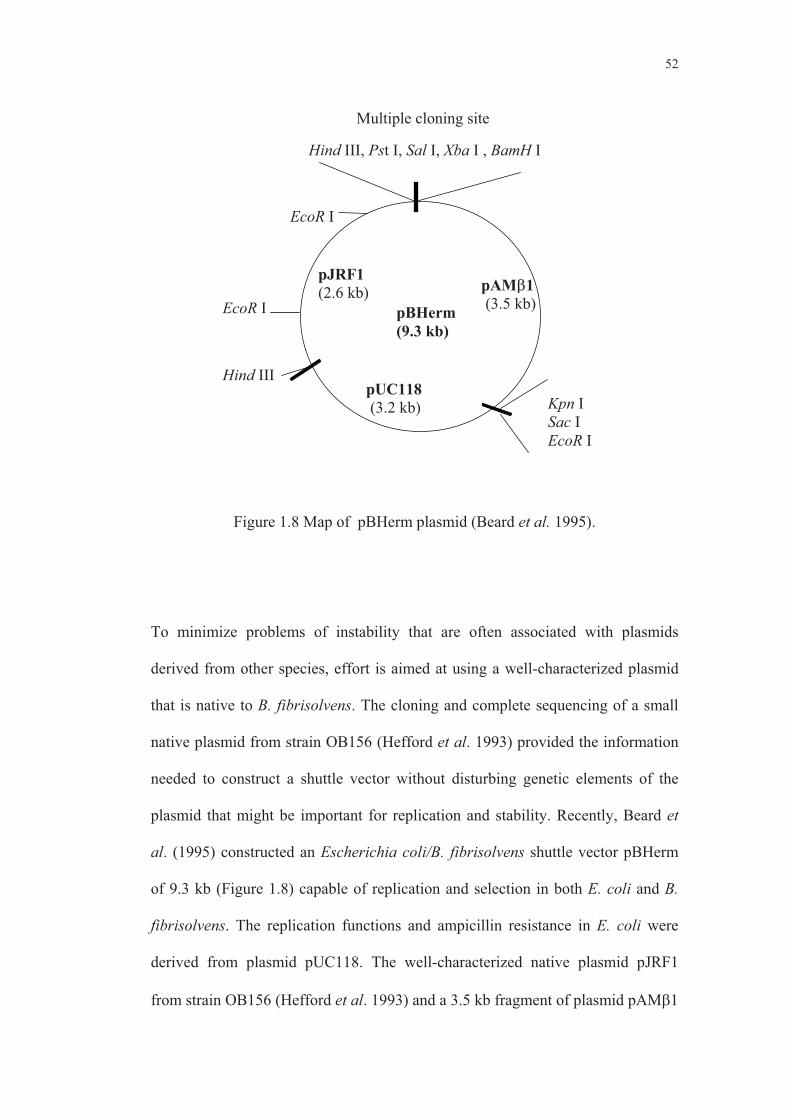
52
Figure 1.8 Map of pBHerm plasmid (Beard et al. 1995).
To minimize problems of instability that are often associated with plasmids
derived from other species, effort is aimed at using a well-characterized plasmid
that is native to B. fibrisolvens. The cloning and complete sequencing of a small
native plasmid from strain OB156 (Hefford et al. 1993) provided the information
needed to construct a shuttle vector without disturbing genetic elements of the
plasmid that might be important for replication and stability. Recently, Beard et
al. (1995) constructed an Escherichia coli/B. fibrisolvens shuttle vector pBHerm
of 9.3 kb (Figure 1.8) capable of replication and selection in both E. coli and B.
fibrisolvens. The replication functions and ampicillin resistance in E. coli were
derived from plasmid pUC118. The well-characterized native plasmid pJRF1
from strain OB156 (Hefford et al. 1993) and a 3.5 kb fragment of plasmid pAM�1
Multiple cloning site
Hind III, Pst I, Sal I, Xba I , BamH I
EcoR I
pBHerm(9.3 kb)
pUC118(3.2 kb) Kpn I
Sac IEcoR I
Hind III
EcoR I
pJRF1(2.6 kb) pAM�1
(3.5 kb)

53
containing erythromycin resistance (Whitehead and Hespell 1991) controlled the
replication functions and erythromycin resistance in B. fibrisolvens, respectively.
The features of pBHerm seem to provide a promising method as a tool for the
study of the molecular genetics of this species. The transformation efficiency of B.
fibrisolvens cells using pBHerm was 104/�g DNA (when pBHerm was isolated
from B. fibrisolvens) and 102/�g DNA (when pBHerm was isolated from E. coli)
(Beard et al. 1995). However, although pBHerm has been shown to be a practical
tool for making genetic alterations to the host organism (Gregg et al. 1994), and
the size of pBHerm is relatively small (9.3 kb) compared with other plasmids
described for genetic studies on B. fibrisolvens, it is still relatively large compared
to more commonly used E. coli vectors such as pUC18, and therefore may result
in lower transformation efficieny.
1.2.13 Aims
The aims of the present study are:
� To study the growth behaviour of S and L variants and the stability of their
phenotype, and to investigate the differences in their extracellular protein
and genetic profiles (chromosomal DNA, plasmid content and phylogeny).
The effect of carbon sources on protein profiles and the presence of
molecule(s) that may mediate attachment of the S variant or inhibit
attachment of the L variant will also be explored.
� To study and compare the effects of attachment (S and L variants) on
nutrient utilization and enzymatic activities toward carbon sources
commonly found in plant polysaccharides.

54
� To study the differences in morphology of S and L variants at various
stages of growth as well as any correlation between morphology and
carbon source used for growth.
� To compare the level of EP production between S and L variants, as well
as the composition (monosaccharide and fatty acid content) of the EP
produced by the two variants. The effect of various carbon sources on the
level of EP production and composition will also be elucidated.
� To conduct a preliminary study aimed at cloning B. fibrisolvens gene(s)
involved in attachment.

55
CHAPTER 2
MATERIALS AND METHODS
All molecular biological techniques were as described in either Current Protocols
in Molecular Biology (Ausubel et al 1989) or Molecular Cloning: A Laboratory
Manual (Sambrook et al 1989), unless otherwise indicated. The recipes for
solutions, buffers and medium used are included in Appendix C.
2.1 General materials
2.1.1 Strains
The following bacterial strains were used in this project:
� Butyrivibrio fibrisolvens E14 variants sticky (S) and loose (L); and
Butyrivibrio fibrisolvens H17c were obtained from Dr. J. D. Brooker’s Lab.,
Department of Animal Science, University of Adelaide.
� Escherichia coli K-12 ED8299 (ampicillin sensitive) lacZ�M15 was obtained
from Dr. J. Rood, Monash University, Melbourne, Australia
� E. coli K-12 DB11 (erythromycin sensitive) was obtained from Dr. B. White,
University of Illinois, USA
2.1.2 Plasmids
Plasmid pUC19 used in this project was obtained from Dr. J. D. Brooker’s
laboratory, while plasmid pBHerm was obtained from Dr. R. M. Teather, Centre

56
for Food and Animal Research, Agricultural and Agri-food, Canada, Ottawa,
Ontario.
2.1.3 Chemicals
Casamino acids and Brain Heart Infusion (BHI) were purchased from Difco
Laboratories, Detroit, USA. Tryptone and agar were prepared from Oxoid Ltd.,
Basingstoke, Hampshire, England. Resazurin, acetic acid, propionic acid, butyric
acid, isobutyric acid, n-valeric acid, isovaleric acid and DL-�-methylbutyric acid
were obtained from Aldrich Chemical Company, Milwaukee, USA. Vitamins
(biotin, riboflavin, folic acid, lipoic acid, nicotinamide, thiamin hydrochloride,
pyridoxamine and calcium pantothenate), hemin (bovine) and L-cysteine were
obtained from Sigma, Chemical Company St. Louis, USA.
Sodium dodecyl sulphate (SDS), tris (hydroxymethyl) aminoethane, acrylamide
and N,N’-methylenebisacrylamide were obtained from Sigma Chemical,
Company, St. Louis, USA. Bromophenol blue was from Ajax Chemical, Sydney,
Australia. Coomassie Brilliant Blue G-250 and N,N,N’,N’-
tetrametylethylenediamine (TEMED) were obtained from Bio-Rad Laboratories,
Richmond, CA., USA.
Paraformaldehyde was purchased from Sigma Chemical Company, USA.
Glutaraldehyde, paraformaldehyde, osmium tetroxide and Spurr’s resin (obtained
as kit) were purchased from Probing Structure, Queensland, Australia.

57
Standard monosaccharides for GC analysis were obtained from Matreya, Inc.,
California, USA, catalog no. 1124 (rhamnose, fucose, ribose and arabinose) and
no. 1125 (mannose, galactose, glucose and inositol). The internal standard inositol
was obtained from Sigma. The internal standard (C19) for fatty acid analyses was
kindly provided by Dr. Brian Siebert, Animal Science Department, University of
Adelaide.
All other chemicals, of the highest purity available, were obtained from the
following sources: Ajax Chemicals, Sydney, Australia; B.D.H. Chemicals
Australia Ltd., Boronia and Kilsyth, Australia.
2.2 Methods
2.2.1 Working cultures
Stocks of B. fibrisolvens variants S and L were stored at -80oC in 20 % glycerol
and experiments were always inoculated from glycerol stocks.
2.2.2 Culture preparations
Routine culture preparations (Figure 2.1) were always used for all experiments
involving S and L cultures, unless otherwise indicated. Starting culture
inoculation in liquid medium was 1 % v/v, unless specified.

58
Figure 2.1 General procedures for culture preparations.
* Usually the OD of S was slightly higher than L. To obtain the same OD between S and L for the starting cultures, after washing L was resuspended in basal medium to its original volume (10 ml), while S was resuspended in (OD S/OD L x 10) ml medium.
** The starting cultures were 1 % (v/v) for broth, and 5�l of diluted (1000 x) for plates, unless specified.
*** These cultures are ready for sample preparation. Cultures preparation that were used in all in experiments (growth studies, protein profiles, morphological examinations, studies of extracellular polymer production and composition) were obtained though this procedures, unless specified.
BHI plate
Glycerol stock (S or L)
BHI liquid
Growth studies (growth curves) Extracellular polymer (GC)
General cultures preparation
Morphology (SEM) Protein profiles (PAGE)
Cultures resuspended in basal medium (the OD adjusted so that the OD of both S and L cultures were approximately the same *)
Plate or liquid defined medium + glucose (g), cellobiose (cb), xylan (X), cellulose (xc), sucrose (suc), maltose (m), starch (st), other carbon sources, or nitrogen sources.
Inoculate to **
Harvest (ready cultures) ***
Washed twice anaerobically, with basal medium

59
2.2.3 Medium
All ingredients and preparations for BHI and defined medium (DF) were done as
described by Nili and Brooker (1995), except for the carbon sources. LB medium
(broth and agar), was prepared according to Sambrook et al. (1989). Addition of
antibiotics (ampicillin or erythromycin) for plate or broth aerobic and plate
anaerobic selective medium were as described in Sambrook et al (1989). For broth
anaerobic medium; the antibiotic stock solution was left 4 hours inside the
anaerobic chamber for oxygen exchange and filter sterilized inside the anaerobic
chamber before use.
2.2.4 Carbon sources
Unless otherwise indicated, all carbon sources used in the medium preparation
were 0.5 % w/v (final concentration), and were filter sterilised and added
separately, except for xylan, cellulose and starch, which were sterilised together
with other medium components. Sg, Scb, Sx, Sxc, Ssuc, Sm, Sst are
abbreviations used for S cultures (or samples isolated from these cultures) grown
on glucose, cellobiose, xylan, crystalline cellulose, sucrose, maltose and starch,
respectively. Similar abbreviations applied to L cultures.
2.2.5 Preparation of anaerobic medium
For broth medium, all components were mixed in a glass Schott bottle, adjusted to
the correct pH and boiled in a microwave oven (5 x 20 seconds). The bottle was
then capped and placed inside a Coy anaerobic chamber with an internal
atmosphere of 95 % v/v CO2/5 % v/v H2 and maintained with a palladium catalyst
and circulator unit. The medium was left inside the hood for a period of at least 4

60
hours during which time gas exchange occurred and the medium became
completely anaerobic. Aliquots were added to 15 ml Hungate tubes or to another
bottle which had been stored anaerobically at least overnight. The tubes or Schott
bottles were then capped, removed from the anaerobic chamber and sterilised by
autoclaving for 15 minutes at 121oC and 15 psi. For solid (plate) medium, 1.5 %
agar (w/v) was added to the mixture at the correct pH, autoclaved as above and
poured in plates in a laminar-flow cabinet once the medium had cooled down to
approximately 45oC. The agar plates were then transferred to the Coy anaerobic
chamber and left overnight to allow the medium to become anaerobic.
2.2.6 Protein determination
Protein concentration was determined using the Bradford method (1976) and
BSA as a standard.
2.2.7 Estimation of DNA concentration
DNA concentration and purity were estimated by the absorbance of samples at
260 nm and 280 nm against an reverse osmosis H2O blank as described in
Sambrook et al. 1989), using a Shimadzu UV-160A spectrophotometer with 1.0
cm path length and quartz glass cuvettes. One absorbance of samples at 260 nm =
50 μg/mL. A pure sample of DNA has an OD 260:280 ratio of 1.8.
2.2.8 Phenol-chloroform extraction
A half volume of TE buffer (25 mM Tris HCl, 10 mM EDTA, pH 7.8) saturated
phenol (Sambrook et al. 1989) was added to a DNA sample dissolved in TE or

61
water, followed by addition of a half volume of chloroform. After thorough
mixing and centrifugation (10,000 xg, 5min), the upper aqueous layer was
transferred to another tube. The extraction of the aqueous layer was repeated until
the interface was clear and it was then extracted twice with an equal volume of
chloroform.
2.2.9 Ethanol precipitation
Two and a half volumes of chilled absolute ethanol and 0.1 volumes of 3 M
sodium acetate pH 4.8 were added to the nucleic acid solution, and, after gently
mixing by inverting the tube several times, the solution was placed at –20oC for at
least 2 hours. The nucleic acid was recovered by centrifugation at 10,000-15,000
xg for 10 minutes at 4oC. After removing the supernatant, the nucleic acid pellet
was washed twice with 70 % ethanol, and dried in a Speedivac for 1-5 minutes.
2.2.10 Plasmid isolation from E. coli
Plasmid (pBHerm) isolation from E. coli was carried out using the alkaline lysis
method as described in Sambrook et al. (1989) as modified by Beard et al. (1995).
10 ml of E. coli (containing pBHerm and derivatives) were centrifuged at 8,000
xg, at 4oC, for 10 minutes. After discarding the supernatant, the cell pellet was
washed in 2 x 5 ml of STE (10mM Tris.HCl, 20 % w/v sucrose, 1mM EDTA, pH
8.0) buffer, with centrifugation in between as above. The cell pellet was
resuspended in 500 �l of solution I (STE buffer containing 5 mg/ml of
lysozyme), transferred to Eppendorf tubes (100 �l each) and incubated at 37oC
for 10 minutes. 200 �l of solution II (containing 0.2 M NaOH freshly diluted from

62
a 10 M stock and 1 % SDS) was added to each sample. The sample was mixed at
RT for approximately 5-10 minutes. 150 �l of ice-cold solution III (3 M
potassium acetate, 11.5 % v/v glacial acetic acid) were added to each sample and
the mixture was held on ice for 15 minutes. It was then centrifuged at 10.000 xg,
at 4oC for 15 minutes and the supernatant was transferred to another eppendorf
tube, phenol-chloroform extracted (section 2.2.8), ethanol precipitated (section
2.2.9), and dried under vacuum for 2 minutes. Plasmid DNA was dissolved in 500
�l of TE buffer pH 7.4, and any RNA was degraded using 1�l of 20 �g/ml
DNAase-free RNAase (Boehringer Mannheim) incubated at 37oC for 8 minutes.
The sample was then phenol extracted once, ethanol precipitated, and dried under
vacuum for 2 minutes. The dried sample was kept at 4oC until used. Usually from
10 ml of culture, the sample was dissolved in 25 �l water, the concentration
(A260 nm) and the purity (A260 nm/A280 nm) was determined by spectroscopy
as described in section 2.2.7, and the DNA was analysed by agarose gel
electrophoresis (section 2.2.13).
2.2.11 Plasmid isolation from B. fibrisolvens
Plasmid isolation from B. fibrisolvens was carried out as in section 2.2.10, except
cells were washed 3 times with CE buffer (50 mM Na2CO3, 25 mM EDTA, pH
10) to remove the extracellular polymer before washing with STE buffer, and
longer incubation time with lysozyme was used (30 minutes). Usually from 10 ml
of S or L culture, the plasmid DNA was dissolved in 20 �l of water.

63
2.2.12 Chromosomal DNA isolation from B. fibrisolvens
Chromosomal DNA was prepared by alkaline lysis as described in Ausubel et al.
(1989). The cells for chromosomal DNA preparation were obtained from an
overnight culture of B. fibrisolvens (variant S or L) in defined medium containing
cellobiose. 10 ml of S or L culture were centrifuged at 8,000 xg, at 4oC for 10
minutes. After discarding the supernatant, the cell pellet was washed in 3 x 10 ml
of CE (to remove the extracellular polymer), followed by 2 x 5 ml of STE buffer,
with centrifugation in between as above. The cell pellet was resuspended in 900 �l
of STE buffer containing lysozyme (5mg/ml) and incubated at 37oC for 2 hours.
SDS to a final concentration of 2 % w/v and proteinase K (final concentration 300
�g/ml) were added to the cell suspension and it was further incubated at 37oC for
3 hour or until the lysate became clear.
The cell lysate was divided into two (500 �l each), phenol/chloroform extracted
(section 2.2.8, usually at least 5 times), and ethanol precipitated (section 2.2.9).
The DNA was dissolved in an appropriate volume (500 �l) of TE buffer pH 7.4,
and the RNA was degraded using 1�l of 20 �g/ml DNase-free RNase and
incubated at 37oC for 8 minutes. The sample was then phenol extracted once,
followed by ethanol precipitation, it was then dried under vacuum for 2 minutes.
The dried sample was kept at 4oC until further use. Usually from 10 ml of culture,
the chromosomal DNA sample was dissolved in 25 �l of water, and the
concentration (A260 nm) and the purity (A260 nm/A280 nm) was determined by
spectroscopy as described in section 2.2.7 and agarose gel electrophoresis (section
2.2.13)

64
2.2.13 Agarose gel electrophoresis
DNA samples were mixed with one-sixth volume of 6x gel loading buffer
(30 % Glycerol, 0.25 % Xylene cyanol, 0.25 % Bromophenol Blue) and loaded
onto a 0.8 % w/v agarose gel. Electrophoresis was at 7.5 v/cm in 1x TAE (40 mM
Tris-acetate, 1 mM EDTA, pH 8.0) buffer until the bromophenol blue reached
about the end of the gel. After electrophoresis, the gel was stained in 0.5 �g/ml
ethidium bromide for 15 minutes, and either viewed on a transilluminator (UV
wavelength: 300 nm) and photographed or viewed using a BioRad gel
documentation system.
2.2.14 Purification of DNA from agarose gel
The DNA sample excised from an agarose gel, was put into a small plastic bag
and snap frozen in liquid nitrogen. The gel was squeezed as it thawed (Wu and
Welsh 1995), the expressed solution was then transferred onto a clean tube and
was purified by phenol/chloroform extraction followed by ethanol precipitation.
2.2.15 Restriction digestion (Sambrook et al. 1989, Ausubel et al. 1989)
Approximately 2 �g of DNA sample was restriction digested (Boehringer
Manheim) (2 units/�g DNA) in a total volume of 20 �l. The reaction mixture was
incubated at the appropriate temperature as described by the manufacture, usually
3 hours for complete digestion of plasmid or 16S rDNA, and overnight for
chromosomal DNA. Partial digestion of chromosomal DNA was carried out for 1,
2 and 3 hours). The reaction was stopped by heating (90oC, 30 seconds) followed
by phenol-chloroform extraction (section 2.2.8), ethanol precipitation (2.2.9), and
drying under vacuum for 2 minutes. The dried sample was kept at 4oC. The

65
sample was dissolved in water and the concentration was determined
spectrophotometrically (section 2.2.7), prior to use.
2.2.16 Southern transfer
Following electrophoresis of restriction enzyme digested DNA, the agarose gel
(section 2.2.13) was soaked in 0.25 M HCl solution for 15 minutes to partially
depurinate the DNA, then washed with 0.5 M NaCl solution twice for 30 and 5
minutes, respectively. After removing the NaCl solution, the DNA was transferred
to HybondTM-N+ nylon membrane (Amersham) by capillary transfer as described
by Southern (1975) for at least 6 hours in 20 x SSC (3 M NaCl, 0.3 M sodium
citrate) and finally UV crosslinked to the membrane using a Stratagene UV1800
transilluminator (254 nm) for 2 minutes.
2.2.17 Prehybridisation and hybridisation
The DNA bound membrane (section 2.2.15) was incubated with prehybridization
(0.01 % w/v calf thymus DNA, 0.2 % w/v SDS, 10 % w/v skim milk powder, 5 x
SSC) solution for at least 6 hours at 65oC in a Hybaid glass hybridisation bottle.
The prehybridisation solution was then replaced with hybridisation solution (4 %
v/v polyethylene glycol, 1 % w/v skim milk powder, 5 x SSC) containing
denatured 32P-dCTP-labeled DNA probe (section 2.2.15) followed by incubation
for at least 12 hours at 65oC. The membrane was then washed with gentle
agitation in a solution containing 2 x SSC and 0.5 % SDS at 42oC for 30 minutes,
2 x SSC and 0.1 % SDS at 42oC for 15 minutes, and 2 x SSC and 0.5 % SDS at
65oC for 15 minutes. After drying in air, the membrane was covered in Glad Wrap
66
and placed in an autoradiograph cassette with an intensifying screen for
autoradiography (section 2.2.17). Autoradiography is described in section 2.2.19.
2.2.18 Oligo-labelling of a DNA probe
Five �l of primer (Megaprime labelling primer, Amersham) solution was added to
10 μl of (25-100ng) DNA solution to be labelled, and the volume was brought to
37 μl by adding 22 μl of distilled water. The probe was denatured by boiling for 5
minutes and allowed to cool on ice. After a brief centrifugation at room
temperature, 10μl of labelling buffer (Megaprime labelling buffer, Amersham),
1μl of �-32P dCTP and 2 μl of enzyme (1unit/μl, Klenow fragment, Amersham)
were added. The reagents were mixed gently and incubated at 37oC for 30
minutes. The reaction was stopped by adding 5μl of 0.2M EDTA. The labelled
probe was denatured by boiling for 5 minutes and cooled on ice before it was
added to the hybridisation solution.
2.2.19 Autoradiography
X-ray film (Fuji medical X-ray film, Fuji photo Co., Ltd., Tokyo, Japan) was
placed on top of the membrane and exposed at -70oC for an appropriate period.
The exposed X-ray film was developed by subsequently placing it in (a:)
developer (Phenisol X-ray developer, Ilford Aust. Pty., Ltd. Victoria) for at least
2.5 minutes, fixer (Hypam X-ray Rapid fixer, Ilford Aust. Pty, Victoria) for
approximately 2.5 minutes, and distilled water for approximately 2.5 minutes. The
film was then allowed to drip dry in air.

67
2.2.20 Stripping of membranes
A boiling solution of 0.5 % w/v SDS was poured over the membrane and allowed
to cool at room temperature according to the manufacture (Amersham). The above
procedure was repeated until the level of radiation fell to zero as determined by
hand-held mini-monitor (Neomedix Systems).
2.2.21 Amplification of 16S rDNA
The ingredients of the PCR mixture were: 50 ng of DNA sample; 5 �l of 10 x
PCR buffer, 0.4 mM of dNTP; 30 pmols of universal forward primer FD1
(AAGCTTGGATCCGGTTACCTTGTTACGACTT) and reverse primer, Rp2,
(GAATTCGTCGACAGAGTTTGATCCTGGCTCAG); 1.5 mM of MgCl2; 2.5
unit of Taq polymerase (Gibco) and water to make to 50 �l. Reactions were
overlaid with light mineral oil (Sigma), and were incubated in a DNA Cetus
Thermalcycler (Perkin Elmer) under the following conditions: 94oC (4 minutes), 1
cycle; 94oC (5 minutes), 57oC (2 minutes), 72oC (2 minutes), 1 cycle; 94oC (5
minutes), 57oC (2 minutes), 72oC (2 minutes), 30 cycles; 72oC (2 minutes), 1
cycle; and 4oC (held indefinitely). The PCR products were then pipetted away
from the mineral oil, placed in clean microcentrifuge tubes, ethanol precipitated
and dried. Samples were then stored at -20oC until required. PCR samples after
digestion with restriction enzymes, were analysed by polyacrylamide gel
electrophoresis and stained using a DNA Silver Staining Kit (Pharmacia Biotech,
code no. 17-6000-30) as described by the manufacture or by agarose gel
electrophoresis ( section 2.2.13 with 1.2 % agarose, 85 volts, for 90 minutes). The

68
DNA size standard was Amplisize 50-2,000 bp ladder (BioRad, catalog no. 170-
8200).
2.2.22 Determination of dry cell weight
A known volume of bacterial cell suspension was centrifuged and the pellet was
dried under vacuum at 60oC then weighed. For cells grown in liquid medium with
insoluble substrates such as crystalline cellulose, a known volume of suspension
(cell and remaining cellulose) was filtered using a preweighed filter paper. It was
then dried at 101oC for at least 3 hours to obtain was constant weight. Cells were
lyzed by adding 5 ml of formic acid. Five 5 ml of water was then added to wash
the remaining formic acid. The sample was then dried as above and weighed to
obtain the weight of paper + cellulose. The weight of the remaining cellulose as
well as the cell weight could then be calculated. Since the acid treatment may also
partially degrade the paper, the cell weight was corrected using a control in which
an appropriate amount of cellulose suspension from uninoculated medium was
treated similarly to the samples.
2.2.23 Growth characteristics of variants grown on plates
To examine the behaviour (growth ability, stickiness and colony shape and
colour) of S & L variants on solid medium, cultures obtained through general
culture preparation (section 2.2.2) were streaked onto BHI plates and defined
medium containing various carbon sources, such as glucose, cellobiose, xylan (oat
spelt, washed oat spelt or beechwood), carboxymethyl cellulose (CMC),
crystalline cellulose (size 20, 50 or 100), fibrous cellulose, sucrose, fructose,
lactose, galactose, maltose or soluble starch. Cultures were incubated

69
anaerobically in hood at 39oC overnight (except for cellulose, where the
incubation was carried out for at least 36-48 hours), and the colonies were
examined.
2.2.24 Variant stability
The stability of the variants was examined by growing the cultures sequentially
for up to 10 passages in liquid medium and on plates containing glucose (DFg)
and the characteristic behaviour of each variant (stickiness, colony shape and
colour in solid medium, and cell clumps in liquid medium) was examined to
determine whether any changes had occurred during sequential inoculation. S or
L variants were streaked onto plate DFg medium and incubated anaerobically at
390C for 16-24 hours. Single colonies were transferred from plates into liquid DFg
medium and incubated similarly. For the first passage, the S or L liquid grown
culture was streaked on plate or inoculated in liquid DFg and incubated as above.
For the second passage, the liquid grown culture of the first passage was then
inoculated to plate or liquid DFg medium as above. This procedure was repeated
until the tenth passage.
2.2.25 Cell to cell communication
The S variant was streaked onto a DFg plate and incubated anaerobically at 390C
for 16-24 hours. A single colony was transferred from plate into liquid DFg
medium and incubated similarly, except the length of incubation was carried out
until the OD of the culture reach 0.3 (early log phase) and approximately 1.0
(early stationary phase). The liquid grown cultures (OD 0.3 and <1.0) were
centrifuged (8,000 xg, 15 minutes) and filter sterilized using a 0.21 �m Millipore

70
filter. A sample of each cell free medium was added to an L culture (<20 %, v/v)
at a starting OD of 0.0, <0.3 and <1.0. The remaining cell free medium was added
(<20 %, v/v) to the preparation of plate DFg medium used for inoculating the L
variant. The behaviour (stickiness as well as colony shape in solid medium, and
clumping in liquid medium) of the liquid and plate grown L variants were
examined.
2.2.26 Comparison of extracellular protein profiles
The extracellular protein profiles of S and L variants were compared using SDS-
PAGE. Samples were prepared from plates (total extracellular) and liquid (mostly
cell- and extracellular polymer-associated proteins) grown cultures. Samples were
concentrated by freeze-drying or by microcentrifugal concentration. The effects of
various carbon sources on the protein profiles were also studied. For total
extracellular proteins, samples were prepared from plate grown cultures. S and L
cultures obtained through general procedure preparation (section 2.2.2) were
inoculated on plates of defined medium containing various carbon sources
(glucose, cellobiose, xylan, cellulose, sucrose, maltose or starch), then incubated
anaerobically at 39oC for approximately 16 hours. For each carbon source, one
plate was used for each variant, except for cellulose where two plates were used
for each variant and incubated for two days. The plate grown cultures were
harvested with a minimal amount (<10 ml) of 0.05 M phosphate buffer pH 6.8
containing 5 mM DTT and 1 mM PMSF to inhibit proteolytic activity that may
degrade the protein samples. The cell suspensions were then transferred to clean
tubes, the volume adjusted to 10 ml using the same buffer, and left at 4oC for 2
hours with vortexing every 30 minutes. Samples were then centrifuged at 8,000

71
xg, 4oC for 15 minutes, and the supernatants were transferred to a clean tube and
concentrated by freeze-drying or microcentrifugal concentration. Samples were
snap frozen in liquid nitrogen and freeze dried overnight. The dried samples were
then dissolved in a minimal amount of water (approximately 1 ml), and the
protein concentration was determined using the Bradford method. In the
microcentrifugal method, samples were concentrated at 8,000 xg, and 4oC for 30 –
60 minutes.
For EP-associated extracellular proteins, samples were prepared from broth grown
cultures. Experiments were done as above, except broth was used instead of plate
medium. For each carbon source, 100 ml of medium (1ml culture/100 ml
medium) was used for each variant, except for cellulose where two x 200 ml of
medium was used for each variant and incubated for two days. Cells were
recovered by centrifugation (8,000 xg, 4oC, 15 minutes), and the cell free medium
were removed and concentrated by freeze-drying or microcentrifugal
concentration as above.
Denaturing PAGE was performed using vertical gels (BioRad Laboratories Ltd.,
Watford) in the presence of SDS as described in Ausubel et al. (1989), with 4 %
w/v stacking and 10 % w/v separating gels. Approximately 30 �g of S and L
extracellular protein samples were mixed with one volume of 2x gel-loading
buffer, and boiled for 3 minutes. Samples were run on 7.3 cm x 8.0 cm x 0.75 mm
gels at 85 V for 30 minutes and 120 V for 1 hour. Gels were stained for one
hour in 20 % w/v Coomassie Blue, destained in water-methanol-acetic acid (60:

72
30: 10) and dried onto Whatman 3 MM filter papers using a gel drier (BioRad
Laboratories Ltd., Watford) at 65oC for 20 minutes.
2.2.27 Comparison of plasmid profiles
To compare and study the homology between S and L host plasmids, S & L
plasmids were isolated (section 2.2.11) and digested (1 �g) with Hind III, Pst I,
Sal I, BamH I, Xba I or Pst I-Xba I (section 2.2.15) Samples were then run on an
agarose gel (section 2.2.13), transferred to a nylon membrane (section 2.2.16), and
hybridised with the smallest or the largest Pst I fragment of S or L plasmid
(section 2.2.17, 2.2.18 and 2.2.19), which had been previously labbed as described
in section 2.2.18.
2.2.28 Estimation of cellulose degradation in culture
The ability of S and L variants to degrade crystalline cellulose was compared
using a gravimetric method. Defined medium containing sigmacel (1 %, w/v) was
inoculated with S or L glucose-grown cultures (5 %, v/v starting culture) at OD
1.0. Cultures were then incubated anaerobically at 39oC for 2-3 days. The pellets
(cell and the remaining cellulose) obtained after centrifugation (8,000 xg, 4oC, 10
minutes) were transferred to a preweighed filter paper (a). Five ml of formic acid
was added (x2) to the samples to lyse the cells. Five ml of water was then added
(twice) to remove the remaining formic acid. Samples were then dried and
weighed (remaining cellulose and paper)(b). The weight of the remaining
cellulose (c) was calculated from b-a, and the % hydrolysis was calculated from:
c/initial cellulose weight x 100 %. For a control, the same amount of cellulose

73
suspension from uninoculated medium was treated similarly. The weight of the
remaining cellulose obtained above, (c), was corrected for the decrease in the
control.
2.2.29 Xylanase plate assay
To compare xylanase activity, S or L variants (section 2.2.2) were streaked onto
plates containing xylan as a sole carbon source and incubated anaerobically at
39oC for 2 days. Plates were examined for clearing zones as a result of bacterial
xylanase activity.
2.2.30 CMCase plate assay
�-glucan hydrolysis was visualized by staining the CMC plates with 0.1 % (w/v)
Congo red solution for 15 minutes, destaining with 1 M NaCl for 15 minutes and
stabilizing the visualized zones by flooding the plate with 5 % (v/v) acetic acid
(Teather and Wood 1982).
2.2.31 Quantitative CMCase assay
CMCase activity of S and L variants was compared quantitatively. The enzyme
was prepared from total extracellular protein harvested from plate grown cultures
of S or L variants. Enzyme preparation was as described in section 2.2.26, except
the cultures were only grown on plates of defined medium containing glucose, and
several plates were used for each variant to obtain an appropriate amount of
protein sample. The assay was carried out as described by Wood and Bhat (1988),
except that phosphate buffer (Groleau and Forsberg 1981, Min et al. 1994) was
used instead of PC buffer. A volume (500 �l) of 2 % CMC substrate was

74
prewarmed to 39oC for 15 minutes, 500μl of diluted enzyme in 50 mM sodium
phosphate buffer pH 6.8 was added, and the reaction was incubated at 39oC for 30
minutes. The reaction was stopped by adding 1 ml of the Somogyi copper reagent
solution (Wood and Bhat (1988) followed by boiling for 20 minutes. The
production of reducing sugar was determined using the Nelson-Somogyi reagent
(Ashwell 1957). One ml of the Nelson (arseno-molybdate) reagent was added
after cooling and the tubes were left to stand at room temperature for 10 minutes
to allow for colour development. The assay volume was diluted to 5ml with milli-
Q water followed by centrifugation at 3,000 xg for 10 minutes to sediment the
unhydrolysed CMC. The absorbance of the supernatant was read at 520 nm using
a 1.0 cm quartz cuvette in a Shimadzu Spectrophotometer (Shimadzu UV-160A,
Shimadzu Corporation, Kyoto, Japan). The control mixtures contained the same
ingredients and were treated similarly as the sample, except the enzyme was
boiled for 10 minutes before mixing with substrate. The glucose concentration
was obtained by plotting the sample absorbance against a 0-50 μg D-glucose
standard curve that was determined separately. The activity was expressed in
international units (IU). One unit of enzyme activity represents one μmole of
glucose released per minute under the assay conditions. Specific activity was
expressed as activity per mg of protein (IU/mg protein).
2.2.32 Xylanase activity assay
Xylanase activity of S and L variants was measured quantitatively, as in section
2.2.31, except xylan and xylose were used as substrate and standard for reducing
sugar, respectively.
75
2.2.33 Growth comparison in casein
To compare the growth of S and L variants using various nitrogen sources,
cultures of S or L variants (prepared according to section 2.2.2) were inoculated (1
%, v/v starting culture) in defined medium containing casein (0.5 %, w/v) or a
mixture of 0.25 % casein and 0.25 % ammonium chloride, and incubated
anaerobically at 390C for 16-36 hours. Cell growth was monitored by optical
density (OD 600 nm).
2.2.34 Semiquantitative bacterial proteolysis assay
S or L cultures (prepared as described in section 2.2.2) were streaked on plates
containing defined medium plus 0.5 % w/v casein or a mixture of 0.25 % w/v
casein and 0.25 % w/v ammonium chloride and incubated anaerobically at 39oC
for 1-2 days. Plates were then flooded with 1 M HCl to stop the reaction and to
precipitate the remaining casein. Clearing zones as a result of casein degradation
were examined.
2.2.35 Quantitative proteolytic assay
Proteolytic activities of S and L variants were analysed. Enzyme extracts were
prepared as described in section 2.2.26 (only fraction 2 was used) and the assay
was carried out using the method of Cotta and Hespell (1986). A mixture of 0.5
ml of azocasein substrate (Sigma) (0.8 % w/v azocasein in 10 mM sodium
phosphate buffer pH 6.8) and 0.5 ml of enzyme solution (fraction 2 obtained from
section 2.2.39) was incubated at 39oC for 3 hours. The reaction was stopped by
the addition of 0.5 ml of cold 1.5 M HClO4. The mixture was then incubated on

76
ice for 30 minutes and centrifuged at 12,000 xg, 4oC for 5 minutes. One ml of the
supernatant was mixed with 1 ml of 1 M NaOH, left at room temperature for 5
minutes, and then the absorbance at 440 nm was measured. As a control, enzyme
was mixed with the HClO4 in advance, before adding the substrate, then incubated
and treated as above. 1 OD � 320 �g/ml (Cotta and Hespell 1986). One unit of
activity is defined as the amount of casein degraded (�g) per hour under specified
condition and the activity was expressed as total activity (unit/ml culture).
2.2.36 Determination of attachment using SEM
To study the possible steps in attachment or extracellular polymer biosynthesis, S
or L cultures were examined under scanning electron microscopy (SEM) at
various stages of growth. S or L cultures (prepared according to section 2.2.2)
were streaked onto plates containing defined medium plus maltose or starch (0.5
%, w/v) and then incubated anaerobically at 39oC for 12, 19, 25, or 28 hours.
Cells were harvested using a glass rod, when tiny colonies appeared on the agar
plates (approximately early log phase), when colonies were bigger but still
strongly attached to the agar plates (approximately log phase), when colonies
became removable from the agar plates but still tend to stick together
(approximately early stationary phase), and when colonies became separable
(approximately stationary or late stationary phase). Cells were then prepared for
SEM using the method of Karnovsky (1965). Cells were gently resuspended in
fixative solution (0.15 %, v/v ruthenium red in PBS buffer) and left overnight at
4oC (Karnovsky 1965). The suspensions were centrifuged (10,000 xg, 4oC, 5
minutes) and the pellets were washed (2 x 30 min each) in PBS buffer containing

77
4% (w/v) sucrose. The pellets were suspended in 1% (w/v) osmium tetroxide
solution in RO water and left at room temperature for 2 h. The cells were further
centrifuged and dehydrated through a graded series of ethanol solutions (70, 90,
95, 100%), 2 changes of 30 min in each and an extra change of 1 h in 100%
ethanol. The bacteria were spotted onto aluminium SEM stubs, allowed to dry
overnight before coating with gold-palladium-carbon, and examined under a
Phillips XL30 Scanning Electron Microscope.
2.2.37 Isolation of extracellular polymer using a gradient centrifugation
method
Cell-associated EP was isolated using the gradient centrifugation method (Hewet
et al. 1976). S or L cultures (prepared as described in section 2.2.2) were
inoculated (1 %, v/v starting culture) into liquid defined medium containing
sucrose (0.5 %, w/v) and incubated anaerobically at 39oC for 16-24 hours. Cells
were harvested (from 100 ml cultures, at OD 1.0) by centrifugation (8,000 xg,
4oC, 15 minutes). The cell pellets were suspended in 4 ml medium, 1 ml was
taken for dry cell weight determination and the remaining suspension was
fractionated by gradient centrifugation as described in section 2.2.41. The polymer
obtained at the interface was collected and washed twice with water, followed by
centrifugation (10,000 xg, 10 minutes), and the amount of EP was measured using
the phenol-sulphuric method (Dubois 1956, Nili and Brooker 1995). 2.5 ml of
concentrated sulfuric acid was added to 500 �l of EP sample, mixed thoroughly
and left for 25 minutes at RT. 500 �l of 5 % w/v phenol was added, and the
absorbance at 488 nm was measured using spectrophotometer. The sample
absorbance was plotted against a glucose standard curve determined separately.

78
EP production was expressed in mg EP (based on glucose content) per mg dry cell
weight.
2.2.38 Measurements of extracellular polymer production
Total (cell-associated and secreted) EP was isolated from plate grown cultures of
S or L variants according to the method of Berri and Rollings (1995), except 2 M
NaOH was used instead of 1 M. The effect of carbon source on EP production
was examined by growing the two variants on nutrient agar plates containing
defined medium plus various carbon sources (glucose, cellobiose, xylan, cellulose,
sucrose, maltose or starch). S or L cultures (prepared as described in section 2.2.2)
were streaked onto these plates and incubated anaerobically at 39oC overnight,
except for crystalline cellulose where two plates were prepared and these were
incubated for two days. Cultures were then harvested with a minimal amount (<
10 ml) of 2 M NaOH, transferred to clean sterile yellow-capped tubes and
adjusted to 10 ml with 2 M NaOH. One ml of each sample was immediately
transferred to an Eppendorf tube, and centrifuged at 10,000 xg, at 4oC for 10 min.
After removing the supernatant, the pellets were dried under vacuum and heated
(50oC) for dry cell weight determination. The remaining 9 ml of sample was held
at 4oC for one hour with 2-5 minutes vortexing every 15 minutes, centrifuged at
3,000 xg and 4oC for one hour, and the supernatant was dialyzed against 2-3
changes of water overnight. All the dialyzed samples were then centrifuged as
above and the pellets were freeze-dried and designated as fraction I. The
supernatants were adjusted to pH 4.0 with 0.1 M acetic acid to further remove
contaminating proteins and centrifuged as above. Both the pellets and the

79
supernatant were freeze dried and designated as fractions A and N, respectively.
The cell weight and EP weight were calculated as follows:
Cell weight /plate = 10 x the cell weight measured from 1 ml sample = a
EP weight/plate = 10/9 x EP weight measured from 9 ml samples = b
EP/cell weight = b/a
For a control, uninoculated plates containing defined medium plus various carbon
sources were treated similarly.
2.2.39 Analysis of extracellular polymer by the cell free medium method
To examine secreted EP production, EP was isolated from defined-liquid medium-
grown cultures of S or L variants according to Stack, 1987. The effect of carbon
source on EP production was elucidated by growing the two variants in defined
liquid medium plus various carbon sources (glucose, cellobiose, xylan, cellulose,
sucrose, maltose or starch). S or L cultures (prepared as described in section 2.2.2)
were inoculated (1 %, v/v starting culture) in the above medium and incubated
anaerobically at 39oC overnight (until stationary phase). For each specific carbon
source, 500 ml of the above medium was used, except for crystalline cellulose
where 1 L of medium was used and it was incubated for 48 hours. Cultures were
centrifuged at 8,000 xg, 4oC for 20 minutes and the cell pellets were transferred to
Eppendorf tubes, dried under vacuum and heated for dry cell weight
determination. The cell free media was concentrated to 35 ml using rotavapor,
dialyzed against water (3 changes for the first and second days, and 2 changes for
the consecutive days) until there was no further decrease in brown color (usually
after 5 days). Samples were then centrifuged at 3,000 xg, and 4oC for one hour.
Pellets were then freeze-dried and designated as fraction I (insoluble material).

80
The supernatants were divided into three, the first fraction was freeze dried
directly and designated as fraction M. The second fraction was phenol extracted,
left for two hours at room temperature and vortexed every 30 minutes, then it was
centrifuged (3000 xg, 4oC) for one hour. The water fraction (upper) was extracted
x 2 with phenol as above, then freeze-dried and designated as fraction PD. The
third fraction was treated the same way as the second fraction, except it was
dialyzed overnight against three changes of water, before being freeze-dried and
designated as fraction P. The EP production was calculated as follows:
cell weight/500 ml medium = a
EP/500 ml medium = 3 x EP weight (M fraction) = b
EP/cell weight = b/a
For a control, uninoculated defined liquid medium plus various carbon sources
were treated similarly.
2.2.40 Monosaccharide composition of extracellular polymer
To compare monosaccharide composition of EP, various EP fractions obtained
from plates (section 2.2.46) and cell free media (section 2.2.47) were degraded
and the monosaccharide composition (in the form of alditol acetate) was
determined using Gas Chromatography (GC). Samples were prepared according
to the method of Albersheim et al. (1967), which was modified by Stack (1987).
Five mg of EP samples containing 0.5 mg internal standard inositol (Sigma, St.
Louise, USA) were dissolved in 0.5 ml of water containing 76.5 �l of
trifluoroacetate anhydrous (Sigma, St. Louise, USA), and the mixtures were
hydrolyzed at 100oC for 1 hour. Samples were then evaporated to dryness at 50oC

81
under a stream of nitrogen gas. Reduction was done by adding 0.25 ml of 0.25 M
sodium borohydride in 1 M ammonia to the dried samples, mixing the samples,
and incubating them at 40oC for 90 minutes. Glacial acetic acid (250 �l) was
added to decompose the excess borohydride, and the samples were then
evaporated to dryness as above. Acetylation was carried out by dissolving the
dried material in 0.25 ml acetic anhydride, mixing and incubating at 121oC for 3
hours. Five hundred �l of water were added to decompose the remaining acetic
anhydride. The prepared alditol acetates were then dissolved in 0.5 ml of
methylene chloride, and 0.1 �l injections were made into a Hewlett Packard 5890
gas chromatograph equipped with a 0.25 �m x 30 m DB-225 fused silica capillary
column (J&W Scientific, Rancho, Cordova, CA, USA). Due to the limited amount
of fraction I, and samples obtained from cellulose grown cultures, the procedures
were scaled down to 1 mg of EP sample containing 0.1 mg of standard inositol.
All reactions were carried out with one fifth amount of the above procedures and
at the end were extracted and dissolved in 50 �l of methylene chloride. Hence, the
concentration remained the same (1 �g of EP containing 10 % standard inositol
per 0.1 �l of methylene chloride) and injections were done using 0.1 �l of the
methylene chloride fraction. Trials were carried out using N and M fractions to
check this scaled down procedure.
Injections were run isothermally at 210oC, split 15:1, attenuator 1, and detected by
flame ionization. A Hewlett-Packard 3392A recording integrator plotted the
results and calculated peak areas. Most injections were done using 0.1 �l samples.
Higher amounts of samples were also carried out, however although the

82
chromatogram peaks were higher, the relative proportions remained the same. All
chromatograms presented in this thesis were obtained from 0.1 �l injections.
The relative proportion of each peak was expressed as mmol per mg sample and
was calculated as follow:
% peak area x mmol inositol x 1/5 mg % internal standard inositol
2.2.41 Fatty acid composition of extracellular polymer
To compare the fatty acid composition, various EP fractions obtained from plates
(section 2.2.43) and cell free media (section 2.2.44) were methylated and the fatty
acid composition was determined using GC. Samples were prepared as described
in Horwitz et al. (1980).
Five mg of EP sample was dissolved in a mixture of 1 ml water and 5 ml
methanol, and was extracted with 4 ml chloroform. After thorough mixing for
approximately 5 minutes, the sample was centrifuged at 1,000-3,000 xg for 5 to 10
minutes and the chloroform layer at the bottom was transferred to another clean
tube. The remaining water-methanol fraction was re-extracted with chloroform as
above, and the chloroform fraction obtained was pooled with the previous one.
The sample was then dried under a stream of nitrogen and was methylated by
adding 1.5 ml of acidified water-free methanol, mixing and incubating at 100oC
for 1 hour. The methylated sample was cooled at room temperature, then extracted
with a mixture of 3 ml water and 5 ml of petroleum ether (boiling point 40o-60oC),
mixed (vortex) for 5 minutes and then centrifuged at 1,000-3,000 xg for 5

83
minutes. The petroleum ether fraction (upper layer) was transferred to a clean
tube, while the water-methanol (bottom layer) was re-extracted with 5 ml of
petroleum ether as above, and the petroleum ether obtained was combined with
the previous one. The petroleum ether fraction was then dried under a stream of
nitrogen, and dissolved in a mixture of 90 �l isooctane and 10 �l methylated
internal C19 standard (stock, 1 mg/ml, w/v) (Matreya, Inc., CA, USA). The
concentration of each sample (per 100 �l) was 5 mg EP containing 10 �g internal
standard. Normally 10 % internal standard is used for GC analysis. However due
to the low proportion of fatty acid in EP samples, much less internal standard was
required (10 �g/5mg EP sample or approximately 0.2 %). Therefore the internal
standard was methylated separately and added to the sample at the end of
methylation process. Injection was done as in section 2.2.48, except the attenuator
was set at 0. The relative proportion of each peak was expressed as �mol per mg
sample and was calculated as follows:
% peak area x �mol C19 x 1/5 mg % internal standard C19
2.2.42 Dephosphorylation of linearized plasmid DNA
Approximately 2 �g (1 pmole) of linearized plasmid DNA was dephosphorylated
using bovine alkaline phosphatase (Boehringer Manheim) (1 unit/pmole DNA) in
a total volume of 10 �l. The reaction mixture was incubated at 37oC for 30
minutes. The reaction was stopped by heating (90oC, 30 seconds) followed by
phenol-chloroform extraction (section 2.2.8), ethanol precipitation (2.2.9), and
drying under vacuum for 2 minutes. The dried sample was kept in 4oC. The

84
sample was dissolved in water and the concentration was determined
spectrophotometrically (section 2.2.7), prior to use.
2.2.43 Ligation
Dephosphorylated linear plasmid DNA (1 �g) was ligated with restriction
enzyme-digested chromosomal DNA (3 �g) using bacteriophage T4 DNA ligase
(Boehringer Manheim) (1unit) in a total volume of 10 �l. The reaction mixture
was incubated at 16oC for 8 hours. The mixture was then phenol-chloroform
extracted (section 2.2.8), ethanol precipitated (2.2.9), and dried under vacuum for
2 minutes. The dried sample was kept in 4oC. The sample was dissolved in water
and the concentration was determined spectrophotometrically (section 2.2.7), prior
to use.
2.2.44 Preparation of competent E. coli cells for electroporation
E. coli ED8299 (glycerol stock) was streaked onto a plate containing LB medium
and incubated at 37oC overnight. A single colony was transferred into 5 ml of LB
liquid medium and was incubated at 37oC with moderate shaking until OD (600
nm) 0.7 was reached. The culture was then diluted with 500 ml of liquid LB
medium and incubated similarly until OD (600 nm) 0.5-0.7 was reached. It was
then centrifuged at 8,000 xg, and 4oC for 10 minutes. After discarding the
supernatant, the cell pellet was chilled on ice for 10 minutes, suspended in 50 ml
of ice-cold 10 % glycerol, and centrifuged as above. The procedure was repeated
using 5ml and 1 ml of 10 % glycerol. The cell pellet was suspended in 1 ml of ice
cold 10 % glycerol and was aliquoted into ice-cold Eppendorf tubes (100 �l) and
stored at –80oC until required.
85
2.2.45 Preparation of competent B. fibrisolvens cells for electroporation
S or L cells (glycerol stock) were streaked on defined solid medium containing
cellobiose and were incubated anaerobically at 39oC overnight. A single colony
was transferred into liquid defined medium containing cellobiose and incubated
anaerobically at 39oC until OD (600nm) = 1-1.3 was reached. 30 �l of the culture
was then inoculated into 30 ml of liquid defined medium containing cellobiose
and incubated as previously. 20 ml of prewarmed (39oC) liquid defined medium
containing cellobiose was added to the culture when the culture reached OD (600
nm) = 1.0 or other ODs as described in results, and was further incubated for one
hour. The culture was then transferred into an ice-cold 50 ml anaerobic, sterile
centrifuge tube with air tight cap and chilled thoroughly in ice water for 15
minutes. The sample was centrifuged at 8,000 xg, and 4oC for 15 minutes. The
subsequent steps were carried out anaerobically at a temperature < 4oC. After
centrifugation, the supernatant was discarded and the remaining supernatant was
removed. The cell pellet was rinsed with 5 ml of ice-cold electroporation buffer
(EB) (dithiothreitol 0.1 mM, resazurin 0.1 % w/v, sorbitol 5.25 % w/v) without
disturbing the pellet and the EB was removed. The cell pellet was then suspended
in 10 ml of ice-cold EB, mixed and another 30 ml of ice-cold EB was added to the
cell suspension. It was then centrifuged (8,000 xg, and 4oC for 15 minutes) and the
buffer was removed as above. Cells were suspended in 100 �l of ice-cold EB,
mixed, transferred into ice-cold Eppendorf tubes (42 �l each) and stored at –80oC
until further used. For large scale preparation (up to 500 ml of culture), the
reagent volumes used were multiplied 10 times.

86
2.2.46 Electroporation of E. coli
Competent cells were defrosted slowly on ice, 0.5 �g (unless indicated) of
plasmid DNA or ligation mixture was added, mixed, transferred into an ice-cold
electroporation cuvette, incubated on ice for 5 minutes and electroporated at 2.5
kV and 200 or 400 . The time constant was recorded, and the transformation
mixture was incubated on ice for 30 seconds. 1 ml of LB medium was added and
the cells were incubated at 37oC for 1 hour. The sample was diluted 1000 x with
LB medium (no dilution was used for pBHerm) and was streaked (100 �l/plate)
on LB plates containing 50�g/ml or 20 �g/ml ampicillin for pUC19 or pBHerm
transformants, respectively. Plates were incubated at 37oC overnight, the colonies
were counted and the insert-containing transformants (white colonies) were
picked and restreaked on selective medium for further purification. A single
colony of purified transformant was inoculated in liquid medium, and glycerol
stocks were prepared.
2.2.47 Electroporation of B. fibrisolvens
Electroporation was carried out as in section 2.2.46, except B. fibrisolvens (S or L
variant) were used as the competent cells and the conditions of electroporation
(voltage, resistance, DNA concentration and cell competent preparations) were
varied, as indicated in the results. The electroporation and incubation (39oC) were
carried out anaerobically. Growth of transformants was in defined medium (Nili
and Brooker 1995) containing sucrose with and without 10 �g/ml of
erythromycin.

87
CHAPTER 3
PRELIMINARY COMPARISON OF THE VARIANTS
3.1 Introduction
Previous researchers have described several strains of Butyrivibrio fibrisolvens
that attach to surfaces (Dehority and Grubb 1977, 1981; Rassmusen et al. 1989).
These organisms readily attach to cellulose fibres (Rasmussen et al. 1989), to feed
and other particles in the rumen (Dinsdale et al. 1978, Dehority and Grubb 1981),
and to sheep rumen epithelia (Mead and Jones 1981). However, attachment
characteristics of B. fibrisolvens strain E14 have not been reported. The existence
of sticky (S) and loose (L) variants of E14 (Nili 1996) provides an opportunity to
study the mechanism of attachment of B. fibrisolvens to surfaces, especially to
plant fibre.
In this chapter I describe the growth characteristics of the two variants in solid and
liquid medium containing various soluble and insoluble carbon sources, as well as
their phenotypic stability. The existence of molecule(s) that may mediate or
inhibit cell attachment was also studied. The variants were also compared at the
protein (extracellular) and genetic (plasmid, chromosomal and 16S rDNA) levels.

88
3.2 Results
3.2.1 Growth characteristics of variants on plate and liquid media
To study the growth characteristics of S and L variants on various carbon sources,
the two variants were grown on solid or liquid defined medium containing various
soluble (glucose, cellobiose, sucrose, maltose, starch) or insoluble (xylan,
cellulose) plant sugars. On an agar plates, at early log phase, S cells were attached
firmly to the agar surface and could not be removed without scraping the agar
(Figure 3.1). After longer periods (16 hours) corresponding to stationary phase,
the cells became removable, but the cells within the colonies still tended to stick
together. After 20 hours on agar, the S cells no longer stuck together and were
easy to separate. In contrast L cells could easily be removed from the agar plate
and separated at all stages of growth.
The S colonies were shinier, round and more yellow compared to L colonies
(Figure 3.1). In addition, the S colonies were spherical in shape, compared with L
colonies, in which the top surface was flattened. When late phase S cells were
removed from the plate, the agar remained undisturbed (Figure 3.2).
The results presented in Figure 3.1 and 3.2 were observed on all carbon sources,
except cellulose.
In liquid defined medium (Figure 3.3) containing soluble carbon sources (glucose,
cellobiose, sucrose, maltose or soluble starch), the S cells tended to clump during
the early stage of growth, and be dispersed at a later stage. The L cells grew
throughout of the medium at all stages of growth.

89
Figure 3.1 Colonies of S and L variants on agar plate.
B. fibrisolvens E14, variant S or L, was streaked onto solid defined medium (Nili and Brooker 1995) containing glucose, and were incubated anaerobically at 39oC for 16 hours. Similar results were obtained when cellobiose, xylan, sucrose, maltose or starch were used as carbon sources, instead of glucose.
B. fibrisolvens E14 variant L
B. fibrisolvens E14 variant S

90
agar plate
S colony
S colony
L
S colony
agar plate
agar plate (smooth)
after longer period, the colony becomes removable and the agar stays smooth (no hole)
cannot be removed without scraping the agar
agar plate
L colony L colony
agar plate
removable at all stages of growth
agar plate (smooth)
L colony
B. fibrisolvens variant S
B. fibrisolvens variant L
Figure 3.2 Colony shapes of B. fibrisolvens E14 variant S or L.
S = B. fibrisolvens E14 variant S L = B. fibrisolvens E14 variant L

91
Figure 3.3 Broth culture of B. fibrisolvens E14 variants S or L.
S = broth culture of B. fibrisolvens E14 variant S L = broth culture of B. fibrisolvens E14 variant L S or L were each grown in liquid defined medium (Nili and Brooker 1995) containing glucose, and were incubated anaerobically at 39oC for 16 hours. The S cells tended to clump at the bottom of the tube, while the L cells were dispersed throughout the medium. A similar result was obtained when cellobiose, sucrose, maltose or starch were used as carbon sources, instead of glucose.
The differences between S and L variants in liquid medium were not clear when
insoluble carbon sources such as xylan (Figure 3.4) or crystalline cellulose (Figure
3.5) were used, due to interference from the insoluble substrates. On xylan, both S
and L behaved similarly. Similar results were obtained when the xylan was
washed with water three times to remove the soluble fraction prior to
incorporation into the medium.
S L

92
Figure 3.4 Broth culture of B. fibrisolvens variant S or L cells in xylan. M = defined medium containing xylan (before inoculation) C = defined medium containing xylan, after inoculation with B. fibrisolvens E14 variant S or L Defined medium containing xylan was innoculated with S or L variants and it was incubated anaerobically at 39oC for 2 days.
In crystalline cellulose (Figure 3.5), both S and L cells grew poorly. Similar
results were obtained when larger inocula were used (2-5 %) or when the cells (S
and L) were adapted to growth in liquid media containing 0.5 % w/v crystalline
cellulose and decreasing glucose, cellobiose or both, as outlined in Figure 3.5. On
solid medium containing crystalline cellulose, only tiny colonies were observed
after three days of incubation, and it was difficult to differentiate between S and L
variants. Both variants behaved similarly on plates or in liquid medium.
M C

93
Glucose and cellobiose concentration for culture adaptation
Glucose Cellobiose Mixture of Glucose and cellobiose
0.5 % 0.5 % 0.25 % glucose and 0.25 % cellobiose
0.20 % 0.20 % 0.10 % glucose and 0.10 % cellobiose
0.10 % 0.10 % 0.005 % glucose and 0.005 % cellobiose
0.005 % 0.005 %
Figure 3.5 Growth of S and L variants in crystalline cellulose. DFxc = defined medium (Nili and Brooker 1995) containing crystalline cellulose S = culture of B. fibrisolvens variant S in DFxc L = culture of B. fibrisolvens variant L in DFxc B. fibrisolvens variants S or L were adapted in DFxc containing decreasing glucose, cellobiose or both as described in the method and text. The incubation was carried out at 39oC for 2-3 days.
Inoculate (2-5 %, v/v) defined medium containing crystalline cellulose
DFxc S L

94
The ability of S and L variants to grow on solid and in liquid medium containing
various carbon sources (Table 3.1) was similar. Both variants were able to grow in
all carbon sources tested, except on crystalline cellulose.
Table 3.1 Growth ability of S and L variants using various carbon sources.
Carbon sources
Number of colonies (cells, *) or OD 600 nm (#)
S L
Brain Heart Infusion # 1.439 ± 0.027 1.281 ± 0.024 Glucose # 0.632 ± 0.011 0.615 ± 0.008 Cellobiose # 0.538 ± 0.008 0.519 ± 0.007 Sucrose # 0.260 ± 0.005 0.114 ± 0.004 Fructose # 0.025 ± 0.004 0.022 ± 0.005 Lactose # 0.016 ± 0.003 0.014 ± 0.004 Galactose # 0.049 0.005 0.047 ± 0.006 Maltose # 0.624 ± 0.010 0.576 ± 0.011 Soluble starch # 0.129 ± 0.009 0.116 ± 0.010 Oat spelt xylan * (201 ± 23)x104 (195 ± 18)x104 Berchwood xylan * (179 ± 20)x104 (153 ± 16)x104 Washed (oat spelt) xylan * (184 ± 17)x104 (172 ± 21)x104 Carboxylmethyl cellulose * (158 ± 12)x102 (140 ± 15)x102 Cellulose size 20 * 121 ± 12 103 ± 11 Cellulose size 50 * 94 ± 10 83 ± 9 Cellulose size 100 * 81 ± 7 71 ± 10 Cellulose fibrous * 67 ± 8 52 ± 5
S = B. fibrisolvens E14 variant S L = B. fibrisolvens E14 variant L
B. fibrisolvens variants S or L were grown on solid (*) or in liquid (#) defined medium containing various carbon sources, and were incubated anaerobically at 39oC for 16 hours. Cell growth was determined by OD 600 nm (for liquid medium, #) or colony counts (for plates, *). Values represent the mean plus standard error of two independent experiments.

95
3.2.2 Stability of variants
The phenotypic stability of S and L variants was studied by serial passage on solid
or liquid medium, as described in the methods and outlined in Figure 3.6. No
changes were observed in the behaviour of S and L cells after ten serial passages
on solid or liquid medium. The S cells remained sticky on solid medium and
clumpy during early growth in liquid medium. L cells remained loose on solid
medium and grew dispersed throughout the liquid medium at all stages of growth.
The shape of S and L colonies remained spherical and flat, respectively. S
colonies remained yellow compared to the white colour of L cell colonies.
3.2.3 Cell to cell communication
Cell to cell communication experiments were carried out to explore the possibility
that S cells produced molecule(s) that may mediate cell attachment to surfaces or
that L cells produced molecule(s) that inhibited cell attachment. The S cell-free
medium (isolated at approximately OD 600 nm 0.3 or 1.0) was added to L
cultures (at approximately inoculation, midlog or late log phase), as described in
the methods and outlined in Figure 3.7.
No effect was observed when S cell-free medium was added (20 %, v/v) to L cell
cultures or when L cell-free medium was added to S cell cultures. However, it was
found that the S cell-free medium was much more difficult to pass through a
membrane filter (0.22 �m), and the filter had to be changed for every 1 ml of
sample. L cell-free medium passed through the membrane filter easily and the
filter did not need to be changed.

96
Figure 3.6 Diagrammatic representation of stability experiment.
Dfg was defined medium (Nili and Brooker 1995) containing glucose. Cultures were incubated anaerobically at 39oC for 16-24 hours.
S or L (glycerol stock)
DFg plate
DFg liquid
1st passage
Continue as above until the 10th passage
Single colony
DFg liquid
DFg liquid
DFg liquid
DFg liquid
DFg liquid
DFg liquid
DFg plate
DFg plate
DFg plate

97
Figure 3.7 Diagrammatic representation of cell to cell communication analysis using L cultures.
Dfg, defined medium (Nili and Brooker 1995) containing glucose. All incubations were carried out anaerobically at 39oC for 16-24 hours. Cell free media was added at the time of culture inoculation. The same experiment was carried out using S cultures (L-cell free media added to S cultures).
DFg plate
DFg liquid
single colony
S (glycerol stock)
cell free media
centrifuge and filter
< 20 % (v/v)
0 <0.3 <10 <0.3 <1
OD<0.3 OD<1
L L L L L L
OD 600 nm
DFg liquid
DFg liquid
DFg liquid
DFg liquid
DFg liquid
DFg liquid
DFg liquid
DFg liquid

98
3.2.4 Comparison of extracellular protein profiles
(Nili and Brooker (1995) showed that there was no significance difference
between the cytoplasmic protein profile of S and L variants. Therefore, in this
study, the extracellular protein profiles of S and L variants were compared.
Samples were prepared from liquid or solid medium grown cultures, and were
concentrated using freeze-drying or microcentrifugal concentration. The effect of
carbon source on the protein profiles was also studied using samples prepared
from cultures grown on various carbon sources.
Sg Lg Scb Lcb Sx Lx Sxc Lxc Ssuc Lsuc Sm Lm Sst Lst
Figure 3.8 Extracellular protein profiles of B. fibrisolvens variants S and L.
Sg, Scb, Sx, Sxc, Ssuc, Sm and Sst were samples isolated from B. fibrisolvens variant S grown in defined solid medium (Nili and Brooker 1995) containing glucose, cellobiose, xylan, crystalline cellulose, sucrose, maltose or starch, respectively. Lg, Lcb, Lx, Lxc, Lsuc, Lm, Lst were samples isolated from B. fibrisolvens variant L similarly. Solid medium grown cultures were harvested and extracted with 10 ml of 0.05 M phosphate buffer pH 6.8 containing 5 mM DTT and 1 mM PMSF, as described in the Methods. These were then concentrated by the freeze drying, and approximately 30 �g was fractionated using SDS PAGE and visualized by Coomassie Blue staining methods.
66.0
24.020.014.2
kDa
45.029.0

99
No significance differences were found between S and L extracellular protein
profiles using samples that were isolated from plates (Figure 3.8). Similar results
were obtained when samples were isolated from liquid medium-grown cultures. In
addition, no significant differences were observed between samples that were
concentrated by microcentrifugal concentration or freeze-drying. There was no
significant effect of carbon source on the protein profiles.
3.2.5 Comparison of chromosomal DNA profiles
The chromosomal DNA restriction patterns of S and L variants were compared.
There were no significant differences between the uncut, Sal I- and Pst I-cut
chromosomal DNA profiles of S and L variants (Figure 3.9). It was observed that
besides chromosomal DNA, both S and L variants contained an endogenous
plasmid.
3.2.6 Comparison of plasmid profiles
It has been reported (Leigh et al. 1985, Whitfield 1988) for some plasmid-bearing
bacteria that together with chromosomal DNA, plasmid DNA may be involved in
the production of extracellular polymer that may mediate attachment to surfaces.
Since both S and L variants contained an endogenous plasmid, I examined these
for evidence of any difference between S and L variants. The plasmids from S and
L variants were compared. There were no significant difference between the
uncut, Hind III-, Pst I-, Sal I-, BamH I-, Xba I- and Pst I-Xba I- cut endogenous
plasmid profiles of S and L variants (Figure 3.10). Southern blot analysis using
the largest and the smallest Pst I fragments from S or L plasmids as probes
(Figure 3.11) gave positive results for both variants (Figure 3.10).
kb kb kb

100
Figure 3.9 Chromosomal DNA profiles of B. fibrisolvens E14 variants S and L.
S = uncut, Sal I- or Pst I-cut chromosomal DNA of B. fibrisolvens variant S L = uncut, Sal I- or Pst I-cut chromosomal DNA of B. fibrisolvens variant L � = Hind III-cut � DNA
The chromosomal DNA of B. fibrisolvens E14 variant S or L was isolated and the uncut, Sal I-, Pst I-cut profiles were compared by agarose (0.8 %, w/v) gel electrophoresis and staining with ethidium bromide (0.5 �g/ml), as described in the Methods.
� S L � S L � S L
uncut Sal I cut Pst I cut
23.1 23.1
23.1
9.4 6.6 4.4
2.3 2.2
0.6
9.4
9.4
6.6
6.6
4.4
4.4
2.3
2.3
2.2
2.2
0.6 0.6

101
Figure 3.10 Plasmid profiles of S and L variants.
S = uncut, Hind III-, Pst I-, BamH I-, Xba I- or Pst I-Xba I-cut endogenous plasmid of B. fibrisolvens variant S L = uncut, Hind III-, Pst I-, BamH I-, Xba I- or Pst I-Xba I-cut endogenous plasmid of B. fibrisolvens variant L � = Hind III-cut � DNA The endogenous plasmid of B. fibrisolvens E14 variant S or L was isolated and the uncut, Hind III-, Pst I-, BamH I-, Xba I- and Pst I-Xba I-cut profiles were compared by agarose gel electrophoresis and staining with ethidium bromide (0.5 �g/ml). The DNA was transferred onto HybondTM-N+ nylon membrane (Amersham) by capillary transfer (Southern 1975) and hybridised against the largest or the smallest Pst I fragment of endogenous plasmid isolated from B. fibrisolvens E14 variant S or L (Figure 3.11), as described in the Methods
2.0
0.6
4.4
9.4
�
Hind III Sal IPst I BamH I Xba I Pst-Xba
6.6
2.3
kb
23.1
S S S S S S S L L L L L L L
uncut
0.6
2.02.34.46.69.4
23.1

102
Figure 3.11 Probes used for Southern analysis.
S = Pst I-cut plasmid DNA of B. fibrisolvens variant S L = Pst I-cut plasmid DNA of B. fibrisolvens variant S � = Hind III-cut �.DNA Endogenous plasmid of B. fibrisolvens variant S or L was isolated, restriction digested with Pst I, fractionated by agarose gel electrophoresis, and stained using ethidium bromide (0.5 �g/ml). The largest and the smallest fragments of S and L plasmids were isolated, further purified by ethanol precipitation and used as probes for Southern Blot analysis (Figure 3.10) as described in the Methods.
3.2.7 Comparison of 16S rDNA profiles
The chromosomal DNA of S and L variants was isolated, the 16Sr-DNA was
PCR-amplified as described in the methods, and the 16S rDNA restriction profiles
of both variants were compared. There were no significant difference between the
Hae III-, Alu I- and Taq I- 16S rDNA restriction profile of S and L variants
9.4
2.32.0
6.64.4
Probes (both S and L plasmids were cut with Pst I)
S L
kb
23.1
0.6
� S L

103
(Figure 3.12). The 16S rDNA profiles of B. fibrisolvens strain H17c was included
as control.
Figure 3.12 Phylogenetic analysis of S and L variants.
S = uncut, Hae III-, Alu I-cut or Taq I-cut 16S rDNA of B. fibrisolvens variant S L = uncut, Hae III-, Alu I-cut or Taq I-cut 16S rDNA of B. fibrisolvens variant L 17 = uncut, Hae III-, Alu I-cut or Taq I-cut 16S rDNA of B. fibrisolvens H17c � = Hind III-cut � DNA
The 16S rDNA of B. fibrisolvens variant S or L was PCR-amplified as described, and the uncut, Hae III-, Alu I- and Taq-I cut profiles were compared using PAGE and silver staining as described in the Methods.
S L
50
bp
2000
500400
300
200
100
15001000
700
Hae III cut
20001500
1000
700
500400
300
200
100
50
bp
Alu I cut Taq I cut
amplisize marker
S L 17 S L 17 S L 17

104
3.3 Discussion
The growth characteristics of the L variant was like most other strains of B.
fibrisolvens, with the cells being non-sticky, dispersed throughout the medium,
and easily removed from an agar plate. In contrast, the S variant, clumped
together in liquid media, attached to agar surfaces and the cells tended to stick
together. After longer periods (approximately early stationary phase), the S
variant behaved more like the L variant; being more dispersed in liquid medium,
not attached to the agar surface and the cells became separable. A similar
behaviour has been reported for B. fibrisolvens OB156 (Beard et al 1995), which
was clumpy during early growth and was dispersed throughout the liquid medium
after longer incubation. This may reflect the natural role of the S variant to attach
to surfaces within the rumen and may indicate different nutrient preferences in
vivo. Detachment at late log/early stationary phase may be a mechanism to
maintain its adherent population in logarithmic phase. Since without this
detachment mechanism, the epithelial cell surfaces may be covered by old or dead
cells, and may inhibit the cell attachment of the next generation to the epithelial
cell surfaces. For the detachment mechanism to occur, cells must be unattached or
removable from the surface, i.e. the S cells at the end of their growth phase.
Attachment blocking by polymer adsorption onto substrata have been described
previously. Examples include attachment inhibition of Pseudomonas to
polystyrene by albumin, gelatin, fibrinogen or pepsin (Fletcher 1977, 1980a); or
inhibition of attachment of Streptococci to glass by whole saliva or serum
(Ørstavik 1977, Fletcher 1980b). A decrease in attachment with increased culture
age has also been reported for marine Pseudomonas, where bacteria from log
phase cultures had the greatest tendency to attach to surfaces, and there was a
105
progressive decline in numbers of bacteria which become attached after the onset
of stationary phase and cell death (Fletcher 1977, 1980a). It was suggested that
such a decline was due to a progressive change in quality or quantity of cell
surface polymer.
Bauchop et al. (1975) demonstrated the existence of bacterial populations
associated with epithelial cell surfaces, and the most densely packed bacteria
covered the epithelium of the roof of the dorsal rumen. These were primarily rod-
shape cells. Dehority and Grubb (1977, 1981) found that those were primarily
Butyrivibrio and Prevotella. Studies on the adherence of several B. fibrisolvens
strains (A38, 49, 12, 49, X6C61) to cellulose have also been reported (Rassmusen
et al. 1989). These studies suggest that B. fibrisovens may preferentially attach to
surfaces. However, the results from stability experiments showed that the two
variants had stable phenotypes and were not easily convertible. Possibly more
than 10 passages (representing more than 30 generations) are required or a
different and richer medium may be required to negate the need for attachment
since soluble nutrient will be in excess. In addition, for a simple mutation, one
might expect a detectable frequency of reversion. This was not observed in these
experiments, raising the possibility that if a change in gene expression was the
cause, this genotype was now firmly fixed in the chromosome.
Both S and L variants grew well in soluble and insoluble sugars commonly found
in plant fibre. However, like most other B. fibrisolvens strains, both variants were
weakly cellulolytic, especially against crystalline cellulose (sigmacel size 20, 50
and 100, as well as various fibrous celluloses). Although strain E14 has been

106
reported as being cellulolytic (Orpin et al. 1985), the substrate used was CMC
instead of crystalline cellulose. Since cellulose is one of the most important plant
carbohydrates, we also tried to include it as carbon source for the subsequent
experiments. For some carbon sources, there were indications that the S variant
grew slightly faster than L, and this was examined separately in growth studies
(Chapter 4).
Cell to cell communication experiments were carried out to examine whether S or
L cells produced molecule(s) that mediate or inhibit attachment to surfaces.
Examples are attachment protein (cipA) in Clostridium (Gelhaye et al. 1993,
Fujino et al. 1993, Gerngross et al. 1993); or an attachment-inhibitor protein
(Concanavalin A) in Pseudomonas, Streptococci, or Flexibacter (Fletcher 1977,
1980a, Marshall and Cruickshank 1973), although the molecule(s) are not
necessarily proteins. Results suggested that no specific molecule produced by the
S or L variant mediates or inhibits bacterial attachment to surfaces. However, it
was found that a higher molecular weight molecule was secreted by the S variant
into the cell free medium. This molecule was retained in the membrane filter, and
was suspected to be extracellular polymer (EP). The S variant may synthesize
higher molecular weight EP than that of the L variant, and the shorter EP in L
variant may be due to the lack of certain component(s) or an incomplete
elongation process in its EP biosynthesis. This was examined separately in
Chapter 6 (characterization of EP).
Comparison of protein profiles were carried out to examine whether S produced
attachment specific protein(s) but L cells did not. Such protein(s) may be involved

107
in attachment to surfaces or EP biosynthesis. There were no significant difference
in the extracellular protein profiles of S and L variants. This supports the previous
results for cytoplasmic protein profiles (Nili 1996), and the view that they are of
the same species. However, it is also possible that a mutation has occured within
the structural, not in the regulatory sequence of the gene(s). Therefore, protein(s)
would still be expressed but without proper functions; PAGE would not resolve
such differences. DNA-DNA hybridisation may resolve such differences, for
example, using S DNA as probe, S and L chromosomal DNA can be differentiated
by adjusting the stringency during the hybridization. However, this would not be
possible if whole chromosomal DNA was used as probe, a few differences in
base-pairing would not be significant compared to the whole chromosomal base-
pairing, and is unlikely to be detectable by adjusting the hybridization stringency.
Small DNA fragments are required as probes, and they must contain sequences
with the mutation site. At this stage, we do not have such a probe. Randomly
amplified PCR is an alternate method that could be used, but primer containing
mutation sequence is required. Therefore, these two methods were not used for
further S and L DNA analysis.
The procedure for protein sample preparations did not involve cell lysis; therefore
the proteins obtained were predominantly extracellular, and can be categorized as
follows:
1. released proteins (proteins that are released to the medium and are not
attached to the cell surface or extracellular polymer)
2. cell-associated proteins (proteins that are attached to the cell surface at
all times)

108
3. EP-associated proteins (proteins that are attached to the extracellular
polymer at all times)
The extracellular protein samples that were prepared from liquid medium-grown
cultures would be predominantly cell- (2) and EP-associated (3) proteins, since
released (1) proteins would have been in the cell free medium, which was
discarded. Proteins prepared from solid plate cultures were total (1, 2 and 3)
extracellular proteins. Both samples (plates and liquid medium) contained cell-
associated (2) proteins. Therefore only released (1) and EP-associated (3) proteins
may be compared between these samples. If the major extracellular proteins were
being released (1), differences should be observed between samples that were
prepared from plate and liquid medium (lack of protein 1). The protein profiles of
both preparations showed no significant difference, suggesting that most of the
proteins were EP associated or that secreted proteins were trapped in the EP
network. Similar observations (the existence of EP-associated proteins) have been
reported for B. fibrisolvens 49 (Cotta and Hespell 1986), where several faint
protein bands were observed when EP was fractionated by PAGE, and one of
these was identified as a proteolytic enzyme. This was carried out by testing the
EP (identified as extracellular polysaccharide/EPS) fraction for proteolytic
activity. Problems in obtaining clear gel resolution were encountered due to
protein association with EPS. It was also suggested that this association may
affect protein migration through the gel, and the actual protein size may be
smaller than that indicated. Extracellular protein complexes (EP, cellulosome or
fimbriae) have also been reported for attachment proteins in Clostridium (Gelhaye
et al. 1993, Fujino et al. 1993, Gerngross et al. 1993), Azoprillum brasilense
(Dufr ne et al. 1996), E. coli (Salit and Gotschlich 1977a,b), Gonococci (Pearce

109
and Buchanan 1980, Watt and Ward 1980), or Mycoplasma (Collier 1980, Ofek
and Beachey 1980); or attachment-inhibitor proteins in Pseudomonas (Fletcher
1977, 1980a), Streptococci (Østarvik 1977) Flexibacter (Marshall and
Cruickshank 1973), and Ruminococcus (Miron et al. 2001).
Cellulase has been suspected to be involved in the attachment of R. albus to
cellulose, and has been found to be associated with capsular and cell wall
fractions (Miron et al. 2001), similar to those in Fibrobacter succinogenes
(McGavin et al. 1990) and F. intestinalis (Miron and Forsberg 1998, 1999).
Although it has been reported to be associated with a cellulosome-like complex
(Wood et al. 1982), Miron et al. (2001) found that most of the bacterial cellulase
activity was not integrated into cellulosome-like complexes. The enzyme may
have been dissociated during isolation of subcellular fractions (Miron et al. 2001).
However, noncellulosomal glycanases, such as celA and celB of R. albus SY3,
endoglucanases I, II, III and IV of R. albus F-40, have also been reported (Poole
et al. 1990; Karita et al. 1997; Nagamine et al. 1997; White et al. 1997; Ohara et
al. 2000). The status of glycanases in R. albus remain to be proven.
There was no significant effect of carbon source (glucose, cellobiose, xylan,
crystalline cellulose, sucrose, maltose or starch) on the protein profiles of both
variants, and protein profiles were identical. For an insoluble substrate such as
cellulose, it was not practical to use liquid medium grown cells, due to
interference of the remaining cellulose. In addition, a much larger volume of
phosphate buffer was required to harvest the cells, and longer periods of time to
concentrate the protein samples. Both concentrating methods (freeze drying or

110
microcentrifugal concentration) had disadvantages. For freeze-drying, the dried
samples also contained buffer salts, and this affected the minimal volume of water
required to redissolve the samples. On the other hand, EP often blocked the pores
when microcentrifugal concentration was used for concentrating the protein
samples.
The Sal I and Pst I restriction patterns of S and L total chromosomal DNA were
similar, suggesting that they are the same species. However, one could be a
mutant of the other, since unless the restriction enzyme cut exactly at the mutation
site, no pattern change would be observed. Small deletions or insertions would
also be unresolved because agarose gel electrophoresis would not resolve
differences of a few bases. If differences had been found, they would provide a
shortcut to identifying gene(s) involved. However, to detect small differences,
restriction with many enzymes would have to be undertaken, with a low
probability of success. Therefore, this experiment was more to confirm
similarities rather than differences and to verify previous data that showed no
difference in EcoR I and Hae III digestion patterns of S and L DNA profiles (Nili
1996).
Plasmid-dependent adherence or plasmid-dependent EPS biosynthesis has been
reported (Ofek and Beachey 1980, Leigh et al. 1985, Whitfield 1988, Kranenburg
et al. 1991). Since both S and L variants contain a plasmid, restriction patterns
were examined, to explore the possibility that the differences between S and L
variants may be observed in the plasmids. This approach should be more specific
and clearer than that of total chromosomal DNA. Results showed no differences in

111
Hind III, Pst I, Sal I, BamH I, Xba I and Pst I-Xba I restriction profiles. Southern
analysis also indicated that the two plasmids were identical. However, the
limitations of agarose gel electrophoresis and restriction digestion analysis, are as
described for chromosomal DNA. Indigenous plasmids have been isolated from
various B. fibrisolvens strains (Teather 1982, Mann 1986, Gennaro et al. 1987,
Ware et al. 1992, Hefford et al. 1993, Beard et al. 1995, Kobayashi et al. 1995).
Most of these plasmids (pOM1, pRJF1, pRJF2) were very similar in size
(approximately 2.8 kb) to those plasmids isolated from S and L cells. This may be
a plasmid common to many B. fibrisolvens strains, although this was not tested by
DNA-DNA hybridisation. Only pOM1 exhibited a distinctly different restriction
pattern and replication mechanism (via rolling circle) ( Hefford et al. 1993).
However, the complete nucleotide sequences, as well as the replication
mechanisms of the S and L plasmids have not been analysed. Among the plasmid-
bearing strains of B. fibrisolvens, there are no reports of their attachment
properties, and only OB156 exhibited similarities with the S variant. OB156 also
displayed a tendency to aggregate during the logarithmic phase, and be dispersed
during stationary phase (Beard et al. 1995).
A phylogenetic comparison was also undertaken, in which the restriction map for
16S rDNA was analysed. The fact that no difference was observed between S and
L 16S rDNA maps supports the hypothesis that they have identical origins. Slight
differences were observed when S and L were compared with another strain, B.
fibrisolvens H17c, and confirms a previous observation of strain differences in
16S rDNA reported by Forster et al. 1996. The data therefore support the
identification of S and L cells as belonging to B. fibrisolvens and both belonging

112
to the same strain. B. fibrisolvens has been classified phylogenetically, and results
showed that plasmid bearing strains (OB156, OB157, OB192, OB189 and 49)
appeared to be different from non-bearing strains of B. fibrisolvens (Forster et al.
1996).
In conclusion, the phenotype is stable, there is no indication that the variants
produce molecule(s) that inhibit or mediate attachment, and a larger amount of EP
is produced by the S variant compared with the L variant. The effects of carbon
source on growth and protein profiles were not significant. There was no
difference in S and L extracellular protein, chromosomal DNA, plasmid and 16S
rDNA profiles. These analyses strongly suggest that both variants are the same
strain of B. fibrisolvens.

113
CHAPTER 4
NUTRIENT UTILIZATION
4.1 Introduction
Within the rumen, substrates are often complex and resistant to digestion. They
may consist of layers of cellulose, lignin and hemicellulose in plant cell walls or
protein coats surrounding starch grains. A number of enzymes must act in
combination in order to digest these substrates, and attachment may therefore be
especially important (Morris and Cole 1987). Direct examination and in vitro
studies of ruminal microorganisms have shown that many bacteria must attach to
cellulose substrates in order to promote digestion (Kudo et al. 1987). An
adherence defective mutant of F. succinogenes that retained a full complement of
cellulase enzymes was found to be unable to digest cellulose (Gong and Forsberg
1989). Within the rumen, starch-digesting bacteria adhere to granules of starch
(Costerton et al. 1978), and it is known that certain bacteria adhere preferentially
to particular types of plant cell walls (Latham et al. 1978). These reports
demonstrate the importance of bacterial attachment to substrates and are likely to
be a significant factor controlling survival of microbial communities, especially
within competitive environments such as the rumen.
In some cases, attachment is not necessarily related to substrate digestion. Less
refractory types of plant cell wall can be degraded by soluble enzymes without the

114
need for adhesion (Akin et al. 1974, Akin 1980), and studies on several strains of
B. fibrisolvens have shown that adherence was not always followed by cellulolysis
(Rassmussen et al. 1989). For some non-ruminal bacteria, cellulose degradation
also did not depend on cell-fibre contact (Kauri and Kushner 1985).
Although bacterial surfaces may bind proteins or glycoproteins (Gibbon and
Quershi 1978, Ofek and Beachey 1980), there is no conclusive evidence that
proteins or peptides in the epithelial cell membranes of various animal tissues are
involved in bacterial recognition (Etzler and Branslator 1974, Ofek and Beachey
1980). Sugar moieties are the only residues identified as bacterial receptors on
epithelial cells (Ofek et al. 1977, Ofek and Beachey 1980). Examples are
mannose for certain E. coli strains (Ofek et al. 1977, Ofek and Beachly 1978),
fucose for Vibrio cholera (Jones 1980), sialic acid for Mycoplasma sp. (Collier
1980), �-galactosyl residues for E. coli K-88 (Ofek and Beachey 1980), and
N-acetyl-D-galactosamine for Leptotricia buccalis (Kondo et al. 1976). This may
also reflect different bacterial populations in different regions within the rumen or
other sites in the gastrointestinal tract (Etzler and Branslator 1974). Therefore,
when bacteria attach to plant fibre, it is likely that they attach via sugar moieties
on the fibre surface. In the present chapter, various carbohydrates commonly
found in plant polysaccharides were used to study the effect of attachment on
carbon utilization, as well as the effect of ligands on attachment processes.
Previous studies on S and L variants showed no significant difference in their
growth on soluble maltose (Nili 1996). In the present chapter, experiments were
carried out to determine whether attachment of S variants has any significant

115
effect on the utilization of various carbon and nitrogen sources. Soluble (starch)
and insoluble (xylan and cellulose) complex sugars, as well as simple (glucose,
cellobiose, sucrose and maltose) sugars commonly found in plant polysaccharides
were used as carbon sources, while casein was used as the nitrogen source.
4.2 Results
4.2.1 Growth in soluble carbon sources
The growth rates of B. fibrisolvens E14 sticky (S) and loose (L) on various soluble
carbon sources (glucose, cellobiose, sucrose, maltose or starch) were compared.
Mid log BHI grown cells were washed anaerobically then inoculated into defined
medium containing various soluble carbon sources. Cell growth was monitored by
optical density (OD 600 nm).
Of the 2 variants tested here, the S variant grew slightly faster (Figure 4.1 - 4.5),
however the differences were not significant. These results were obtained for
cultures that were initially grown in BHI medium before inoculating into defined
medium containing various carbon sources. Similar results were obtained when
the cultures were initially grown in glucose or cellobiose (data not shown), except
for a slightly shorter lag phase and higher final OD 600 nm.

116
Figure 4.1 Growth of B. fibrisolvens E14 variants sticky and loose in glucose as a
sole carbon source.
Defined medium (Nili and Brooker 1995) containing 0.5 % (w/v) glucose was inoculated with B. fibrisolvens E14 S (Sg) or L (Lg) that had been grown in BHI medium, and was incubated anaerobically at 39oC. Cell growth was monitored by measuring the optical density (OD 600 nm). Values represent the mean and standard error of two independent triplicate experiments.
OD
600
nm
Time (hours)
0.5
1.0
1.5
3020100
Sg
Lg
0.0

117
Figure 4.2 Growth of B. fibrisolvens E14 variants S and L in cellobiose as a sole
carbon source.
Defined medium (Nili and Brooker 1995) containing 0.5 % (w/v) cellobiose was inoculated with B. fibrisolvens E14 S (Scb) or L (Lcb) that had been grown in BHI medium, and was incubated anaerobically at 39oC. Cell growth was monitored by measuring the optical density (OD 600 nm). Values represent the mean and standard error of two independent triplicate experiments.
OD
600
nm
Time (hours)
3020100
0.0
0.4
0.8
1.2
Scb
Lcb

118
Figure 4.3 Growth of B. fibrisolvens E14 variants in sucrose as a sole carbon
source.
Defined medium (Nili and Brooker 1995) containing 0.5 % (w/v) sucrose was inoculated with B. fibrisolvens E14 S (Ssuc) or L (Lsuc) that had been grown in BHI medium, and was incubated anaerobically at 39oC. Cell growth was monitored by measuring the optical density (OD 600 nm). Values represent the mean and standard error of two independent triplicate experiments.
Time (hours)
OD
600
nm
50403020100
0.0
0.2
0.4
0.6
0.8
1.0
1.2
SsucLsuc

119
Figure 4.4 Growth of B. fibrisolvens E14 variants in maltose as a sole carbon
source.
Defined medium (Nili and Brooker 1995) containing 0.5 % (w/v) maltose was inoculated with B. fibrisolvens E14 S (Sm) or L (Lm) that had been grown in BHI medium, and was incubated anaerobically at 39oC. Cell growth was monitored by measuring the optical density (OD 600 nm). Values represent the mean and standard error of two independent triplicate experiments.
Time (hours)
OD
600
nm
3020100
0.0
0.5
1.0
1.5
Sm Lm

120
Figure 4.5 Growth of B. fibrisolvens E14 variants in starch as a sole carbon
source.
Defined medium (Nili and Brooker 1995) containing 0.5 % (w/v) starch was inoculated with B. fibrisolvens E14 S (Sst) or L (Lst) that had been grown in BHI medium, and was incubated anaerobically at 39oC. Cell growth was monitored by measuring the optical density (OD 600 nm). Values represent the mean and standard error of two independent triplicate experiments.
Time (hours)
OD
600
nm
403020100
0.0
0.4
0.8
1.2
Sst
Lst

121
4.2.2 Growth in insoluble carbon sources
The growth rates of B. fibrisolvens E14 S and L on various insoluble carbon
sources (xylan or cellulose) were compared. Mid log BHI grown cells were
washed anaerobically then inoculated into defined media containing insoluble
carbon sources (xylan or cellulose). Cell growth was monitored by total protein,
since it was not possible to monitor cell growth using optical density, due to
interference by the insoluble substrate.
The total protein method was standardised before use. S cells were grown in
defined media containing glucose. Cell growth was monitored by OD 600 nm and
total protein was estimated as described in the methods. The results (Figure 4.6)
showed a good correlation between cell growth, protein content, and time.
The S cells grew slightly better in xylan (Figure 4.7) compared to the L cells. No
significant difference was observed when washed xylan was used as a substrate
(data not shown). It was difficult to compare data for growth on crystalline
cellulose (Figure 4.8), because the variations were relatively high, possibly due to
the slow cell growth. The experiment was carried out using cultures that were
initially grown in BHI medium. Attempts to use cultures initially grown in
glucose or cellobiose as outlined in Figure 3.5 were not undertaken, since
preliminary observations (Chapter 3) did not show any significant effect on cell
growth of both S and L variants.
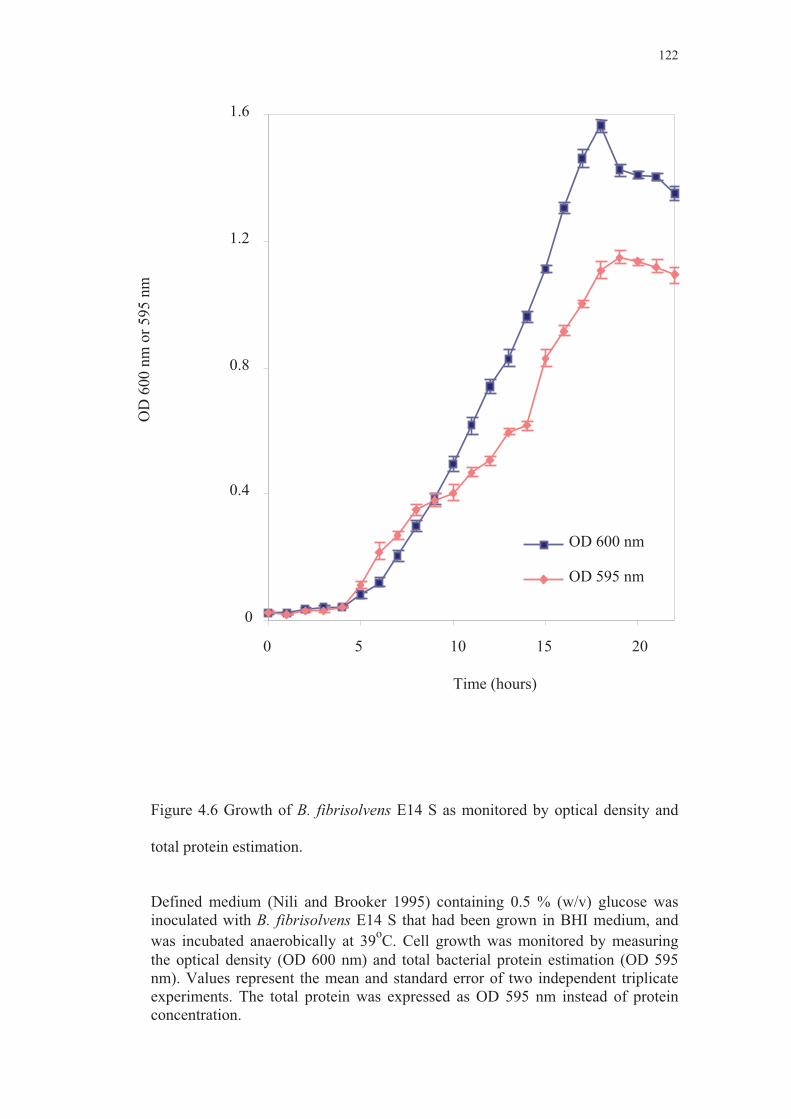
122
Figure 4.6 Growth of B. fibrisolvens E14 S as monitored by optical density and
total protein estimation.
Defined medium (Nili and Brooker 1995) containing 0.5 % (w/v) glucose was inoculated with B. fibrisolvens E14 S that had been grown in BHI medium, and was incubated anaerobically at 39oC. Cell growth was monitored by measuring the optical density (OD 600 nm) and total bacterial protein estimation (OD 595 nm). Values represent the mean and standard error of two independent triplicate experiments. The total protein was expressed as OD 595 nm instead of protein concentration.
OD
600
nm
or 5
95 n
m
0.0
0.4
0.8
1.2
Time (hours)
0
0.4
0.8
1.2
1.6
0 5 10 15 20
OD 600 nm
OD 595 nm

123
Figure 4.7 Growth of B. fibrisolvens E14 variants S and L in defined medium with
xylan as a sole carbon source.
Defined medium (Nili and Brooker 1995) containing 0.5 % (w/v) xylan was inoculated with B. fibrisolvens E14 S (Sx) or L (Lx) that had been grown in BHI medium, and was incubated anaerobically at 39oC. Cell growth was monitored by total bacterial protein. Values represent the mean plus standard errors of two independent experiments carried out in triplicate.
Bac
teria
l pro
tein
(�g)
Time (hours)
0
10
20
30
40
Sx
Lx
6040200

124
Figure 4.8 Growth of B. fibrisolvens E14 variants in defined medium with
cellulose as a sole carbon source.
Defined medium (Nili and Brooker 1995) containing 0.5 % (w/v) cellulose was inoculated with B. fibrisolvens E14 S (Sxc) or L (Lxc) that had been grown in BHI medium, and was incubated anaerobically at 39oC. Cell growth was monitored by total bacterial protein. Values represent the mean and standard errors of two independent experiments carried out in triplicate.
Bac
teria
l pro
tein
(�g)
6040200
1
2
3
4
5
SxcLxc
Time (hours)

125
The activity of S and L variants toward crystalline cellulose was compared
quantitatively using the dry weight method (Kellogg and Wood 1988). Cells were
grown in defined medium containing a known weight of cellulose, and the
remaining cellulose after incubation was measured. Cellulolytic activity was
expressed as % hydrolysis, defined as the ratio of the remaining cellulose to the
initial cellulose concentration. The results were 4.4 0.2 % and 3.5 0.3 %
hydrolysis for S and L cells, respectively.
The xylanase and CMCase activities of S and L variants were compared non-
quantitatively on agar plates. Cells were streaked onto xylanase or CMC plates
and treated as described in the methods. Therewas no significant difference in
xylanase (Figure 4.9) or CMCase (Figure 4.10) activities of S and L variants.
CMC was used since clear zones were too small to quantify when crystalline
cellulose was used as a substrate. Cell growth was very poor, even though
incubation was carried out for up to 3 days.

126
Figure 4.9 Xylanase plate assay of S and L variants.
B. fibrisolvens E14 variants S and L were streaked onto defined medium (Nili and Brooker 1995) containing 0.5 % (w/v) xylan and were incubated anaerobically at 39oC for 36 hours.
Figure 4.10 CMCase plate assay of S and L variants.
B. fibrisolvens E14 S and L were streaked onto defined medium (Nili and Brooker 1995) containing 0.5 % (w/v) CMC and were incubated anaerobically at 39oC for 36 hours. Plates were stained with 0.1 % (w/v) Congo red solution, destained with 1 M NaCl and stabilized with 5 % (v/v) acetic acid.
S L
S L
S L
127
The enzymatic activity of S and L variants toward xylanase and CMC were
compared quantitatively. Total extracellular enzyme was estimated by measuring
the reducing sugar released after incubation. The results are shown in Table 4.1.
Table 4.1 Xylanase and CMCase activities of B. fibrisolvens E14 S and L
Variant Specific activity (mU/mg protein)
Xylanase CMCase
S 24.0 0.8 5.1 0.4L 20.9 1.2 3.4 0.2
Values represent two independent triplicate assays. Activities were expressed in international units (IU), which was defined as the amount of reducing sugar released (�mol glucose or xylose/minute) as determined using the Nelson-Somogy reagent (Ashwell 1957, Wood and Bhat 1988). The specific activity was expressed as IU per mg protein. The assay was performed as described by Groleau and Forsberg (1981).
4.2.3 Comparison of nitrogen utilisation between B. fibrisolvens S and L
Since there was no significant effect of attachment on carbon utilisation, an
attempt was made to study the effect of attachment on nitrogen utilization. The
growth rate and proteolytic activity of S and L variants were compared. For
preliminary studies, the two variants were compared semiquantitatively on plates
using casein as substrate. The results showed no significant difference (Figure
4.11). However, ammonium chloride was also added, since both variants grew
poorly in defined medium with only casein as a nitrogen source. This result may
therefore not reflect the full capacity of the two variants to degrade casein. The
growth rates of S and L variants were therefore compared in defined medium
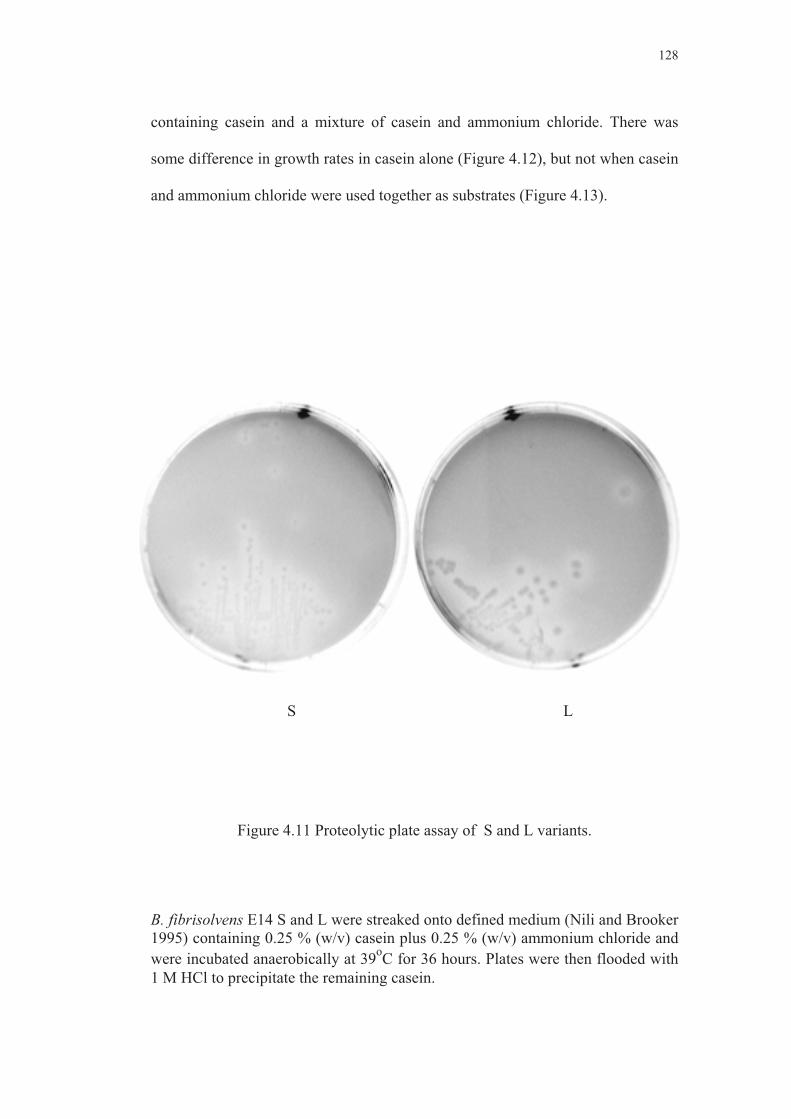
128
containing casein and a mixture of casein and ammonium chloride. There was
some difference in growth rates in casein alone (Figure 4.12), but not when casein
and ammonium chloride were used together as substrates (Figure 4.13).
Figure 4.11 Proteolytic plate assay of S and L variants.
B. fibrisolvens E14 S and L were streaked onto defined medium (Nili and Brooker 1995) containing 0.25 % (w/v) casein plus 0.25 % (w/v) ammonium chloride and were incubated anaerobically at 39oC for 36 hours. Plates were then flooded with 1 M HCl to precipitate the remaining casein.
S L

129
Figure 4.12 Growth of B. fibrisolvens E14 S and L in casein as a sole nitrogen
source.
Defined medium (Nili and Brooker 1995) containing 0.5 (w/v) casein was inoculated with B. fibrisolvens E14 S (Sc) or L (Lc) that had been grown in BHI medium, and was incubated anaerobically at 39oC. Cell growth was monitored by optical density (OD 600 nm). Values represent the mean and standard error of two independent triplicate experiments.
Time (hours)
OD
600
nm
0.0
0.2
0.4
0.6
0.8
1.0
3020100
Sc
Lc

130
Figure 4.13 Growth of B. fibrisolvens E14 S and L in casein and ammonium
chloride as nitrogen sources.
Defined medium containing 0.25 % (w/v) casein and 0.25 % (w/v) ammonium chloride was inoculated with B. fibrisolvens E14 S (Scn) or L (Lcn) that had been grown in BHI medium, and was incubated anaerobically at 39oC. Cell growth was monitored by optical density (OD 600 nm). Values represent the mean and standard error of two independent triplicate experiments.
OD
600
nm
Time (hours)
3020100
0.0
0.2
0.4
0.6
0.8
1.0
1.2
Scn
Lcn

131
A further comparison of proteolytic activity in S and L variants was carried out
enzymatically, rather than by cell growth. The proteolytic activity of B.
fibrisolvens has been reported as extracellular and associated with high molecular
weight extracellular polymer (Cotta and Hespell 1986). For that reason, the
enzyme was prepared using gradient centrifugation (Figure 4.14), to separate
secreted, cell and polymer associated proteins. However, the plate assay (Figure
4.15) showed no significant difference between S and L variants. Most activity
seemed to be associated with fraction 2, which was the polymer associated
protein.
Figure 4.14 Isolation of extracellular proteins by gradient centrifugation.
The cell suspension was applied to the top of a glycerol gradient (30 % - 75 %) and centrifuged at 6000 rpm, 4oC for 30 minutes. Fractions 1, 2 and 3 were collected as secreted, polymer and cell associated proteins, respectively.
Fraction 1 (media)
Fraction 2 (extracellular polymer)
Fraction 3 (cell)

132
Figure 4.15 Proteolytic plate assay.
S1, S2, S3, L1, L2 and L3 were fraction 1, 2 and 3 obtained by gradient centrifugation (Figure 4.14) of S or L samples. M was control buffer. Samples were loaded into the wells and incubated at 39oC for 3 hours. The plate was then flooded with 1 M HCl to stop the reaction and to precipitate the remaining casein.
Proteolytic activity was also measured using azocasein as a substrate as described
by Cotta and Hespell (1986). Only fraction 2 was used as a sample. The results
were 26.1 2.5 and 24.3 1.9 unit/ml culture for S and L variants, respectively.
These values represent the mean of independent triplicate assays.
4.3 Discussion
Throughout the experiments in this chapter, the S cells tended to grow better than
L cells. Similarly, for enzymatic activities toward xylan, cellulose and casein.
However the differences were not statistically significant.
M

133
Because of the tendency for surfaces to adsorb dissolved solutes, it has been
proposed that in various environments, nutrients will be adsorbed and
concentrated at surfaces. The ability to attach to surfaces should be an advantage
for surface-associated cells, and substrate utilization should be enhanced (Fletcher
1991) since this would provide a constantly renewed supply of nutrients
(Costerton and Irvin 1981, Leigh and Coplin 1992). Therefore, the S variant
should show better growth than the L variant. For soluble and simple substrates
(glucose, cellobiose, sucrose or maltose) this may not necessarily be true, since
attachment is not really required for these highly soluble substrates. Unlike
macromolecules, low-molecular-weight materials are usually transported directly
into the cell by diffusion or via membrane permeases, binding proteins or group
translocation systems (Fletcher 1991). In addition, the diffusion effect of nutrients
within the liquid media may reduce the advantage of attachment. Liquid media
with simple soluble nutrients may be considered as an ideal solution. Low-
molecular weight solutes in the medium are always in equilibrium, with both
adsorption and desorption continuously occurring. Each time a substrate is taken
up by the cell, a diffusion gradient would be established, which would
continuously deliver fresh substrate to the cell. Therefore, direct substrate
transport and diffusion effects may reduce the advantage of attachment in S
toward soluble and simple substrates, resulting in slightly different growth,
compared to L cells.
The diffusion effect would be less if the rate of diffusion is lower than the rate of
nutrient utilization. This may occur at a very low concentration of substrate
(Marshall et al. 1971, Fletcher 1991). It has been demonstrated using computer-

134
enhanced microscopy that for surface-attached bacteria, the growth rate increased
with laminar flow velocity at a low concentration (0.01 %) of glucose, but no
relationship was observed at high glucose concentrations (0.1 %) (Fletcher 1991).
The diffusion gradient may be considered as the laminar flow. It has also been
reported for marine pseudomonads that attachment was favoured at a carbon
source (glucose) concentration of 7 mg/l. Attachment was reduced at higher levels
of 14 and 21 mg/l, and completely inhibited at 30 and 70 mg/l (Marshall et al.
1971, Fletcher 1980b). The results presented in this thesis show that S cells tended
to grow slightly faster than L cells. However, the difference was not statistically
significant. The concentration of carbon source that was used in the experiment
may be too high. As low as 0.01 % substrate concentration may be required to see
a significant difference between the growth of S and L cells (Marshall et al. 1971,
Fletcher 1991, Leigh and Coplin 1992). However, at this low concentration,
measurement of cell growth by OD or total protein could not be used, due to the
low cell growth. Cell growth should be monitored using a more sensitive method.
In addition, another aim of this chapter was to find a substrate that could
emphasize the difference between S and L variants. Such a substrate could be
used for a selective medium in later genetic experiments (Chapter 7). Therefore,
the substrate concentration studied was within the range for medium components.
Preliminary studies were also carried out at substrate concentrations as low as 0.1
% (1 g/l). Although the difference between S and L was greater (data not shown),
it was still not statistically significant. This concentration of substrate may still be
too high compared to the concentration that was used by Marshall et al. 1971
(7 mg/l).

135
In a few cases, attached cells had higher activity than free cells, even at high
concentrations of soluble low-molecular weight substrates, such as sugars, amino
acids, fatty acids or carbon substrates (Kjeleberg et al. 1982, Fletcher 1985,
Gordon et al. 1983, Morisaki 1983, Fletcher 1986), and effects were monitored
using various type of measurements such as growth or cell number, respiration of
carbon substrate or heat production. In such cases, the rate of cell uptake for the
specific substrate may have been very much higher than the rate of diffusion, and
the effect of attachment could therefore still be observed. This may be the case for
the casein experiment, where attached cells (S) seemed to grow faster. The
nitrogen (casein) uptake may have been greater than the rate of diffusion, and the
effect of attachment could therefore still be observed. On the other hand, the slight
difference in growth of S and L variants at a high concentration of other substrates
(carbon source) may suggest that the rate of their uptake for soluble substrates that
were used in the experiment was lower than the rate of diffusion.
Microbial adhesion has been suggested to a have significant effect on nutrient
depletion. Another approach, by treating the cell under starvation conditions prior
to inoculation has been reported by Doran and Bailey (1986, 1987). By
monitoring the changes in intracellular NADH using fluorescence
spectrophotometry, it was found that when Saccharomyces cerevisiae was first
starved and then provided with glucose (3.6-89 mM), the immobilized cells had 5-
6 times more storage material than suspended cells. Similar studies have been
reported by Galazzo et al. (1987), using NMR to monitor intracellular
components of S. cerevisiae. In contrast to this experiment, growing B.
fibrisolvens in BHI medium prior to defined medium meant that the cells were in

136
a condition of excess rather than starvation. Secondly, washing with basal
medium (medium containing all components except the carbon or nitrogen
source) involved holding the cells under essentially a starvation regime. This was
reflected by a longer lag phase of washed cells compared to unwashed cells before
establishment of logarithmic growth. For growth curve comparison, a longer
period in minimal medium may be required before transfer to rich medium in
order to observe the effect of starvation. Further studies are required to explore
this possibility.
The diffusion effect would be less for complex soluble substrates (starch), since
the substrate is not transported directly into the cell and must be hydrolyzed by
extracellular enzymes. It is conceivable that bacterial attachment could promote
access of bacterial enzymes to this macromolecular substrate, which would
enhance bacterial access to nutrient. However, during degradation of the complex
substrate, some readily utilizable low-molecular-weight substrates may be
released to the medium. It has been pointed out that in such cases, cells tend to
assimilate them as rapidly as they are generated, regardless of the presence of
complex substrates (Fletcher 1991). Therefore, the difference in S and L growth in
starch that was obtained in this experiment was still not show significance due to
the presence of low-molecular-weight intermediates during starch degradation.
For insoluble complex substrates (xylan and cellulose), diffusion effects are not
likely to occur. This may explain the difference in growth rate of B. fibrisolvens S
and L cells in xylan compared to the soluble carbon sources. Unfortunately the
growth in cellulose was too low to be used for comparison.

137
Cell mobility is another factor that should be taken into account, since it could
facilitate attachment by increasing the number of bacterial collisions with
substratum, and therefore increase the statistical probability of attachment
(Fletcher 1980a,b). An attached cell would be less mobile than an unattached cell,
and this could be a disadvantage for S cells growing on soluble substrates,
compared to L cells. This should result in better growth of the L cells. However,
during the measurements (OD 600 nm or total protein estimation) the cultures
were shaken to make them as homogeneous as possible. This meant increasing the
effective mobility of S cells, possibly eliminating any difference. The shaking
effect could be avoided by comparing growth over a fixed period of time without
disturbance. With insoluble substrates, the mobility factor may not be as
important as with soluble substrates, since the substrate was not distributed evenly
in all parts of the medium.
For enzymatic activities, lack of cell mobility or substrate-diffusion effects may
affect the experimental conditions. These measurements may therefore be better
than growth comparisons by emphasizing differences between S and L variants.
However, the results from enzymatic proteolytic assays showed that the polymer-
associated protein was the most active. This confirms previous reports that
proteolytic activity of B. fibrisolvens was associated with high molecular weight
EP (Cotta and Hespell 1986). In a living cell, the distribution of EP-associated
proteins to the surrounding environment may be via secretion from the cell, but
under enzyme assay conditions, the migration of EP-associated proteins would
only depend on diffusion. The association of EP-protein may become a size
barrier for the protein complexes to diffuse within agar, therefore resulting in no

138
difference in proteolytic activity between S and L cells. EP-protein association has
also been reported to affect protein migration in PAGE (Cotta and Hespell 1986).
However, the difference between these two variants may not be in their
proteolytic activity. In addition, a comparison of protein profiles (Chapter 3)
indicated that most of the extracellular proteins were EP associated, and that there
were no significant differences between S and L secreted or EP-associated
proteins. Possibly proteolytic, xylanolytic and cellulolytic enzymes of B.
fibrisolvens E14 may all be EP associated, which would explain why there was no
significant difference in xylanolytic and CMCase levels between S and L variants.
Glycanase acivity in R. albus SY3 have been reported to be 5-10 fold higher than
that of the adhesion-defective mutant (Miron et al. 2001). However, the enzyme
seemed not to be firmly associated with EP or other extracellular structures.
In conclusion, under these experimental conditions, the S phenotype appeared to
have little impact on carbon or nitrogen utilization, compared with the L variant.