comparative analysis of nutrition policies in the who ... · comparative analysis of nutrition...
TRANSCRIPT

W O R L D H E A L T H O R G A N I Z A T I O N • R E G I O N A L O F F I C E F O R E U R O P E Scherfigsvej 8, DK-2100 Copenhagen Ø, Denmark Telephone: +45 39 17 17 17 Fax: +45 39 17 18 18
Electronic mail: [email protected] World Wide Web address: http://www.euro.who.int
EUR/06/5062700/BD/2 25 August 2006
61300
ORIGINAL: ENGLISH
Comparative analysis of nutrition policies in the WHO European Region
A comparative analysis of nutrition policies and plans of action in WHO European
Member States
May 2006

ABSTRACT
In September 2000, the WHO Regional Committee for Europe, in which all 51 Member States of the WHO European Region were represented, endorsed the First Action Plan for Food and Nutrition Policy, WHO European Region 2000–2005. The Action Plan stresses the need to develop food and nutrition policies. The WHO European Region evaluated the developments of national policies in three different surveys in 1994–1995, 1998–1999, 2003 and 2005. This report presents mainly the results from the surveys undertaken in 2003 and 2005 but also the trends since 1994–1995. The number of national documents containing nutrition, advisory and administrative structures increased, indicating that food and nutrition policies have become part of the public health policy agenda. Nutrition-related diseases are still responsible for a large part of the disease burden in the Region, and implementing nutrition policies still represents a major challenge.
Keywords
COMPARATIVE STUDY FOOD AND NUTRITION POLICIES – trends NUTRITION SURVEYS NATIONAL HEALTH PROGRAMS PROGRAM EVALUATION EUROPE EUROPE, EASTERN EUROPE, SOUTHERN ASIA, CENTRAL BALTIC STATES COMMONWEALTH OF INDEPENDENT STATES EUR/05/5046064
Address requests about publications of the WHO Regional Office for Europe to: Publications WHO Regional Office for Europe Scherfigsvej 8 DK-2100 Copenhagen Ø, Denmark Alternatively, complete an online request form for documentation, health information, or for permission to quote or translate, on the WHO/Europe web site at http://www.euro.who.int/pubrequest.
© World Health Organization 2006
All rights reserved. The Regional Office for Europe of the World Health Organization welcomes requests for permission to reproduce or translate its publications, in part or in full.
The designations employed and the presentation of the material in this publication do not imply the expression of any opinion whatsoever on the part of the World Health Organization concerning the legal status of any country, territory, city or area or of its authorities, or concerning the delimitation of its frontiers or boundaries. Where the designation “country or area” appears in the headings of tables, it covers countries, territories, cities, or areas. Dotted lines on maps represent approximate border lines for which there may not yet be full agreement.
The mention of specific companies or of certain manufacturers’ products does not imply that they are endorsed or recommended by the World Health Organization in preference to others of a similar nature that are not mentioned. Errors and omissions excepted, the names of proprietary products are distinguished by initial capital letters.
The World Health Organization does not warrant that the information contained in this publication is complete and correct and shall not be liable for any damages incurred as a result of its use. The views expressed by authors or editors do not necessarily represent the decisions or the stated policy of the World Health Organization.

Comparative analysis of nutrition policies in the WHO European Region page i
CONTENTS
Page
Acknowledgements ................................................................................................................. iv
Abbreviations .......................................................................................................................... v
Summary ................................................................................................................................ 1
Introduction ............................................................................................................................ 2
Food and nutrition policy in the WHO European Region......................................................... 2
Aim of this report .............................................................................................................. 3
Method of comparative analysis .......................................................................................... 3
Analysis of national nutrition policies.......................................................................................... 5
National policy documents concerned with nutrition.............................................................. 5
Approaches of the national policies ................................................................................... 13 Priorities in the national policy documents ..................................................................... 13
Institutional capacity ....................................................................................................... 14 Advisory bodies .......................................................................................................... 14 Administrative structures for implementation ................................................................. 16 Intersectoral collaboration ........................................................................................... 18
Analysis of nutritional status and nutritional risk factors ...................................................... 19 Dietary intake data...................................................................................................... 19 Breastfeeding ............................................................................................................. 22 Macronutrient intake ................................................................................................... 23 Fruit and vegetable intake ........................................................................................... 25 Nutritional status ........................................................................................................ 28 Micronutrient status .................................................................................................... 31
Food and nutrition policy tools.......................................................................................... 38 Dietary reference values .............................................................................................. 38 Food-based dietary guidelines ...................................................................................... 38
Analysis of progress since 1994............................................................................................... 41
How national nutrition policies reflect the first action plan for food and nutrition policy ................. 44
Strategic priority 1 – food safety ....................................................................................... 44
Strategic priority 2 – nutrition........................................................................................... 46 Feeding of infants and young children........................................................................... 46 Obesity ...................................................................................................................... 47 Chronic noncommunicable diseases .............................................................................. 48 Micronutrient deficiencies ............................................................................................ 49
Strategic priority 3 – sustainable food supply ..................................................................... 50
Implementation tools....................................................................................................... 50 Advisory, coordination and implementation structures .................................................... 50 Intersectoral policy ..................................................................................................... 52 Partnerships at the local, national and European levels ................................................... 54 Monitoring and evaluation............................................................................................ 55 Research.................................................................................................................... 59 Training of health staff ................................................................................................ 61

Comparative analysis of nutrition policies in the WHO European Region page ii
Conclusions and recommendations .......................................................................................... 63
References............................................................................................................................ 65
Web addresses to national policy documents containing food and nutrition policy ........................ 71
Annex 1. Activities of the WHO Regional Office for Europe related to food and nutrition, 2000–2005 ....................................................................................................... 73
Annex 2. Questionnaire for WHO European Member States on food and nutrition policies ............ 77
Annex 3. Definition of breastfeeding categories ........................................................................ 93
List of Figures
Fig. 1. Policy documents on food and nutrition policies in countries in the WHO European Region according to the body responsible for adoption..................................6
Fig. 2. Priority action areas in national nutrition policies ............................................................. 13
Fig. 3. Reasons for ineffective implementation structures for food and nutrition policies................ 16
Fig. 4. Collaboration of countries in the WHO European Region with various stakeholders on food and nutrition policies........................................................................................... 18
Fig. 5. Methods of dietary assessment among adults in countries in the WHO European Region ................................................................................................... 20
Fig. 6. Changes countries in the WHO European Region reported in the proportion of energy intake derived from fat......................................................................................... 24
Fig. 7. Changes countries in the WHO European Region reported in the proportion of energy intake derived from protein .................................................................................. 24
Fig. 8. Changes countries in the WHO European Region reported in the proportion of energy intake derived from carbohydrate.......................................................................... 25
Fig. 9. Change countries in the WHO European Region reported in daily fruit and vegetable consumption ................................................................................................... 27
Fig. 10. Iodine deficiency disorder (IDD) in countries in the WHO European Region ..................... 32
Fig. 11. Interventions against iodine deficiency disorders (IDD) in countries in the WHO European Region ................................................................................................... 32
Fig. 12. Iron deficiency anaemia interventions in countries in the WHO European Region.............. 36
Fig. 13. Countries in the WHO European Region with a policy document including food and nutrition........................................................................................................... 41
Fig. 15. Advisory bodies on food and nutrition in countries in the WHO European Region.............. 42
Fig. 16. Dietary reference values in countries in the WHO European Region................................. 42
Fig. 17. Food-based dietary guidelines in countries in the WHO European Region......................... 42

Comparative analysis of nutrition policies in the WHO European Region page iii
List of Tables
Table 1. Member States of the WHO European Region and the categories of countries used in this report ............................................................................................................4
Table 2. National policy documents of countries in the WHO European Region that contain food and nutrition policies......................................................................................7
Table 3. Advisory bodies on food and nutrition policy in the countries of the WHO European Region ................................................................................................... 14
Table 4. Administrative structures for implementation of food and nutrition policies...................... 16
Table 5. Methods and dates of the latest dietary intake surveys among specific age groups in countries in the WHO European Region........................................................ 20
Table 6. Percentage of infants breastfeeding exclusively at 1, 3 and 6 months in countries in the WHO European Region ............................................................................ 22
Table 7. Fruit and vegetable intake among adults in countries in the WHO European Region......... 26
Table 8. Overweight and obesity among adult men and women in countries in the WHO European Region ................................................................................................... 28
Table 9. Time interval of weight and height assessment by age group in countries in the WHO European Region ................................................................................................... 30
Table 10. Iodine deficiency disorders (IDD) and interventions in countries in the WHO European Region ................................................................................................... 33
Table 11. Prevalence of iron deficiency anaemia in countries in the WHO European Region........... 34
Table 12. Vitamin A deficiency and interventions in countries in the WHO European Region .......... 36
Table 13. Food-based dietary guidelines in countries in the WHO European Region...................... 39
List of Boxes
Box 1. Examples of mechanisms for coordinating food and nutrition in countries in the WHO European Region ................................................................................................... 52
Box 2. Examples of mobilizing stakeholders within food and nutrition in countries in the WHO European Region.............................................................................................. 54
Box 3. Examples of partnerships within food and nutrition in countries in the WHO European Region ................................................................................................... 55
Box 4. Examples of monitoring systems for food and nutrition policy in countries in the WHO European Region ................................................................................................... 58
Box 5. Ireland’s efforts to promote food safety ......................................................................... 59
Box 6. Example of economic evaluation of national food and nutrition policy................................ 60
Box 7. Example of professional training interventions in food and nutrition .................................. 63
Box 8. Elements for successful implementation of national food and nutrition action plans ............ 64

Comparative analysis of nutrition policies in the WHO European Region page iv
Acknowledgements
Ursula Trübswasser, Francesco Branca and Cristina Tirado wrote this document. The authors thank Aileen Robertson for initiating the survey in 2003 and for supportive comments and reviews during the development of the current version of the comparative analysis. We also acknowledge the work of Rebecca Goldsmith and Dorit Nitzan Kaluski for the initial data entry and analysis and Zuzana Brazdova, Iveta Pudule and Victor Tutelyan for the initial evaluation and presentation of the data. Adriano Cattaneo, Jill Farrington, Tatyana Kamardina, Ursula O’Dwyer, Stefka Petrova, Astrid Potz, Antonia Trichopoulou, Robizon Tsiklauri, Alma van der Greft, Trudy Wijnhoven and Ute Winkler provided valuable comments and additions. We extend sincere thanks to country counterparts for submitting information on food and nutrition policies as well as their policy documents and for allowing this work to be carried out. We thank David Breuer for text editing.

Comparative analysis of nutrition policies in the WHO European Region page v
Abbreviations
BMI body mass index CAR central Asian Republics CCEE countries of central and eastern Europe CINDI countrywide integrated noncommunicable disease intervention CIS Commonwealth of independent States DR dietary record EU European Union FAO Food and Agriculture Organization of the United Nations FBS food balance sheet FFQ food frequency questionnaire GEMS/Food Global Environmental Monitoring System for Food GSS Global Salmonella Surveillance HACCP hazard analysis and critical control point HBS household budget survey MICS multi-indicator cluster survey NGO nongovernmental organization NICE National Institute for Clinical Excellence OPAL Operational Programs for Analytical Laboratories UNEP United Nations Environment Programme UNICEF United Nations Children’s Fund WHO World Health Organization


Comparative analysis of nutrition policies in the WHO European Region page 1
Summary
In September 2000, the WHO Regional Committee for Europe, in which all Member States of the WHO European Region are represented, endorsed the First Action Plan for Food and Nutrition Policy for the WHO European Region, 2000–2005 (1). The First Action Plan for Food and Nutrition Policy stresses the need to develop food and nutrition policies that protect and promote health and reduce the burden of food-related diseases. The nutrition and food security programme and the food safety programme of the WHO Regional Office for Europe have been working to raise the awareness of Member States on food and nutrition policies and have been supporting the development of sustainable food and nutrition policies. Food and nutrition policies were previously evaluated in 1994 and 1998. This report presents the data collected in 2003 and 2005 and an analysis of the nutritional status and nutritional factors (dietary intake, body mass index and micronutrients) in the Member States and their achievements in food and nutrition policy. The developments in the past decade are also analysed. Most Member States have available a final policy document on nutrition; some countries are revising their documents or preparing new ones. Countries without a specific document have various nutrition-related programmes: 37 countries have a final document; 8 countries have a draft document or a document under preparation; and 3 countries have no document. Nutrition policies can either be outlined in separate documents or be part of an overarching strategy to tackle public health or environmental issues. Specific issues, such as micronutrient deficiencies or obesity, are sometimes the main objective of documents on food and nutrition policies. Action areas include infant feeding, food security, food safety, nutrition, physical activity and reducing obesity. Implementation tools include establishing advisory bodies, food-based dietary guidelines, public nutrition education and health promotion and monitoring and surveillance systems. Countries with national institutions advising the government appear to be the most effective in developing and implementing policies. In 2005, 37 countries had such an advisory body. More than half the countries have a separate institution with a coordinating role, but not all the institutions appear to be effective, mainly due to lack of political commitment, financial resources and coordination. Five countries plan to set up an administrative structure. Ministries collaborate in 34 countries, whereas 5 countries have no intersectoral collaboration. Governments of 37 countries meet regularly with nongovernmental organizations (NGOs), and 34 governments collaborate with the food industry. Twenty-four countries work intersectorally, involving different ministries, the private sector and nongovernmental organizations. Food and nutrition policies in the European Region appear to have developed successfully in the past decade, with a noticeable improvement since the WHO Regional Office for Europe launched the First Action Plan for Food and Nutrition Policy. The number of national policy documents focusing on or containing food and nutrition policies, including documents not yet adopted or under preparation, increased from 24 in 1994 to 45 in 2005 (2). Similarly, the number of administrative structures to implement the food and nutrition policies increased from 19 in 1994 to 40 in 2005. Food-based dietary guidelines are now in place in at least two thirds of the countries, twice the number of a decade earlier. Countries differ greatly in implementation. Some countries already have extensive experience with food and nutrition policies, whereas others are just at the beginning of the process. Implementation also seems to be a major challenge for most of the countries due to lack of funds, political commitment, coordination or expertise. Regarding funds, it is important to know whether a budget is

Comparative analysis of nutrition policies in the WHO European Region page 2
allocated at all and if so, whether this budget is sufficient and the required combination of resources (human, time and financial resources) is available. Despite the progress in nutrition policy, most countries are still facing nutrition-related problems. The situation analysis indicates that most countries in the European Region have not achieved nutrition and dietary goals. One reason is linked to the guiding principles of the action plans. The improvement of lifestyle has been mainly considered the responsibility of the individual, whereas it should now be acknowledged that recommendations for healthier nutrition and more physical activity need to be matched by action that makes the environment supportive of healthy lifestyles. A Second Action Plan for Food and Nutrition Policies for the WHO European Region is currently being drafted. The Plan will highlight the current challenges and establish common quantitative goals and action guidelines, dealing with both the supply and the demand side. Region-wide action is required to give adequate momentum to the action.
Introduction
Food and nutrition policy in the WHO European Region
After the Second World War, a main concern in Europe was to increase the supply of food, especially animal products. This target was achieved by means of improved agricultural technology and government financial support through subsidies and price regulation, and now production exceeds the needs and a surplus of stocks of butter, meat and milk is present. The European Communities developed a Common Agricultural Policy (CAP) based on the same principles. Concern about chronic noncommunicable diseases has grown since the mid-1960s, as they have been increasingly found to be responsible for the largest proportion of the total disease burden. Lifestyle factors have been found to be among the main determinants. It has been recognized that these food policy decisions affect the diet, and a need for integrated nutrition policies began to evolve. The 1992 World Declaration on Nutrition and Plan of Action on Nutrition provided the necessary global political framework as well as technical guidelines for the further development of nutrition policies (3). The Nordic countries were the first in the WHO European Region to establish nutrition policies. Norway had its first approved food and nutrition policies already in 1975. Denmark, Finland, Iceland and later the Netherlands and Sweden made early attempts to achieve political commitment on nutritional issues, establishing nutrition policies in the 1980s and the early 1990s. Several northern European countries have a long history of the public sector taking responsibility for nutrition programmes aimed at dietary change, whereas in other countries in the Region the development of nutrition policies has often been hampered by a lack of political will, dictated either by various ideas on the role of government in the economy or by various interest groups within the agriculture and food system. The WHO Regional Office for Europe developed, in collaboration with the network of national nutrition counterparts, the First Action Plan for Food and Nutrition Policy for the WHO European Region, 2000–2005, which could be used as a blueprint for the development of national nutrition plans. The First Action Plan for Food and Nutrition Policy stresses the need to develop food and nutrition policies that protect and promote health and reduce the burden of food-related diseases. It provides a

Comparative analysis of nutrition policies in the WHO European Region page 3
framework that consists of (a) a nutrition strategy; (b) a food safety strategy; and (c) a strategy on a sustainable food supply (food security). In September 2000 at the 50th session of the WHO Regional Committee for Europe, the Member States endorsed resolution EUR/RC50/R8 on the First Action Plan for Food and Nutrition Policy. The nutrition and food security programme and the food safety programme of the WHO Regional Office for Europe have been working to raise awareness of Member States on food and nutrition policies and have been supporting the development of sustainable food and nutrition policies. To assist Member States in developing and implementing national food and nutrition action plans, WHO developed a three-day training module Intersectoral Food and Nutrition Policy Development – a Training Manual for Decision-makers. This training module was implemented in the subregions south-eastern Europe, the Baltic countries, the Nordic countries and southern Europe. A total of 28 countries participated in 9 training workshops in which Member States were encouraged to network and share experiences during the development of national action plans (Annex 1). The food safety programme has developed training material for policy-makers on the development of intersectoral national food safety strategies within the framework of the First Action Plan for Food and Nutrition Policy. These national intersectoral workshops have been implemented in 15 Member States in the European Region. At the level of the European Union (EU), a European Council resolution on health and nutrition in 2000 was a major step, emphasizing the need for monitoring nutritional status, expanding nutrition research, improving the nutritional knowledge of health professionals, promoting dietary guidelines and providing better nutrition information (4). In 2003, the European Network for Public Health Nutrition was founded, coordinating and integrating ongoing work in monitoring, intervention and training (5). Recognizing the emerging threat of obesity in Europe, the European Platform for Action on Diet, Physical Activity and Health was launched in 2005 to tackle the EU obesity problem on a multisectoral level (6). In December 2005 a green paper on promoting healthy diets and physical activity was launched, setting the basis for a wide consultation, with a view to gathering information on reducing obesity levels to complement, support and coordinate existing national measures (7). Recognizing the still unresolved issue of nutrition-related chronic disease burden, the Fifty-seventh World Health Assembly in 2004 endorsed the WHO global strategy on diet, physical activity and health (8). The objective of the strategy is to provide a basis for multisectoral action to reduce the risk factors for noncommunicable diseases and to encourage the development of national policies to improve nutrition and physical activity.
Aim of this report
The main purpose of this report is to evaluate the progress of food and nutrition policies in Europe and to assess the impact of the First Action Plan for Food and Nutrition Policy for the WHO European Region. The report is intended to provide Member States with a tool to evaluate their own action in this area, including achievements, unresolved issues and barriers for implementation, to exchange experiences with other countries, as well as to indicate strategic points that should be addressed by the forthcoming Second Action Plan for Food and Nutrition Policy.
Method of comparative analysis
The nutrition and food security programme of the WHO Regional Office for Europe conducted surveys on national food and nutrition policies in European Member States in 1994–1995, 1998–1999 and 2003 by sending questionnaires to the national nutrition counterparts. In 1994–1995, 33 of the 50 Member States responded to the questionnaire; in 1998–1999, 40 of 50 countries responded.

Comparative analysis of nutrition policies in the WHO European Region page 4
In the latest survey (April 2003), questionnaires were sent to 51 Member States and 47 responses were obtained. A preliminary analysis of the responses was presented at the Conference of the Federation of European Nutrition Societies in Rome, Italy in October 2003. In December 2005, Member States were asked to provide updates on the 2003 responses. Eighteen countries responded by sending the questionnaire (Annex 2) and/or comments on the draft document, and an additional questionnaire was obtained from Cyprus, which had joined the WHO European Region in the mean time. Additional information was sought on various web sites of health ministries, recent publications and databases between August 2005 and January 2006. Details about the priorities, themes and interventions of national policies were obtained from 25 national policy papers available in English. In addition, the WHO noncommunicable diseases programme in the European Region conducted a survey on national chronic disease prevention and control starting in July 2005. Information on new legislation and policies on food and nutrition was obtained on 29 countries that had returned the questionnaire by January 2006. WHO European Member States were grouped into eight geographic subregions to facilitate comparative analysis and interpretation: countries in south-eastern Europe, Baltic states, central Asian republics (CAR), countries in central and eastern Europe (CCEE), countries in the Commonwealth of Independent States excluding CAR (CIS), Nordic countries, southern European countries and western European countries (Table 1).
Table 1. Member States of the WHO European Region and the categories of countries used in this report
South-eastern Europe
Baltic countries
Central Asian republics (CAR)
Countries of central and eastern Europe (CCEE)
Western Europe
Southern Europe
Commonwealth of Independent States (CIS)
Nordic
Albania
Bosnia and Herzegovina
Croatia
Serbia and Montenegro
Slovenia
The former Yugoslav Republic of Macedonia
Estonia
Latvia
Lithuania
Kazakhstan
Kyrgyzstan
Tajikistan
Turkmenistan
Uzbekistan
Bulgaria
Czech Republic
Hungary
Poland
Romania
Slovakia
Austria
Belgium
France
Germany
Ireland
Luxembourg
Netherlands
Switzerland
United Kingdom
Andorra
Cyprus
Greece
Israel
Italy
Malta
Monaco
Portugal
San Marino
Spain
Turkey
Azerbaijan
Armenia
Belarus
Georgia
Republic of Moldova
Russian Federation
Ukraine
Denmark
Finland
Iceland
Norway
Sweden

Comparative analysis of nutrition policies in the WHO European Region page 5
Analysis of national nutrition policies
National policy documents concerned with nutrition
The First Action Plan for Food and Nutrition Policy stressed the need to develop food and nutrition policies that protect and promote health and reduce the burden of nutrition-related disease while contributing to socioeconomic development and a sustainable environment. Political commitment to nutrition action plans gives public health experts an important opportunity to advocate, at both the national and European levels, a food and nutrition policy that explicitly promotes health. A written policy brings the following benefits (9):
• sets out a clear statement of intent, legitimizes action and provides a firm foundation for food and nutrition initiatives;
• creates a framework for action for the health ministry and other sectors;
• removes any possibility of misinterpreting or misunderstanding the government position on food and nutrition and any differences in interpretation between the sectors involved;
• provides a corporate document to which individuals and organizations can refer;
• demonstrates commitment to the public health of all the citizens; and
• justifies the allocation of resources to national plans and programmes on food and nutrition. The adoption of a food and nutrition policy by the government or by the parliament should provide the basis of political commitment and enable health practitioners to implement the policy and transfer it into action. However, the process of adoption varies in the Member States as, in some countries, policies are implemented already and actions are taken without a formal adoption process. Twenty-nine countries stated official institutions that adopted the national documents; other countries, however, appear to have final documents that have not been adopted. Fig. 1 illustrates the number of documents that underwent a final adoption procedure and which level countries have chosen for the adoption.

Comparative analysis of nutrition policies in the WHO European Region page 6
Fig. 1. Policy documents on food and nutrition policies in countries in the WHO European Region according to the body responsible for adoption
0
5
10
15
20
25
30
Government Parliament Health ministry (or
other ministries)
Number of documents adopted
In 2003, 25 countries stated that they have a final policy document on food and nutrition. The update carried out in December 2005 showed that 37 countries now have a final policy document on food and nutrition (Table 2). In 1998–1999, 28 countries indicated that they have a national policy document, but some countries revised these or created new ones. In the recent survey, eight countries responded that the policy document was being prepared. In total, 45 countries have a policy document that has been adopted or finalized but not adopted or is under preparation. Some countries, such as Azerbaijan, Kyrgyzstan and Tajikistan, reported not having a separate nutrition action plan at all or one under preparation but have several different programmes, such as on preventing iodine deficiency disorders (IDD) and iron-deficiency anaemia. Azerbaijan, Luxembourg and Tajikistan have an additional programme for promoting breastfeeding. Since 2000, 23 policy documents have been newly adopted or prepared or are being revised. Very recently, Bulgaria’s and Slovenia’s nutrition polices were adopted and Belgium’s and Georgia’s action plans were finalized. Sweden published background material to the action plan for healthy dietary habits and increased physical activity in 2005, Uzbekistan finalized guidance on a plan of action for healthy nutrition in 2005 and the United Kingdom published the policy document Choosing health? Choosing a better
diet in 2004. In the same year, the Governments of Lithuania and The former Yugoslav Republic of Macedonia approved national strategies on food and nutrition. The action plans of Hungary and Latvia were approved in 2003. Serbia and Montenegro published a document in 2003 on health for all and, in addition, a working group in the Republic of Serbia is developing a nutrition action plan. Croatia and Ireland are currently developing nutrition policy documents. Only three countries appear to completely lack a policy document on food and nutrition.

Comparative analysis of nutrition policies in the WHO European Region page 7
Table 2. National policy documents of countries in the WHO European Region that contain food and nutrition policies
Member State
Name of policy document or document in which this food and nutrition policy
statement is contained
Status of the
document
Name of body that adopted the document and date of adoption or
finalization
Ministries or government bodies and other institutions mentioned as partners to the nutrition policy (lead agency in bold)
South-eastern Europe Analyses of the Situation and National Action Plan on Food and Nutrition for Albania 2003–2008
Draft
Albania Towards a healthy country with healthy people – Public Health and Health Promotion Strategy 2002–2010
Draft
Ministry of Health, Ministry of Agriculture and Food, Ministry of Economy, Ministry of Environment, Ministry of Work and Social Affairs, Ministry of Management of Territory and Tourism, United Nations Children’s Fund (UNICEF), Institute for Statistics (INSTAT)
Federation of Bosnia and Herzegovina: Food and Nutrition Policy
Draft Ministry of Health, Ministry of Agriculture and Water, Public Health Institute, academic institutions Bosnia and
Herzegovina Republic of Srpska
No information
Croatia Croatian Food and Nutrition Policy (CFNP)
Final Ministry of Health and Social Welfare, 1999
Ministry of Health and Social Welfare, Ministry of Agriculture, Academy of Medical Science
Serbia and Montenegro
Republic of Serbia: Nutrition Action Plan Under preparation
Ministry of Health, Ministry of Agriculture, Forestry and Water Management
National Action Plan for Physical Activity Draft Planned, 2006
National Programme of Food and Nutrition Policy 2005–2010
Final National Assembly of the Republic of Slovenia, 2005 Slovenia
National programme of health protection and promotion
Final Government, 2000
Ministry of Health, Ministry of Agriculture, Forestry and Food, Ministry of Education, Ministry of Finance, Ministry of Labour, Family and Social Affairs, Ministry of Science, Ministry of Environment, Chamber of Commerce, governmental service for regional policy
Action Plan for Food and Nutrition Final Government, 2004 Agricultural Development Strategy in the Republic of Macedonia to 2005
Final Government, 2001 The former Yugoslav Republic of Macedonia
National Environmental Health Action Plan of the Republic of Macedonia
Final Government, 1999
Ministry of Health, Ministry of Agriculture, Ministry of Environment
Baltic states
National strategy for prevention of cardiovascular diseases 2005–2020
Final 2005 Estonia
Healthy Nutrition Action Plan Final 2002 Ministry of Social Affairs
Latvia Healthy nutrition 2003–2013 Final Cabinet of Ministers, 2003 Ministry of Health, Ministry of Agriculture, Ministry of Education
National Food and Nutrition Strategy and Action Plan
Final Government, 2004 Lithuania
Law on Food Final Parliament, 2003
Ministry of Health, Ministry of Agriculture, Ministry of Economy, Ministry of Education and Science, State Food and Veterinary Service, universities, Institute of Agrarian Economy, WHO
CAR
Kazakhstan Conception on Healthy Lifestyle and Healthy Nutrition
Final Government, 1999 Ministry of Public Health, Ministry of Education and Science, Academy of Nutrition
Kyrgyzstan National policy on foodstuff security Final Government, 1999 Ministry of Agriculture, Water and Processing Industry, Ministry of Public Health, Ministry of Labour and Social Welfare, State Committee for Statistics, Ministry of Finance, Ministry of Justice

Comparative analysis of nutrition policies in the WHO European Region page 8
Member State
Name of policy document or document in which this food and nutrition policy
statement is contained
Status of the
document
Name of body that adopted the document and date of adoption or
finalization
Ministries or government bodies and other institutions mentioned as partners to the nutrition policy (lead agency in bold)
Tajikistan The National Policy on Healthy Nutrition of the Tajikistan Republic’s Population
Under preparation
Uzbekistan Guidance on a plan of action for healthy nutrition in the Republic of Uzbekistan until the year 2010
Final 2005 Ministry of Economy, Ministry of Finance, food industry, Ministry of Health, Ministry of Agriculture and Water Resources, tax and customs committees
CCEE
National Food and Nutrition Action Plan 2005–2010
Final Council of Ministers, 2005
National Food Safety Strategy Final Council of Ministers, 2001 Bulgaria
National Action Plan for Environmental Health
Final Council of Ministers, 1988
Ministry of Health, Ministry of Agriculture and Forestry, Ministry of Economics, Ministry of Education and Science, Ministry of Labour and Social Policy, National Center of Public Health Protection, National Centre of Radiobiology and Radiation Protection, National Diagnostic Scientific Research, Veterinary Medical Institute, National Plant Protection Service, Central Laboratory for Control of Pesticides, Nitrates, Heavy Metals and Fertilizers, regional inspectorates for control and protection of public health
National Action Plan on counteracting obesity
Under preparation
Long-term Program to Improve the Health of the Population of the Czech Republic
Final 2002
Ministry of Health, Ministry of Agriculture, Ministry of Interior, Ministry of Education, Youth and Sports, Ministry of Regional Development, specialist institutions, health insurance companies, non-profit organizations, universities Czech
Republic
National Health Program Final Ministry of Health, 2000 Ministry of Health
Hungary National Public Health Programme Final 2003 Ministry of Health
Poland
To improve the state of health of the population in Poland by enhancing the health quality of food and rationalizing dietary patterns
Draft National Food and Nutrition Institute
Romania National environment and health action plan (NEHAP)
Final Ministry of Health, 2002 Ministry of Health, Ministry of Agriculture, Food and Forestry, Ministry of Education
Slovakia Program for Nutrition Improvement of the Population of the Slovak Republic
Final Government, 1999 Ministry of Health, Ministry of Agriculture, Ministry of Education, Ministry of Labour and Social Welfare, Ministry of Interior, Ministry of Defence, Ministry of Finance, Ministry of Culture
CIS National Policy on Food Provision Final Government 2005
Armenia National Food Security Framework Policy Final Government, 1999
Ministry of Agriculture, Ministry of Health, Ministry of Social Welfare, Ministry of Trade and Economic Development, Ministry of Finance and Economy, Ministry of Employment and Social Issues, Ministry of Ecology
Azerbaijan No document
Health of the people: state program on the formation of healthy lifestyles among the population of the Republic of Belarus 2002–2006
Draft 1999
Belarus
Quality and safety of food raw materials and food products for human life and health
Draft National Assembly of Belarus Republic
Ministry of Public Health, Ministry of Agriculture and Foodstuffs, Ministry of Trade

Comparative analysis of nutrition policies in the WHO European Region page 9
Member State
Name of policy document or document in which this food and nutrition policy
statement is contained
Status of the
document
Name of body that adopted the document and date of adoption or
finalization
Ministries or government bodies and other institutions mentioned as partners to the nutrition policy (lead agency in bold)
Food and Nutrition Action Plan Final 2006
Elimination of iodine deficiency disorders Under preparation
Strategic Health Plan 2000–2009 Final 2000 Georgia
Consumer rights’ protection Final Parliament, 1996
Ministry of Labour, Health and Social Affairs, Ministry of Agriculture and Foodstuffs
Republic of Moldova
No document
Guidelines: Healthy nutrition: action plan for development of regional programmes in the Russian Federation
Final Government and State Duma encouraged, 2000
National Centre for Preventive Medicine, Institute of Nutrition, 7 CINDI regions: medical institutes, health administrations, NGOs
Russian Federation Concept on National Policy for Healthy
Nutrition of the Population of the Russian Federation up to the Year 2005
Final Government, 1998 Ministry of Public Health, Ministry of Industry, Science and Technology, Ministry of Agriculture, Ministry of Education, Ministry of Labour, Academy of Agricultural Sciences
Ukraine Conception of National Nutrition Policy
Draft Ministry of Public Health, Academy of Medical Science, Ministry of Agricultural Policy, Ministry of Economy, Ministry of European Integration, Ministry of Finance, Ministry of Labour and Social Welfare
Nordic countries National action plan against obesity: recommendations and perspectives
Final Government, 2003
Health for children and youth Final 2003 Denmark
Healthy throughout Life – the targets and strategies for public health policy of the Government of Denmark, 2002–2010
Final 2002
Ministry of Interior and Health and many other ministries
Action Programme for Implementing National Nutrition Recommendations
Final 2003
Finland Resolution on health-enhancing physical activity by the State Cabinet
Final 2002
Ministry of Agriculture and Forestry, Ministry of Social Affairs and Health, Ministry of Trade and Industry, Ministry of the Environment, food and nutrition research, food industry
National Health Plan Final Parliament, 2001 Iceland A Parliamentary Resolution on an Icelandic
Nutrition Policy Final
Parliament, 1989
Ministry of Health and Social Security, Ministry of Agriculture, Ministry of Fisheries, Ministry of Industry and Commerce
1. The Action Plan on Physical Activity 2005–2009: working together for physical activity
Final
2. Action plan on improved diet for 2007–2011
Planned 2006
3. Prescription for a Healthier Norway Final Parliament, 2003
Norway
4. A healthy diet for good health Final 2005
1–3. Ministry of Health and Care Services 4. National Council for Nutrition, Directorate for Health and Social Affairs

Comparative analysis of nutrition policies in the WHO European Region page 10
Member State
Name of policy document or document in which this food and nutrition policy
statement is contained
Status of the
document
Name of body that adopted the document and date of adoption or
finalization
Ministries or government bodies and other institutions mentioned as partners to the nutrition policy (lead agency in bold)
1. Background material to the action plan for healthy dietary habits and increased physical activity
Draft 2005
2. Public health objectives Final Parliament, 2003 Sweden
3. Swedish National Plan of Action for nutrition
Final Government, 1995
1. National Food Administration, Swedish National Institute of Public Health 2. Ministry of Health and Social Affairs 3. Ministry of Agriculture
Southern Europe Cyprus National Nutrition Action Plan Draft
Action plan for implementation of the national nutrition policy
Draft Planned 2006 Ministry of Health and Social Welfare
Nutrition guidelines for school canteens Draft Planned 2006 Ministry of Health and Social Welfare
Greece
Dietary guidelines for adults in Greece Final
Ministry of Health and Social Welfare, Ministry of Agriculture, Ministry of National Education and Religious Affairs, Ministry of Development, 2002
Ministry of Health and Social Welfare, Ministry of Agriculture, Ministry of National Education and Religious Affairs, Ministry of Development
Israel From safe food chain to healthy nutrition web
Final Ministry of Health, 2002 Ministry of Health
National Plan of Prevention 2005–2007 Final 2005 Italy
National Health Plan 2003–2005 Final Government, 2003 Ministry of Health
Malta Malta Food and Nutrition Policy Final Parliament (Cabinet), 1990
Ministry of Social Policy, Ministry of Health, Ministry of Agriculture
National programme against obesity 2005–2009
Final 2005 Ministry of Health, General Directorate of Health, Society for the Study of Obesity, Society for Obesity Surgery, Society of Food and Nutrition, Society of Endocrinology, Diabetes and Metabolism, Faculty of Nutrition and Food Science
Portugal
National Health Plan 2004–2010 Final 2003
Spain Spanish strategy for nutrition, physical activity and prevention of obesity (NAOS)
Final 2005 Ministry of Health and Consumer Affairs, General Directorate of Public Health, Ministry of Education and Science, Ministry of Agriculture, Fisheries and Food, food industry, medical societies
Executive summary of the working committee report for national food and nutrition strategy of Turkey and First Phase National Plan of Action for Food and Nutrition
Final 2003
State Planning Organization, Ministry of Health, Ministry of Agriculture and Rural Affairs, Ministry of National Education, State Institute of Statistics, universities, UNICEF, WHO, Food and Agriculture Organization of the United Nations (FAO), NGOs Turkey
Health for All: Goals and Strategies of Turkey
Final 2001 Ministry of Health, Prime Ministry’s related units, Ministry of Agriculture and Rural Affairs, Ministry of National Education, State Institute of Statistics, universities, UNICEF, WHO, FAO, NGOs
Western Europe
Austria Austrian strategy for sustainable development
Final Government, 2002
Federal Ministry of Agriculture, Forestry, Environment and Water Management, Federal Ministry of Health and Women, Federal Ministry of Social Security and Generations, Federal Ministry of Education, Science and Culture, Federal Ministry of Finance

Comparative analysis of nutrition policies in the WHO European Region page 11
Member State
Name of policy document or document in which this food and nutrition policy
statement is contained
Status of the
document
Name of body that adopted the document and date of adoption or
finalization
Ministries or government bodies and other institutions mentioned as partners to the nutrition policy (lead agency in bold)
Belgium National Nutrition and Health Plan Final 2006 Federal Public Service of Health, Food Chain Safety and Environment
France National Nutrition Health Programme 2001–2005
Final
Ministry of Health and Solidarity, Ministry of Agriculture and Fisheries, Ministry of Education, Ministry of Consumer Affairs, Ministry of Youth, Sports and Associations, Ministry of Research, 2001
Ministry of Health and Solidarity, Ministry of Agriculture and Fisheries, Ministry of Education, Ministry of Consumer Affairs, Ministry of Youth, Sports and Associations, Ministry of Research
Consumer Protection Policy Report Final Federal Cabinet, 2004
Action Plan on Consumer Protection Final Federal Cabinet, 2003 Federal Ministry of Food, Agriculture and Consumer Protection
Germany
Action plan to improve the nutritional status in the Federal Republic of Germany
Final 1996 Federal Ministry of Health, Federal Ministry of Food, Agriculture and Forestry
National Nutrition Policy Under preparation
Planned 2006
Obesity: the policy challenges Final Government, Department of Health and Children, 2005
Breastfeeding in Ireland – a five-year strategic action plan
Final Department of Health and Children, 2005
Ireland
National Health Promotion Strategy Final Government, 2000
Department of Health and Children, Department of Agriculture and Food, Department of Education and Science, Department of Social and Family Affairs, Department of Finance, Department of Enterprise, Trade and Employment, Department of Environment, Heritage and Local Government
Luxembourg No document
Time for sport – exercise, participate, perform
Final 2005 Ministry of Health, Welfare and Sport
Living longer in good health Final Parliament, 2003 Ministry of Health, Welfare and Sport, Ministry of Agriculture, Nature and Food Quality
Sport for all incentive in the Netherlands Final 2000 Ministry of Health, Welfare and Sport
Netherlands
The Netherlands: well nourished? Final Parliament, 1998 Ministry of Health, Welfare and Sport
Switzerland Action plan on nutrition and health: a nutrition policy for Switzerland
Final Swiss Federal Council, 2001
Federal Ministry of Health, Federal Ministry of Agriculture, Federal Ministry of Development, Federal Ministry of Civil Protection, Federal Ministry of Sport
Choosing activity: a physical activity action plan
Final 2005 United Kingdom
Choosing health? Choosing a better diet: a consultation on priorities for a food and health action plan
Final 2004 Department of Health and many other ministries involved


Comparative analysis of nutrition policies in the WHO European Region page 13
Approaches of the national policies
Food and nutrition policies can either be separate documents or be part of an overarching strategy to tackle public health or environmental issues. Specific issues, such as micronutrient deficiencies or obesity, are sometimes the main objective of food and nutrition policy documents when that specific issue catches the attention of governments and citizens. Hungary, Spain and Sweden have an action plan on lifestyles combining diet and physical activity. The national documents of Armenia and Kyrgyzstan are food policy or food security policies. Romania’s document focuses on environmental health issues and Austria’s on sustainable development. An increasing number of countries have specific strategies for counteracting obesity. Denmark developed the first action plan against obesity in 2003, followed by Spain’s strategy for nutrition, physical activity and prevention of obesity in 2004, Ireland’s strategy Obesity: the policy challenges and Portugal’s national programme against obesity in 2005. Italy also recently developed a National Plan for Prevention with a focus on obesity. The Netherlands adopted Living longer in good health in 2003, with obesity as one of the priorities. Finland, the Netherlands, Norway, Slovenia and the United Kingdom have a separate document dealing with physical activity in addition to a public health or nutrition plan. Priorities in the national policy documents
Countries were asked to name the top five priorities, objectives or targets stated in their policy document on food and nutrition. Thirty-five countries listed these priorities. At the analysis stage, the priorities were categorized into action areas and tools of implementation.
Fig. 2. Priority action areas in national nutrition policies
Action areas:
• infant feeding
• food security
• food safety
• nutrition
• physical activity recommendations
• obesity reduction. Tools of implementation:
• advisory bodies;
• food-based dietary guidelines;
• public nutrition education and health promotion;
• monitoring and surveillance systems.
All the countries mentioned specific action areas; 23 countries included improving or establishing various implementation tools. Seven countries gave priority to concerns for vulnerable groups (children, pregnant women and elderly people) or addressing social inequality. Population dietary changes such as reducing total fat intake, increasing dietary fibre and fruit and vegetable intake and decreasing micronutrient deficiency were mentioned most often. Increasing breastfeeding and reducing obesity are the planned action areas in 20 countries. Fourteen countries mentioned action on
Dietary change
25%
Infant feeding
18% Obesity
19%
Food safety
18%
Food security
13%Physical
activity
7%

Comparative analysis of nutrition policies in the WHO European Region page 14
food safety and security, including improving food quality and variety, local and sustainable food production and reducing foodborne diseases.
Institutional capacity
Advisory bodies
Countries with national coordination bodies for food and nutrition appear to be the most effective in developing and implementing policies. Such a body advises the government on developing, implementing, monitoring and evaluating nutrition policies. In some countries, they are also responsible for providing scientific advice on food and nutrition to national policy-makers. In 2005, 37 countries had advisory bodies versus 28 countries in 1998–1999 (Table 3). Policy councils have a long history in the Nordic countries. The first recorded nutrition councils were created in Norway (1937) and Finland (1954), and the Dutch Health Council dates back to 1902. In most cases the health or public health ministry finances the activities of the scientific advisory body.
Table 3. Advisory bodies on food and nutrition policy in the countries of the WHO European Region
Member State
Nutrition council, advisory structure or body responsible for providing scientific advice to national policy-makers?
Name of advisory body in English and year of establishment
Who finances this budget
South-eastern Europe
Albania
Yes National Food Board Institute of Public Health Veterinary Research Institute Food Research Institute, 1995
Government
Bosnia and Herzegovina
No
Croatia Yes Nutrition Board of the Croatian Academy for Medical
Sciences, 1993 Ministry of Science and Technology
Serbia and Montenegro
Yes Republic of Serbia: Working Group for the Preparation of the Nutrition Action Plan, 2005
Health Network Initiative
Slovenia Yes Food and Nutrition Council, 2001 Ministry of Health
The former Yugoslav Republic of Macedonia
Yes National Committee for Food and Nutrition, 2001 Ministry
Baltic states
Estonia No
Latvia Yes Nutrition Council, 2002 No public funding
Lithuania Yes Scientific Committee on Food and Nutrition, 2003 Ministry of Health
CAR
Kazakhstan Yes Republican Council on Nutrition Problems, 1995
Kyrgyzstan No
Tajikistan No
Uzbekistan Yes Department of the State Sanitary Inspectors,
Ministry of Health, 2001 Ministry of Health
CCEE
Bulgaria Yes National Food Safety Council, 2000 Ministry of Health
Czech Republic Yes National Council for Obesity, 2004; Scientific
Committee of the National Institute of Public Health, 2003
Ministry of Health
Hungary Yes Scientific Committee of the National Institute of Food
Safety and Nutrition Ministry of Health
Poland No
Romania No
Slovakia Yes National Faculty of the Public Health Institute of the
Slovak Republic, 1999 Public budget

Comparative analysis of nutrition policies in the WHO European Region page 15
Member State
Nutrition council, advisory structure or body responsible for providing scientific advice to national policy-makers?
Name of advisory body in English and year of establishment
Who finances this budget
CIS
Armenia No
Azerbaijan No
Belarus Yes Republican Research-practical Center of Hygiene
2003 Ministry of Health
Georgia Yes Working group with participating health care,
education, scientific centers and nongovernmental organizations, 2000
No public funding
Republic of Moldova
No
Russian Federation
Yes Scientific Council on Medical Problems of Nutrition, 1991
Ministry of Public Health
Ukraine No
Nordic countries
Denmark
Yes Danish Fitness and Nutrition Council, 2005 (superseding Danish Nutrition Council, 1998), Danish Institute for Food and Veterinary Research, 1998
Ministry of Food, Agriculture and Fisheries
Finland Yes National Nutrition Council, 1952
Iceland Yes Icelandic Nutrition Council, 1978 Ministry of Health and
Social Security
Norway Yes National Nutrition Council, 1946 Ministry of Health and
Care Services
Sweden Yes Expert Committee on Diet and Health, 1987,
Swedish Pediatric Committee on Nutrition, 1993 National Food Administration
Southern Europe
Cyprus Yes Food & Drug Board Ministry
Greece
Yes 1. National Nutrition Policy Committee, 2002 2. National Scientific Committee of Food Control, 2001
1. Ministry of Health and Social Welfare 2. Ministry of Development – Hellenic Food Authority
Israel Yes Food and Nutrition Committees, 1998 No public funding
Italy Yes Nutrition, Lifestyles and Health Committee, 2002
National Health Council, 1847 Ministry of Health
Malta Yes Food Safety Commission, 2002 Ministry of Health
Portugal Yes National Council for Food and Nutrition, 1980 Ministry of Health
Spain Yes Spanish Food Safety Agency, 2002
Turkey Yes Planning to establish national scientific food
authority
Western Europe
Austria Yes Austrian Agency for Health and Food Safety, 2002
Belgium Yes Health Council, 1849
Section 4 Food and health; 4/1 Human food; 4/2 National Council on Nutrition, 1996
Ministry of Public Health
France Yes French Food Safety Agency
National Health Monitoring Agency, 1999 Government
Germany Yes German Nutrition Society, Federal Institute for Risk
Assessment
Ireland Yes Food Safety Authority of Ireland
Nutrition Sub-Committee, 1993 Department of Health and Children
Luxembourg No
Netherlands Yes Health Council of the Netherlands, 1902
National Institute of Public health and the Environment
Ministry of Health, Welfare and Sport
Switzerland Yes Swiss Nutrition Council, 1949 Federal Office of Public
Health
United Kingdom Yes Scientific Advisory Committee on Nutrition (UK),
2000 Department of Health, Food Standards Agency
Comparative analysis of nutrition policies in the WHO European Region page 16
Administrative structures for implementation
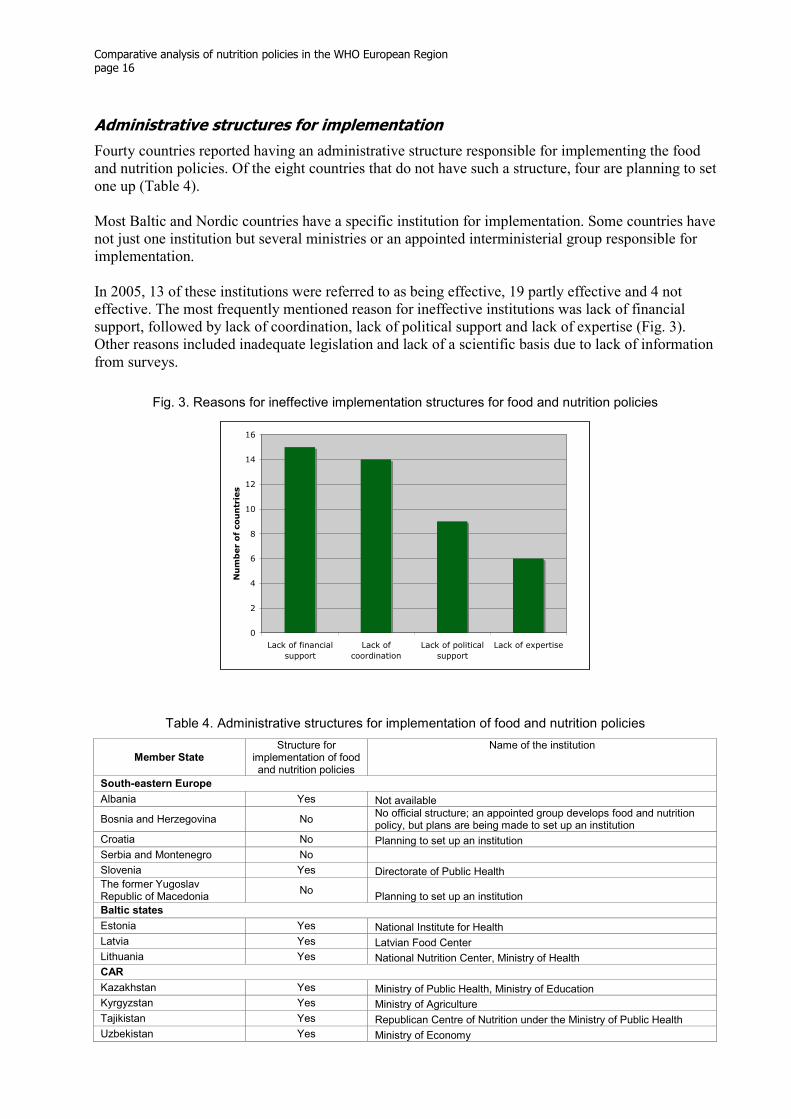
Fourty countries reported having an administrative structure responsible for implementing the food and nutrition policies. Of the eight countries that do not have such a structure, four are planning to set one up (Table 4). Most Baltic and Nordic countries have a specific institution for implementation. Some countries have not just one institution but several ministries or an appointed interministerial group responsible for implementation. In 2005, 13 of these institutions were referred to as being effective, 19 partly effective and 4 not effective. The most frequently mentioned reason for ineffective institutions was lack of financial support, followed by lack of coordination, lack of political support and lack of expertise (Fig. 3). Other reasons included inadequate legislation and lack of a scientific basis due to lack of information from surveys.
Fig. 3. Reasons for ineffective implementation structures for food and nutrition policies
0
2
4
6
8
10
12
14
16
Lack of financial
support
Lack of
coordination
Lack of political
support
Lack of expertise
Number of countries
Table 4. Administrative structures for implementation of food and nutrition policies
Member State
Structure for implementation of food and nutrition policies
Name of the institution
South-eastern Europe
Albania Yes Not available
Bosnia and Herzegovina No No official structure; an appointed group develops food and nutrition policy, but plans are being made to set up an institution
Croatia No Planning to set up an institution
Serbia and Montenegro No
Slovenia Yes Directorate of Public Health The former Yugoslav Republic of Macedonia
No Planning to set up an institution
Baltic states
Estonia Yes National Institute for Health
Latvia Yes Latvian Food Center
Lithuania Yes National Nutrition Center, Ministry of Health
CAR
Kazakhstan Yes Ministry of Public Health, Ministry of Education
Kyrgyzstan Yes Ministry of Agriculture
Tajikistan Yes Republican Centre of Nutrition under the Ministry of Public Health
Uzbekistan Yes Ministry of Economy

Comparative analysis of nutrition policies in the WHO European Region page 17
Member State
Structure for implementation of food and nutrition policies
Name of the institution
CCEE
Bulgaria Yes Includes several ministries and institutions
Czech Republic Yes Ministry of Health, Ministry of Agriculture
Hungary Yes Ministry of Health, National Public Health and Medical Officers’ Service
Poland Yes Ministry of Health
Romania Yes Ministry of Health
Slovakia Yes Not available
CIS
Armenia Yes Not available
Azerbaijan Yes Ministry of Public Health, Ministry of Economy and Development, Ministry of Agriculture
Belarus
Georgia Yes Coordinating Council on Iodine Deficiency Prevention
Republic of Moldova No
Russian Federation Yes Ministry of Public Health, National Research Centre for Preventive Medicine, Institute of Nutrition
Ukraine Yes Not available
Nordic countries
Denmark Yes Ministry of Food, Agriculture and Fisheries
Finland Yes National Nutrition Council
Iceland Yes Ministry of Health and Social Security
Norway Yes Directorate for Health and Social Affairs
Sweden Yes National Food Administration, Swedish National Institute of Public Health
Southern Europe
Cyprus Yes Department of Medical & Public Health Services
Greece No
Planning to set up a committee coordinated by the Ministry of Health and Social Welfare with participants from the Ministries of Health and Social Welfare, National Education and Religious Affairs, Agriculture, Development and Transportation
Israel Yes Ministry of Health – Food and Nutrition Services
Italy Yes Ministry of Health, National Institute for Food and Nutrition Research
Malta Yes Health Promotion Department
Portugal Yes General Health Directorate
Spain Yes General Directorate of Public Health
Turkey Yes Ministry of Health, Ministry of Agriculture and Rural Affairs
Western Europe
Austria No
Belgium Yes Ministry of Public Health, Food Chain Safety and Environment
France Yes Ministry of Health and Solidarity
Germany Yes Federal Ministry of Food, Agriculture and Consumer Protection, Federal Ministry of Health
Ireland Yes Health Promotion Unit, Department of Health and Children
Luxembourg Yes Ministry of Health
Netherlands Yes Ministry of Health, Welfare and Sport
Switzerland Yes Nutrition, Health Protection and Prevention Department
United Kingdom Yes (Northern Ireland:
no)
Wales: Food and Well Being – Implementation and Monitoring Working Party England: Department of Health Northern Ireland: planning to set up an institution Scotland: Food and Health Council United Kingdom-wide: Food Standards Agency

Comparative analysis of nutrition policies in the WHO European Region page 18
Intersectoral collaboration
Food and nutrition policies are an intersectoral effort in 24 countries, involving ministries responsible for health, agriculture, education, economy, finance and social affairs as well as the food industry and nongovernmental organizations. Different ministries collaborate in 34 countries, whereas 5 countries have no intersectoral collaboration. Governments of 37 countries meet regularly with NGOs, and 34 governments collaborate with the food industry (Fig. 4). Countries (mainly from CCEE, south-eastern Europe and CAR) that do not have collaboration with other sectors stated that this is due to frequent changes in ministries, lack of coordination mechanisms, changes in the political situation and lack of clearly defined responsibilities.
Fig. 4. Collaboration of countries in the WHO European Region with various stakeholders on food and nutrition policies
0
5
10
15
20
25
30
35
40
With NGOs With various
ministries
With the food
industry
Intersectoral
(with all
groups)
No
collaboration
Number of countries
SUMMARY
1. Most Member States have available a final document on nutrition; some countries are revising their documents or preparing new ones. Countries without a specific document have various nutrition-related programmes: 37 countries have a final document; 8 countries have a draft document or a document under preparation; 3 countries have no document.
2. Nutrition policies can either be outlined in separate documents or be part of an overarching strategy to tackle public health or environmental issues. Specific issues, such as micronutrient deficiencies or obesity, are sometimes the main objective of documents on food and nutrition policies.
3. Action areas include infant feeding, food security, food safety, nutrition and physical activity and reducing obesity. Implementation tools include establishing advisory bodies, food-based dietary guidelines, public nutrition education and health promotion and monitoring and surveillance systems.
4. Countries with national institutions advising the government on a technical basis appear to be the most effective in developing and implementing policies. In 2005, 37 countries had advisory bodies.

Comparative analysis of nutrition policies in the WHO European Region page 19
5. More than half the countries have institutions with a coordinating role, but not all the institutions appear to be effective, mainly due to lack of political commitment, financial resources and coordination: 40 countries have an administrative structure for implementing the food and nutrition policies and four plan to set up an administrative structure.
6. Ministries collaborate in 34 countries, whereas 5 countries have no intersectoral collaboration. Governments of 37 countries meet regularly with NGOs, and 34 governments collaborate with the food industry. Twenty-four countries work intersectorally, involving different ministries, the private sector and NGOs.
Analysis of nutritional status and nutritional risk factors
Dietary intake data
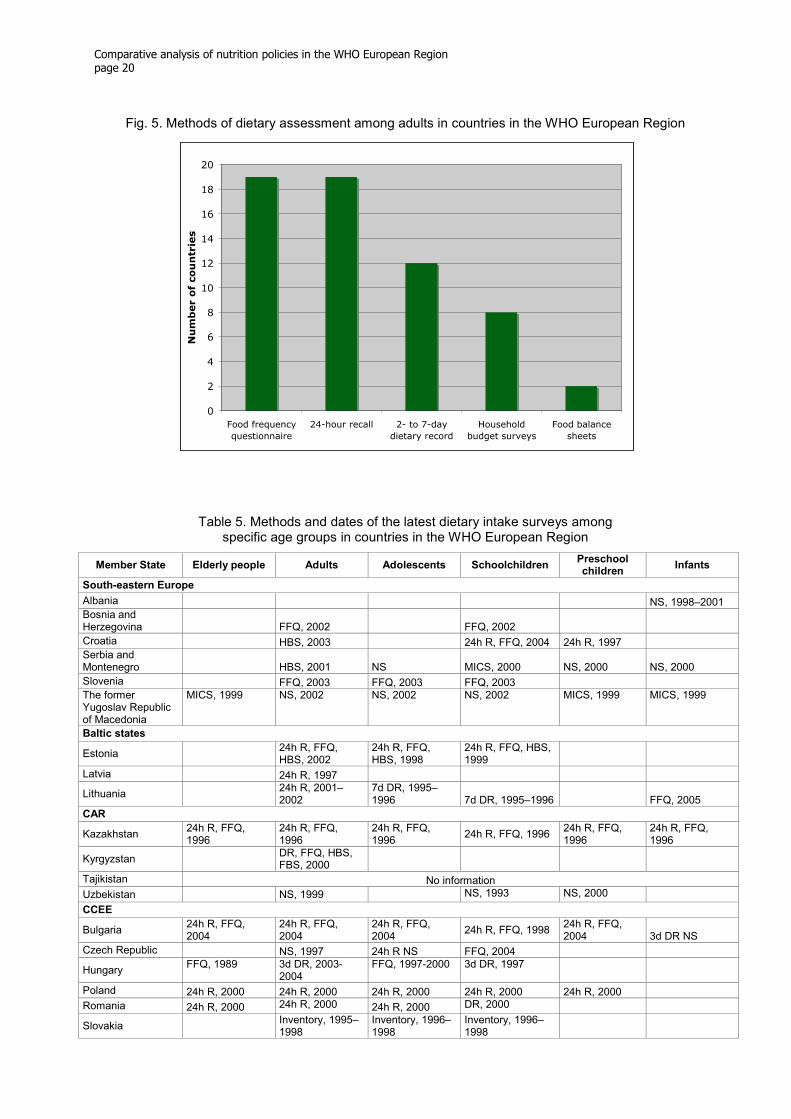
Objective, reliable data are essential to compare regions or countries, to provide the basis for testing the impact of change, to monitor progress over time and provide the basis for political decisions. Statistics of food supply at the national level, reported in food balance sheets (FBS), provide gross estimates of the national supply of food commodities. National statistical offices often collect data on food availability at the household level through household budget surveys (HBS) (10). Individual dietary intake data can be collected by using dietary records or food diaries, 24-hour recall or food frequency questionnaires (FFQ). Per capita food supply calculated from FBS data would usually be higher than food consumption obtained through individual dietary intake surveys. Results obtained with HBS appear to be closer to individual dietary surveys, except for consumption of fish, meat, pulses and vegetables, which HBS tend to underestimate (11). Data on individual dietary intake are available in most countries (Table 5). Forty-three countries indicated that they have collected individual dietary intake data among adults; about 30 countries undertook surveys for adolescents and school children and only about 20 countries for elderly people, preschool children and infants. The methods used for estimating dietary intake varied between the Member States and even within countries (Fig. 5). FFQ and 24-hour recall were the methods used most frequently for adults (19 countries), followed by two- or seven-day dietary records. As indicated in Table 5, several countries also rely on HBS data for assessing diet. The methods for harmonizing this information have been developed through the Data Food Networking (DAFNE) initiative and are already being successfully applied in 16 countries. Some countries use HBS to assess dietary intake and few countries rely on FBS, but both are standardized tools that every country has and that can be useful for intercountry comparison and longitudinal analysis. Unfortunately, some countries did not indicate which method they used. Twenty-four countries conduct regular surveys on dietary intake among adults at intervals of 1 to 10 years. Eleven countries report regular surveys among infants, also performed every 1 to 10 years. Twelve countries regularly survey elderly people, repeated at intervals of 1 to 16 years. About 15 countries are surveying the dietary intake of children and adolescents, every 1 to 20 years. Two CIS countries, the Russian Federation and Ukraine, have regular surveillance systems for all these age groups, as do the Netherlands and the United Kingdom.
Comparative analysis of nutrition policies in the WHO European Region page 20
Fig. 5. Methods of dietary assessment among adults in countries in the WHO European Region
0
2
4
6
8
10
12
14
16
18
20
Food frequency
questionnaire
24-hour recall 2- to 7-day
dietary record
Household
budget surveys
Food balance
sheets
Number of countries
Table 5. Methods and dates of the latest dietary intake surveys among specific age groups in countries in the WHO European Region
Member State Elderly people Adults Adolescents Schoolchildren Preschool children
Infants
South-eastern Europe
Albania NS, 1998–2001 Bosnia and Herzegovina FFQ, 2002 FFQ, 2002
Croatia HBS, 2003 24h R, FFQ, 2004 24h R, 1997 Serbia and Montenegro HBS, 2001 NS MICS, 2000 NS, 2000 NS, 2000
Slovenia FFQ, 2003 FFQ, 2003 FFQ, 2003 The former Yugoslav Republic of Macedonia
MICS, 1999 NS, 2002 NS, 2002 NS, 2002 MICS, 1999 MICS, 1999
Baltic states
Estonia
24h R, FFQ, HBS, 2002
24h R, FFQ, HBS, 1998
24h R, FFQ, HBS, 1999
Latvia 24h R, 1997
Lithuania
24h R, 2001–2002
7d DR, 1995–1996 7d DR, 1995–1996 FFQ, 2005
CAR
Kazakhstan 24h R, FFQ, 1996
24h R, FFQ, 1996
24h R, FFQ, 1996
24h R, FFQ, 1996 24h R, FFQ, 1996
24h R, FFQ, 1996
Kyrgyzstan DR, FFQ, HBS, FBS, 2000
Tajikistan No information
Uzbekistan NS, 1999 NS, 1993 NS, 2000
CCEE
Bulgaria 24h R, FFQ, 2004
24h R, FFQ, 2004
24h R, FFQ, 2004
24h R, FFQ, 1998 24h R, FFQ, 2004 3d DR NS
Czech Republic NS, 1997 24h R NS FFQ, 2004
Hungary FFQ, 1989 3d DR, 2003-
2004 FFQ, 1997-2000 3d DR, 1997
Poland 24h R, 2000 24h R, 2000 24h R, 2000 24h R, 2000 24h R, 2000
Romania 24h R, 2000 24h R, 2000 24h R, 2000 DR, 2000
Slovakia Inventory, 1995–
1998 Inventory, 1996–1998
Inventory, 1996–1998

Comparative analysis of nutrition policies in the WHO European Region page 21
Member State Elderly people Adults Adolescents Schoolchildren Preschool children
Infants
CIS
Armenia 24h R, DR NS 24h R, DR NS 24h R, DR NS 24h R, DR NS 24h R, DR NS NS, 2000
Azerbaijan 24h R, DR, FFQ, HBS, FBS
24h R, DR, FFQ, HBS, FBS, 1996
24h R, DR, FFQ, HBS, FBS, 1996
24h R, DR, FFQ, HBS, FBS, 1996
24h R, DR, FFQ, HBS, FBS, 1996
NS, 1996
Belarus NS, 1984 24h R, 2000 24h R, 2002 24h R, 2003 24h R, 2003
Georgia 24h R, 2001
24h R, FFQ, 2005
NS, 2002 NS, 2002 FFQ, 2002–2003
Republic of Moldova
NS, 2000 NS, 1997 NS, 1997 NS, 1998 NS, 1998
Russian Federation 24h R, DR, FFQ, HBS, 2002
24h R, DR, FFQ, HBS, 2002, 2003–2005
24h R, DR, FFQ, HBS, 2002
24h R, DR, FFQ, HBS, 2002
24h R, DR, FFQ, HBS, 2002, 2003
NS, 2002, 2003
Ukraine Questionnaire, 2000
Questionnaire, 1999
Questionnaire, 1997
Questionnaire and time-keeping weight measure, 1995
Questionnaire and time-keeping weight measure, 1995–2003
NS, 2002
Nordic countries
Denmark 7d DR, 2002 7d DR, 2002 7d DR, 2002 7d DR, 2002 7d DR, 2002
Finland FFQ, 2003 2d DR, 2005 24h R, 2005
Iceland
24h R, FFQ, 2002
24h R, FFQ, 1993
24h R, FFQ, 2002 Dietary records, 1999 DR, 1997
Norway FFQ, 1997 DR, 2000 DR, 2001 DR, 2001
Questionnaires, 1998–1999
Sweden 7d DR, 1997–1998
7d DR, 1997–1998
7d DR, 1997–1998 4d DR, 2003 4d DR, 2003 7d DR
Southern Europe
Cyprus NS, 1993 NS, 2004
Greece Semi-quantitative FFQ (EPIC), 1994–1999
Semi-quantitative FFQ (EPIC), 1994–1999
3d DR and diet history, 1985–1987
3d DR and diet history, 1985–1987
3d DR and diet history, 1985–1987
Israel FFQ, 2003–2004
24h R, 1999–2001
24h R, FFQ (school based), 2003–2004
24h R, FFQ (school based), 2003–2004
Telephone, FFQ, 1999–2000
Italy 7d weighed DR, 1992
3d weighed DR, 2002
Malta FFQ, 2002 FFQ, 2002
Portugal 1d DR, 1980 1d DR, 1980 1d DR, 1980 1d DR, 1980 1d DR, 1980 FFQ, 2003
Spain HBS, 1991
Turkey 3X24h R, 1974 TDHS, 1998
Western Europe
Austria 24h R, FFQ, 2003
24h R, FFQ, 2003
7d DR , FFQ, 2003 7d DR, FFQ, 2003
3d DR, FFQ, 2003
Belgium 24h R, FFQ, 2005
24h R, FFQ, 2005
24h R, FFQ, 2005
France 3- to 7-d DR, 1999
3- to 7-d DR, 1999
3- to 7-d DR, 1999 3- to 7-d DR, 1999
Germany 24h R, 2x4d DR, FFQ, 2006
24h R, 2x4d DR, FFQ, 2006
24h R, 2x4d DR, FFQ, 2006
24h R, 2x4d DR, FFQ, 2006
24h R, 2x4d DR, FFQ, 2002
24h R, FFQ, 1998
Ireland FFQ, 2002 FFQ, 2002 FFQ, 2002
FFQ, 2002, weighed DR, 2005
Luxembourg 24h R
Netherlands 2d DR, FFQ, 1998
24h R, FFQ, 2003
2d DR, FFQ, 1998 2d DR, FFQ, 1998
2d DR, FFQ, 1998
2d DR, FFQ, 2002
Switzerland
Retrospective, 1994
United Kingdom
4- to 7-d weighed DR, HBS, National Food Survey, 1994–1995
4- to 7-d weighed DR, HBS, National Food Survey, 2000–2001
4- to 7-d weighed DR, HBS, National Food Survey, 1997
4- to 7-d weighed DR, HBS, National Food Survey, 1997
4- to 7-d weighed DR, HBS, National Food Survey, 1992–1993
Cohort of new mothers, 2000
24h R: 24-hour recall. DR: dietary record. FBS: food balance sheet. FFQ: food frequency questionnaire. HBS: household budget survey. MICS: multi-indicator cluster survey. NS: not specified. TDHS: Turkish Demographic Health Survey.

Comparative analysis of nutrition policies in the WHO European Region page 22
Breastfeeding
Data on breastfeeding were available from 37 countries. Data were obtained using 24-hour recall, cohort studies or retrospective surveys dating from 1989 to 2005 (Table 6). The immediate impression is a very wide range of values, which reflects different attitudes to the problem but also different definitions and survey methods used. In general, exclusive breastfeeding is a fairly established practice in the first month in most countries; only 4 of 29 countries reported rates below 50%, most in southern Europe. Rates are generally higher in the CIS countries, CAR, south-eastern Europe and northern Europe. An explanation for this might be the strong focus on promoting breastfeeding in these countries. Exclusive breastfeeding drops very quickly after six months, so that less than one third of the infants in most countries are exclusively breastfed. Annex 3 defines the breastfeeding categories.
Table 6. Percentage of infants breastfeeding exclusively at 1, 3 and 6 months in countries in the WHO European Region
Member State 1
month 3 months
6 months
Date of survey Methods
South-eastern Europe
Albania 69 56 20 2001 NA
Slovenia 90 2000 Cohort (population-based registration)
Croatia 56a 41b 37 2004 Retrospective
Bosnia and Herzegovina 6 1999
Survey on practices regarding infant and young children
Serbia and Montenegro 5 1999 Multi-indicator cluster survey
Baltic states
Lithuania 62 31 14 NA 24-hour recall
CAR
Kazakhstan 79 57 38 2002 Cohort
Kyrgyzstan 63 2002 NA
Uzbekistan 98 24 2000 NA
CCEE
Czech Republic 91 23 1999–2001 Retrospective
Slovakia 93 55 30 2000 Retrospective
Hungary 62 35 2001–2002 Retrospective
Bulgaria 70 45 5 2000 NA
Poland 71 31 9 1997–2002 24-hour recall
CIS
Azerbaijan 30 2001 NA
Georgia 37 22 16 2005 Knowledge, Practice, Coverage Questionnaire
Republic of Moldova 99 81 60 1998 NA
Russian Federation 69 35 11 2003 Retrospective, random samples in two cities
Ukraine 46 41 2002 Questionnaire and observation
Nordic countries
Finland 60 51 2 2002 24-hour recall
Iceland 93 47 13 2000 Cohort, monthly records
Norway 94 70 7 1998 Retrospective questionnaire
Sweden 93 80 33 2000 Statistics from child-care centres
Southern Europe
Cyprus 27 19 10 2000 NA
Greece 49 23 5 1989 Cohort
Israel 52 33 12 1999–2000 Cohort
Italy 57 47 5 1999 Retrospective cohort
Turkey 21c 2d 2003 Retrospective
Malta 55 2004 NA
Portugal 85 63 1998–1999 Retrospective
Spain 42 23 2001 Retrospective

Comparative analysis of nutrition policies in the WHO European Region page 23
Member State 1
month 3 months
6 months
Date of survey Methods
Western Europe
Austria 92 79 46 1998 NA
Ireland 40 2001 NA
Netherlands 54 35 25 2005 Retrospective
Luxembourg 65 40 4 2001 24-hour recall
Switzerland 80 62 11 1994 Retrospective
Germany 58 454 13 1999 Cohort, FFQ, interview
aTwo months. bFour months. c<6 months. d6–7 months. NA: not available.
Macronutrient intake
The dietary data received from 31 Member States in 2005 indicated that fat intake was above the recommended percentage (>30% energy intake from fat) in 87% of countries. The reports indicate that Baltic and south-eastern Europe countries had the highest fat intake in the WHO European Region (36.2–45.0% of energy intake). In contrast, in some of the CIS and CAR countries, fat consumption ranged between 19% and 40% of dietary energy. Intake of saturated fatty acids was also reported to be above the recommended percentage (<10% of total energy) in most of the countries. Only Israel and Italy were below 10%. The CIS and CAR countries had the highest carbohydrate intake (58.0–70.7% of energy intake) and the lowest protein intake (11–13% of energy intake) in the European Region. In contrast, western European countries had the lowest carbohydrate consumption (41–47%) and the highest protein intake (14–20%). Nineteen countries report that females have a lower percentage of energy intake from fat than males, whereas 25 countries reported higher carbohydrate intake as a percentage of energy intake among women than men, which the European Nutrition and Health Report (12) also observed. Only eight countries demonstrated changes in dietary intake between the surveys conducted in 1998–1999 and 2005, as the other countries did not have more recent data than that provided in 1998–1999 or the methods were not comparable (Fig. 6–8). Fat intake increased in France and Ireland since the survey in 1998–1999 and declined in Austria, Denmark, Iceland, the Netherlands and Sweden. Correspondingly, carbohydrate consumption increased between the surveys from 1998–1999 and 2005 in Austria, Denmark, Iceland, the Netherlands and Sweden. Carbohydrate intake declined in Ireland and Norway. Protein intake seemed to increase between the two surveys in all countries but Austria and Denmark, where less protein appears to be consumed.

Comparative analysis of nutrition policies in the WHO European Region page 24
Fig. 6. Changes countries in the WHO European Region reported in the proportion of energy intake derived from fat
Percentage daily energy intake from fat
0 5 10 15 20 25 30 35 40 45
Norway 1997
Norway 1993-1994
Denmark 2000-2001
Denmark 1995
Sweden 1998-1997
Sweden 1989
Iceland 2002
Iceland 1990
Ireland 1997-1999
Ireland 1990
Netherlands 1997-1998
Netherlands 1987-1988
Austria 2003
Austria 1998
France 1999
France 1994
%
Fig. 7. Changes countries in the WHO European Region reported in the proportion of energy intake derived from protein
Percentage daily energy intake from protein
0 5 10 15 20
Denmark 2000-2001
Denmark 1995
Netherlands 1997-1998
Netherlands 1987-1988
Austria 2003
Austria 1998
Ireland 1997-1999
Ireland 1990
Norway 1997
Norway 1993-1994
Sweden 1998-1997
Sweden 1989
Iceland 2002
Iceland 1990
France 1999
France 1994
%

Comparative analysis of nutrition policies in the WHO European Region page 25
Fig. 8. Changes countries in the WHO European Region reported in the proportion of energy intake derived from carbohydrate
Percentage daily energy intake from carbohydrates
0 10 20 30 40 50
France 1999
France 1994
Austria 2003
Austria 1998
Iceland 2002
Iceland 1990
Netherlands 1997-1998
Netherlands 1987-1988
Sweden 1998-1997
Sweden 1989
Ireland 1997-1999
Ireland 1990
Denmark 2000-2001
Denmark 1995
Norway 1997
Norway 1993-1994
%
Fruit and vegetable intake
Thirty countries provided data on fruit and vegetable intake. Twenty-two countries reported data separately for men and women. Dietary intake methods were not always reported, but among the methods used, 24-hour recall and FFQ were the most frequent, followed by dietary records. Four countries provided data on fruit and vegetable intake from HBS (Table 7). Countries in southern Europe report the highest fruit and vegetable consumption among adults; all the countries report more than 400 g and Greece reports even 1 kg per person per day on average. Countries in western and northern Europe report the lowest intake, most below 300 g/day. Of the 22 countries, 12 reported higher fruit and vegetable intake among women than among men. Data on fruit and vegetable intake should be interpreted with caution as classification may differ, with some countries including potatoes and legumes. The data on fruit intake include fruit juices, and vegetable data include pulses.

Comparative analysis of nutrition policies in the WHO European Region page 26
Table 7. Fruit and vegetable intake among adults in countries in the WHO European Region
Member State Gender Age
group (years)
Fruit intake among
adults (g)*
Vegetable intake among
adults (g)*
Fruit and vegetable
intake among
adults (g)
Collection year
National survey method, adults
South-eastern Europe
Croatia B NA 171 192 363 2000 HBS
Serbia and Montenegro B 19–64 122 150 272 NA NA
Baltic states
M 19–64 153 241 394 1997 24h R Estonia
F 19–64 168 209 377
M 19–64 67 201 268 1997 24h R Latvia
F 19–64 96 168 264
M 19–50 184 154 338 2000–2001 24h R Lithuania
F 19–50 226 126 352
CAR
M NA 131 153 284 1996 NA Kazakhstan
F NA 133 117 250
M 19–64 29 194 223 2006 NA Uzbekistan
F 19–64 22 178 200
CCEE
M 19–60 143 246 389 1998 24h R, FFQ Bulgaria
F 19–60 153 206 359
M 19+ 152 122 274 2003 3d DR Hungary
F 19+ 185 124 309
M 19–60 297 384 681 2000 24h R Poland
F 19–60 317 257 574
Slovakia B 19–64 164 297 461 NA Inventory
CIS
Georgia B NA 275 115 390 2005 24h R, FFQ
M 19–64 75 184 259 2002 Russian Federation
F 19–64 110 119 229 24h R, FFQ, HBS
M NA 125 175 300 1994 Ukraine
F NA 225 275 500 Questionnaire
Nordic countries
M 15–75 212 141 353 2000–2001 7d DR Denmark
F 15–75 265 152 417
M 25–64 203 78 281 2002 48h recall Finland
F 25–64 242 104 346
M 20–80 123 104 227 2002 24h R, FFQ Iceland
F 20–80 131 102 233
M 16–79 218 123 341 1997 FFQ Norway
F 16–79 225 146 371
M NA 191 107 298 1997–1998 7d DR Sweden
F NA 235 135 370
Southern Europe
M 25–64 395 607 1002 1994-1999 FFQ Greece
F 25–64 403 563 966
M 25–64 203 227 430 1996 NA Israel
F 25–64 205 202 407
M 18–64 200 222 422 NA FFQ Italy
F 18–64 195 216 411
M 20–64 170 258 428 1980 1d DR Portugal
F 20–64 180 239 419
Spain B 19–64 300 173 473 1991 HBS
Turkey B NA 183 284 467 1994 HBS
Western Europe
M 19–64 179 140 319 2003 24h R, FFQ Austria
F 19–64 186 153 339

Comparative analysis of nutrition policies in the WHO European Region page 27
Member State Gender Age
group (years)
Fruit intake among
adults (g)*
Vegetable intake among
adults (g)*
Fruit and vegetable
intake among
adults (g)
Collection year
National survey method, adults
France B 25–44 109 117 226 NA 3- to 7-d DR
Germany M 18–65 176 243 419 1998 4-week recall F 18–65 205 251 456
Netherlands B 19–65 102 120 222 1997–1998 2d DR
M 19–64 135 123 258 2000–2001 24h R, DR, FFQ United Kingdom
F 19–64 150 113 263
M: male. F: female. B: both male and female. HBS: household budget survey. 24h R: 24-hour recall. FFQ: food frequency questionnaire. DR: dietary record. NA: not available. * Data on fruit intake include fruit juices, and vegetable data include pulses.
Fruit and vegetable intake could be compared between the questionnaires in 1998–1999 and 2005 in six countries. The other countries did not provide data from two different surveys using the same methods (Fig. 9). Almost all the countries reported higher fruit and vegetable intake at the second point of surveillance, but none of the results on intake data reached the recommendation of at least 400 g. In Denmark and the United Kingdom the increase referred mainly to fruit consumption, whereas in Austria and Sweden both fruit and vegetable intake increased similarly. In Iceland vegetable intake increased and fruit intake decreased. In the Netherlands consumption of both fruit and vegetables decreased. A comparative analysis of HBS data from 10 European countries showed a more evident deficit in vegetable consumption, as consumers are more receptive to health messages for increasing fruit intake rather than vegetable intake. A mandate addressing fruits and vegetables separately may thus need to be considered (13).
Fig. 9. Change countries in the WHO European Region reported in daily fruit and vegetable consumption
0 50 100 150 200 250 300 350 400
Iceland 2002
Iceland 1990
United Kingdom 1995
United Kingdom 1986-1987
Austria 2003
Austria 1998
Sweden 1997-1998
Sweden 1989
Norway 1997
Norway 1993-1994
Denmark 2000-2001
Denmark 1995
[g] Total vegetable intake in adults Total fruit intake in adults

Comparative analysis of nutrition policies in the WHO European Region page 28
Nutritional status
Anthropometric data
The data from European countries indicate that overweight (body mass index (BMI) 25.0–29.9) and obesity (BMI ≥30) are a general problem in the European Region (Table 8). Countries in south-eastern and southern Europe reported the greatest prevalence of overweight among both women and men. Overweight rates are also very high among men in western Europe and CCEE. In general, fewer women tend to be obese than men, but in CAR, the prevalence of obesity appears to be higher among women than among men. However, overweight rates among both women and men appear to be the lowest in CAR and CIS countries, especially in Belarus, Kazakhstan and Uzbekistan. Thirty-six countries provided data on weight and height. The BMI data received from Member States had several limitations, making comparison difficult. For instance, sample size was occasionally very small or not indicated at all; the year of data collection was not always reported and the collection period was sometimes broad (such as 1994–1999) and not recent. Investigators did not always measure the anthropometric data, which were often collected by interview (19 countries), and this is known to underestimate the prevalence of obesity to a variable extent (14). The varying ranges in the age groups are further limitations to country comparisons. Despite these shortcomings, the data show that overweight and obesity are a serious public health problem throughout the Region. The prevalence of overweight was particularly high among men, ranging from 15.4% (Georgia) to 54.3% (Austria) versus women with 18.1% (Bulgaria: age group 19–30 years) to 42.3% (Georgia). The prevalence of obesity reported for men ranged from 2.5% in Belarus (age group 18–29 years) to 26.4% in Malta, and the proportion of women reported being obese ranged between 1.5% in Belarus (age group 18–29 years) and 25.2% in Bosnia. The dietary intake data presented in this report from the Baltic countries suggest a high prevalence of overweight and obesity and a link to high fat intake and low consumption of fruit and vegetables. High BMI coincides with high fat intake in the data received from countries in southern and south-eastern Europe. However, the intake of fruit and vegetables there is very high. Only seven countries measured waist circumference: Bosnia and Herzegovina, Finland, France, Greece, Ireland, Israel and the Netherlands.
Table 8. Overweight and obesity among adult men and women in countries in the WHO European Region
Member State
Weight and height
measured
Age range
(years) Sex
BMI 25.0–29.9 (%)
BMI ≥30 (%) Collection year
South-eastern Europe
Yes 25–64 M 48.6 16.5 2002 Bosnia and Herzegovina (15)
F 36.2 25.2
Yes 18+ M 46.7 21.6 2003 Croatia (16)
F 35.5 22.7
Serbia and Montenegro (17) NA 20+ B 36.5 17.6 2000
No 25–64 M 16.5 2001 Slovenia (18)
F 13.8
Baltic states
No 16–64 M 33.0 11.8 2002 Estonia (19)
F 26.1 14.4
No 15–64 M 30.1 11.9 2004 Latvia (20)
F 23.9 19.5
No 20–64 M 38.3 14.2 2004 Lithuania (21)
F 29.3 16.9

Comparative analysis of nutrition policies in the WHO European Region page 29
Member State
Weight and height
measured
Age range
(years) Sex
BMI 25.0–29.9 (%)
BMI ≥30 (%) Collection year
CAR
Yes 15+ M 26.0 8.0 1996 Kazakhstan
F 27.0 20.0
Yes 20–59 M 30.5 6.4 2002 Uzbekistan (22)
F 24.3 8.9
CCEE
Yes 19–30 30–60
M 23.5 41.4
6.1 22.1
2004 Bulgaria
19–30 30–60
F 18.1 33.7
4.7 16.6
No 15+ 13.4 2002 Czech Republic (23)
16.1
Poland (24) Yes 19+
M F
41.0 27.7
15.7 20.9
2000
No NA M 52.2 21.1 1998 Slovakia
F 29.2 16.6
CIS
Yes 18–29 30–39 40–59
M 22.8 37.0 48.4
2.5 2.9 5.2
2002
Belarus
18–29 30–39 40–59
F 16.3 31.0 42.7
1.5 6.4 13
Yes 19+ M 15.4 13.1 2000–2001 Georgia
F 42.3 9.5
Russian Federation (25) Yes 18–29 30–59
B 18.2 34.7
5.8 23.2
2004
Nordic countries
No 16–66 M 34.5 9.0 2000 Denmark
F 21.1 7.6
Yes 30+ M 20.8 2001 Finland (26)
F 23.9
No 15–80 M 44.6 12.4 2002 Iceland (27)
F 28 12.3
No 16–84 M 10.4 2003 Sweden (28)
F 9.5
Southern Europe
Yes 20–70 M 41.1 26.0 2004a Greece (29)
F 29.9 18.2
No 21+ M 13.8 2004 Israel (30)
F 15.8
No 18–75 M 42.4 9.2 2000 Italy
F 26.0 8.8
No 19–64 M 41.5 26.4 2002 Malta
F 28.7 19.9
Portugal (31) Yes 18–64 B 35.9 12.5 2004b
No 25–60 M 11.9 2001 Spain (32)
F 13.6
Yes 20+ M 12.9 1998 Turkey
F 18.8
Western Europe
No 20+ M 54.3 9.1 1999 Austria
F 21.3 9.1
No 15+ M 37.5 9.9 2004 Belgium (33)
F 23.5 11.6
No 15+ M 37.4 11.4 2003 France (34)
F 23.7 11.3
NA 25–69 M 53.0 22.5 1998 Germany
F 35.5 23.5

Comparative analysis of nutrition policies in the WHO European Region page 30
Member State
Weight and height
measured
Age range
(years) Sex
BMI 25.0–29.9 (%)
BMI ≥30 (%) Collection year
No 18+ M 42.0 14.5 2002 Ireland (35)
F 26.5 11.8
Yes 16+ M 31.9 7.1 1997 Luxembourg
F 20.5 11.3
No 19–30 M 21.6 14.2 2003 Netherlands
F 28.0 11.9
No 15+ M 37.5 7.9 2002 Switzerland (36)
F 21.8 7.5
Yes 16+ M 43.2 22.2 2003 United Kingdom (England only) (37) F 22.5 23.0
F: female. M: male. B: both female and male. NA: not available. aYear of publication.
The most regular weight and height surveys are carried out on adults, in 20 countries, with a time interval ranging from 1 to 10 years (Table 9). About 15 countries are monitoring the weight and height of elderly people, children and infants regularly, with time intervals of 1 to 15 years for elderly people and 1 to 10 years among children and infants. The Czech Republic, the Netherlands, the Russian Federation and the United Kingdom have regular surveillance systems for weight and height for all population groups.
Table 9. Time interval of weight and height assessment by age group in countries in the WHO European Region
Member State Elderly people Adults Adolescents Schoolchildren Preschool children
Infants
South-eastern Europe
Bosnia and Herzegovina
First done 2002 – next
planned in 4–5 years
First done 2002 – next planned in 4–5 years
Croatia 5–10 years 5 years 5–10 years Continuously
Serbia and Montenegro 5 years 5 years
Baltic states
Estonia
Latvia
Lithuania 2–3 years 5–7 years 5–7 years 5–7 years 5–7 years
CAR
Kazakhstan 5–10 years 5–10 years
Kyrgyzstan
Tajikistan 1 year 1 year
Uzbekistan
CCEE
Bulgaria 5–6 years 5–6 years 5–6 years 10 years 5–6 years
Czech Republic 3 years 3 years 10 years 10 years 10 years 10 years
Hungary
Poland Planned every 5 years
Romania 7 years 7 years 7 years
Slovakia 10 years 10 years 10 years
CIS
Azerbaijan 1 year 1 month 1 month
Belarus 1 year 1 year 1 year 1 month
Georgia 15 years Not available Not available
Russian Federation 1 year 1 year 1 year 1 year 1 year 1 year
Ukraine 10 years 1 year 1 year 1 year 1 year
Nordic countries
Denmark

Comparative analysis of nutrition policies in the WHO European Region page 31
Member State Elderly people Adults Adolescents Schoolchildren Preschool children
Infants
Finland 5 years
Sweden 1 year 4 years
Southern Europe
Greece
Israel
Italy 5 years 5 years 5 years 5 years 5 years
Malta 5 years 2 years
Portugal 5–10 years 5 years 1 year 1 year
Turkey
5 years (women only) 5 years 5 years
Western Europe
Austria 10 years 10 years
Belgium
France 5 years 5 years 5 years 5 years
Germany Not yet defined
Ireland 4 years
Luxembourg ~ 5 years
Netherlands Continuously Continuously Continuously Continuously 4 years 4 years
Switzerland 5 years 5 years 5 years United Kingdom (all) 10 years 10 years 10 years 10 years 10 years
Micronutrient status
The national food and nutrition policy documents of 17 countries included the general prevention of micronutrient deficiencies as a priority. Four countries stated specifically that eradication of IDD is one of their top priorities. Iodine deficiency disorders
IDD appear to be a problem in 30 Member States and not in 14 countries. Three countries reported not knowing whether IDD is a problem (Fig. 10). In western European countries, IDD have mainly been eliminated, with some notable exceptions. CAR, CIS countries and CCEE still have a moderate prevalence of IDD. Albania, Georgia, Kazakhstan, Tajikistan and Turkey report severe deficiencies. WHO published a review of IDD in Europe in 2000 (38). Iodine deficiency is easy to eliminate globally, but this has not yet been achieved. Universal salt iodization is the agreed strategy for preventing IDD. One of the goals in the outcome document of the United Nations Special Session on Children in May 2002 was the sustainable elimination of IDD through universal salt iodization. Most governments made commitments to achieve this goal by 2005. However, only 19 of 48 Member States have universal salt iodization, although 30 countries reported having an IDD problem. In 17 of these countries the problem is moderate or severe (Table 10). Compared with the results from a comparative analysis on salt iodization in 2000, four countries (Albania, the Republic of Moldova, the Russian Federation and The former Yugoslav Republic of Macedonia) that did not have universal salt iodization then stated that they had it in 2003 (38). In addition to universal salt iodization, other methods to combat IDD include household salt iodization, iodine supplements or dietary advice. Iodization of household salt and salt in processed food appear to be the most frequently applied intervention in 26 countries. Seven countries indicated none of these interventions, whereas five of these seven do not have an IDD problem (Fig. 11).

Comparative analysis of nutrition policies in the WHO European Region page 32
Fig. 10. Iodine deficiency disorder (IDD) in countries in the WHO European Region
Severe
10%
Not available
6%
Mild
21%
Moderate
25%
No IDD
30%
No information
2%
No data on IDD
6%
IDD 60%
Fig. 11. Interventions against iodine deficiency disorders (IDD) in countries in the WHO European Region
0
5
10
15
20
25
30
Household salt or
also salt in
processed food
Dietary advice Universal salt
iodization
Supplementation No intervention
Number of countries with IDD intervention

Comparative analysis of nutrition policies in the WHO European Region page 33
Table 10. Iodine deficiency disorders (IDD) and interventions in countries in the WHO European Region
Member State IDD
problem? Severity
Universal salt iodization
Supplementation Dietary advice
Household salt iodization
South-eastern Europe
Albania Yes Severe Yes Yes Yes Bosnia and Herzegovina Yes Moderate, mild Yes
Yes
Croatia No Yes Yes
Serbia and Montenegro No Yes
Slovenia Yes Mild Yes The former Yugoslav Republic of Macedonia Yes Mild Yes
Baltic states
Latvia Yes Mild Yes Yes Yesa
Lithuania Yes Moderate Yes Yes Yesa
Estonia Yes Mild Yes
CAR
Kazakhstan Yes
Severe, moderate, mild Yes
Yes Yes
Kyrgyzstan Yes Moderate Yes Yes Yes
Tajikistan Yes
Severe, moderate, mild Yes
Yes
Uzbekistan Yes Moderate Yes Yes
CCEE
Bulgaria No Yes Yes Yes
Czech Republic Yes Yes Yes Yes
Hungary Yes Moderate Yes Yes
Poland Yes Moderate Yes Yes Yes
Romania Yes Moderate Yes
Slovakia Yes Mild Yes Yes Yesa
CIS
Armenia Yes Not available Yes Yes Yes
Azerbaijan Yes Not available Yes Yes
Belarus Yes Moderate Yes Yes Yesa
Georgia Yes Severe Yes Yes
Republic of Moldova Yes Not available Yes
Russian Federation Yes Moderate Yes Yes Yesa
Ukraine Yes Moderate Yes Yes Yes
Nordic countries
Denmark Don’t know Yesa
Finland No Yes
Iceland No
Norway
Sweden No Yes Yes
Southern Europe
Cyprus No
Greece No Yes
Israel Don’t know Yes
Italy Yes Moderate Yes
Malta No
Portugal No
Spain No Yes
Turkey Yes Severe Yes Yes
Western Europe
Austria Yes Moderate Yes
Belgium Yes Mild
France Yes Mild Yes
Germany Yes Mild Yes Yesa
Ireland No Yesa

Comparative analysis of nutrition policies in the WHO European Region page 34
Member State IDD
problem? Severity
Universal salt iodization
Supplementation Dietary advice
Household salt iodization
Luxembourg Yes Mild Yes Yes Yesa
Netherlands Don’t know Yesa
Switzerland No Yesa
United Kingdom No
aIodization of household salt and salt in processed food. USI: universal salt iodization.
Iron deficiency anaemia
Iron deficiency and anaemia have detrimental health implications, particularly for mothers and young children. The 1990 World Summit for Children called for a reduction in iron deficiency anaemia among women to one third of the 1990 levels by the year 2000. In February 1999, UNICEF and WHO held a consultation with participation of representatives from most of the 27 countries served by the UNICEF Regional Office for Central and Eastern Europe and the Commonwealth of Independent States (39). Twenty-seven countries provided data on iron deficiency anaemia: 18 countries provided data on children, 17 on non-pregnant women, 15 on pregnant women and only 9 on men (Table 11). The CAR have the highest prevalence of anaemia. Children younger than five years in Tajikistan have a prevalence exceeding 80%, followed by Uzbekistan with 61% and Turkey with 50%. In the CIS region, 19–36% of non-pregnant women were reported to be anaemic. Anaemia levels among non-pregnant women were highest in Uzbekistan and Turkey (60% and 50% respectively). In western and southern Europe very few women were reported to be anaemic. In Azerbaijan, Georgia, Kazakhstan and Turkey, more than half the pregnant women (93% in Azerbaijan) were anaemic. Comparing a previous survey conducted in Kazakhstan, the prevalence of anaemia among children younger than five years declined from 69% in 1995 to 36% in 1999 and that among non-pregnant women dropped from 49% to 36% (39).
Table 11. Prevalence of iron deficiency anaemia in countries in the WHO European Region
Member State Children <5 years:
Hb <11 g/dl (%)
Children 5–14 years:
Hb <12 g/dl (%)
Non-pregnant women >15 years:
Hb <12 g/dl (%)
Pregnant women >15 years:
Hb <11 g/dl (%)
Men >15 years: Hb <13 g/dl
(%)
Year
South-eastern Europe
Albania 33 43 17 1989
Croatia 17 13 2000–2001
Baltic states
Lithuania 0.2 1998
CAR
Kazakhstan 36 36 60 1999
Kyrgyzstan 28 38 1997
Tajikistan 82 74 2003
Uzbekistan 61 61 60 67 2000
CCEE
Bulgaria 18 1995
Hungary 1.3
12. weeks: 0 20. weeks: 0 30. weeks: 3 38. weeks: 10
0 1992–1994
Romania
6–23.9 months: 50
24–60 months: 29
1991

Comparative analysis of nutrition policies in the WHO European Region page 35
Member State Children <5 years:
Hb <11 g/dl (%)
Children 5–14 years:
Hb <12 g/dl (%)
Non-pregnant women >15 years:
Hb <12 g/dl (%)
Pregnant women >15 years:
Hb <11 g/dl (%)
Men >15 years: Hb <13 g/dl
(%)
Year
CIS
Armenia 24 12 2000
Azerbaijan 44 36 93 26 1996
Georgia 16 10 21 65 13 1999–2002
Republic of Moldova
47 20 1998
Russian Federation
26 8 19 25 5 NA
Nordic countries
Denmark 0 (1996) 0–8 (1985–2001) 0 (1986–
1999)
Finland 6 1 2003
Iceland 9 (2000) 7 (2001) 9 (1991) 17 (1997–1998) 3 (1991)
Sweden 14 (1998) 27 (1993–1996) 10 (1993–
1996)
Southern Europe
Greece 7.8 0.4 2.8 1998
Israel 17.5 1999
Italy 1.2 2 NA
Turkey 50 30 50 50 2000
Western Europe
France 3 4 NA
Ireland 18–35 years: 50 36–50 years: 45
2 2001
Switzerland 7 (1987) 6 (2001)
United Kingdom 8 (1995) 2 (2000)
Hb: haemoglobin. NA: not available.
Countries were asked to indicate the type of intervention they implemented against iron deficiency anaemia (Fig. 12). Of the 24 countries for which information on interventions was available, about 15 use dietary advice to intervene against iron deficiency anaemia. Iron supplementation is mainly used for pregnant women. Fortification is used mainly in CAR, as a result of public-private partnerships fostered by international donors. Greece, Iceland, Kazakhstan, the Russian Federation and Tajikistan use a combination of dietary advice, food fortification and supplementation.

Comparative analysis of nutrition policies in the WHO European Region page 36
Fig. 12. Iron deficiency anaemia interventions in countries in the WHO European Region
0
2
4
6
8
10
12
14
16
18
20
Children <5years
Children 5-14years
Non-pregnant>15 years
Pregnant >15years
Men >15 years
Number of countries
Advice
Fortification
Supplements
Vitamin A deficiency
The countries reporting vitamin A deficiency were mainly in CAR and CIS countries. Eleven countries reported vitamin A deficiency to be a public health problem. The prevalence of such deficiency was especially high in Kazakhstan, Tajikistan and Uzbekistan. Ireland, the Netherlands and Slovakia also reported deficiency, although at a low prevalence rate. Interestingly, nine countries stated that they did not know whether vitamin A deficiency was a problem (Table 12). The most applied method of intervention was dietary advice in 16 countries, followed by fortification (12 countries) and supplementation (10 countries). In the presence of an acknowledged problem, countries used a combination of dietary advice, fortification and supplementation. Kyrgyzstan reported vitamin A deficiency but indicated not having any interventions. Some CCEE and some Nordic countries also intervene to improve vitamin A status although vitamin A deficiency has not been observed.
Table 12. Vitamin A deficiency and interventions in countries in the WHO European Region
Member State Vitamin A deficiency
Type Dietary advice
Fortification Supplementation
South-eastern Europe
Albania No
Bosnia and Herzegovina Don’t know No No No
Croatia No Yes No Yes
Serbia and Montenegro Don’t know No No Yes
Slovenia No The former Yugoslav Republic of Macedonia No
Baltic states
Estonia Don’t know
Latvia Don’t know
Lithuania Don’t know
CAR
Kazakhstan Yes Severe Yes No Yes

Comparative analysis of nutrition policies in the WHO European Region page 37
Member State Vitamin A deficiency
Type Dietary advice
Fortification Supplementation
Kyrgyzstan Yes Not available No No No
Tajikistan Yes Severe, moderate
and mild Yes No Yes
Uzbekistan Yes Severe No No Yes
CCEE
Bulgaria No Yes No No
Czech Republic No Yes Yes No
Hungary No Yes No No
Poland No
Romania Don’t know
Slovakia Yes Mild Yes Yes No
CIS
Armenia No
Azerbaijan Yes Not available Yes Yes Yes
Belarus Yes Mild Yes Yes Yes
Georgia Yes Moderate Yes No No
Republic of Moldova No
Russian Federation No Yes Yes Yes
Ukraine Yes Mild Yes Yes No
Nordic countries
Denmark No
Finland No No Yes No
Iceland No No Yes Yes
Norway No
Sweden No No Yes Yes
Southern Europe
Cyprus Don’t know
Greece No
Israel No No Yes No
Italy No
Malta Don’t know
Portugal No
Spain No Yes No No
Turkey Don’t know Yes Yes No
Western Europe
Austria No No No Yes
Belgium No
France No
Germany No
Ireland Yes Mild Yes No No
Luxembourg No
Netherlands Yes Mild Yes Yes No
Switzerland No information No No No
United Kingdom No
SUMMARY
1. Less than half the Member States conduct regular surveys on dietary intake, mainly among adults. Two countries are planning to do regular surveys in all age groups.
2. Most of the national surveys indicated intake of total fat above the recommended 30% of dietary energy. Only two countries reported saturated fatty acid intake within the recommended <10% of total dietary energy.
3. More than half the national surveys on fruit and vegetables revealed intake below the recommended 400 g. One third of the countries reported intake less than <300 g.

Comparative analysis of nutrition policies in the WHO European Region page 38
4. Less than half the countries conduct regular surveys on weight and height, with adults being most often monitored. Two countries are planning regular surveys in all age groups.
5. Few countries reported deficiencies of iron and vitamin A, mainly in CAR and CIS countries. Western European countries also reported iron deficiency anaemia. Iodine deficiency disorders appear to be a problem in more than half the countries, but not all use universal salt iodization; most countries iodize household salt only. Interventions against vitamin A deficiency include dietary advice, food fortification and supplementation.
Food and nutrition policy tools
Dietary reference values
Dietary reference values are sets of values for energy and specific nutrients used to indicate the intake levels needed to satisfy the physiologic requirements of healthy individuals. Of the 47 countries reporting, 23 countries used reference values developed by WHO, by the EU or by other countries. The Nordic countries (Denmark, Finland, Iceland, Norway and Sweden) published joint Nordic nutrient recommendations, as did the three German-speaking countries Austria, Germany and Switzerland (D-A-CH nutrient reference values). Three countries did not report the use of reference values, but dietary reference values are available in 44 countries. Ten countries had adopted the EU values for all nutrients, and another 10 had adopted the EU values only for some nutrients. Between 1991 and 2005, 24 countries revised their dietary reference values. The dietary reference values of different countries diverge greatly, mainly due to different concepts used. Food-based dietary guidelines
The nutrient targets derived from analysing the relationship between nutrient intake and disease prevalence or other scientific evidence have to be translated into food-based guidelines for the general population to understand them. Political action should include translating population nutrient goals into food-based dietary guidelines at the national level. It is fundamental that the health ministry endorses food-based dietary guidelines that are consistent and easily understood. Forty countries reported having food-based dietary guidelines, six more than observed in a survey conducted in 2002 (40). Eighteen countries revised the food-based dietary guidelines between 1992 and 2005 (Table 13). Albania and Bosnia and Herzegovina had no guidelines in 2002, but Albania has translated the countrywide integrated noncommunicable disease intervention (CINDI) dietary guidelines into Albanian, and Bosnia and Herzegovina has developed new guidelines for adults since 2003. In addition, Bulgaria, Georgia and Uzbekistan are currently developing food-based dietary guidelines. Most countries used a graphical representation of their food-based dietary guidelines. The model of choice appeared to be the nutrition pyramid, used in 20 countries, whereas 11 countries used a circle, especially countries in northern Europe, and 7 countries used a food plate for illustrating their guidelines. In 20 countries the health or public health ministry was responsible for producing and revising the dietary guidelines. In other countries, mainly the Baltic, Nordic and western European countries, a nutrition or health institute had the responsibility.

Comparative analysis of nutrition policies in the WHO European Region page 39
Table 13. Food-based dietary guidelines in countries in the WHO European Region
Member State
Food-based dietary
guidelines
Year Revised Year
revised Responsible authorities
South-eastern Europe
Albania No
Ministry of Health, Ministry of Agriculture and Food, Institute for Food Research
Bosnia and Herzegovina Yes 2003 Ministry of Health, Public Health Institute
Croatia Yes 2002
National Institute of Public Health, Ministry of Health and Social Welfare
Serbia and Montenegro No
Slovenia Yes 2001 Yes Not available The former Yugoslav Republic Macedonia Yes 2001 Republic Institute for Health Protection
Baltic states
Estonia Yes 1998 National Institute of Health Development
Latvia Yes 2002 Latvian Food Center
Lithuania Yes 2000
National Nutrition Center, Ministry of Health, Kaunas Medical University
CAR
Kazakhstan No
Kyrgyzstan Yes 2000 Ministry of Public Health
Tajikistan No Ministry of Public Health
Uzbekistan Yes 2000 Yes 2003 Department of the State Sanitary Inspectors
CCEE
Bulgaria Yes 1998 Yes 2005 Ministry of Health
Czech Republic Yes 1999 Yes 2005 Ministry of Health
Hungary Yes 2002 Yes 2002
National Institute of Food Hygiene and Nutrition and other experts
Poland Yes 2003 National Food and Nutrition Institute
Romania Yes Yes 1992 Ministry of Health
Slovakia Yes Yes 1995 Ministry of Health, Ministry of Agriculture
CIS
Azerbaijan No
Armenia Yes Ministry of Public Health
Belarus No Ministry of Public Health
Georgia Yes 2002 Yes 2005 Ministry of Labour, Health and Social Affairs
Republic of Moldova No Ministry of Public Health
Russian Federation Yes 2002 Not available
Ukraine Yes 2000 Ministry of Public Health
Nordic countries
Denmark Yes 1997 Yes 2005
Danish Institute for Food and Veterinary Research, Danish Fitness and Nutrition Council
Finland Yes 1998 Yes 2005
National Nutrition Council and Ministry of Social Affairs and Health
Iceland Yes 2002 Icelandic Nutrition Council
Norway Yes
National Nutrition Council and Directorate for Health and Social Affairs
Sweden Yes 2002 Yes 2005 National Food Administration
Southern Europe
Cyprus No
Greece Yes 1999 Ministry of Health and Social Welfare
Israel Yes 1998 Yes 2003 Ministry of Health
Italy Yes 1986 Yes 2003 National Institute for Food and Nutrition Research
Malta Yes 2001 Health Promotion Department
Portugal Yes 1989 Yes 1997 National Council for Food and Nutrition
Spain Yes Ministry of Health and Consumer Affairs
Turkey Yes
1980’s Yes 2004 Ministry of Health in collaboration with universities
Western Europe
Austria Yes 2000 Federal Ministry of Health and Women

Comparative analysis of nutrition policies in the WHO European Region page 40
Member State
Food-based dietary
guidelines
Year Revised Year
revised Responsible authorities
Belgium Yes 1995 Yes 2003 National Health Council
France Yes 2002 Ministry of Health and Solidarity
Germany Yes Yes 2004 German Nutrition Society
Ireland Yes 1995 Food Safety Authority, Nutrition Subcommittee
Luxembourg Yes 1999 Ministry of Health
Netherlands Yes 1986 Yes
2005–2006 Health Council, Dutch Nutrition Centre
Switzerland Yes Swiss Nutrition Council
United Kingdom Yes 1995 Food Standards Agency
SUMMARY
1. Most countries have dietary reference values in place; they either developed them on their own or use reference values from other countries. Half the countries with reference values have already revised them.
2. Food-based dietary guidelines are available in most countries, with the food pyramid as the most often applied graphic model. Half of these countries have already revised their guidelines.

Comparative analysis of nutrition policies in the WHO European Region page 41
Analysis of progress since 1994
The results from the three surveys in 1994–1995, 1998–1999 and 2003 are not completely comparable, as the numbers of respondents differed in the three analyses. However, even the greater response rate in the most recent survey indicated that more countries had in place a structure that could respond to the query from the WHO Regional Office for Europe. Food and nutrition policies in the European Region appear to have developed successfully in the past decade, with a noticeable improvement since the Regional Office launched the First Action Plan for Food and Nutrition Policy (Fig. 13–17). The number of countries with a national nutrition document or a document that contains food and nutrition policies, including documents not yet adopted, has increased from 24 to 45 since 1994. Similarly, the number of administrative structures to implement the food and nutrition policies increased from 19 in 1994 to 40 in 2005. Food-based dietary guidelines are now in place in at least two thirds of the countries, twice as many as a decade earlier. Most of the 52 countries in the European Region have in place or are developing a legislative framework for food safety, and many EU countries have specific national policies addressing food safety.
Fig. 13. Countries in the WHO European Region with a policy document including food and nutrition
0% 10% 20% 30% 40% 50% 60% 70% 80% 90% 100%
1994-1995
1998-1999
2005
Final document Draft No document No information
Fig. 14. Administrative structures for implementation in countries in the WHO European Region
0% 10% 20% 30% 40% 50% 60% 70% 80% 90% 100%
1994-1995
1998-1999
2005
Yes No No information

Comparative analysis of nutrition policies in the WHO European Region page 42
Fig. 15. Advisory bodies on food and nutrition in countries in the WHO European Region
0% 10% 20% 30% 40% 50% 60% 70% 80% 90% 100%
1994-1995
1998-1999
2005
yes no No information
Fig. 16. Dietary reference values in countries in the WHO European Region
0% 10% 20% 30% 40% 50% 60% 70% 80% 90% 100%
1994-1995
1998-1999
2005
Yes No No information
Fig. 17. Food-based dietary guidelines in countries in the WHO European Region
0% 10% 20% 30% 40% 50% 60% 70% 80% 90% 100%
1994-1995
1998-1999
2005
Yes No No information

Comparative analysis of nutrition policies in the WHO European Region page 43
SUMMARY
Food and nutrition policies in the European Region appear to have developed successfully in the past decade, with a noticeable improvement since the WHO Regional Office for Europe launched the First Action Plan for Food and Nutrition Policy. The number of countries with a national nutrition document or a document that contains food and nutrition policies, including documents not yet adopted, has increased from 24 to 45 since 1994, and most of the 52 countries in the European Region have in place or are developing a legislative framework for food safety.

Comparative analysis of nutrition policies in the WHO European Region page 44
How national nutrition policies reflect the first action plan for food and nutrition policy
Twenty-eight countries reported that the First Action Plan for Food and Nutrition Policy of the WHO European Region influenced their food and nutrition policies. The Netherlands stated that the Action Plan has supported existing policy and future actions. In 2005, the Serbian Ministry of Health established a working group for preparing the Serbian Nutrition Action Plan using the First Action Plan for Food and Nutrition Policy as a guideline. In Armenia, action was taken to realize the Food Provision Policy of the Armenian Republic, which reflects the objectives of the Action Plan, as does the Concept on National Policy for Healthy Nutrition of the Population of the Russian Federation up to the year 2005. The First Action Plan for Food and Nutrition Policy did not directly affect 20 additional countries, but it increased the profile of food and nutrition policies, leading to the establishment of programmes or initiatives dealing with nutrition. In the Baltic countries, the Action Plan served as a model for national plans and raised the priority of food and nutrition on the political agenda. The Nordic countries already had food and nutrition plans. Iceland has had a food and nutrition policy since 1989 and is revising it. Finland started to revise its nutrition action plan before the First Action Plan for Food and Nutrition Policy was adopted. The First Action Plan for Food and Nutrition Policy stimulated the creation of a Public Health Nutrition Network between the Baltic and the Nordic countries. Countries have different approaches to the integration of food and nutrition policies: some have a separate document on national food and nutrition policies, whereas others integrate nutrition in a general public health document. Hungary, Spain and Sweden included physical activity in their food and nutrition action plan. The national documents of Armenia and Kyrgyzstan focus on food policy or food security policy. Romania’s document focuses on environmental health, and Austria’s document is a strategy for sustainable development. Some policies are comprehensive and detailed with specific actions, including the responsible actors and definite time frames, such as the documents of Bulgaria, Estonia, Latvia, Lithuania, Slovenia, Sweden and the United Kingdom. The following section analyses how the Member States tackled the three strategic priorities (food safety, nutrition and sustainable food supply) and evaluates the presence of conditions required for implementing food and nutrition policies: the intersectoral approach, monitoring and evaluation, nutrition research, partnerships, training of professionals and advisory and coordination mechanisms.
Strategic priority 1 – food safety
The WHO strategy for food safety in Europe aims to develop and/or strengthen national food safety systems in Member States by promoting intersectoral initiatives for developing or strengthening modern food legislation, integrated surveillance of foodborne disease and food contamination monitoring, promotion of risk-based food control systems and effective risk communication. After the First Action Plan for Food and Nutrition Policy was adopted in 2000, the WHO food safety programme adapted to the European Region the WHO guidelines on assisting national authorities in developing and strengthening national food safety programmes (41). This document emphasizes that preventing foodborne diseases and protecting consumers are two essential elements of a food safety strategy and are the shared responsibility of national governments, the food supply chain sector and consumers. The document proposes the following model approach, addressing specific sectors of the food chain:
• assessing food safety needs at the national level – preparing a country profile

Comparative analysis of nutrition policies in the WHO European Region page 45
• preparing and implementing an intersectoral national food safety strategy
• evaluating food safety activities. Since 2002, the WHO food safety programme in Europe has been identifying with its Member States necessary elements for developing intersectoral national food safety strategies, in collaboration with national authorities, national food producers, consumer associations, academe, the FAO, the World Organisation for Animal Health, UNICEF, the EU and bilateral agencies (42). Close collaboration among all these parties is critical for developing and implementing harmonized food safety strategies in the European Region. In a series of national and subregional workshops, the WHO food safety programme in Europe has introduced and discussed with Member States essential elements that should be addressed in formulating an intersectoral national food safety strategy (43):
• collection of baseline information
• scientific risk assessment: basing decisions on the best available science
• an integrated food chain approach from farm to table
• legislation and enforcement for food safety
• engaging with consumers and motivating industry
• capacity-building
• performance indicators
• strategic planning – including food control plans
• health impact assessment. As a result of this collaborative effort at the national and subregional levels a policy document has been prepared and is being circulated for review among food safety agencies, international organizations and EU institutions (44). Of the 25 documents received as a response to the 2003–2005 survey on the development of national food and nutrition policies, 20 countries mentioned food safety among the first five priorities of their national policy. Many countries focus on foodborne diseases, especially Bosnia and Herzegovina, Germany, Israel, Lithuania and Poland. Other countries such as Israel, Romania, Slovakia and The former Yugoslav Republic of Macedonia have reported giving priority to improving legislation governing food. Most of the European Member States of WHO, 42 of 52, are members of the Codex Alimentarius Commission. As a result of the promotion of intersectoral national food safety strategies in Europe, several countries, including Kazakhstan, Kyrgyzstan, Ukraine and Uzbekistan, have joined the Codex Alimentarius Commission since 2002. Establishing or improving a surveillance system for foodborne diseases and for monitoring chemical and microbial food contamination is a goal of the national strategies of Bosnia and Herzegovina, Bulgaria, Croatia, Estonia, Georgia, Latvia, Lithuania, Portugal, Slovenia, Spain and Turkey. Many Member States have established food safety agencies, authorities or institutes to coordinate national food safety activities, to set up food standards and/or to separate risk assessment from risk management responsibilities. Countries such as Austria, Belgium, Croatia, the Czech Republic, Denmark, Finland, France, Germany, Greece, Hungary, Iceland, Ireland, Latvia, Lithuania,

Comparative analysis of nutrition policies in the WHO European Region page 46
Luxembourg, Malta, the Netherlands, Norway, Poland, Portugal, Romania, Spain, Slovakia, Sweden, Switzerland and the United Kingdom have established their own national agencies for food safety. Other countries such as Serbia and Montenegro, Slovenia and The former Yugoslav Republic of Macedonia are planning to set up such an agency for food safety, and Turkey also intends to establish an independent scientific national food authority. Reports from the survey reveal that countries such as Bosnia and Herzegovina, Finland and Hungary are especially concerned with informing the public, disseminating information and making citizens more aware of various food risks. Risk communication has become a key issue in all European countries in view of the potential of an avian influenza pandemic. Many countries in south-eastern Europe as well as Kyrgyzstan, Tajikistan, Turkmenistan and Uzbekistan have promoted food safety education in schools. The strategies set by Greece’s national nutrition policy include the promotion of quality and safety in mass-catering settings and the dissemination of documents informing the public about nutritional quality and food safety. The goals of the food and nutrition policies of Finland, Slovenia, Spain, The former Yugoslav Republic of Macedonia and Turkey reported training programmes for personnel working in food safety and regulations, food production and processing and hygiene education. The national documents of Estonia, Latvia, Lithuania and Spain mention promoting research on food contaminants and other risk factors. Bosnia and Herzegovina, Lithuania, Slovenia and Spain included in their strategies the implementation of an internal control system according to the principles of the hazard analysis and critical control point (HACCP) system in the whole food chain. Given that the Second Food and Nutrition Action Plan for the WHO European Region is being prepared, the WHO Regional Office for Europe is carrying out a specific survey on the national needs for developing a modern food safety system. The questionnaire sent to the countries is included in the guidelines for the assistance to national authorities in developing and strengthening national food safety programmes. The responses to this questionnaire provide a very detailed country profile on food safety issues.
Strategic priority 2 – nutrition
Feeding of infants and young children
Nutritional challenges vary as people progress through the life cycle. Good maternal nutrition is the necessary starting-point because of its importance to the fetus and the evidence that nutritionally related low birth weight raises the risk of cardiovascular disease in later life. Low birth weight (less than 2500 g) is the result of either preterm delivery or intrauterine growth retardation, which can be related to the poor nutritional status of the mother. Good nutrition during the first few years pays dividends throughout life (44). Analyses demonstrate that exclusive breastfeeding and the introduction of safe and adequate complementary foods from the age of six months, but not before, while breastfeeding continues, can reduce the short- and long-term burden of ill health. Early introduction of cow’s milk can also lead to iron deficiency, as the iron content and bioavailability of cow’s milk is low. It has also been argued that breastfeeding prevents adiposity later in childhood (45). Several studies suggested a relationship between type 2 diabetes mellitus and breastfeeding duration and early exposure (younger than four months of age) to cow’s milk protein (46,47), although further investigations are needed to confirm these claims. The global strategy for infant and young-child feeding (48) emphasizes the need for comprehensive national policies on feeding infants and young children, including guidelines to ensure the feeding of

Comparative analysis of nutrition policies in the WHO European Region page 47
infants and young children. The World Health Assembly adopted the Innocenti Declaration on the Protection, Promotion and Support of Breastfeeding as a basis for policy in 1991. Breastfeeding also represented a public health priority in the global strategy for infant and young-child feeding, which the Fifty-fifth World Health Assembly approved in 2002. The EU-funded Eurodiet (Nutrition & Diet for Healthy Lifestyles in Europe) project has strongly recommended the development and implementation of an action plan for promoting breastfeeding. In 2004, a blueprint for action called Protection, promotion and support of breastfeeding in Europe was presented in Dublin, Ireland at the European Union Conference on Promotion of Breastfeeding in Europe. The Regional Committee for Europe endorsed the European Strategy for Child and Adolescent Health in 2005 to help the Member States in developing policies from a life-course perspective and promoting multisectoral action (49). A survey undertaken in 2003 indicated that 15 of 29 Member States responding had a national plan on breastfeeding and 21 countries had a national breastfeeding committee (50). The survey also indicated that 20 countries listed breastfeeding or infant feeding among the top five priorities of nutrition policy. Data on breastfeeding provided by 37 countries here indicated that, in general, exclusive breastfeeding is a fairly established practice in the first month in most countries. However, exclusive breastfeeding rates drop very quickly after six months. The main form of child malnutrition in the European Region is growth retardation, indicated by low height-for-age. The prevalence of stunting, which is also associated with an increased risk of obesity later in life, is especially high in the CAR, Azerbaijan and rural Turkey, where it affects between 7% and 43% of children younger than five years of age. No specific action has been taken in this area. Only 11 countries regularly collect data on the dietary intake of infants. About the same number of countries conduct regular surveys on infants’ weight and height. However, only the Netherlands, the Russian Federation, Turkey and Ukraine survey both dietary intake and the weight and height of infants at the same time. Most of the countries of the former Soviet Union appear to have a system of regular surveillance of the weight and height of infants. Obesity
WHO calls overweight and obesity the biggest unrecognized public health problem in the world; they contribute substantially to both ill health and death in populations (51). The distribution of excess fat in the body has been recognized as an important predictor of ill health. Excess intra-abdominal fat is linked to a range of health hazards, including diabetes, a greater propensity to hypertension and dyslipidaemia and an increased risk of coronary heart disease and stroke. In recognition of the magnitude of the challenge, the WHO Regional Office for Europe is organizing a European Ministerial Conference on Counteracting Obesity in November 2006. Thirty-six countries provided data on overweight and obesity. Twelve countries conduct general weight and height monitoring of adults, but few countries monitor the whole population (the Czech Republic, the Netherlands, the Russian Federation and the United Kingdom). Another limitation of BMI surveillance in the Region is that data are often based on self-reporting and not measured by investigators. This leads to underestimation of the prevalence of obesity. Waist circumference should be included in the monitoring systems, but at present it is only measured in seven countries (Bosnia and Herzegovina, Finland, France, Greece, Ireland, Israel and the Netherlands). A national example of a monitoring system is the Spanish Obesity Observatory, which has the task of carrying out epidemiological surveillance and monitoring the obesity trend, to define indicators that will be used to measure the impact of the interventions and to coordinate and facilitate the exchange of experiences among other functions.

Comparative analysis of nutrition policies in the WHO European Region page 48
Many countries recognize the growing problem of obesity as a priority in their national strategies. Twenty-one countries mentioned obesity among the main priorities in their policy documents. Looking in detail at the national strategies, countries use different approaches to tackle obesity. Few countries have a specific obesity action plan or strategy. Denmark developed the first action plan specifically against obesity in 2003, followed by the Spanish strategy for nutrition, physical activity and prevention of obesity in 2004 and the Irish strategy on obesity and policy challenges and Portugal’s national programme against obesity in 2005. The Netherlands, Norway and the United Kingdom developed a separate document on physical activity to supplement a public health or nutrition plan. France strongly emphasizes overall health promotion, rather than combating specifically obesity. France aims to counteract nutrition-related diseases by promoting healthy nutrition and physical activity in general. In contrary, Portugal’s national programme against obesity 2005–2009 focuses not only on preventing but also on treating obesity but is integrated in the National Health Plan 2004–2010. National interventions aiming at preventing obesity on the micro level take place in schools, universities and workplaces, in general having a multiple approach addressing education, food availability and physical activity. Many countries act not only on the micro level but recognize that health promotion requires an environment that supports healthy lifestyles. Countries using such an environmental approach address the urban environment, the supply side, collaborating with the food industry on modifying food composition and portion size and considering market interventions, which can include taxation, subsidies and legislations. Several countries use or consider fiscal measures such as taxing unhealthy foods and providing incentives to encourage the supply and the consumption of healthy foods or access to physical activity. Norway’s policy document specifically suggests lowering the prices of fruits and vegetables and increasing taxes on energy-dense and nutrient-poor foods. Marketing that targets children is also a main concern of national obesity strategies. In this respect, most countries seem to rely on self-regulation. For example, Spain’s Código PAOS, a code for self-regulation of advertising of food products directed at minors, was introduced in 2005 and is included in the framework of the Spanish strategy for nutrition, physical activity and prevention of obesity, with the aim of reducing the prevalence of overweight and obesity and their consequences. The industry can adopt the code on a voluntary basis, but signing the code commits the companies to specific criteria regularly monitored by a commission. Various countries are especially concerned with obesity in children. In Italy, for instance, a National Plan of Prevention was launched in which childhood obesity is a key priority. Obesity prevention in children is also a special focus in Croatia’s school initiative. Tackling childhood obesity is also the first priority set by the Greek National Nutrition Policy Committee, and an action plan is ready to be implemented. Further, the Czech Republic and Tajikistan are planning to develop an action plan counteracting obesity. Chronic noncommunicable diseases
Chronic noncommunicable diseases account for most of the premature deaths in the WHO European Region. Mortality rates vary widely between the eastern and western countries of the Region. For example, deaths from coronary heart disease are declining steadily in EU countries, whereas most eastern countries have increasing rates. In the CCEE and CIS countries, coronary heart disease mortality is almost double that in the EU and still rising in many countries (52). In May 2004, the Fifty-seventh World Health Assembly endorsed the WHO Global Strategy on Diet, Physical Activity and Health. The strategy addresses two of the main risk factors for noncommunicable diseases, diet and physical activity, and advocates multisectoral and multiple-stakeholder actions to improve them. WHO Regional Committee for Europe resolution

Comparative analysis of nutrition policies in the WHO European Region page 49
EUR/RC54/R4 (2004) requested the Regional Director to continue the process of preparing a comprehensive action-oriented European strategy on noncommunicable diseases with a strong focus on implementation, in collaboration with Member States, intergovernmental agencies, nongovernmental organizations and other relevant partners, including industry, as an integral part of the updated HEALTH21 policy framework, taking into account pre-existing commitments of Member States and relevant strategies and to present it to the Regional Committee at its fifty-sixth session in September 2006. Concern about noncommunicable diseases or, specifically, cardiovascular diseases and cancer is part of the objectives of 20 Member States. CAR and CIS countries did not specifically include prevention of cardiovascular diseases among the main objectives of their national nutrition policies, whereas Georgia has a separate cardiovascular disease prevention programme. The noncommunicable disease burden can be effectively reduced by reducing the intake of saturated and trans-fatty acids and replacing them with monounsaturated and/or polyunsaturated fat; increasing the consumption of omega-3 fatty acids from fish oil or plant sources; avoiding excessively salty or sugary foods; consuming a diet rich in fruit and vegetables, nuts and whole grains and low in refined grains; maintaining a healthy body weight; and getting at least 30 minutes of regular physical activity daily. The dietary guide issued by WHO’s CINDI programme recommends 12 steps to healthy eating including eating at least 400 g of vegetables and fruits every day. Intake data from dietary surveys indicate that a sizeable proportion of the population has achieved this goal in only a few countries, mostly in southern Europe. Most western European countries and some Nordic countries included the promotion of fruit and vegetables in their objectives, but this is also part of national policies in countries with higher intake, such as Greece and Israel. CAR and countries in south-eastern Europe have low intake but do not specifically mention promoting fruit and vegetables in their main objectives. Trends in fruit and vegetable intake in six countries showed increased intake in Austria, Denmark, Iceland, Norway, Sweden and the United Kingdom. In these countries, increasing fruit and vegetable intake was part of the food and nutrition policy priorities, and school or workplace fruit promotion programmes were in place. Micronutrient deficiencies
Iodine, iron and vitamin A are the main micronutrients for which people’s marginal or low socioeconomic status creates a public health problem in the Region. Other micronutrients mentioned in the national policies are folate (Denmark, France and Latvia), vitamin D (Denmark, Finland and France) and calcium (Czech Republic, France and Germany). Twenty countries have the objective of reducing micronutrient deficiency in general. Eight national policies mention iron deficiency anaemia among the top priorities, and 13 national policies mention IDD as a top priority. Concerning interventions, all countries with severe IDD have universal salt iodization, except for Turkey, where household salt is iodized. Countries with high iron deficiency anaemia, such as CIS countries and CAR, have interventions against iron deficiency anaemia. These are also the regions where vitamin A deficiency presents a problem: they are intervening at least with dietary advice and also with supplementation or fortification in some countries.

Comparative analysis of nutrition policies in the WHO European Region page 50
Strategic priority 3 – sustainable food supply
Agricultural policy regulates the production of food and other agricultural products, food safety and price levels. National food and agricultural policies should be consistent with the protection and promotion of public health. In the EU, the Common Agricultural Policy (CAP) regulates production, price, international trade with and marketing of agricultural products, rural development, farmer’s income and occupational health. Besides the high costs (almost 50% of the total EU budget), it has been criticized for increasing public health costs, by subsidizing butter production, while fruit and vegetable prices are kept high (53). The EU now gives considerable attention to the environmental consequences of agricultural practices and the need for reform (54). The intensification of agriculture to increase output in the countries in the eastern part of the European Region has also caused unwanted side effects. An FAO review (55) indicated that the environmental problems in these countries resulting from intensive agricultural methods threaten the sustainability of the production process. Local and less intensively produced crops should be promoted, as they are important in sustaining food supplies and are better able to maintain both plant and animal biodiversity and to preserve landscapes and wildlife. The WHO Regional Office for Europe produced the Urban and Peri-urban Food and Nutrition Action Plan (56), which includes community action to promote social cohesion and to reduce inequality through local food production for local consumption. Food security means access to enough food for an active, healthy life, ensures the sustainability of supplies and is linked to environmental concerns and economy. Some people in the European Region do not have access to adequate food supplies due to social inequality. The CCEE, CAR and CIS subregions have experienced a startling economic decline between the late 1980s and the mid-1990s. The number of poor people rose drastically, which also affected the nutritional status of the population. In the CCEE, CAR and CIS subregions, an estimated 26 million people are undernourished (57). Household food insecurity (average expenditure on food as a percentage of total household expenditure) is extremely high in CAR and CIS as well as Romania. This survey revealed that the strategies of 14 countries, out of 25 available food and nutrition policy documents, were concerned with food security. CIS countries, CAR and south-eastern European countries and some CCEE are concerned mainly with increased production in general: other countries such as Bosnia and Herzegovina, Croatia, Latvia and Norway focus in particular on sustainable, biological and local food production. The countries show different approaches to tackling the sustainable food supply strategy. One objective all national documents have in common is promoting local sustainable and in some cases environmentally sound food production. Spain and Portugal emphasized the importance of traditional methods of production. The strategic documents of Bosnia and Herzegovina, Georgia and Slovenia mention stimulating the development of rural economies, social cohesion within rural societies and increasing employment opportunities at the local level. Estonia plans to act with a stable price policy on domestic agricultural production, and Bulgaria intends to stimulate domestic food production with technical and financial aid. Denmark and the United Kingdom encourage increased access to healthy food, as choosing healthy food must become the easy choice.
Implementation tools
Advisory, coordination and implementation structures
The results of this survey show that most countries have an administrative structure responsible for implementing the food and nutrition policies, although others are planning to set one up. In most of the countries this is either the health ministry, a group of several ministries or a different institute.

Comparative analysis of nutrition policies in the WHO European Region page 51
Only 13 of the 40 structures of implementation were considered effective, whereas more than half the institutions appear to be only partly effective. The reason mentioned most for ineffective institutions was lack of financial support, followed by the lack of coordination, lack of political support and lack of expertise. Inadequate legislation and lack of a scientific basis were also mentioned. The key role of a national coordination mechanism, such as a food and nutrition council, is to provide the government with advice on developing, implementing, monitoring and evaluating comprehensive, intersectoral policies, guidelines and action plans. It should be more than just technical and scientific advice and should act as a gateway between evidence and policy and examine obstacles to policy coherence. In addition, such a national body can be responsible for ensuring the consistency of the information various agencies give to the general public. Monitoring the nutrition situation, but also implementation and progress, examining the goals and their achievements and conducting or encouraging research should be part of its tasks (58). Thirty-seven countries in the European Region appear to have such an advisory body. Since 2002, the WHO food safety programme in Europe has promoted the establishment of interministerial coordinating committees for food safety issues in countries lacking this mechanism by organizing intersectoral national workshops. Ministries invited to these coordinating committees include the ministries responsible for health, agriculture, trade, industry, environment and education and standards agencies. In addition, food producers, consumers’ associations and universities were also participating in these committees. In several CIS countries and CAR, these coordinating committees have become the base of the national Codex Alimentarius committees. Currently 30 countries in the European Region have a food safety agency, authority or coordinating body. Policy councils have a long history in the Nordic countries. Norway’s National Council for Nutrition founded in 1999 is based on the National Nutrition Council founded in 1946, the first recorded nutrition council. The National Nutrition Council of Finland was founded in 1954 (Box 1) and the Danish Nutrition Council (now the Danish Fitness and Nutrition Council) was founded in 1998. The tasks of Norway’s National Council for Nutrition are to establish guidelines for food supply and nutrition policy to promote public health and to encourage agriculture. It acts as a chief advocate for national nutrition policy and has played a major role in initiating and adopting policy. Apart from submitting proposals to the authorities, the National Nutrition Council of Finland also observes and monitors the development of nutritional issues and is involved in implementing the nutrition recommendations. In the United Kingdom, the Food Standards Agency was announced in 1997 with a technical support role rather than a policy advisory role (58). Setting up an intersectoral advisory and coordinating body is also a goal of Croatia’s and Georgia’s nutrition action plans. Croatia’s coordinating body should provide major policy guidelines and set intersectoral mechanisms for the implementation, monitoring and evaluation of national plans.

Comparative analysis of nutrition policies in the WHO European Region page 52
Box 1. Examples of mechanisms for coordinating food and nutrition in countries in the WHO European Region
National Nutrition Council of Finland
The Council was appointed in 1954, and the members of the Council serve three-year terms. The Council comprises representatives of various interest groups from agriculture, the food industry, health care, education, consumer organizations and research organizations. The Council has the following tasks:
• to submit motions and proposals to the authorities and issue statements concerning nutrition and health;
• to submit reports and issue statements concerning action needed in food production, food processing and food distribution in order to eliminate any nutritional health hazards and to improve the nutritional situation in Finland;
• to observe and monitor how official nutrition recommendations are fulfilled; and
• to observe, monitor and submit motions and proposals concerning the development of nutritional issues in Europe.
Irish Taskforce on Obesity
The Irish Taskforce on Obesity strives to achieve an Irish society that enables people through health promotion, prevention and care to achieve and maintain healthy eating and active living throughout their lifespan. Its responsibilities are:
• to provide an integrated and consistent proactive approach to addressing overweight and obesity;
• to implement, monitor and evaluate the National Strategy on Obesity in conjunction with all government departments, relevant bodies and agencies, industry and consumer groups; and
• to deal with research on best practice in preventing, detecting and treating obesity and how best to create social and physical environments that make it easier to eat more healthily and be more active.
Intersectoral policy
Agriculture and other non-health sectors have prime responsibility for the food chain. The various parties involved may hold contradictory opinions: food producers and consumers, economy or trade ministers and those responsible for social affairs, representatives of domestic consumption and export markets and those advocating traditional food values or modern trends. One of the first steps in developing an effective food and nutrition policy is to harmonize these opinions and ensure good collaboration between them (Box 2) (1). Not even half the countries in the Region appear to have such collaboration between ministries, such as those responsible for health, agriculture, education, economy, finance and social affairs, and the public and private sector, including the food industry and nongovernmental organizations. In some countries ministries collaborate with each other but not with the private sector. In five countries the health ministry does not collaborate with any other sectors at all. The reasons stated for the lack of collaboration were frequent changes in ministries, changes in political situation, difficulty in

Comparative analysis of nutrition policies in the WHO European Region page 53
visualizing common goals, lack of a legislative framework, lack of definition of responsibilities and lack of effective coordinating bodies. Strengthening the collaboration between sectors is one way forward. To help Member States and health ministries in particular, the WHO Regional Office for Europe has developed (jointly with WHO headquarters) guidelines on developing intersectoral policy for decision-makers. Intersectoral workshops on policy-making were carried out for many CCEE, countries in south-eastern Europe, Baltic countries and CAR during 2000 and 2005. Among the essential elements proposed by the WHO food safety programme for the development of intersectoral national food safety strategies within the First Action Plan for Food and Nutrition Policy, WHO European Region, 2000–2005 are the implementation of an integrated food chain approach from farm to table, the engagement with consumers and the motivation of the food industry. Understanding policies (such as tax, agricultural or environmental policies) that unintentionally affect nutrition and health although they are not specifically designed to address them is also important. The tools of health impact analysis could highlight their actual influence but have not yet been developed and used throughout these policies.

Comparative analysis of nutrition policies in the WHO European Region page 54
Box 2. Examples of mobilizing stakeholders within food and nutrition in countries in the WHO European Region
Spain
The Ministry of Health and Consumer Affairs has signed several collaboration agreements with the private sector. Netherlands
The parties to the Covenant on Overweight and Obesity are:
• Minister (and State Secretary) of Health, Welfare and Sport (administrative authority);
• Minister of Education, Culture and Science (administrative authority);
• Dutch Food Industry Federation;
• Royal Association of Businesses in the Hospitality and Related Sectors;
• Food Retail Board;
• Association of Dutch Care Insurers;
• Confederation of Netherlands Industry and Employers;
• Royal Association MKB-Nederland;
• Netherlands Olympic Committee * Netherlands Sport Confederation; and
• Association of Dutch Catering Organizations. The parties to the Covenant agree to each look for ways in which they can contribute, through their own activities and role in society, to achieving the government targets on overweight set out in the policy document Living longer in good health: also a question of healthy lifestyle. The Ministry of Health, Welfare and Sport set up a project office to encourage and support the parties to the Covenant, to organize activities and to ensure cohesion and synergy. Civil-society partners or other parties can apply to the Ministry of Health, Welfare and Sport to join the Covenant. Germany
Diet and physical activity platform
The platform was created in 2004 with the aim to prevent overweight among children and adolescents. It has about 100 members from scientific institutions, professional associations and the private sector. An expert committee with scientists from various areas supports the platform scientifically. In 2005, an office was created to coordinate the activities of the platform. Partnerships at the local, national and European levels
Partnerships at the local, national and European levels are the key to reducing food-related ill health. Denmark provides examples of good partnerships, with a long and constructive tradition of close cooperation in carrying out society’s tasks, such as between voluntary organizations and the public sector, between employees and employers and between parents and schools. The Government of Denmark urges that more and new types of partnerships be established in health promotion and disease prevention. Building partnerships with relevant stakeholders is an aim in such countries as Denmark, Ireland, the Netherlands, Portugal, Sweden and the United Kingdom (Box 3).

Comparative analysis of nutrition policies in the WHO European Region page 55
Box 3. Examples of partnerships within food and nutrition in countries in the WHO European Region
Denmark
An example of a partnership is the Six per Day Campaign, in which the Danish Veterinary and Food Administration, Danish Fitness and Nutrition Council, Danish Consumer Information, National Board of Health, Danish Cancer Society, Danish Fruit, Vegetable and Potato Board and the Marketing Committee of the Danish Horticultural Marketing Board cooperate in promoting the consumption of fruit and vegetables in Denmark. United Kingdom
Local communities must be engaged in improving nutrition and health. Isolated action will have only a limited impact and a partnership approach is required. Primary care trusts and local authorities, working through local strategic partnerships, bringing together local authorities, other public services and private, voluntary and community sector organizations to work with residents to improve local areas and services. They have a key role to play in supporting healthy eating in communities. They will need to ensure that they are working closely on strategies to encourage and promote access to, healthy eating, through local retailers, food-growing schemes, developing cooking skills, food cooperatives and community lunches, but will be supported by national and regional action, in particular, the national 5 a Day programme. The government has also produced Creating healthier communities: a resource pack for local
partnerships as part of the implementation of the Choosing health? Choosing a better diet white paper. This provides practical guidance on working in partnerships, targeting action and using tools such as local area agreements and overview and scrutiny arrangements, including specific guidance on healthy eating initiatives with communities. The WHO Regional Office for Europe already collaborates with United Nations bodies, notably UNICEF, FAO, the United Nations Development Programme, the United Nations Environment Programme, the World Organisation for Animal Health and the World Bank, investment banks, the European Commission, the European Food Safety Authority, the Council of Europe and other organizations working on food and nutrition policy. The Regional Office seeks to strengthen and expand these partnerships and to share its information, networking capabilities and experience with these and new partners. Monitoring and evaluation
Monitoring
Health data are essential for monitoring the health of the population, for evaluating the effects of health interventions and for facilitating the development of food and nutrition policy. Most countries have data available on breastfeeding and on dietary intake for adults, but data on nutritional status and dietary intake are often collected using different protocols, and less than half the countries in the Region collect data regularly. The Netherlands and the United Kingdom seem to have established the most comprehensive surveillance systems that provide information on food consumption on a routine basis. In the United

Comparative analysis of nutrition policies in the WHO European Region page 56
Kingdom, nutritional status is also measured regularly. The CIS countries, especially Belarus, the Russian Federation and Ukraine, also indicated that they have established regular surveys in all or at least most of the population groups. Indicators are tools for monitoring trends in a specific area. Selected indicators can determine whether the trends are in the desired direction. Indicators can thus contribute to identifying challenges and indicating the need for initiatives. The CINDI indicator programme is important here. The central aim in CINDI evaluation is to compare trends in different countries and to demonstrate areas with different background situations and intervention experiences. The CINDI protocol and guidelines specify the core indicators and the methods to be used for measuring them for international collaboration. The member countries supply this information to the international CINDI Data Management Centre. Twenty-six of the 52 countries in the European Region are part of the CINDI programme, although in some countries only regional and not national data are collected (59). The EU initiated the health monitoring programme in 1996 with the aim of establishing a platform for a health monitoring system, coordinated by the European Core Health Indicator project in 2001. The plan is to set up the utility of a European surveillance system on the indicators and determinants of health status for future measurement of health status, trends and determinants throughout the EU (60). To cover all the relevant areas of public health nutrition, indicators for seven main categories were identified: health promotion, food and nutrient intake, breastfeeding and alcohol, nutritional status, physical activity habits and fitness, sociodemographic factors and inequality. In the EU, 13 of the 15 countries that were members before May 2004 (except France and Luxembourg) have data available on the priority indicators on nutrition intake (such as fruit, vegetable, fish and meat consumption, saturated fatty acids and vitamin content). Breastfeeding data is available in all countries but to a limited extent in Denmark, France, Italy and Luxembourg (61). The Nordic Council of Ministers has also initiated the development of a set of indicators for sustainable development in the Nordic countries. Special indicators for social and health factors will be developed in connection with this. Further, one of the main objectives of the 2005 Spanish strategy for nutrition, physical activity and prevention of obesity, the Hungarian Strategy for Healthy Nutrition, Food Safety and Regular Physical Activity and Finland’s food and nutrition policies is monitoring and surveillance (Box 4). Scientific surveillance and monitoring the nutritional status of the population are also objectives in the nutrition policies of Bosnia and Herzegovina, France and Lithuania. Croatia, Estonia, Hungary, Latvia, Slovenia and Switzerland included the creation or improvement of a food composition or risk factor database in the surveillance system. Surveillance of foodborne diseases is one of the essential elements of the food safety strategy in the European Region and is carried out in 46 countries. Fifty-one countries participate in the WHO Food Surveillance Programme for the Control of Foodborne Infections and Intoxications in Europe. The objectives of the Programme include: identifying the causes and epidemiology of foodborne diseases in Europe, disseminating information and supporting national authorities in reinforcing their surveillance systems. The Programme has had a major role in standardizing data collection across Europe and improved reporting. Currently the Programme has a solid network of national contacts in 51 countries that have been reporting official national data for hazard identification and for the analysis of trends in the European Region during the past 25 years (42,62). The promotion of integrated foodborne disease surveillance is one of the essential elements proposed by the WHO food safety programme for the development of intersectoral national food safety

Comparative analysis of nutrition policies in the WHO European Region page 57
strategies within the First Action Plan for Food and Nutrition Policy. This is done in collaboration with the WHO Global Salmonella Surveillance (GSS) network by building the national capacity of clinical, veterinarian and food microbiology reference laboratories and of the epidemiological services for the integrated surveillance of foodborne diseases. Most countries in the WHO European Region are members of the WHO GSS network. Food contamination monitoring is part of one essential element in developing intersectoral food safety strategies for the provision of baseline data and information for microbiological and chemical risk assessment. Most of the EU countries have in place or are planning to set up systems or programmes for monitoring chemical food contamination, but most of the other countries in the European Region do not have adequate infrastructure to run these systems at the national level. The situation in relation to monitoring of microbial food contamination is similar and even more limited. The WHO food safety programme is promoting the participation of Member States in the Global Environmental Monitoring System for Food (GEMS/Food) assessment of contamination and exposure in Europe. Thirty-five countries are participating in GEMS/Food, but only 12 countries provide chemical food contamination data regularly. GEMS/Food in Europe has been building the national capacity of Member States to monitor food contamination and to assess the exposure to chemical contamination through the total diet. To support the collection and dissemination of data the Operational Programs for Analytical Laboratories (OPAL) software and the Summary Information on Global Health Trends (SIGHT database) have been developed (63). GEMS/Food in Europe promotes the collection of information on the levels and time trends of chemicals and persistent organic pollutants in foods and the total diet as well as in human milk. The fourth WHO/UNEP Global Survey of Human Milk for persistent organic pollutants was launched recently, and 20 European countries are participating in this survey (64).

Comparative analysis of nutrition policies in the WHO European Region page 58
Box 4. Examples of monitoring systems for food and nutrition policy in countries in the WHO European Region
Denmark’s health indicator programme includes indicators for all the priority areas for risk factors (tobacco smoking, alcohol consumption, diet, physical activity, obesity, accidents, working environment and environmental factors), target groups (pregnant women, children, young people, vulnerable and distressed adults, elderly people and chronically ill people), settings for health promotion (schools, child-care centres, workplaces and the health care services) as well as key indicators for health promotion by the public sector. The health indicator programme will be developed and updated continually. The purpose of the catalogue of indicators is to ensure the continued monitoring and documentation of trends in a clear way based on a relevant selection of the great quantity of statistics and data that are produced. The indicator programme has two parts:
• key indicators: a set of overall indicators that describe trends and results in relation to the overall targets of Healthy throughout Life – the targets and strategies for public health policy
of the Government of Denmark, 2002–2010; and
• a detailed, specific set of indicators describing the trends and results for each priority area in relation to the targets and collective challenges in Healthy throughout Life.
The Finnish National Nutrition Surveillance System was launched already in 1995 with the purpose of collecting, interpreting, evaluating and distributing data on nutritional status and to assess the need for measures to promote nutrition and health policies. In addition it communicates nutritional data to health care professionals, researchers, teachers, journalists and those working in the food industry, trade and mass catering. The Spanish strategy for nutrition, physical activity and prevention of obesity proposes creating an Obesity Observatory, which, like Finland’s approach, will include various sectors. The Observatory is carrying out epidemiological surveillance and monitoring of the obesity trend and defining the indicators that will be used to measure the impact of the interventions among several other tasks. The public health observatories in the United Kingdom play an important role in collecting, analysing and reporting health data on the national and local levels. Evaluation
Surveillance systems can measure whether an intervention produces the desired changes in mortality or morbidity, but results are not achieved until several years after a policy is implemented. In contrast, process evaluation monitors how a policy or intervention is implemented. A process evaluation assesses how a health initiative achieves its effects and includes evaluating the resources used and describing the activities implemented and outputs achieved. Few of the national nutrition documents included a process evaluation in their strategies. Denmark’s health indicator programme and the Spanish strategy for nutrition, physical activity and prevention of obesity specifically mentioned process evaluation. An evaluation of the national food and nutrition action plans in the EU countries undertaken before Spain’s strategy was launched argued that all action plans except for Denmark’s poorly outlined monitoring and evaluation systems (65). A useful tool for policy-makers is a WHO publication that summarizes the core features of approaches for evaluating health promotion initiatives: participation, multiple methods, capacity-building and appropriateness (66).

Comparative analysis of nutrition policies in the WHO European Region page 59
A food safety strategy should include multi-year plans for achieving targets that have been set following public consultation. Such targets may include reducing the incidence of foodborne disease caused by specific microorganisms, improving the labelling of food and improving the effectiveness of food law enforcement systems. The establishment of national performance or progress indicators for evaluation is one of the essential elements for the development of national food safety strategies in Europe (Box 5). Organizations at the national, regional or local level can benefit substantially by benchmarking their performance against that of their peers. Performance and/or process benchmarking should be established at all levels from national strategies, through to organizational and even individual performance (43). In the framework of the EU project for establishing an Environment and Health Information System in Europe, environment and health indicators have been developed to contribute to the overall evidence base for health policies in the European Region of WHO. The WHO food safety programme has collaborated with the Environment and Health Information System in Europe project in developing indicators on the dietary exposure assessment to potentially hazardous chemicals monitored in children’s food and on the monitoring of persistent organic pollutants in breast-milk (64).
Box 5. Ireland’s efforts to promote food safety
The Food Safety Authority of Ireland has been promoting the evaluation of the mass catering and food establishment by consumers. In particular, the Food Safety Authority of Ireland ran a very effective campaign “Vote with your feet”, advising consumers to complain to the Food Safety Authority of Ireland about poor hygiene standards in food establishments. The Food Safety Authority of Ireland places information about food businesses against which action has been taken by way of a closure order or hygiene improvement order (http://www.fsai.ie/enforcement/index.asp). This mechanism stimulates proactive competition among food establishments. Research
Noncommunicable diseases impose a significant economic burden on already strained health systems and inflict great costs on society. Health is a key determinant of development and a prerequisite for economic growth. The WHO Commission on Macroeconomics and Health has demonstrated the disruptive effect of disease on development and the importance for economic development of investment in health. Programmes aimed at promoting healthy diets and physical activity for preventing disease are key instruments in policies to achieve development goals (8). Providing scientific evidence is crucial for every policy decision. Some countries have mechanisms for providing information on nutrition, food safety and food security. Developing integrated policies requires evolving systems for ensuring closer interaction between both scientists and policy-makers in health, agriculture and the environment (67). A good example of this is the Wanless report, a publication commissioned by Her Majesty’s Treasury and the Department of Health in the United Kingdom, which provides information on the economic evaluation of different health scenarios (68). Economic evaluation is becoming established globally as one of the tools for decision-making in health care, given that resources are scarce and should be used as effectively as possible. As the

Comparative analysis of nutrition policies in the WHO European Region page 60
Wanless report stated, the body of economic evidence relating to public health interventions is small compared with that related to health care (Box 6). Achieving the objective of allocating funding more efficiently between health care and public health requires using similar analytical methods for both. The National Institute for Clinical Excellence (NICE) in the United Kingdom has developed its methods soundly since its establishment and use of its framework for rigorous evaluations of all interventions, covering health care and public health, offers a practical way forward (69). Type 2 diabetes mellitus was investigated in detail to assist the search for conclusion about the management of chronic diseases and to suggest a framework for analysing their cost-effective management. Utilizing a framework based on the NICE methods, lifestyle interventions aimed at people who are overweight and have impaired glucose tolerance have been shown to be cost-effective, with incremental costs of £11 600 to £20 000 per quality-adjusted life year (70).
Box 6. Example of economic evaluation of national food and nutrition policy
Economic evaluation has been carried out in Sweden, showing that the direct costs of obesity and obesity-related diseases are currently about SKr 3.6 billion (€420 million) per year, and the indirect costs of sick leave and early retirement caused by obesity are SKr. 12 400 million (€1330 million) (71). If the prevalence of obesity continues to increase at the same rate as in the 1990s, an estimated 60% of Swedes will be overweight or obese by 2030, which would mean that the costs of obesity to Sweden’s health care system would increase by 120% between 2003 and 2030. This would be unsustainable in both health and economic terms. To identify the most cost-effective measures for society, cost–effectiveness analysis should be carried out. A consortium will therefore be set up with representatives from various research councils with the aim of initiating several long-term research projects, mainly intervention research concerning diet and physical activity. Some of the relevant areas of research will be developing and testing methods for evaluating the cost-effectiveness of interventions to promote healthy dietary habits and increased physical activity and research into societal costs for unhealthy dietary habits, physical inactivity and the consequences of these, such as overweight and obesity. A main objective of France’s National Nutritional Health Programme 2001–2005 has been to develop epidemiological, behavioural and clinical research into human nutrition and therefore set up the European Food Reference Network with the objective of developing wider research programmes between public sector and socioeconomic partners in agriculture, food manufacturing, retailing and consumer affairs. Organized in consortiums – or groups of complementary scientific programmes – this Network will have various components, covering microbial safety, food science and human nutrition. The latter is directed towards studying dietary behaviour and preventing major illnesses (cancer, obesity and cardiovascular disease) using nutrition. Economic research analysing the immediate costs and benefits (such as the reduction of prescriptions for examinations or tests, medicines and the number of consultations for each prevention activity) will be encouraged. Estonia, Finland and Latvia emphasized nutrition research in their strategies. The recommendations of the research on nutrition of Finland’s National Nutrition Council are mentioned among the fields of action. Research on nutritional status, the factors influencing it and the impact of nutrition on health, food composition and of special population groups will be fostered. In Sweden and the United Kingdom, a consortium responsible for research on diet, physical activity and nutrition-related diseases will be established. In the Netherlands, an Obesity Knowledge Centre will stimulate the coherence between various research projects on obesity.

Comparative analysis of nutrition policies in the WHO European Region page 61
Lack of financial resources is often the limiting factor for good research, and the need for interdisciplinary projects can become problematic regarding planning and financing when different disciplines are involved. Sweden’s action plan for healthy dietary habits and increased physical activity suggests approaches similar to those used for selecting projects within the EU framework programme as a possible solution. Scientific risk assessment – basing decisions on the best available science – is one of the essential elements proposed by the WHO food safety programme for developing national food safety strategies within the First Action Plan for Food and Nutrition Policy. Most countries in the European Region agreed at the FAO/WHO Pan-European Conference on Food Safety and Quality that risk analysis must form the foundation on which food safety policy is based (72). Scientific risk assessment is one of the key elements of risk analysis. Competent authorities in many European countries are improving access to high-quality scientific advice for this purpose. Food safety agencies obtain scientific evidence in house and from expert committees, academic and research associations or regional or international sources of scientific data. In this context the WHO food safety programme in Europe promotes the liaison, interaction and collaboration between national risk assessment bodies and those at the international level such as the Joint FAO/WHO Expert Committee on Food Additives, the Joint FAO/WHO Meeting on Pesticide Residues, the Joint FAO/WHO Expert Meetings on Microbiological Risk Assessment and the European Food Safety Authority. Training of health staff
Many health professionals do not receive enough training in food hygiene, nutrition and the benefits of physical activity. In the First Action Plan for Food and Nutrition Policy, WHO called for policies to clearly define the role and required training of different health specialists in relation to food safety and nutrition, in order to promote health throughout the life cycle. The implementation of effective and combined strategies requires people trained and competent in public health nutrition. This calls for proper training and monitored common standards of training, leading to the development of comparably skilled and competent individuals (Box 7). In the EU, this is being realized through the postgraduate European Master Programme in Public Health Nutrition, supported by the European Commission (73). Many of these professional groups lack or have inadequate competence regarding food, physical activity and the link with health and especially how this knowledge can be disseminated to motivate changes in behaviour. This is especially important for vulnerable groups and groups with different ethnic backgrounds. A recent survey found considerable deficiencies in the teaching of diet and nutrition in education, care and nursing programmes. Nutritional science and dietetics was not part of the course plan for child-care, after-school care or teacher training programmes. The same applied to nursing programmes and care programmes in which nutritional science was not offered as an independent subject (74). France determined that nutrition is an inadequately taught discipline in the various strands of health and is therefore defining the functions and professions allied to nutrition and adapting professional training to current challenges. As stated in its nutrition strategy, Hungary is also planning to provide continuing education in the latest achievements of nutritional science and food safety among professionals in charge of public meal provision and mass catering. The key component is support for a system based on a firm foundation of postgraduate public health training of international standards that will be offered in Hungary. Bulgaria planned various activities on professional nutrition training to include nutrition principles in the education of medical students, students of the

Comparative analysis of nutrition policies in the WHO European Region page 62
catering and hotel business, food producers and traders and offering a postgraduate curriculum on nutrition and dietetics. Likewise, Estonia’s and Lithuania’s action plans integrate nutrition into the education of various subjects, such as health care, social welfare and food professionals in manufacturing and marketing. Bosnia and Herzegovina, Israel, the Netherlands, Slovenia and Turkey also emphasize the nutrition education of professionals in their nutrition policies. Most European countries have identified capacity-building as an essential element for developing their national food safety strategies. The WHO food safety programme has developed training materials for providing technical assistance to Member States in the following areas:
• development of intersectoral food safety strategies and policies;
• development of food legislation, update of food safety legislation and Codex Alimentarius work;
• training of trainers on laboratory-based surveillance of foodborne diseases and epidemiological investigation of outbreaks;
• training of trainers on monitoring chemical and microbial food contamination; and
• training of trainers on HACCP systems. The WHO Regional Office for Europe has developed a project to Strengthen Food Safety and Nutrition Services for the south-eastern European countries in the framework of the Initiative for Social Cohesion of the Stability Pact for South Eastern Europe. Several south-eastern European countries, such as Albania, Bosnia and Herzegovina, Bulgaria, Croatia, the Republic of Moldova, Romania, Serbia and Montenegro and The former Yugoslav Republic of Macedonia, have requested technical assistance from WHO for building their capacity to develop food safety strategies and to update food legislation or their control systems. Another important project of the Regional Office to support Member States in developing their food safety strategies is the public health initiative in the CAR to train food safety officials and university teachers in collaboration with FAO, the Regional Office for Central Asia of the United States Centers for Disease Control and Prevention, several European universities, laboratories and local institutions. As a result, the Kazakhstan School of Public Health has become a reference centre for food safety in the CAR and the Republican Sanitary Epidemiological Station is providing laboratory training on food microbiology in the subregion. The WHO food safety programme in Europe is collaborating with the WHO Global Salmonella Surveillance (GSS) network in building the capacity of laboratory-based surveillance in the European Region. The WHO GSS aims to enhance the capacity of national and regional reference laboratories to conduct Salmonella serotyping and antimicrobial susceptibility testing through international training courses and an external quality assurance system. The WHO GSS also provides training on epidemiological methods for surveillance of foodborne diseases. Eighteen countries from CCEE and south-eastern Europe have completed a series of three-level WHO GSS courses in the newly established official regional training centre in Poland. The three-level WHO GSS courses have been organized for 10 Russian-speaking countries by the future regional training centre at the Institut Pasteur in St Petersburg. GEMS/Food in Europe has been providing training of trainers for European countries on the use of the Operational Programs for Analytical Laboratories (OPAL) software for collecting submitting data and building the national capacity of Member States to assess the exposure to chemical contamination of the total diet.

Comparative analysis of nutrition policies in the WHO European Region page 63
Box 7. Example of professional training interventions in food and nutrition
Sweden is planning to set measures for nutrition training of professionals in health care, nursing, child care, the food sector, social services and catering staff at upper secondary schools and colleges and universities. The education should contain core subjects of diet, physical activity and health. In addition, university and university college programmes on healthy dietary habits, physical activity and health education should be developed, which could be included as optional or compulsory components of vocational programmes aimed at jobs within education, social services, health care and food inspection.
Conclusions and recommendations
The First Action Plan for Food and Nutrition Policies of the WHO European Region called for the establishment of food and nutrition action plans in the Member States. By the end of 2005, 45 of 52 countries had achieved this objective. Similarly, most European countries have developed a policy or legislative framework for food safety. There are important differences regarding the level of development of the plans: some countries have already had long experience with food and nutrition policies, whereas others are just at the beginning of the process. Despite the progress in food and nutrition policy, most countries are still facing nutrition-related problems. The situation analysis indicates that most countries in the European Region have not achieved nutrition and dietary goals. Most of the countries still have excessive fat intake, whereas fruit and vegetable intake is too low and obesity is an increasing problem. Part of the reason is linked to the guiding principles of the action plans. Improving lifestyles has been mainly considered the responsibility of individuals, whereas policy-makers should now acknowledge that recommendations for healthier nutrition and more physical activity need to be matched by action that makes the environment support healthy lifestyles. The dynamics of the food system (price and availability of food) prevent the consumption of a healthy diet, and marketing pressure addresses the demand for food in a completely different direction from what the dietary guidelines indicate. The health sector cannot tackle this on its own, and the involvement of different sectors of the government as well as different stakeholders in society is required. In some countries, stakeholders from different sectors are identified and their responsibilities are clearly defined, but only half the countries collaborate with government bodies and the private sector. Creating partnerships could be helpful to clearly define the roles and increase the commitment of all actors. The agricultural sector, the food manufacturing sector and the marketing and distribution networks are important actors in food and nutrition policies, as the availability, price and composition of food are important determinants of consumption. National and international policies should be shaped to support health and nutrition objectives. Another important reason is the quality of the implementation of action plans. Information on implementation is not available from many countries, as most of the strategies were just recently developed. However, most countries acknowledged that implementation is a major challenge due to the lack of political commitment, coordination, financial resources or expertise. Policy-makers should develop a strategy for implementation that explicitly takes into account the financial, managerial and technical aspects of the policy and the anticipated resistance and support from all the actors within and

Comparative analysis of nutrition policies in the WHO European Region page 64
outside government. Successful implementation requires an understanding and agreement on objectives that should be clear, realistic and accepted (Box 8). To raise political awareness, the burdens of disease and of the economic cost of nutrition-related diseases need to be assessed, as do the benefits of taking action. Coordinating implementation is important, as the relationship between policy-makers and implementers is crucial and well-functioning communication channels between them are needed. The actors in the implementation process and their goals, strategies, activities and links to each other need separate attention. Although the stewardship role of the health ministry should be stressed, effectively coordinating intersectoral action may require a specialized institution. The number of such institutions has nearly doubled since 1994, although some of them are not considered effective enough. The relationship between central, regional and local agencies and their influence on the implementation process is also important. Assessing financial resources is not always easy, as nutrition policy cuts across several government departments. However, having a budget allocated to food and nutrition issues is important.
Box 8. Elements for successful implementation of national food and nutrition action plans
• Allocating the right mixture of human, financial and time resources already in the planning process
• Agreeing on objectives that are achievable and that are stated in a manner so that their achievement can be evaluated
• Setting priorities for action
• Creating or strengthening institutions that are responsible for coordinating, implementation and monitoring
• Strengthening intersectoral collaboration
• Raising political commitment by using cost–benefit calculations
• Defining the responsibilities of the actors in food and nutrition policies
• Creating partnerships with various stakeholders
• Defining a set of indicators to evaluate the policy
The First Action Plan for Food and Nutrition Policy further stressed the need for monitoring health information as a basis for developing policies and evaluating the effectiveness of a policy. About half the countries conduct regular surveys on dietary intake and anthropometric data. The available data are limited, as methods are not always comparable between countries. The EU has developed several surveillance tools. Applying them to other countries in the European Region should be considered. Most European countries conduct surveillance of foodborne diseases and agree on the importance of risk-based food control systems, but the use of surveillance and monitoring data for implementing risk-based measures is still very limited. Further, developing policy evaluation tools and a set of indicators within the countries and also on the European level should be part of future activities. A Second Action Plan for Food and Nutrition Policies for the WHO European Region is currently being drafted. The Action Plan will highlight the current challenges and establish common quantitative goals and action guidelines dealing with both the supply and the demand side. The Action Plan should coherently address nutrition, food supply, food safety and physical activity. Region-wide action is required to give adequate momentum to the action. Integrated and coherent action will be required, ensuring consistency between policies (health, agriculture, trade, environment, education, transport and others), dialogue between the public and private sectors (profit and not-for-profit). The research agenda will also have to be oriented to building the evidence base

Comparative analysis of nutrition policies in the WHO European Region page 65
for policy design. The agricultural sector should be involved in improving the supply of healthy products and reducing the supply of high-energy-density products; the manufacturing sector needs to be engaged in improving the nutritional characteristics of food; and the trade sector should be involved in improving the availability of healthy food choices. Economic instruments should be considered to affect food prices. Information to consumers needs to be guided by marketing regulations, improved labelling and nutrition education. Monitoring and evaluation should be performed by carrying out policy analyses, extending existing surveillance initiatives and developing new surveillance systems in areas still not covered. SUMMARY
Despite the progress in nutrition policy, most countries are still facing nutrition-related problems. The situation analysis indicates that most countries in the European Region have not achieved nutrition and dietary goals. Part of the reason is linked to the guiding principles of the action plans. Improving lifestyles has been mainly considered a responsibility of the individual, whereas policy-makers should now acknowledge that recommendations for healthier nutrition and more physical activity need to be matched by action that makes the environment support healthy lifestyles. Another important reason is the quality of the implementation of action plans. Implementation is a major challenge for most of the countries due to the lack of political commitment, coordination, financial resources or expertise. The Second Action Plan for Food and Nutrition Policies for the WHO European Region is currently being drafted. The Action Plan will highlight the current challenges and establish common quantitative goals and action guidelines, dealing with both the supply and the demand side. Region-wide action is required to give adequate momentum to the action.
References
1. The First Action Plan for Food and Nutrition Policy, WHO European Region, 2000–2005.
Copenhagen, WHO Regional Office for Europe, 2000 (http://www.euro.who.int/Document/E72199.pdf, accessed 28 April 2006).
2. Comparative analysis of nutrition policies in WHO European Member States. Copenhagen, WHO Regional Office for Europe, 1998 (http://www.euro.who.int/Document/E60770.pdf, accessed 28 April 2006).
3. World Declaration and Plan of Action for Nutrition. Rome, Food and Agricultural Organization of the United Nations; Geneva, World Health Organization, 1992 (http://whqlibdoc.who.int/hq/1992/a34303.pdf, accessed 28 April 2006).
4. Draft Council resolution on health and nutrition, 14274/00. Brussels, Council of the European Union, 2000 (http://register.consilium.eu.int/pdf/en/00/st14/14274en0.pdf, accessed 28 April 2006).
5. A European Network for Public Health Nutrition: networking, monitoring, intervention and training. Brussels, European Commission, 2003 (http://europa.eu.int/comm/health/ph_projects/2003/action3/action3_2003_20_en.htm, accessed 28 April 2006).
6. European Platform on Diet, Physical Activity and Health. Brussels, European Commission, 2005 (http://europa.eu.int/comm/health/ph_determinants/life_style/nutrition/platform/platform_en.htm, accessed 28 April 2006).

Comparative analysis of nutrition policies in the WHO European Region page 66
7. Green paper “Promoting healthy diets and physical activity: a European dimension for the prevention
of overweight, obesity and chronic diseases”. Brussels, Commission of the European Communities, 2005 (http://europa.eu.int/comm/health/ph_determinants/life_style/nutrition/documents/nutrition_gp_en.pdf, accessed 28 April 2006).
8. World Health Assembly resolution WHA57.17 on a global strategy on diet, physical activity and
health. Geneva, World Health Organization, 2004 (http://www.who.int/gb/ebwha/pdf_files/WHA57/A57_9-en.pdf, accessed 28 April 2006).
9. Griffiths J, Grieves K. Tobacco in the workplace: meeting the challenge. A handbook for employers.
Copenhagen, WHO Regional Office for Europe, 2002 (http://www.euro.who.int/document/e74819.pdf, accessed 28 April 2006).
10. Trichopoulou A. The DAFNE databank as a simple tool for nutrition policy. DAta Food NEtworking. Public Health Nutrition, 2001, 4(5B):1187–1198.
11. Serra-Majem L et al. Comparative analysis of nutrition data from national, household, and individual levels: results from a WHO-CINDI collaborative project in Canada, Finland, Poland, and Spain. Journal of Epidemiology and Community Health, 2003, 57(1):74–80.
12. Elmadfa I. On the nutrition and health situation in the European Union. Journal of Public Health, 2005, 13:62–68.
13. Naska A et al. Fruit and vegetable availability among ten European countries: how does it compare with the “five-a-day” recommendation? DAFNE I and II projects of the European Commission. British Journal of Nutrition, 2000, 84(4):549–556.
14. Engstrom JL et al. Accuracy of self-reported height and weight in women: an integrative review of the literature. Journal of Midwifery and Women’s Health, 2003, 48(5):338–345.
15. Laatikainen T et al. Non-communicable disease risk factor survey: Federation of Bosnia and
Herzegovina 2002. Sarajevo-Mostar, Institute of Public Health, 2002.
16. Health Systems Project, Ministry of Health, Canadian Society for International Health. 2003 Croatian
Adult Health Survey. Ottawa, Canadian Society for International Health, 2004.
17. Expert team of the Institute of Public Health of Serbia. [Health status, health needs and health care use in Serbia.] Bulletin of the Institute of Public Health of Serbia, 2002, 1–2:1–173.
18. Zaletel-Kragelj L, Erzen I, Fras Z. [Interregional differences in health in Slovenia. I. estimated prevalence of selected cardiovascular and related diseases.] Croatian Medical Journal, 2004, 45:637–643.
19. Health behaviour among Estonian adult population, 2004. Tallinn, National Institute for Health Development, 2005.
20. Pudule I et al. Latvijas Iedzïvotäju Veselïbu Ietekmëjošo Paradumu Pëtïjums, 2004 [Health behaviour
among the adult population of Latvia, 2004]. Helsinki, National Public Health Institute, 2005.
21. Grabauskas V et al. Suaugusių Lietuvos Žmonių Gyvensenos Tyrimas, 2004 [Health behaviour among
the adult population of Lithuania, 2004]. Helsinki, National Public Health Institute, 2005.
22. Ministry of Health of the Republic of Uzbekistan, Analytical and Information Center, State Department of Statistics, Ministry of Macroeconomics and Statistics and ORC Macro. Uzbekistan
Health Examination Survey 2002. Calverton, MD, ORC Macro, 2004.

Comparative analysis of nutrition policies in the WHO European Region page 67
23. HIS CIR 2002: sample survey of the health status of the Czech population. Prague, Institute of Health Information and Statistics, 2004.
24. Szponar L, Rychlik E, Oltarzewski M. [Representative survey of the dietary habits and nutritional status of children and adolescents in the general population of Poland in 2000.] In: Szponar L et al., eds. Badania indywidualnego spożycia żywmo´sci I stanu odżywienia w gospodarstwach domowych
[Household food consumption and anthropometric survey]. Warsaw, Prace IŻŻ 101, 2003.
25. Zohoori N, Blanchette D, Popkin B. Monitoring health condition in the Russian Federation: the
Russia Longitudinal Monitoring Survey 1992–2004. Chapel Hill, Carolina Population Center, University of North Carolina, 2005.
26. Aromaa A, Koskinen S. Health and functional capacity in Finland: baseline results of the 2000
Health Examination Survey. Helsinki, National Public Health Institute, 2004.
27. Steingrímsdóttir L, Porgeirsdóttir H, Olafsdóttir AS. Hvad borda Islendingar? Könnun á mataraedi
Islendinga 2002 [The diet of Icelanders: dietary survey of the Icelandic Nutrition Council 2002, main
findings]. Reykjavik, Rannsóknir Manneldisráds Islands V, 2002.
28. The Swedish Survey of Living Conditions. Stockholm, Statistics Sweden, 2004.
29. Efthymios K et al. First national epidemiological large-scale survey on the prevalence of obesity in Greek adults [abstract]. International Journal of Obesity and Related Metabolic Disorders, 2004, 28(suppl. 1):S72.
30. The Israel Health Interview based on EUROHIS Questionnaire. Jerusalem, Ministry of Health, 2004.
31. Carmo I et al. Body mass index distribution and evolution trends in the Portuguese population [abstract]. International Journal of Obesity and Related Metabolic Disorders, 2004, 28(suppl. 1):S68.
32. Martinez JA et al. Prevalence of obesity in Spain. Obesity Reviews, 5:171–172.
33. De Vriese SR et al. Voedselconsumptiepeiling België 2004 [Food Consumption Survey in Belgium
2004]. Brussels, Wetenschappelijk Instituut Volksgezondheid, Afdeling Epidemiologie, 2006.
34. ObEpi 2003: 3ème enquête épidémiologique nationale sur l’obésité et le surpoids en France
(communiqué de presse) [ObEpi 2003: 3rd national epidemiological survey on obesity and
overweight in France (press release)]. Paris, l’Institut Roche de l’Obésité, 2003.
35. Kelleher C et al. The National Health & Lifestyle Surveys: Survey of Lifestyle, Attitudes and Nutrition
(SLAN). Galway, Centre for Health Promotion Studies, 2003.
36. Enquête Suisse sur la Santé [Swiss Health Survey]. Berne, Federal Office of Statistics, 2003.
37. Sproston K, Primatesta P, eds. Health Survey for England 2003, volume 2: risk factors for
cardiovascular disease. London, The Stationery Office, 2004.
38. Comparative analysis of progress on the elimination of iodine deficiency disorders. Copenhagen, WHO Regional Office for Europe, 2000 (http://www.euro.who.int/document/e68017.pdf, accessed 28 April 2006).
39. Complementary feeding and the control of iron deficiency anaemia in the Newly Independent States.
Copenhagen, WHO Regional Office for Europe, 2000. (http://www.euro.who.int/Document/E68015.pdf, accessed 28 April 2006).
40. Food based dietary guidelines in the WHO European Region. Copenhagen, WHO Regional Office for Europe, 2003 (http://www.euro.who.int/Document/E79832.pdf, accessed 28 April 2006).

Comparative analysis of nutrition policies in the WHO European Region page 68
41. WHO European Centre for Environment and Health. Assistance to national authorities in developing and strengthening national food safety programmes. Copenhagen, WHO Regional Office for Europe, 2000 (http://www.euro.who.int/document/FOS/gsnfsp6.pdf, accessed 28 April 2006).
42. Tirado MC. Food safety strategies in Europe: promoting a new approach to food control in the
Region. Rome, Food and Agriculture Organization of the United Nations, 2004 (http://www.fao.org/docrep/meeting/008/ae330e.htm, accessed 28 April 2006).
43. Tirado MC, Ellard R, Kigcott N. Essential elements for the development of national intersectoral food
safety strategies in the European Region. Copenhagen, WHO Regional Office for Europe, under review.
44. Heaver RA. Improving early childhood development: an integrated program for the Philippines.
Washington, DC, World Bank, 1995.
45. von Kries R et al. Breast feeding and obesity: cross sectional study. British Medical Journal, 1999, 319(7203):147–150.
46. Virtanen SM, Aro A. Dietary factors in the etiology of diabetes. Annals of Medicine, 1994, 26(6):469–478.
47. Karjalainen J et al. A bovine albumin peptide as a possible trigger of insulin-dependent diabetes mellitus. New England Journal of Medicine, 1992, 327(5):302–307.
48. Global strategy on infant and young-child feeding. Geneva, World Health Organization, 2002 (http://www.who.int/child-adolescent-health/publications/NUTRITION/IYCF_GS.htm, accessed 28 April 2006).
49. European strategy for child and adolescent health and development. Copenhagen, WHO Regional Office for Europe, 2005 (http://www.euro.who.int/childhealtdev/20050131_1, accessed 28 April 2006).
50. Cattaneo A et al. Protection, promotion and support of breast-feeding in Europe: current situation. Public Health Nutrition, 2005, 8(1):39–46.
51. Murray CJL. The global burden of disease. A comprehensive assessment of mortality and disability
from diseases, injuries and risk factors in 1990 and projected to 2020. Cambridge, Harvard School of Public Health, 1996.
52. European health for all database [online database]. Copenhagen, WHO Regional Office for Europe, 2006 (http://www.euro.who.int/hfadb, accessed 28 April 2006).
53. Schäfer Elinder L. The EU Common Agricultural Policy from a public health perspective. Eurohealth, 2004, 10(1):13–16.
54. Directions towards sustainable agriculture. Brussels, European Commission, 1999 (http://europa.eu.int/comm/agriculture/envir/9922/9922_en.pdf, accessed 28 April 2006).
55. Proceedings of the First Workshop of the Central and Eastern Europe Sustainable Agriculture
Network, FAO, Godollo, Hungary, 2–7 March 1999. Rome, Food and Agriculture Organization of the United Nations, 1999 (http://www.fao.org/regional/SEUR/ceesa/contents.htm, accessed 28 April 2006).
56. Urban and Peri-urban Food and Nutrition Action Plan: elements for community action to promote
social cohesion and reduce inequalities through local production for local consumption. Copenhagen, WHO Regional Office for Europe, 2001 (http://www.euro.who.int/document/e72949.pdf, accessed 28 April 2006).

Comparative analysis of nutrition policies in the WHO European Region page 69
57. The state of food insecurity in the world 2000. Rome, Food and Agriculture Organization of the United Nations, 2000.
58. Lang T et al. Policy councils on food, nutrition and physical activity: the UK as a case study. Public Health Nutrition, 2005, 8(1):11–19.
59. CINDI Health Monitor: a study of feasibility of a health behaviour monitoring survey across CINDI
countries. Copenhagen, WHO Regional Office for Europe, 2003 (http://www.euro.who.int/document/e79396.pdf, accessed 28 April 2006).
60. Brussaard JH et al. A European food consumption survey method – conclusions and recommendations. European Journal of Clinical Nutrition, 2002, 56:S89–S94.
61. Sjöström M. Monitoring public health nutrition in Europe: nutritional indicators and determinants of health status. Journal of Public Health, 2005, 13:74–83.
62. Tirado C, Schmidt K. WHO surveillance programme for control of foodborne infections and intoxications: preliminary results and trends across greater Europe. World Health Organization. Journal of Infection, 2001, 43:80–84.
63. Compatibility of data reporting formats used by FAO/WHO international risk assessment bodies,
European institutions such as the European Commission and scientific bodies such as the European
Food Safety Authority for risk assessment. Rome, Food and Agriculture Organization of the United Nations, 2004 (ftp://ftp.fao.org/codex/cceuro24/eu0403ae.pdf, accessed 28 April 2006).
64. Tirado MC et al. WHO Global Environment Monitoring System/Food Contamination Monitoring Programme in Europe – WHO/UNEP coordinated global survey of human milk for persistent organic pollutants: links with SCALE. Submitted.
65. Lachat C et al. A concise overview of national nutrition action plans in the European Union Member States. Public Health Nutrition, 2005, 8(3):266–274.
66. Health promotion and evaluation: recommendations to policy makers. Report of the WHO European
Working Group on Health Promotion Evaluation. Copenhagen, WHO Regional Office for Europe, 1998 (http://www.euro.who.int/document/e60706.pdf, accessed 28 April 2006).
67. Robertson A et al., eds. Food and health in Europe: a new basis for action. Copenhagen, WHO Regional Office for Europe, 2003 (WHO Regional Publications, European Series, No. 96; http://www.euro.who.int/InformationSources/Publications/Catalogue/20040130_8, accessed 28 April 2006).
68. Wanless D. Securing good health for the whole population. London, HM Treasury, 2004.
69. Hill S et al. Technology Appraisal Programme of the National Institute for Clinical Excellence: a
review by WHO. Copenhagen, WHO Regional Office for Europe, 2003 (EUR/03/5045738; http://www.nice.org.uk/page.aspx?o=85797, accessed 28 April 2006).
70. Tuomilehto J et al. Prevention of type 2 diabetes mellitus by changes in lifestyle among subjects with impaired glucose tolerance. New England Journal of Medicine, 2001, 344(18):1343–1350.
71. Kostnadsberäkningar och finansieringsförslag för underlag till handlingsplan för goda matvanor och
ökad fysisk aktivitet [Cost calculations and financing proposals for the framework for the action plan
for healthy dietary habits and increased physical activity]. Stockholm, National Food Administration and Swedish National Institute of Public Health, 2005 (http://www.fhi.se/upload/ar2005/uppdrag/uppdrag_kostnadsberakningarmatvanor0509.pdf, accessed 28 April 2006).

Comparative analysis of nutrition policies in the WHO European Region page 70
72. Report of the FAO/WHO Pan-European Conference for Food Safety and Quality. Rome, Food and Agriculture Organization of the United Nations and Geneva, World Health Organization, 2002 (http://www.foodsafetyforum.org/paneuropean/summary_en.htm, accessed 28 April 2006).
73. Sjöström M et al. Diet and physical activity – interactions for health; public health nutrition in the European perspective. Public Health Nutrition, 1999, 2(3A):453–459.
74. Background material to the Action Plan for Healthy Dietary Habits and Increased Physical Activity.
Sweden, National Food Administration, National Institute of Public Health, 2005 (http://www.slv.se/upload/dokument/In_English/Food_and_health/TheSwedishActionplan.pdf, accessed 28 April 2006).

Comparative analysis of nutrition policies in the WHO European Region page 71
Web addresses to national policy documents containing food and nutrition policy
Country Document Web address
Austria Austrian strategy for sustainable development http://www.nachhaltigkeit.at/strategie/pdf/strategie020709_en.pdf
Belgium National Nutrition and Health Plan http://www.mijnvoedingsplan.be
Denmark
Healthy throughout Life – the targets and strategies for public health policy of the Government of Denmark, 2002–2010 http://www.folkesundhed.dk/ref.aspx?id=190
Denmark National action plan against obesity: recommendations and perspectives http://www.sst.dk/publ/publ2003/National_action_plan.pdf
Estonia National strategy for prevention of cardiovascular diseases 2005–2020
http://www.sm.ee/est/HtmlPages/S%C3%BCdamestrateegia-l%C3%B5ppdokument-01-2005/$file/S%C3%BCdamestrateegia.doc
Finland Action Programme for Implementing National Nutrition Recommendations http://www.mmm.fi/ravitsemusneuvottelukunta/Nutrec98.pdf
France National Nutritional Health Programme 2001–2005 http://www.sante.gouv.fr/htm/pointsur/nutrition/1nbis.htm
Greece Dietary guidelines for adults in Greece http://www.nut.uoa.gr/English/GreekGuid.htm
Hungary National Public Health Programme http://www.eum.hu
Ireland National Health Promotion Strategy http://www.dohc.ie/publications/pdf/hpstrat.pdf?direct=1
Ireland Obesity: the policy challenges http://www.dohc.ie/publications/report_taskforce_on_obesity.html
Italy National Health Plan 2003–2005
http://www.ministerosalute.it/resources/static/psn/documenti/psn_2003-2005.PDF
Netherlands
Living longer in good health: also a question of healthy lifestyle – Netherlands Health-Care Prevention Policy
http://www.minvws.nl/images/Living%20longer%20in%20good%20health_tcm11-53021.pdf
Netherlands Time for sport – exercise, participate, perform
http://www.minvws.nl/images/time-for-sport---excercise-participate-perform3_tcm11-78984.pdf
Netherlands Sport for all incentive in the Netherlands http://www.minvws.nl/images/sportforall_tcm11-21864.pdf
Norway The Action Plan on Physical Activity 2005–2009: working together for physical activity
http://www.shdir.no/publikasjoner/handlingsplaner/the_action_plan_on_physical_activity_2005___2009_28337
Portugal National Health Plan 2004–2010. Volume I: priorities http://www.dgsaude.pt/upload/membro.id/ficheiros/i006666.pdf
Sweden Background material to the action plan for healthy dietary habits and increased physical activity
http://www.slv.se/upload/dokument/In_English/Food_and_health/TheSwedishActionplan.pdf
Switzerland Action plan on nutrition and health: a nutrition policy for Switzerland http://www.suissebalance.ch/pdf/Ernaehrungspolicy_de.pdf
United Kingdom
Choosing health? Choosing a better diet: a consultation on priorities for a food and health action plan http://www.dh.gov.uk/assetRoot/04/08/14/56/04081456.pdf
United Kingdom Choosing activity: a physical activity action plan http://www.dh.gov.uk/assetRoot/04/10/57/10/04105710.pdf


Comparative analysis of nutrition policies in the WHO European Region page 73
Annex 1. Activities of the WHO Regional Office for Europe related to food and nutrition, 2000–2005
Workshops – intersectoral development of national food and nutrition action plans
South-eastern Europe
• Slovenia, June 2000 • Bulgaria, October 2001 • Croatia, September 2002 • First Technical Workshop of the South-eastern Europe Food Safety and Nutrition Project,
Serbia and Montenegro, 2002 • Second Technical Workshop of the South-eastern Europe Nutrition Project, Croatia, July
2004 • Subregional Workshop for the Development of Intersectoral Food Safety Strategies in South-
eastern European Countries, Croatia, 2004 – National Intersectoral Workshop for the Development of Food Safety Strategies in
Croatia, 2005 – National Workshop for the Development of Intersectoral Food Safety Strategies in
Bosnia and Herzegovina, 2005
Baltic countries • Latvia, August 2000 • Latvia, June 2001 • Estonia, June 2002
Southern Europe
• Italy, March 2002
Central Asian republics • Workshop for the Development of Food Safety Strategies, Policies and Legislation in the
Central Asian Republics, Kazakhstan, 2002 • Workshop for the Development of a National Food Safety Strategy for Uzbekistan, Tashkent,
2004 • Workshop for the Development of Intersectoral Food Safety Strategies in Kyrgyzstan, 2005 • Workshop for the Development of Intersectoral Food Safety Strategies in Tajikistan, 2005 • Workshop for the Development of Intersectoral Food Safety Strategies in Turkmenistan,
2005 Other countries
• Workshop for the Development of an Intersectoral National Food Safety Strategy in Georgia, 2005
• Workshop for the Development of an Intersectoral National Food Safety Strategy in the Russian Federation, 2005

Comparative analysis of nutrition policies in the WHO European Region page 74
Other workshops and meetings
Regional Healthy Nutrition Policy in the Russian Federation, Russian Federation, 1999 Meeting for the Development of Systems for Improved Coordination and Harmonization of National Food Safety Control Services, Dublin, 2001 Subregional Seminar on Food Safety for Central Asian Republics, Uzbekistan, 2001 Meeting of the members of the Advisory Committee of the Global Environment Monitoring System for Food, Rome, Italy, 2001 Conference on Mother and Child Health and Micronutrient Deficiency, Turkmenistan, November 2002 Meeting of the National Counterparts of the WHO Surveillance Programme for Control of Foodborne Diseases in Europe, Berlin, Germany, 2002 Subregional Total Diet Study Workshop for Accession Countries, Brno/Prague, Czech Republic, 2002 Meeting of the members of the Advisory Committee of the WHO Surveillance Programme for Control of Foodborne Diseases in Europe, Berlin, Germany, 2002 Counterpart Meeting, Greece, February 2003 First Workshop on Food Safety Policy and Legislation for South-eastern European countries, Serbia and Montenegro, 2003 Subregional Workshop on Surveillance and Epidemiology of Foodborne Diseases for Central Asian Republics, Kazakhstan, 2003 Subregional Course on Microbiological Food Contamination Monitoring for Central Asian Republics, Kazakhstan, 2003 Subregional Workshop on Chemical Food Contamination Monitoring for Central Asian Republics, Kazakhstan, 2003 Subregional Workshop on HACCP as a Risk Management Tool for Central Asian Republics, Kazakhstan, 2003 National workshops on the use of operational programmes for analytical laboratories for the reporting of data on food contamination and total diet studies in the Baltic countries, 2003
National workshops on the prevention of foodborne diseases and for microbiological food contamination monitoring for Tajikistan, 2003 Subregional training on surveillance of foodborne diseases for Russian-speaking countries, Russian Federation, 2003 Workshop for the Development of Food Safety Agencies for South-eastern European Countries, Ireland, 2003

Comparative analysis of nutrition policies in the WHO European Region page 75
Meeting of National Counterparts for the Preparation of Intersectoral Food Safety Strategies in South-eastern Europe, Ireland, 2004 National Workshop for Updating Legislation, The former Yugoslav Republic of Macedonia, 2004 National Workshop for the Development of a National Food Safety Strategy and Update of Food Legislation in Serbia and Montenegro, 2005 National Workshop on HACCP for Public Health & Food Inspectors, Albania, 2005 Subregional Training (levels I and II) on Laboratory-based Surveillance of Foodborne Diseases for Russian-speaking Countries, Russian Federation, 2004 and 2005
Workshop for the Introduction of Microbiological Risk Assessment to the South-eastern European Countries, Slovenia, 2005 Seminar on Codex Alimentarius for the European Region, Lithuania, 2005
Other action and publications by the Regional Office
• WHO Regional Committee for Europe resolution EUR/RC50/R8 on the impact of food and
nutrition on public health – the case for a Food and Nutrition Policy and an Action Plan for the European Region of WHO 2000–2005
• A WHO/UNICEF publication Feeding and nutrition of infants and young children: guidelines for the WHO European Region, with emphasis on the former Soviet countries, 2000
• Development of CINDI guidelines, 2000 • WHO training manual on intersectoral development of national food and nutrition action
plans, in English and Russian, 2001 • Assistance to national authorities in developing and strengthening national food safety
programmes, adapted in 2002 • Statistical information on foodborne disease in Europe: microbiological and chemical
hazards, 2002, FAO/WHO • WHO Regional Committee for Europe resolution EUR/RC52/R3 on the recommendations of
the FAO/WHO Pan-European Conference on Food Safety and Quality, 25–28 February 2002 related to public health within the framework of the development of a food safety strategy for the implementation of the food and nutrition policy action plans, 2002
• Food and health in Europe: a new basis for action, in English and Russian, 2003 • Comparative analysis of nutrition policies in the WHO European Region, 2003 • Food-based dietary guidelines in the WHO European Region, 2003 • Development of the global strategy on diet, physical activity and health, which the World
Health Assembly endorsed in May 2004 • Supporting the development of dietary guidelines in European Member States • Guidelines for local authorities on regional and urban food and nutrition action plans • Conducting health impact assessment of agricultural policy and issuing a report of this
assessment • Case studies on the development and implementation of local food and nutrition policies • The Regional Office helped to contribute to the new report on the global burden of disease
regarding the number of disability-adjusted life years (DALYs) related to diet, with the assistance of funding from the Government of the United Kingdom
• Contributions on obesity and nutrition to the European health report

Comparative analysis of nutrition policies in the WHO European Region page 76
• Food safety strategies in Europe: promoting a new approach to food control in the Region, 2004
• Role of the WHO Surveillance Programme for Control of Foodborne Infections and Intoxications in Europe, 2004
• Reports of the WHO Surveillance Programme for Control of Foodborne Infections and Intoxications in Europe, 2001, 2002, 2006, in press

Comparative analysis of nutrition policies in the WHO European Region page 77
Annex 2. Questionnaire for WHO European Member States on food and nutrition policies
WORLD HEALTH ORGANIZATION Regional Office for Europe Nutrition and Food Security Programme
Questionnaire
To Member States
in the WHO European Region
on
Food and Nutrition Policies
The results to be presented at Conference of the
Federation of European Nutrition Societies (FENS) Rome, 1–4 October 2003
1. Your Regional coordinator (as agreed in Athens): …………………………..……………… and 2. Nutrition and Food Security Programme
WHO Regional Office for Europe Scherfigsvej 8 2100 Copenhagen Ø Denmark Fax: +45 39171818 E-mail: [email protected]

Comparative analysis of nutrition policies in the WHO European Region page 78
General Information
This questionnaire should be completed by government administrators or advisers responsible for food and nutrition policy in WHO European Member States.
Responding country: Work areas of those consulted when completing the questionnaire (food safety, agriculture, clinical nutrition, public health, education, welfare, industry etc.):
Address of main contact person: Telephone: Telefax: E-mail: Please ensure that all questions are answered and examples of literature attached before returning copies to: 1. your Regional Coordinator; AND 2. WHO Nutrition & Food Security Programme by Date agreed in Athens. Date: Signature:

Comparative analysis of nutrition policies in the WHO European Region page 79
The First Action Plan for Food and Nutrition Policy WHO European Region 2000–2005
1.0 Has the First Food and Nutrition Action Plan (Sept 2000) (which stated ministries of health will develop national food and nutrition policies) had any impact in your country?
Yes No: but action has been taken No: nothing done on
Other:
on nutrition policy nutrition policy
If Yes: please state what has happened:
If No but: not because of FNAP but other action taken,
please state what
If No: If no, please suggest ways how political
commitment could be strengthened before the ministerial conference in 2006
Any other comments (e.g. problems encountered, major success, suggestions etc.):
Food and Nutrition Policy
If a question is not applicable to your country please state not applicable (n/a).
Food and Nutrition Policy Development
Food and Nutrition policy document 2.0 Does your country have a national policy document dealing with
nutrition? (It may be a document concerned only with nutrition, or it may be part of a national health or agriculture strategy.)
Yes No Under preparation
If no, please go to section 3.0 2.1 What is name of policy document or name of document that
contains/will contain nutrition policy?
Name of document in national language:
Name of document in English:
Which year was the document finalized?
Which ministry(ies) & sector(s) are/were involved?
Which ministry is/was the lead agency?

Comparative analysis of nutrition policies in the WHO European Region page 80
2.2 Has the document been officially adopted by a political body?
(Ministry of Health, Parliament or other)
YesYes No Not yet
If yes, please state who adopted the policy document Official body(ies) adopting
policy:
2.3 What year was the latest policy document adopted? Year of adoption: 2.4 What are the top 5 priorities, objectives or targets stated in the nutrition
document? (e.g. increase breastfeeding, reduce micronutrient deficiency, reduce obesity etc.)
1. 2. 3. 4. 5. Others
Scientific advisory body
3.0 Does your country have a scientific advisory body responsible for providing
scientific advice regarding food & nutrition to national policy-makers?
Yes No If no, is there a plan to set up an advisory body/structure?
If no, please go to section 4.0 3.1 What is the name of the scientific advisory body? Name in national language: Name in English: 3.2 When was the scientific advisory body established?
Year : 3.3 How often does the scientific advisory body meet? 3.4 Who finances the activities of the scientific advisory body?
(Ministry, food industry, private funds, voluntary donations or other)

Comparative analysis of nutrition policies in the WHO European Region page 81
Food and nutrition policy implementation
4.0 Is an administrative structure responsible for implementation of the nutrition policy?
Yes No If yes, give name:
Yes No If no, does your country plan to set up such a structure?
4.1 Is the administrative structure effective for ensuring implementation of nutrition policy? Yes No Partly 4.2 If no, please explain: Yes No Lack of political support Lack of financial support Lack of expertise for planning and implementing interventions Lack of coordination among implementing agencies Others:
Intersectoral collaboration
5.0 Is there regular intersectoral collaboration between different governmental
departments involved in nutrition matters? Yes No If yes, please state sectors
(e.g. agriculture, education, etc):
If no, state major problems preventing collaboration
5.1 Is there any form of regular intersectoral collaboration between the government, and nongovernmental organizations (NGOs) or the food industry:
Yes No Collaboration between Government and NGO Collaboration between Government & Food industry Other:

Comparative analysis of nutrition policies in the WHO European Region page 82
Dietary assessment
6.0 Have national representative surveys of dietary intake for either adults, and/or children been carried out?
Yes No Elderly Adult survey Adolescents Schoolchildren Preschool children Infants (0–11 months) If boxes are ticked “No”, please go to section 8.0
6.1 Which year was the last survey carried out? Year of elderly survey Year of adult survey Year of adolescent survey Year of schoolchildren survey Year of preschool survey Year of infant survey 6.2 Are nutritional dietary intake surveys carried out on a regular basis? Yes No Elderly survey Adult survey Adolescent survey Schoolchildren survey Preschool survey Infant survey If yes, please state time interval between surveys
(e.g., every 5 years, every 10 years or other): 6.3 Time interval elderly survey Time interval adult survey Time interval adolescent
survey
Time interval schoolchildren Time interval preschool Time interval infant survey

Comparative analysis of nutrition policies in the WHO European Region page 83
6.4
Method of elderly survey Method of adult survey
Method of adolescent survey
Method of schoolchildren
Method of preschool
Method of infant survey (e.g. 24 hour recall/diet records/food frequency questionnaire/household budget )
Dietary intake
Infant feeding practices 7.0 Exclusive breastfeeding State definition used for “exclusive”
______________________
Time of initiation of breastfeeding after birth ___ mins/hours
No data available date Infants not breastfed % Infants exclusively breastfed for 1 month or less % Infants exclusively breastfed for 2 months % Infants exclusively breastfed for 3 months % Infants exclusively breastfed for 4 months % Infants exclusively breastfed for 6 months % Methodology ____________________________ (e.g. cohort, retrospect, 24h recall)
Infant and young-child feeding practices 7.1 Are surveys carried out to assess fluids and food intake for 6- to 12-month-
olds?
No data available Data available (describe
briefly criteria used):
(state year)

Comparative analysis of nutrition policies in the WHO European Region page 84
Dietary intake of adults Yes No 7.2 Is national data on macronutrients and energy intake
available?
Are studies (not national) for macronutrients & energy intake available?
If no, please go to section 7.4 7.3 Please state average daily energy intake for adult males by age.
Please ensure to provide sample size (N) where indicated in table.
MALES Age (19–64 yrs) Total AGE yrs Sample size, (N) Energy, kcal
Protein, %
Fat, %
Saturated fatty acids %
Monounsaturated FA %
Polyunsaturated FA %
if available trans-fatty acids %
Carbohydrate, %
Alcohol, %
Collection year (state national data or study):
Please state average daily energy intake for adult females by age. Please ensure to provide sample size (N) where indicated in table.
FEMALES Age (19–64 yrs) Total AGE yrs Sample size, (N) Energy, kcal
Protein, %
Fat, %
Saturated fatty acids %
Monounsaturated FA %
Polyunsaturated FA%
If available trans-fatty acids %

Comparative analysis of nutrition policies in the WHO European Region page 85
Carbohydrate, %
Alcohol, %
Collection year (state national data or study)
7.4 Is national data on fruit and vegetable intake (not including potatoes) available? Yes No 7.5 Please state average daily intake of fruit and vegetables
(not including potatoes) for males by age. Please ensure to provide sample size (N) where indicated in table.
MALES Age (19–64 yrs) Total AGE yrs Sample size, (N) Vegetables, g (not
potatoes but including pulses)
Fruit (& fruit juice), g
Total
Please state average daily intake of fruit and vegetables (not including potatoes) for females by age. Please ensure to provide sample size (N) where indicated in table.
FEMALES Age (19–64 yrs) Total AGE yrs Sample size, (N) Vegetables, g (not
potatoes but including pulses)
Fruit (& fruit juice), g
Total
Collection year:
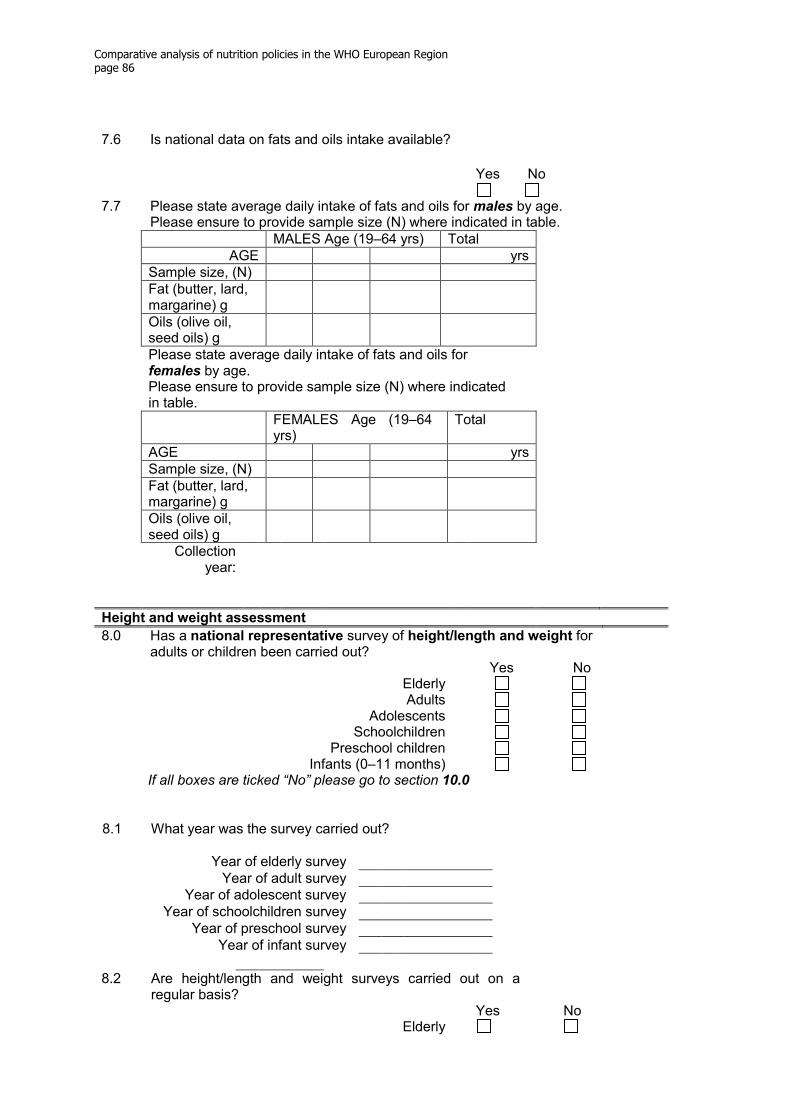
Comparative analysis of nutrition policies in the WHO European Region page 86
7.6 Is national data on fats and oils intake available?
Yes No 7.7 Please state average daily intake of fats and oils for males by age.
Please ensure to provide sample size (N) where indicated in table. MALES Age (19–64 yrs) Total AGE yrs Sample size, (N) Fat (butter, lard,
margarine) g
Oils (olive oil, seed oils) g
Please state average daily intake of fats and oils for females by age. Please ensure to provide sample size (N) where indicated in table.
FEMALES Age (19–64 yrs)
Total
AGE yrs Sample size, (N) Fat (butter, lard,
margarine) g
Oils (olive oil, seed oils) g
Collection year:
Height and weight assessment
8.0 Has a national representative survey of height/length and weight for adults or children been carried out?
Yes No Elderly Adults Adolescents Schoolchildren Preschool children Infants (0–11 months) If all boxes are ticked “No” please go to section 10.0
8.1 What year was the survey carried out?
Year of elderly survey Year of adult survey Year of adolescent survey Year of schoolchildren survey Year of preschool survey Year of infant survey 8.2 Are height/length and weight surveys carried out on a
regular basis?
Yes No Elderly
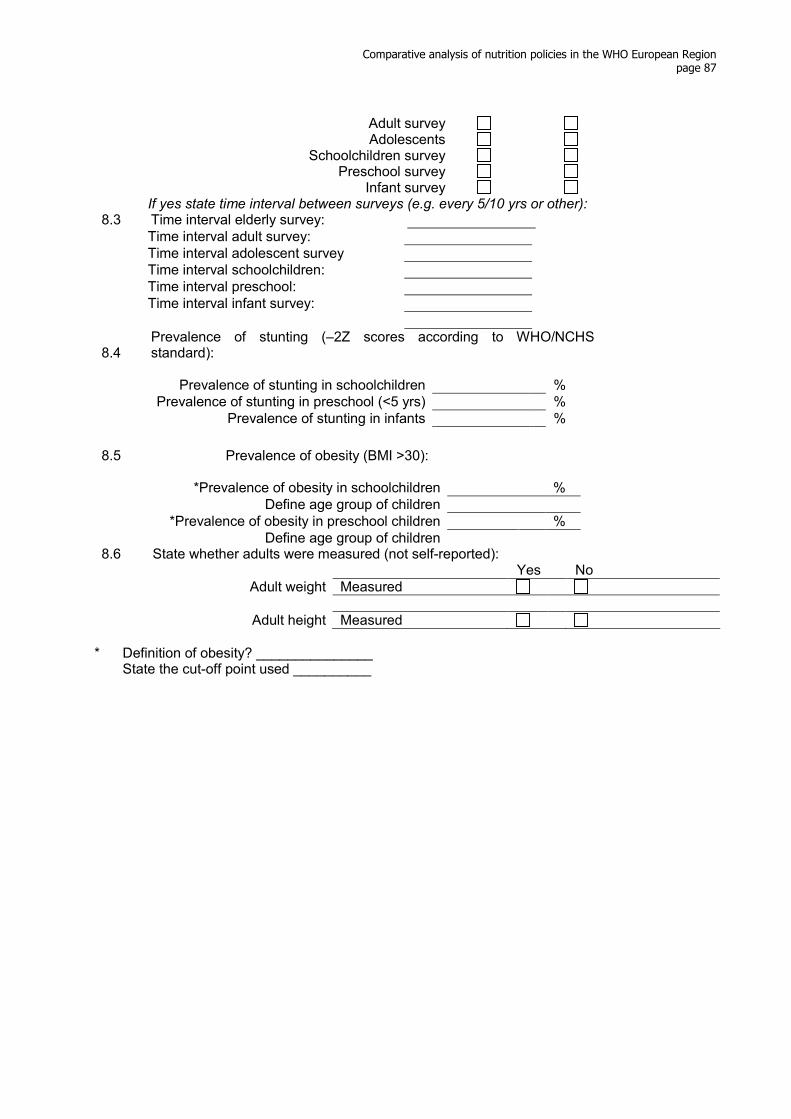
Comparative analysis of nutrition policies in the WHO European Region page 87
Adult survey Adolescents Schoolchildren survey Preschool survey Infant survey If yes state time interval between surveys (e.g. every 5/10 yrs or other): 8.3 Time interval elderly survey: Time interval adult survey: Time interval adolescent survey Time interval schoolchildren: Time interval preschool: Time interval infant survey: 8.4
Prevalence of stunting (–2Z scores according to WHO/NCHS standard):
Prevalence of stunting in schoolchildren % Prevalence of stunting in preschool (<5 yrs) % Prevalence of stunting in infants %
8.5 Prevalence of obesity (BMI >30):
*Prevalence of obesity in schoolchildren % Define age group of children *Prevalence of obesity in preschool children % Define age group of children 8.6 State whether adults were measured (not self-reported):
Yes No
Adult weight Measured Adult height Measured
* Definition of obesity? _______________
State the cut-off point used __________

Comparative analysis of nutrition policies in the WHO European Region page 88
Body mass index in adults
9.0 Is national representative data on body mass index (BMI)1 available for the adult population in your country?
Yes No 9.1 Please give percentages of males in different BMI categories by age
Please ensure to provide sample size (N) where indicated in table. MALE Age (19–64 yrs) Total AGE yrs Sample size, (N)
BMI category % % % % % Underweight
BMI <18.5
Normal BMI 18.5–24.9
Overweight BMI 25–29.9
Obese BMI ≥30
Please give percentages of females in different BMI categories by age Please ensure to provide sample size (N) where indicated in table.
FEMALE Age (19–64 yrs) Total AGE yrs Sample size, (N)
BMI category % % % % % Underweight
BMI <18.5
Normal BMI 18.5–24.9
Overweight BMI 25–29.9
Obese BMI ≥30
Collection year: 9.2
Please give percentages of males with high waist circumference Please ensure to provide sample size (N) where indicated in table.
MALE Age (19–64 yrs) Total AGE yrs Sample size, (N)
% % % % Waist circumference >95 cm Waist circumference >100
cm
Please give percentages of females with high waist circumference by age Please ensure to provide sample size (N) where indicated in table.
1
2)(
)(
mHeight
kgWeightBMI =

Comparative analysis of nutrition policies in the WHO European Region page 89
Female Age (19–64 yrs) Total AGE yrs Sample size, (N)
% % % % Waist circumference >80 cm Waist circumference >90 cm Collection year:
Micronutrient deficiencies
10.0 Iron Deficiency Anaemia What is the prevalence of anaemia in your country as indicated by low haemoglobin
(use individual study data if no national data available)? 10.1 Prevalence of low
haemoglobin levels:
% year
Data not available
Children (<5 years) with Hb <11 g/dl Schoolchildren (5–14 years) with
Hb <12 g/dl
Non-pregnant women (>15 years) with Hb <12 g/dl
Pregnant women (>15 years) with Hb <11 g/dl
Males (>15 years) with Hb <13 g/dl 10.2 Interventions: Children
<5 yrs Hb <11 g/dl
Schoolchildren 5–14 yrs Hb <12 g/dl
Non-pregnant women Hb <12 g/dl
Pregnant women >15 yrs Hb <11 g/dl
Males >15 yrs Hb <13 g/dl
Yes No
Yes No Yes No Yes No Yes
No
Dietary advice/ behaviour change
Fortification Supplements
11.0 Iodine Deficiency Disorders (IDD)
11.1 Are iodine deficiency disorders (IDD) a problem in your country?
Yes
No Don’t know
severe moderate Mild If Yes: 11.2
Please indicate methods to identify IDD prevalence by ticking relevant box.
Thyroid Inspection Ultrasonography Median urinary iodine concentrations None Other method (Please state which method used) 11.3 Interventions: Yes No

Comparative analysis of nutrition policies in the WHO European Region page 90
Compulsory universal salt iodization (USI) (household, food manufactures & animal fodder)
Only household salt Household salt and salt in processed food (e.g. bread) Supplements Dietary advice 12.0 Vitamin A Deficiency 12.1 Is vitamin A deficiency a problem in your country?
Yes
No Don’t know
severe moderate mild If Yes: 12.2 Please indicate methods used to identify prevalence of vitamin A deficiency in your
country Night blindness Serum retinol Clinical data None 12.3 Interventions: Yes No Dietary advice/behaviour
change
Fortification Supplements Other

Comparative analysis of nutrition policies in the WHO European Region page 91
Recommended nutrient reference values
13.0 Does your country have a set of recommended daily nutrient reference values2 (physiological norms)?
Yes No Are nutrient reference values from other countries used?
If yes, which country 13.1 Has your country adopted EU reference nutrient intakes:
for all nutrients:
for some nutrients:
13.2 What is the title of the recommended nutrient reference values? Title in national language: Date: Title in English: 13.3 Have the recommended nutrient reference values been revised since
development?
Yes No If yes, please give year of latest revision: Year of revision: 13.4 Who is responsible for producing the recommended nutrient reference values?
(Ministry of Health, or other) Responsible body:
Dietary guidelines
14.0 Does your country have national food-based dietary guidelines3? (e.g. similar to CINDI diet guide and food pyramid) Attach sample Yes No If yes date: 14.1 Have the dietary guidelines been revised since development? Yes No If yes, please give year of latest revision: Year of revision: 14.2
To which population groups are dietary guidelines directed?
Yes No Whole population Elderly Adult Pregnant women Adolescents Schoolchildren Preschool children Infants
2 Nutrient reference values are the recommended nutrient intake in a population, which will cover the nutrient requirements for most
people. 3 Dietary guidelines are recommendations based on foods rather than nutrients.

Comparative analysis of nutrition policies in the WHO European Region page 92
14.3 What types of food selection guides are used? Please tick relevant box. (Please attach sample) None Food Pyramid Food Plate Food Circle Other 14.4 Who is responsible for producing and revising your national dietary guidelines? Responsible body: 14.5 Have dietary guidelines/mass catering guidelines been developed for: Yes No Older peoples’ homes Work canteens Emergency situations School meals Kindergartens
Other information
15.0 Are there national guidelines or legislation concerning food fortification? Please give details:
16.0 Is national agriculture policy harmonized with nutritional guidelines?
17.0 Please supply any other information that you feel is relevant.
END OF QUESTIONNAIRE

Comparative analysis of nutrition policies in the WHO European Region page 93
Annex 3. Definition of breastfeeding categories
Exclusive breastfeeding: the infant has received only breast-milk from his or her mother or a wet nurse, or expressed breast-milk, and no other liquids or solids with the exception of drops or syrups consisting of vitamins, mineral supplements or medicines. Predominant breastfeeding: the infant’s predominant source of nourishment has been breast-milk. However, the infant may also have received water and water-based drinks (sweetened and flavoured water, teas, infusions, etc.), fruit juice and sugar-water; no food-based fluid is allowed under this definition.
Exclusive breastfeeding and predominant breastfeeding together constitute Full breastfeeding