comparative analysis of fuels for cooking - global alliance for clean...
TRANSCRIPT

Comparative Analysis of Fuels for Cooking:LIFE CYCLE ENVIRONMENTAL IMPACTS AND ECONOMIC AND SOCIAL CONSIDERATIONS
EXECUTIVE SUMMARY

ABOUT THIS GUIDE:
This study is an initiative of the Global Alliance for Clean Cookstoves, a public-private part-nership with a mission to save lives, improve livelihoods, empower women, and protect the environment by creating a thriving global market for clean and efficient household cooking solutions. The Alliance is committed to providing resources that advance the work of its partners. In response to a request from our partners for country specific information on fuels, the Alliance undertook this research to provide an understanding of tradeoffs between fuel options and environmental impacts across the value chain, and to provide a guide to inform decisions regarding fuel choices for programs and investors. This study is meant to aid cookstove and fuel stakeholders to identify and prioritize opportunities, to remove barriers, and increase efficiency across the fuel supply chain while also increasing aware-ness of environmental, economic and gender and livelihood impacts of various fuel types.
The Global Alliance for Clean Cookstoves partnered with Eastern Research Group on this effort. Special thanks to the Alliance’s many partners, staff, enterprises and fuel experts that provided inputs, insights, and review throughout the process.
EASTERN RESEARCH GROUP
ERG has over 30 years of experience serving federal, state, and local environmental agencies as well as nonprofit and educational organizations. ERG offers multidisciplinary skills in more than 20 specialized service areas, including: engineering, environmental/health science, economics, communications, information technology (IT), outreach and education, and training services. Our Franklin Associates division is a respected industry leader in conducting life cycle assessments (LCA). Our LCA practitioners apply modeling techniques across a full range of environmental media to understand the comprehensive life cycle impacts of various products and processes. We help our clients target their efforts to mini-mize environmental burdens and maximize resources.
Funding for this Guide was generously supported by the UK Department for International Development (DFID).
The views presented in this paper are those of the authors and do not necessarily represent the views of the UK Department for International Development (DFID). The authors wish to thank DFID and take full responsibility for any errors or omissions contained in this paper.

TABLE OF CONTENTS
EXECUTIVE SUMMARY1.1. Overview . . . . . . . . . . . . . . . . . . . . . . . . . . . . . . . . . . . . . . . . . . . . 3
1.2. Methodology Summary . . . . . . . . . . . . . . . . . . . . . . . . . . . . . . . . 6
1.3. Summary of Results . . . . . . . . . . . . . . . . . . . . . . . . . . . . . . . . . . 9
1.4. Recommendations . . . . . . . . . . . . . . . . . . . . . . . . . . . . . . . . . . . 24
1.4.1 Enterprise-Level Recommendations . . . . . . . . . . . . . . . . . . . . . 24
1.4.2 Policy-Level Recommendations . . . . . . . . . . . . . . . . . . . . . . . . 25
1.5. Data Gaps and Research Needs . . . . . . . . . . . . . . . . . . . . . . . . 30
1.5.1 Environmental Data . . . . . . . . . . . . . . . . . . . . . . . . . . . . . . . . 30
1.5.2 Economic Data . . . . . . . . . . . . . . . . . . . . . . . . . . . . . . . . . . . . 31
1.5.3 Social and Gender Data . . . . . . . . . . . . . . . . . . . . . . . . . . . . . . 31
Endnotes . . . . . . . . . . . . . . . . . . . . . . . . . . . . . . . . . . . . . . . . . . . . . . 32
LIST OF TABLES:
Table 1-1. Environmental, Economic, and Social Indicators . . . . . . . . . . . . . . . . . . 7
Table 1-2. Summary of Environmental Impacts Across all Countries (Impact per Household per Year) . . . . . . . . . . . . . . . . . . . . . 10
Table 1-3. Observations and Considerations by Fuel Type . . . . . . . . . . . . . . . . . . 20
Table 1-4. Fuel-Related Policies in Alliance Focus Countries . . . . . . . . . . . . . . . . 27
LIST OF FIGURES:
Figure 1-1. Illustration of LCA Approach to Evaluating Fuel Impacts . . . . . . . . . . 4
The full report, including Scope and Methodology, Assumptions, References, and complementary resources can be viewed under the Resources tab of the Fuel Analysis, Comparison and Integration Tool (FACIT) webpage: cleancookstoves.org/facit

1.1. OVERVIEW
Billions of people cook daily on traditional stoves and open fires with solid fuels like wood, which has far-reaching health, environmental, and socio-economic impacts. Much of the research on cooking fuels has focused on energy efficiency and emissions in the home. Fuel alternatives are often pursued to achieve benefits for the users and are often marketed as being “renewable,” “green,” or “clean.” The actual impacts of fuel alternatives for cooking are more complex than these terms imply, due to the multiple steps of fuel production, processing, distribution, and use, and because these steps touch on so many areas (e.g., energy use, agriculture, transportation, and manufacturing). A deeper investigation of the environmental impacts of fuels can contribute to strengthening the growing cookstoves and fuels sector as well as the trajectory of future research.
This study evaluates various cooking fuels using life cycle assessment (LCA), a method for com-prehensive, quantified evaluations on the environmental benefits and tradeoffs for the entire life cycle of a product system, beginning with raw material extraction and continuing through the product’s end-of-life. This effort also includes an initial assessment of various economic and social indicators to provide additional considerations to weigh when evaluating fuel choices. The results in this report and accompanying online tool (Fuel Analysis, Comparison & Integration Tool or FACIT) can be used to interactively analyze and compare trade-offs of different cooking fuels (assuming representative cookstove efficiencies associated with each fuel); identify the steps in fuel production that have the largest impacts and, thus, present opportunities for improvements; and enhance investment in cleaner cooking fuels through increased awareness of the associated environmental, economic, and gender and livelihood benefits.
This study provides quantitative and qualitative information on previously identified areas of interest and information gaps for the fuel chain, including:
∙ Life cycle environmental impacts, including energy use, water consumption, emissions, and wastes.
∙ Quantified emission data on black carbon and short-lived climate pollutants sourced from solid, gaseous and liquid fuels.
∙ Benefits, challenges, and differences in impact for various processed biomass fuels such as bamboo, carbonized vs. non-carbonized briquettes.
Audiences that may benefit from this study include, but are not limited to:
∙ Local and national governments, to guide policy development.
∙ Enterprises, to identify business opportunities for producing, optimizing processes, and marketing cooking fuels as well as attracting investment.
∙ Donors and investors, to make more informed choices about investments and projects to support.
∙ Researchers, to identify data gaps or opportunities to improve fuel technologies and performance.
∙ Marketing and behavior change communication experts, to better understand life cycle environmental and economic implications of cooking fuel choices.
∙ Global Alliance for Clean Cookstoves secretariat, to inform, guide, and prioritize future activities.
GLO
BA
L AL
LIA
NC
E FO
R C
LE
AN
CO
OK
ST
OV
ES
3

An LCA tracks the environmental effects of a product or a process from cradle (the resources used to create a product) to grave (the outputs/emissions to air, water, land), and include the inputs and outputs at each phase of production. The figure below shows examples of the type of resource inputs and byproduct outputs for the life cycle of charcoal briquettes derived from wood.
To complement the environmental LCA, economic and social indicators were also included in the assessment to provide a more robust set of considerations for weighing the benefits and tradeoffs of cooking fuel options.
LIFE CYCLE ASSESSMENT EXAMPLE CHARCOAL BRIQUETTES DERIVED FROM WOOD
FIGURE 1-1: ILLUSTRATION OF LCA APPROACH TO EVALUATING FUEL IMPACTS
BYPRODUCTS WITH ENVIRONMENTAL IMPACT
LIFE CYCLE OF FUEL PRODUCTS
RESOURCES USED
ECONOMIC AND SOCIAL
CONSIDERATIONS
USE
DISTRIBUTION
PROCESSING
PRODUCTION
GHG emissions from non-sustainable forestry practices
PM emissions from traditional kilns
Smog formation
GHG emissions from transport mode
CO and GHG emissions from stoves
Ash leading to O2 depletion in water bodies
Wood and forestry products
Energy inputs to transport from kiln to retail
Processed charcoal briquettes
Wood input for carbonization
Energy for briquetting
Water use
CO
MP
AR
AT
IVE
AN
ALY
SIS
OF
FU
EL
S FO
R C
OO
KIN
G: L
IFE
CY
CL
E E
NV
IRO
NM
EN
TAL IM
PA
CT
S A
ND
EC
ON
OM
IC A
ND
SO
CIA
L CO
NS
IDE
RA
TIO
NS
// E
XE
CU
TIV
E S
UM
MA
RY
4

While health impacts were not were not a focus of this study, data from research on indoor air pollution was referenced. The results of this effort can inform the health research community, providing data to broaden the evaluation of the impacts of fuels used for cooking.
Sections 1.2 through 1.5 summarize the scope and methodology, results, insights, recommen-dations and data gaps specific to the environmental analyses gained as a result of this study. Subsequent report sections offer more detail on the methodology and assumptions (Section 2), indicator definitions (Table 2-2), and country-specific results (Section 3).
Country-specific results are organized by region (Asia, Latin America, and Africa), and each country section includes a summary table of the environmental LCA modeling impacts for each fuel and indicator selected for this study, as well as an in-depth discussion for indicators particularly relevant to the cooking sector.
Companion Appendices provide the detailed environmental analyses and include economic and social considerations (Appendix A), descriptions of methodology considerations and process descriptions for each fuel life cycle (Appendix B), as well as complete references for literature and other information cited throughout the study (Appendix C).
The results of this report provide a snapshot of “fuel profiles” for several countries and provide directional guidance for stakeholder audiences. The output of this LCA is an assessment of the environmental impacts of cooking fuels over one set of different categories/indicators. Uncertainty and assumptions exist within all LCAs. The results reveal insights for a range of fuels, highlighting general trends and shedding light on primary drivers of impacts to inform where additional research could be beneficial. The findings should not be used in isolation to make absolute determinations about one fuel type over another but rather to complement other resources, research, policies, and contextual factors to make more informed decisions.
To access the full report online, visit: cleancookstoves.org/facit under the Resources tab.
GLO
BA
L AL
LIA
NC
E FO
R C
LE
AN
CO
OK
ST
OV
ES
5

1.2. METHODOLOGY SUMMARY
LCA results are an instrument in evaluating different environmental tradeoffs between alter-nate options for providing a household’s energy needs. This study uses a life cycle assessment methodology to evaluate fuels considering steps that occur prior to and including combustion in a stove, for example fuel extraction and processing. For each life cycle stage, this study quan-tifies the use of energy, water, and other materials, and wastes released to air, water, and land.
The analysis focused on the Alliance’s eight focus countries (Box 1-1) and 11 cooking fuels (Box 1-2) derived from eight feedstocks. A number of additional fuels were assessed for India and China as part of a simultaneous study that was conducted by the U.S. Environmental Protection Agency (EPA).* Those additional fuels were only assessed for environmental (not social and eco-nomic) impacts and the results of that study are included in this report. It was not possible to find all the needed information specific to each country and therefore results of similar studies in other developing countries were substituted where country-specific data gaps existed.
The environmental, economic, and social indicators assessed are presented in Table 1-1 (see page 7) and defined in Section 2.1.5.
* The EPA fuels analysis study was published in August 2016. https://cfpub.epa.gov/si/si_public_record_report.cfm?dirEntryId=322551
BOX 1-1: ALLIANCE FOCUS COUNTRIES
ASIAChina India Bangladesh
LATIN AMERICAGuatemala
AFRICAGhana Kenya Nigeria Uganda
BOX 1-2: FUEL AND PROCESSING METHOD COMBINATIONS
UNPROCESSED SOLID BIOMASS
• Firewood A
• Crop residue B, C
• Dung cake C
PROCESSED SOLID BIOMASS
• Charcoal briquettes - From wood - From bamboo
• Non-carbonized briquettes - From sawdust - From crop residues
• Wood pellets
• Other processed biomass - Wood chips
LIQUID/GAS
• Ethanol - From sugarcane - From wood
• Biogas from dung
• Liquefied petroleum gas (LPG) D
• Kerosene B, C
• Dimethyl ether (DME) B, E
• Natural gas B, F
OTHER
Electricity B, C
Hard coal B, C
A. Covers all types of whole wood including fuelwood and brushwood.
B. Environmental LCA data are included for these fuels for China through a companion study conducted by the U.S. Environmental Protection Agency (EPA).
C. Environmental LCA data are included for these fuels for India through a companion study conducted by the U.S. EPA.
D. Stored in cylinders.
E. Dimethyl ether is a gaseous fuel type derived from coal and was evaluated as part of the U.S. EPA study.
F. Natural gas is modeled as piped to the household in China.
CO
MP
AR
AT
IVE
AN
ALY
SIS
OF
FU
EL
S FO
R C
OO
KIN
G: L
IFE
CY
CL
E E
NV
IRO
NM
EN
TAL IM
PA
CT
S A
ND
EC
ON
OM
IC A
ND
SO
CIA
L CO
NS
IDE
RA
TIO
NS
// E
XE
CU
TIV
E S
UM
MA
RY
6
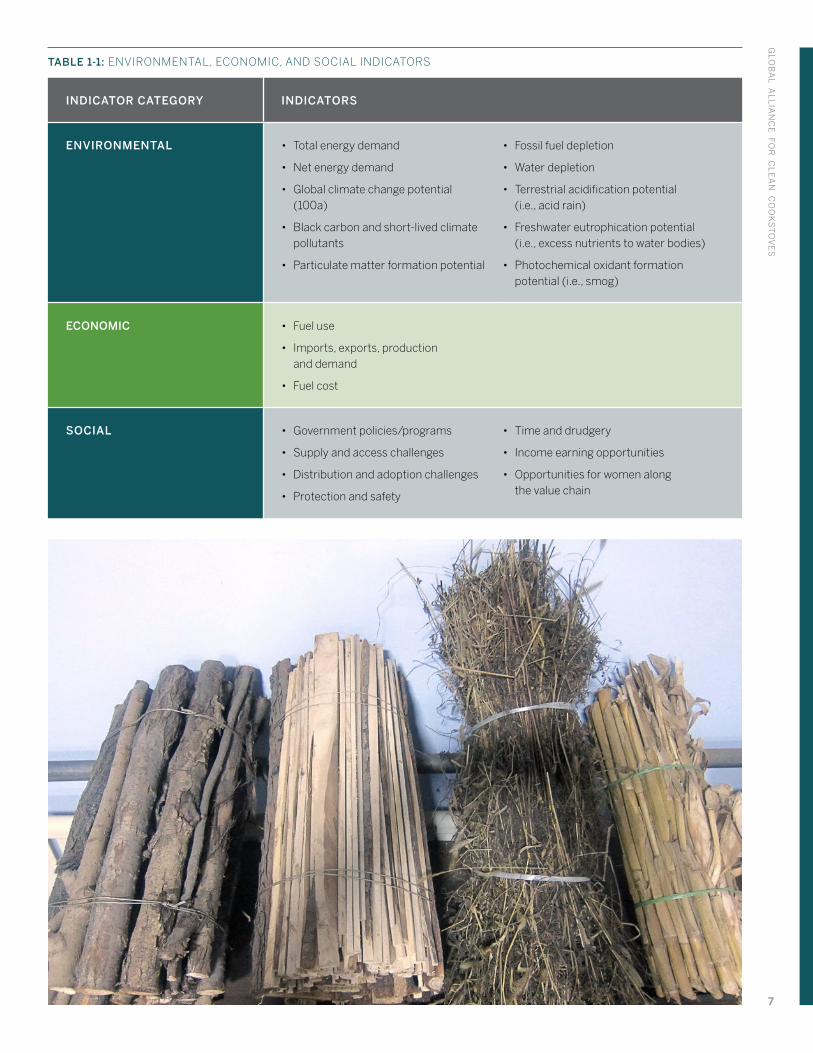
TABLE 1-1: ENVIRONMENTAL, ECONOMIC, AND SOCIAL INDICATORS
INDICATOR CATEGORY INDICATORS
ENVIRONMENTAL • Total energy demand
• Net energy demand
• Global climate change potential (100a)
• Black carbon and short-lived climate pollutants
• Particulate matter formation potential
• Fossil fuel depletion
• Water depletion
• Terrestrial acidification potential (i.e., acid rain)
• Freshwater eutrophication potential (i.e., excess nutrients to water bodies)
• Photochemical oxidant formation potential (i.e., smog)
ECONOMIC • Fuel use
• Imports, exports, production and demand
• Fuel cost
SOCIAL • Government policies/programs
• Supply and access challenges
• Distribution and adoption challenges
• Protection and safety
• Time and drudgery
• Income earning opportunities
• Opportunities for women along the value chain
GLO
BA
L AL
LIA
NC
E FO
R C
LE
AN
CO
OK
ST
OV
ES
7


1.3. SUMMARY OF RESULTS
While this analysis focuses on fuels, it is recognized that the overall impacts will depend on both the fuel and the stove. Some of these findings are new insights, while others are consistent with commonly-held ideas in the sector, but we can now offer more quantitative evidence and guidance.
A summary of environmental modeling results per country by fuel is provided in Table 1-2 (see page 7). This table includes the total impacts for each fuel, summed across the entire life cycle. To see the contributions at each life cycle stage, it is recommended to view the country-specific sections in the full report online and in the FACIT resource (www.cleancookstoves.org/facit) and also to reference the detailed Appendices.
For each country (within each row) in Table 1-2, results are color coded to indicate fuels that tend to have more (shades of green) or less (shades of red) favorable results for a given envi-ronmental indicator. By reading the across the rows, you can compare one indicator across all fuels for that country. The color coding thresholds were determined by categorizing the overall impact contributions for each fuel by country into percentiles. These thresholds highlight broad trends and do not indicate statistically significant differences in results.
Each indicator is individually modeled for each fuel within each country. There is no single aggregated indicator of environmental impacts for each fuel. The importance of specific indi-cators is expected to vary among stakeholders. Variability for the same fuel across countries is the result of country-specific feedstocks, fuel production methods, variability in country specific distribution distances and modes, and ranges in stove efficiency.
A subset of observations from these results are discussed in Table 1-3 (see page 20).
In each country summary in Chapter 3 of the full report, the environmental profile of each fuel is discussed, followed by a more in-depth discussion of a subset of environmental indicators that were designated as of particular interest for the cooking sector, including Total Energy Demand (TED), Global Climate Change Potential (GCCP), Black Carbon and Short-lived Climate Pollutants (BC), and Particulate Matter Formation Potential (PMFP). The online FACIT tool also displays impacts by each life cycle phase, providing more granularity with which to understand these observations.
To access the full report online, visit: cleancookstoves.org/facit under the Resources tab.
GLO
BA
L AL
LIA
NC
E FO
R C
LE
AN
CO
OK
ST
OV
ES
9

CO
MP
AR
AT
IVE
AN
ALY
SIS
OF
FU
EL
S FO
R C
OO
KIN
G: L
IFE
CY
CL
E E
NV
IRO
NM
EN
TAL IM
PA
CT
S A
ND
EC
ON
OM
IC A
ND
SO
CIA
L CO
NS
IDE
RA
TIO
NS
// E
XE
CU
TIV
E S
UM
MA
RY
10
TABLE 1-2: SUMMARY OF ENVIRONMENTAL IMPACTS ACROSS ALL COUNTRIES (IMPACT PER HOUSEHOLD PER YEAR)
COLOR KEY: LESS THAN 5TH
PERCENTILE
BETWEEN 5TH
PERCENTILE AND
25TH PERCENTILE
BETWEEN 25TH
PERCENTILE AND
75TH PERCENTILE
BETWEEN 75TH
PERCENTILE AND
95TH PERCENTILE
GREATER THAN
95TH PERCENTILE
UNPROCESSED SOLID BIOMASS
PROCESSED SOLID BIOMASS LIQUID/GAS OTHER
FIR
EW
OO
D
CR
OP
RE
SID
UE
DU
NG
CA
KE
CH
AR
CO
AL
BR
IQU
ET
TE
S
FR
OM
WO
OD
CH
AR
CO
AL
BR
IQU
ET
TE
S
FR
OM
BA
MB
OO
NO
N-C
AR
BO
NIZ
ED
BR
IQU
ET
TE
S
FR
OM
SA
WD
US
T
NO
N-C
AR
BO
NIZ
ED
BR
IQU
ET
TE
S
FR
OM
CR
OP
RE
SID
UE
S
WO
OD
PE
LL
ET
S
WO
OD
CH
IPS
ET
HA
NO
L F
RO
M
SU
GA
RC
AN
E
ET
HA
NO
L F
RO
M
WO
OD
BIO
GA
S F
RO
M
DU
NG
LP
G
KE
RO
SE
NE
*
NA
TU
RA
L G
AS
*
DM
E *
HA
RD
CO
AL
*
EL
EC
TR
ICIT
Y *
TOTAL ENERGY DEMAND (MJ/HH/YR)
CHINA 32,391 39,159 52,177 56,042 52,194 15,638 12,434 14,339 32,318 12,548 9,014 13,794 14,577 10,150 31,681 44,249 30,023
INDIA 30,981 9,670 51,628 40,989 47,704 37,110 13,098 8,362 12,976 26,127 8,507 7,306 7,852 10,373 55,317 21,853
BANGLADESH 16,742 23,441 23,441 16,965 6,733 5,150 7,338 14,663 4,787 4,111 4,702
GUATEMALA 104,300 211,088 207,685 117,412 52,361 40,199 51,041 42,721 33,129 28,453 48,630
NIGERIA 114,855 322,267 314,079 122,583 58,145 43,160 52,343 43,912 34,080 28,483 111,077
GHANA 35,444 99,451 96,924 37,657 15,898 12,749 16,153 13,532 10,517 8,790 34,245
KENYA 30,433 59,871 58,906 34,609 14,610 11,472 14,785 29,687 9,667 8,079 29,995
UGANDA 39,705 78,111 76,858 45,211 21,616 14,775 19,289 38,731 12,611 10,540 39,125
NET ENERGY DEMAND (MJ/HH/YR)**
CHINA 27,437 34,205 47,223 51,088 47,240 10,685 7,480 9,385 27,364 7,594 4,061 8,840 9,623 5,196 26,727 39,295 25,069
INDIA 26,966 5,655 47,613 36,974 43,689 33,095 9,083 4,347 8,961 22,112 4,492 3,291 3,837 6,358 51,302 17,838
BANGLADESH 14,483 21,182 21,182 14,706 4,474 2,890 5,078 12,404 2,528 1,852 2,443
GUATEMALA 88,663 195,451 192,049 101,776 36,724 24,563 35,405 27,084 17,492 12,817 32,993
NIGERIA 98,770 306,181 297,991 106,498 42,059 27,075 36,257 27,827 17,995 12,397 94,992
GHANA 30,480 94,487 91,960 32,693 10,934 7,785 11,189 8,568 5,553 3,826 29,281
KENYA 25,870 55,309 54,344 30,046 10,048 6,909 10,222 25,124 5,104 3,516 25,432
UGANDA 33,752 72,159 70,905 39,259 15,664 8,823 13,337 32,779 6,659 4,588 33,173

GLO
BA
L AL
LIA
NC
E FO
R C
LE
AN
CO
OK
ST
OV
ES
11
TABLE 1-2: SUMMARY OF ENVIRONMENTAL IMPACTS ACROSS ALL COUNTRIES (IMPACT PER HOUSEHOLD PER YEAR)
COLOR KEY: LESS THAN 5TH
PERCENTILE
BETWEEN 5TH
PERCENTILE AND
25TH PERCENTILE
BETWEEN 25TH
PERCENTILE AND
75TH PERCENTILE
BETWEEN 75TH
PERCENTILE AND
95TH PERCENTILE
GREATER THAN
95TH PERCENTILE
UNPROCESSED SOLID BIOMASS
PROCESSED SOLID BIOMASS LIQUID/GAS OTHER
FIR
EW
OO
D
CR
OP
RE
SID
UE
DU
NG
CA
KE
CH
AR
CO
AL
BR
IQU
ET
TE
S
FR
OM
WO
OD
CH
AR
CO
AL
BR
IQU
ET
TE
S
FR
OM
BA
MB
OO
NO
N-C
AR
BO
NIZ
ED
BR
IQU
ET
TE
S
FR
OM
SA
WD
US
T
NO
N-C
AR
BO
NIZ
ED
BR
IQU
ET
TE
S
FR
OM
CR
OP
RE
SID
UE
S
WO
OD
PE
LL
ET
S
WO
OD
CH
IPS
ET
HA
NO
L F
RO
M
SU
GA
RC
AN
E
ET
HA
NO
L F
RO
M
WO
OD
BIO
GA
S F
RO
M
DU
NG
LP
G
KE
RO
SE
NE
*
NA
TU
RA
L G
AS
*
DM
E *
HA
RD
CO
AL
*
EL
EC
TR
ICIT
Y *
TOTAL ENERGY DEMAND (MJ/HH/YR)
CHINA 32,391 39,159 52,177 56,042 52,194 15,638 12,434 14,339 32,318 12,548 9,014 13,794 14,577 10,150 31,681 44,249 30,023
INDIA 30,981 9,670 51,628 40,989 47,704 37,110 13,098 8,362 12,976 26,127 8,507 7,306 7,852 10,373 55,317 21,853
BANGLADESH 16,742 23,441 23,441 16,965 6,733 5,150 7,338 14,663 4,787 4,111 4,702
GUATEMALA 104,300 211,088 207,685 117,412 52,361 40,199 51,041 42,721 33,129 28,453 48,630
NIGERIA 114,855 322,267 314,079 122,583 58,145 43,160 52,343 43,912 34,080 28,483 111,077
GHANA 35,444 99,451 96,924 37,657 15,898 12,749 16,153 13,532 10,517 8,790 34,245
KENYA 30,433 59,871 58,906 34,609 14,610 11,472 14,785 29,687 9,667 8,079 29,995
UGANDA 39,705 78,111 76,858 45,211 21,616 14,775 19,289 38,731 12,611 10,540 39,125
NET ENERGY DEMAND (MJ/HH/YR)**
CHINA 27,437 34,205 47,223 51,088 47,240 10,685 7,480 9,385 27,364 7,594 4,061 8,840 9,623 5,196 26,727 39,295 25,069
INDIA 26,966 5,655 47,613 36,974 43,689 33,095 9,083 4,347 8,961 22,112 4,492 3,291 3,837 6,358 51,302 17,838
BANGLADESH 14,483 21,182 21,182 14,706 4,474 2,890 5,078 12,404 2,528 1,852 2,443
GUATEMALA 88,663 195,451 192,049 101,776 36,724 24,563 35,405 27,084 17,492 12,817 32,993
NIGERIA 98,770 306,181 297,991 106,498 42,059 27,075 36,257 27,827 17,995 12,397 94,992
GHANA 30,480 94,487 91,960 32,693 10,934 7,785 11,189 8,568 5,553 3,826 29,281
KENYA 25,870 55,309 54,344 30,046 10,048 6,909 10,222 25,124 5,104 3,516 25,432
UGANDA 33,752 72,159 70,905 39,259 15,664 8,823 13,337 32,779 6,659 4,588 33,173
CONTINUED

CO
MP
AR
AT
IVE
AN
ALY
SIS
OF
FU
EL
S FO
R C
OO
KIN
G: L
IFE
CY
CL
E E
NV
IRO
NM
EN
TAL IM
PA
CT
S A
ND
EC
ON
OM
IC A
ND
SO
CIA
L CO
NS
IDE
RA
TIO
NS
// E
XE
CU
TIV
E S
UM
MA
RY
12
UNPROCESSED SOLID BIOMASS
PROCESSED SOLID BIOMASS LIQUID/GAS OTHER
FIR
EW
OO
D
CR
OP
RE
SID
UE
DU
NG
CA
KE
CH
AR
CO
AL
BR
IQU
ET
TE
S
FR
OM
WO
OD
CH
AR
CO
AL
BR
IQU
ET
TE
S
FR
OM
BA
MB
OO
NO
N-C
AR
BO
NIZ
ED
BR
IQU
ET
TE
S
FR
OM
SA
WD
US
T
NO
N-C
AR
BO
NIZ
ED
BR
IQU
ET
TE
S
FR
OM
CR
OP
RE
SID
UE
S
WO
OD
PE
LL
ET
S
WO
OD
CH
IPS
ET
HA
NO
L F
RO
M
SU
GA
RC
AN
E
ET
HA
NO
L F
RO
M
WO
OD
BIO
GA
S F
RO
M
DU
NG
LP
G
KE
RO
SE
NE
*
NA
TU
RA
L G
AS
*
DM
E *
HA
RD
CO
AL
*
EL
EC
TR
ICIT
Y *
GLOBAL CLIMATE CHANGE POTENTIAL (KG CO 2 EQ/ HOUSEHOLD/YEAR)
CHINA 1,390 271 2,824 1,496 264 198 949 754 439 40.4 52.1 930 1,027 1,056 1,711 3,885 2,458
INDIA 2,166 530 765 2,298 1,132 277 215 683 644 384 43.3 42.2 1,206 728 3,865 1,665
BANGLADESH 1,875 2,279 470 204 103 860 820 195 18.5 23.8 671
GUATEMALA 11,728 19,682 5,616 1,380 349 5,720 5,714 236 123 164 4,768
NIGERIA 12,929 24,512 4,976 1,428 737 6,010 5,851 241 126 48.0 6,214
GHANA 3,990 7,595 1,536 470 226 1,826 1,805 72.9 43.7 14.8 1,915
KENYA 3,422 5,400 1,686 505 208 1,649 1,663 399 35.7 13.6 1,529
UGANDA 4,464 7,027 2,200 508 271 2,121 2,170 540 43.7 17.8 2,007
BLACK CARBON AND SHORT-LIVED CLIMATE POLLUTANTS (KG BC EQ/HOUSEHOLD/YEAR)
CHINA 1.48 3.43 21.2 4.32 0.63 0.71 0.053 1.09 -0.038 0.023 0.034 -0.087 -0.16 -0.011 0.27 0.23 -0.60
INDIA 4.19 9.72 20.1 17.2 9.58 1.78 3.37 0.080 1.79 -0.022 0.019 0.027 0.045 0.045 15.7 -0.076
BANGLADESH 1.70 1.28 1.28 1.20 1.90 0.045 0.74 -0.014 0.010 0.015 0.0028
GUATEMALA 9.97 68.1 68.1 7.49 2.30 0.33 4.84 0.023 0.072 0.11 -0.40
NIGERIA 11.0 27.2 26.6 7.70 13.5 0.34 4.97 0.025 0.074 0.16 0.27
GHANA 3.39 8.40 8.22 2.37 4.17 0.10 1.53 0.0084 0.023 0.051 0.083
KENYA 2.91 7.66 7.51 2.19 3.83 0.093 0.50 -0.032 0.021 0.047 0.031
UGANDA 3.80 10.0 9.79 2.84 5.00 0.12 0.65 -0.040 0.027 0.061 0.042
TABLE 1-2: SUMMARY OF ENVIRONMENTAL IMPACTS ACROSS ALL COUNTRIES (IMPACT PER HOUSEHOLD PER YEAR), CONTINUED
COLOR KEY: 0 - 5TH PERCENTILE 5TH - 25TH PERCENTILE 25TH - 75TH PERCENTILE 75TH - 95TH PERCENTILE 95TH - 100TH PERCENTILE

GLO
BA
L AL
LIA
NC
E FO
R C
LE
AN
CO
OK
ST
OV
ES
13
UNPROCESSED SOLID BIOMASS
PROCESSED SOLID BIOMASS LIQUID/GAS OTHER
FIR
EW
OO
D
CR
OP
RE
SID
UE
DU
NG
CA
KE
CH
AR
CO
AL
BR
IQU
ET
TE
S
FR
OM
WO
OD
CH
AR
CO
AL
BR
IQU
ET
TE
S
FR
OM
BA
MB
OO
NO
N-C
AR
BO
NIZ
ED
BR
IQU
ET
TE
S
FR
OM
SA
WD
US
T
NO
N-C
AR
BO
NIZ
ED
BR
IQU
ET
TE
S
FR
OM
CR
OP
RE
SID
UE
S
WO
OD
PE
LL
ET
S
WO
OD
CH
IPS
ET
HA
NO
L F
RO
M
SU
GA
RC
AN
E
ET
HA
NO
L F
RO
M
WO
OD
BIO
GA
S F
RO
M
DU
NG
LP
G
KE
RO
SE
NE
*
NA
TU
RA
L G
AS
*
DM
E *
HA
RD
CO
AL
*
EL
EC
TR
ICIT
Y *
GLOBAL CLIMATE CHANGE POTENTIAL (KG CO 2 EQ/ HOUSEHOLD/YEAR)
CHINA 1,390 271 2,824 1,496 264 198 949 754 439 40.4 52.1 930 1,027 1,056 1,711 3,885 2,458
INDIA 2,166 530 765 2,298 1,132 277 215 683 644 384 43.3 42.2 1,206 728 3,865 1,665
BANGLADESH 1,875 2,279 470 204 103 860 820 195 18.5 23.8 671
GUATEMALA 11,728 19,682 5,616 1,380 349 5,720 5,714 236 123 164 4,768
NIGERIA 12,929 24,512 4,976 1,428 737 6,010 5,851 241 126 48.0 6,214
GHANA 3,990 7,595 1,536 470 226 1,826 1,805 72.9 43.7 14.8 1,915
KENYA 3,422 5,400 1,686 505 208 1,649 1,663 399 35.7 13.6 1,529
UGANDA 4,464 7,027 2,200 508 271 2,121 2,170 540 43.7 17.8 2,007
BLACK CARBON AND SHORT-LIVED CLIMATE POLLUTANTS (KG BC EQ/HOUSEHOLD/YEAR)
CHINA 1.48 3.43 21.2 4.32 0.63 0.71 0.053 1.09 -0.038 0.023 0.034 -0.087 -0.16 -0.011 0.27 0.23 -0.60
INDIA 4.19 9.72 20.1 17.2 9.58 1.78 3.37 0.080 1.79 -0.022 0.019 0.027 0.045 0.045 15.7 -0.076
BANGLADESH 1.70 1.28 1.28 1.20 1.90 0.045 0.74 -0.014 0.010 0.015 0.0028
GUATEMALA 9.97 68.1 68.1 7.49 2.30 0.33 4.84 0.023 0.072 0.11 -0.40
NIGERIA 11.0 27.2 26.6 7.70 13.5 0.34 4.97 0.025 0.074 0.16 0.27
GHANA 3.39 8.40 8.22 2.37 4.17 0.10 1.53 0.0084 0.023 0.051 0.083
KENYA 2.91 7.66 7.51 2.19 3.83 0.093 0.50 -0.032 0.021 0.047 0.031
UGANDA 3.80 10.0 9.79 2.84 5.00 0.12 0.65 -0.040 0.027 0.061 0.042
TABLE 1-2: SUMMARY OF ENVIRONMENTAL IMPACTS ACROSS ALL COUNTRIES (IMPACT PER HOUSEHOLD PER YEAR), CONTINUED
COLOR KEY: 0 - 5TH PERCENTILE 5TH - 25TH PERCENTILE 25TH - 75TH PERCENTILE 75TH - 95TH PERCENTILE 95TH - 100TH PERCENTILE
CONTINUED

CO
MP
AR
AT
IVE
AN
ALY
SIS
OF
FU
EL
S FO
R C
OO
KIN
G: L
IFE
CY
CL
E E
NV
IRO
NM
EN
TAL IM
PA
CT
S A
ND
EC
ON
OM
IC A
ND
SO
CIA
L CO
NS
IDE
RA
TIO
NS
// E
XE
CU
TIV
E S
UM
MA
RY
14
UNPROCESSED SOLID BIOMASS
PROCESSED SOLID BIOMASS LIQUID/GAS OTHER
FIR
EW
OO
D
CR
OP
RE
SID
UE
DU
NG
CA
KE
CH
AR
CO
AL
BR
IQU
ET
TE
S
FR
OM
WO
OD
CH
AR
CO
AL
BR
IQU
ET
TE
S
FR
OM
BA
MB
OO
NO
N-C
AR
BO
NIZ
ED
BR
IQU
ET
TE
S
FR
OM
SA
WD
US
T
NO
N-C
AR
BO
NIZ
ED
BR
IQU
ET
TE
S
FR
OM
CR
OP
RE
SID
UE
S
WO
OD
PE
LL
ET
S
WO
OD
CH
IPS
ET
HA
NO
L F
RO
M
SU
GA
RC
AN
E
ET
HA
NO
L F
RO
M
WO
OD
BIO
GA
S F
RO
M
DU
NG
LP
G
KE
RO
SE
NE
*
NA
TU
RA
L G
AS
*
DM
E *
HA
RD
CO
AL
*
EL
EC
TR
ICIT
Y *
PARTICULATE MATTER FORMATION POTENTIAL (KG PM10 EQ/HOUSEHOLD/YEAR)
CHINA 7.36 16.9 96.6 13.6 29.2 3.25 1.10 4.65 0.83 1.01 0.38 0.98 1.15 0.28 3.73 3.37 6.61
INDIA 19.0 45.4 94.9 78.3 41.2 19.8 15.9 0.85 8.27 0.67 0.28 0.31 0.62 1.24 77.5 6.77
BANGLADESH 6.84 2.69 2.69 4.92 8.86 0.31 2.99 0.34 0.15 0.17 0.26
GUATEMALA 34.0 305 305 25.8 9.51 2.49 16.6 0.76 1.01 1.21 1.47
NIGERIA 37.4 102 99.0 29.6 63.1 2.02 17.0 0.76 1.04 0.84 1.92
GHANA 11.5 31.6 30.6 9.08 19.5 0.68 5.25 0.23 0.33 0.26 0.59
KENYA 9.93 28.9 28.1 8.47 17.9 0.61 4.82 0.73 0.29 0.24 0.89
UGANDA 12.9 37.6 37.0 10.7 23.3 0.73 6.29 0.98 0.38 0.31 1.18
FOSSIL FUEL DEPLETION (KG OIL EQ/HOUSEHOLD/YEAR)
CHINA 0.012 0.076 0.97 1.09 12.4 16.9 41.2 4.07 78.5 2.62 0 319 335 241 550 782 474
INDIA 0.026 0.030 0.62 0.47 0.50 5.29 7.21 25.1 0.54 73.4 4.30 0 201 264 974 367
BANGLADESH 0.015 0.036 0.057 0.018 0.0060 22.2 1.01 34.0 2.42 0 111
GUATEMALA 0.079 0.16 0.30 0.12 0.0094 59.8 12.7 41.6 16.7 0 1,667
NIGERIA 0.11 0.25 0.19 2.01 2.41 128 4.60 42.0 17.2 0 2,605
GHANA 0.033 0.067 0.038 0.33 0.40 21.6 1.42 12.5 5.31 0 803
KENYA 0.025 0.046 0.045 0.26 0.27 14.8 1.15 70.4 4.88 0 708
UGANDA 0.033 0.047 0.11 0.18 0.24 12.8 1.50 91.9 6.36 0 923
TABLE 1-2: SUMMARY OF ENVIRONMENTAL IMPACTS ACROSS ALL COUNTRIES (IMPACT PER HOUSEHOLD PER YEAR), CONTINUED
COLOR KEY: 0 - 5TH PERCENTILE 5TH - 25TH PERCENTILE 25TH - 75TH PERCENTILE 75TH - 95TH PERCENTILE 95TH - 100TH PERCENTILE

GLO
BA
L AL
LIA
NC
E FO
R C
LE
AN
CO
OK
ST
OV
ES
15
UNPROCESSED SOLID BIOMASS
PROCESSED SOLID BIOMASS LIQUID/GAS OTHER
FIR
EW
OO
D
CR
OP
RE
SID
UE
DU
NG
CA
KE
CH
AR
CO
AL
BR
IQU
ET
TE
S
FR
OM
WO
OD
CH
AR
CO
AL
BR
IQU
ET
TE
S
FR
OM
BA
MB
OO
NO
N-C
AR
BO
NIZ
ED
BR
IQU
ET
TE
S
FR
OM
SA
WD
US
T
NO
N-C
AR
BO
NIZ
ED
BR
IQU
ET
TE
S
FR
OM
CR
OP
RE
SID
UE
S
WO
OD
PE
LL
ET
S
WO
OD
CH
IPS
ET
HA
NO
L F
RO
M
SU
GA
RC
AN
E
ET
HA
NO
L F
RO
M
WO
OD
BIO
GA
S F
RO
M
DU
NG
LP
G
KE
RO
SE
NE
*
NA
TU
RA
L G
AS
*
DM
E *
HA
RD
CO
AL
*
EL
EC
TR
ICIT
Y *
PARTICULATE MATTER FORMATION POTENTIAL (KG PM10 EQ/HOUSEHOLD/YEAR)
CHINA 7.36 16.9 96.6 13.6 29.2 3.25 1.10 4.65 0.83 1.01 0.38 0.98 1.15 0.28 3.73 3.37 6.61
INDIA 19.0 45.4 94.9 78.3 41.2 19.8 15.9 0.85 8.27 0.67 0.28 0.31 0.62 1.24 77.5 6.77
BANGLADESH 6.84 2.69 2.69 4.92 8.86 0.31 2.99 0.34 0.15 0.17 0.26
GUATEMALA 34.0 305 305 25.8 9.51 2.49 16.6 0.76 1.01 1.21 1.47
NIGERIA 37.4 102 99.0 29.6 63.1 2.02 17.0 0.76 1.04 0.84 1.92
GHANA 11.5 31.6 30.6 9.08 19.5 0.68 5.25 0.23 0.33 0.26 0.59
KENYA 9.93 28.9 28.1 8.47 17.9 0.61 4.82 0.73 0.29 0.24 0.89
UGANDA 12.9 37.6 37.0 10.7 23.3 0.73 6.29 0.98 0.38 0.31 1.18
FOSSIL FUEL DEPLETION (KG OIL EQ/HOUSEHOLD/YEAR)
CHINA 0.012 0.076 0.97 1.09 12.4 16.9 41.2 4.07 78.5 2.62 0 319 335 241 550 782 474
INDIA 0.026 0.030 0.62 0.47 0.50 5.29 7.21 25.1 0.54 73.4 4.30 0 201 264 974 367
BANGLADESH 0.015 0.036 0.057 0.018 0.0060 22.2 1.01 34.0 2.42 0 111
GUATEMALA 0.079 0.16 0.30 0.12 0.0094 59.8 12.7 41.6 16.7 0 1,667
NIGERIA 0.11 0.25 0.19 2.01 2.41 128 4.60 42.0 17.2 0 2,605
GHANA 0.033 0.067 0.038 0.33 0.40 21.6 1.42 12.5 5.31 0 803
KENYA 0.025 0.046 0.045 0.26 0.27 14.8 1.15 70.4 4.88 0 708
UGANDA 0.033 0.047 0.11 0.18 0.24 12.8 1.50 91.9 6.36 0 923
TABLE 1-2: SUMMARY OF ENVIRONMENTAL IMPACTS ACROSS ALL COUNTRIES (IMPACT PER HOUSEHOLD PER YEAR), CONTINUED
COLOR KEY: 0 - 5TH PERCENTILE 5TH - 25TH PERCENTILE 25TH - 75TH PERCENTILE 75TH - 95TH PERCENTILE 95TH - 100TH PERCENTILE
CONTINUED
CO
MP
AR
AT
IVE
AN
ALY
SIS
OF
FU
EL
S FO
R C
OO
KIN
G: L
IFE
CY
CL
E E
NV
IRO
NM
EN
TAL IM
PA
CT
S A
ND
EC
ON
OM
IC A
ND
SO
CIA
L CO
NS
IDE
RA
TIO
NS
// E
XE
CU
TIV
E S
UM
MA
RY
16
UNPROCESSED SOLID BIOMASS
PROCESSED SOLID BIOMASS LIQUID/GAS OTHER
FIR
EW
OO
D
CR
OP
RE
SID
UE
DU
NG
CA
KE
CH
AR
CO
AL
BR
IQU
ET
TE
S
FR
OM
WO
OD
CH
AR
CO
AL
BR
IQU
ET
TE
S
FR
OM
BA
MB
OO
NO
N-C
AR
BO
NIZ
ED
BR
IQU
ET
TE
S
FR
OM
SA
WD
US
T
NO
N-C
AR
BO
NIZ
ED
BR
IQU
ET
TE
S
FR
OM
CR
OP
RE
SID
UE
S
WO
OD
PE
LL
ET
S
WO
OD
CH
IPS
ET
HA
NO
L F
RO
M
SU
GA
RC
AN
E
ET
HA
NO
L F
RO
M
WO
OD
BIO
GA
S F
RO
M
DU
NG
LP
G
KE
RO
SE
NE
*
NA
TU
RA
L G
AS
*
DM
E *
HA
RD
CO
AL
*
EL
EC
TR
ICIT
Y *
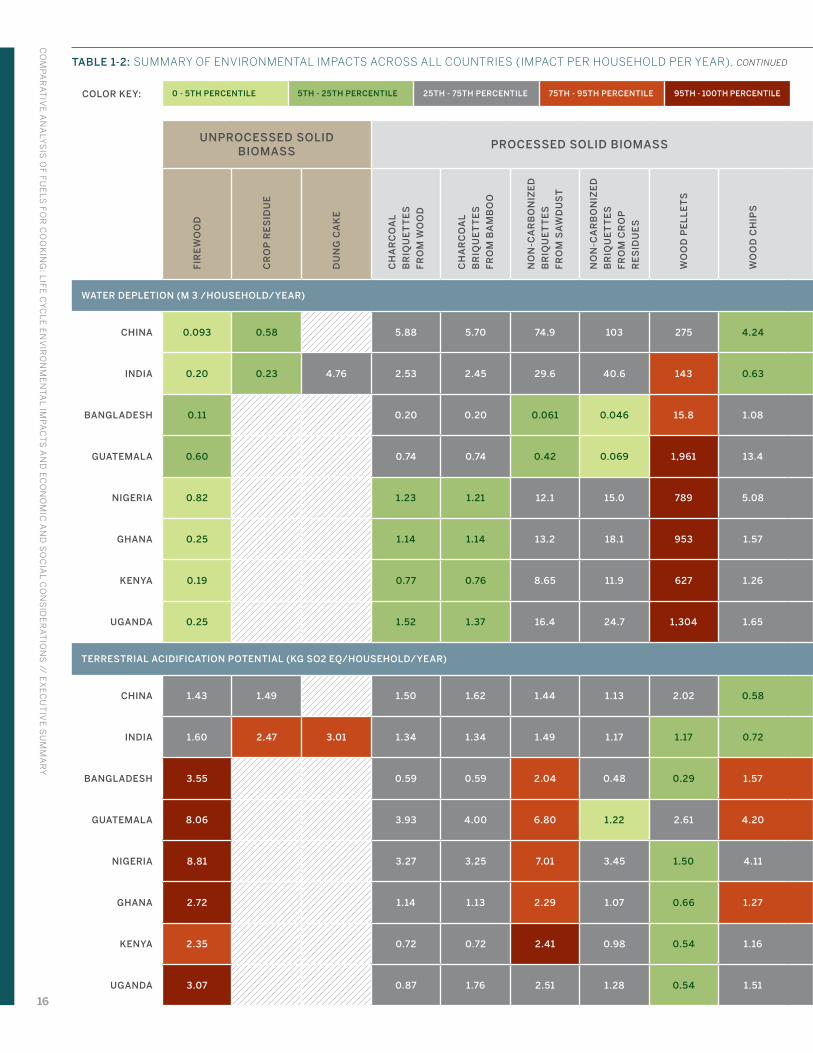
WATER DEPLETION (M 3 /HOUSEHOLD/YEAR)
CHINA 0.093 0.58 5.88 5.70 74.9 103 275 4.24 343 23.3 5.16 283 358 28.6 136 378 2,598
INDIA 0.20 0.23 4.76 2.53 2.45 29.6 40.6 143 0.63 356 1.12 4.18 123 146 66.7 2,066
BANGLADESH 0.11 0.20 0.20 0.061 0.046 15.8 1.08 155 0.63 2.36 44.7
GUATEMALA 0.60 0.74 0.74 0.42 0.069 1,961 13.4 255 4.35 16.3 139
NIGERIA 0.82 1.23 1.21 12.1 15.0 789 5.08 262 4.48 51.5 151
GHANA 0.25 1.14 1.14 13.2 18.1 953 1.57 80.6 1.38 15.9 73.8
KENYA 0.19 0.77 0.76 8.65 11.9 627 1.26 315 1.27 14.6 276
UGANDA 0.25 1.52 1.37 16.4 24.7 1,304 1.65 411 1.66 19.0 379
TERRESTRIAL ACIDIFICATION POTENTIAL (KG SO2 EQ/HOUSEHOLD/YEAR)
CHINA 1.43 1.49 1.50 1.62 1.44 1.13 2.02 0.58 2.57 0.61 0.53 3.38 4.30 0.84 5.86 7.92 21.2
INDIA 1.60 2.47 3.01 1.34 1.34 1.49 1.17 1.17 0.72 2.00 0.37 0.43 1.29 1.60 7.51 16.1
BANGLADESH 3.55 0.59 0.59 2.04 0.48 0.29 1.57 1.05 0.19 0.24 0.66
GUATEMALA 8.06 3.93 4.00 6.80 1.22 2.61 4.20 3.35 1.27 1.66 3.63
NIGERIA 8.81 3.27 3.25 7.01 3.45 1.50 4.11 3.39 1.30 0.25 4.13
GHANA 2.72 1.14 1.13 2.29 1.07 0.66 1.27 1.01 0.42 0.076 1.26
KENYA 2.35 0.72 0.72 2.41 0.98 0.54 1.16 2.24 0.37 0.070 2.26
UGANDA 3.07 0.87 1.76 2.51 1.28 0.54 1.51 3.00 0.47 0.091 2.99
TABLE 1-2: SUMMARY OF ENVIRONMENTAL IMPACTS ACROSS ALL COUNTRIES (IMPACT PER HOUSEHOLD PER YEAR), CONTINUED
COLOR KEY: 0 - 5TH PERCENTILE 5TH - 25TH PERCENTILE 25TH - 75TH PERCENTILE 75TH - 95TH PERCENTILE 95TH - 100TH PERCENTILE

GLO
BA
L AL
LIA
NC
E FO
R C
LE
AN
CO
OK
ST
OV
ES
17
UNPROCESSED SOLID BIOMASS
PROCESSED SOLID BIOMASS LIQUID/GAS OTHER
FIR
EW
OO
D
CR
OP
RE
SID
UE
DU
NG
CA
KE
CH
AR
CO
AL
BR
IQU
ET
TE
S
FR
OM
WO
OD
CH
AR
CO
AL
BR
IQU
ET
TE
S
FR
OM
BA
MB
OO
NO
N-C
AR
BO
NIZ
ED
BR
IQU
ET
TE
S
FR
OM
SA
WD
US
T
NO
N-C
AR
BO
NIZ
ED
BR
IQU
ET
TE
S
FR
OM
CR
OP
RE
SID
UE
S
WO
OD
PE
LL
ET
S
WO
OD
CH
IPS
ET
HA
NO
L F
RO
M
SU
GA
RC
AN
E
ET
HA
NO
L F
RO
M
WO
OD
BIO
GA
S F
RO
M
DU
NG
LP
G
KE
RO
SE
NE
*
NA
TU
RA
L G
AS
*
DM
E *
HA
RD
CO
AL
*
EL
EC
TR
ICIT
Y *
WATER DEPLETION (M 3 /HOUSEHOLD/YEAR)
CHINA 0.093 0.58 5.88 5.70 74.9 103 275 4.24 343 23.3 5.16 283 358 28.6 136 378 2,598
INDIA 0.20 0.23 4.76 2.53 2.45 29.6 40.6 143 0.63 356 1.12 4.18 123 146 66.7 2,066
BANGLADESH 0.11 0.20 0.20 0.061 0.046 15.8 1.08 155 0.63 2.36 44.7
GUATEMALA 0.60 0.74 0.74 0.42 0.069 1,961 13.4 255 4.35 16.3 139
NIGERIA 0.82 1.23 1.21 12.1 15.0 789 5.08 262 4.48 51.5 151
GHANA 0.25 1.14 1.14 13.2 18.1 953 1.57 80.6 1.38 15.9 73.8
KENYA 0.19 0.77 0.76 8.65 11.9 627 1.26 315 1.27 14.6 276
UGANDA 0.25 1.52 1.37 16.4 24.7 1,304 1.65 411 1.66 19.0 379
TERRESTRIAL ACIDIFICATION POTENTIAL (KG SO2 EQ/HOUSEHOLD/YEAR)
CHINA 1.43 1.49 1.50 1.62 1.44 1.13 2.02 0.58 2.57 0.61 0.53 3.38 4.30 0.84 5.86 7.92 21.2
INDIA 1.60 2.47 3.01 1.34 1.34 1.49 1.17 1.17 0.72 2.00 0.37 0.43 1.29 1.60 7.51 16.1
BANGLADESH 3.55 0.59 0.59 2.04 0.48 0.29 1.57 1.05 0.19 0.24 0.66
GUATEMALA 8.06 3.93 4.00 6.80 1.22 2.61 4.20 3.35 1.27 1.66 3.63
NIGERIA 8.81 3.27 3.25 7.01 3.45 1.50 4.11 3.39 1.30 0.25 4.13
GHANA 2.72 1.14 1.13 2.29 1.07 0.66 1.27 1.01 0.42 0.076 1.26
KENYA 2.35 0.72 0.72 2.41 0.98 0.54 1.16 2.24 0.37 0.070 2.26
UGANDA 3.07 0.87 1.76 2.51 1.28 0.54 1.51 3.00 0.47 0.091 2.99
TABLE 1-2: SUMMARY OF ENVIRONMENTAL IMPACTS ACROSS ALL COUNTRIES (IMPACT PER HOUSEHOLD PER YEAR), CONTINUED
COLOR KEY: 0 - 5TH PERCENTILE 5TH - 25TH PERCENTILE 25TH - 75TH PERCENTILE 75TH - 95TH PERCENTILE 95TH - 100TH PERCENTILE
CONTINUED

CO
MP
AR
AT
IVE
AN
ALY
SIS
OF
FU
EL
S FO
R C
OO
KIN
G: L
IFE
CY
CL
E E
NV
IRO
NM
EN
TAL IM
PA
CT
S A
ND
EC
ON
OM
IC A
ND
SO
CIA
L CO
NS
IDE
RA
TIO
NS
// E
XE
CU
TIV
E S
UM
MA
RY
18
UNPROCESSED SOLID BIOMASS
PROCESSED SOLID BIOMASS LIQUID/GAS OTHER
FIR
EW
OO
D
CR
OP
RE
SID
UE
DU
NG
CA
KE
CH
AR
CO
AL
BR
IQU
ET
TE
S
FR
OM
WO
OD
CH
AR
CO
AL
BR
IQU
ET
TE
S
FR
OM
BA
MB
OO
NO
N-C
AR
BO
NIZ
ED
BR
IQU
ET
TE
S
FR
OM
SA
WD
US
T
NO
N-C
AR
BO
NIZ
ED
BR
IQU
ET
TE
S
FR
OM
CR
OP
RE
SID
UE
S
WO
OD
PE
LL
ET
S
WO
OD
CH
IPS
ET
HA
NO
L F
RO
M
SU
GA
RC
AN
E
ET
HA
NO
L F
RO
M
WO
OD
BIO
GA
S F
RO
M
DU
NG
LP
G
KE
RO
SE
NE
*
NA
TU
RA
L G
AS
*
DM
E *
HA
RD
CO
AL
*
EL
EC
TR
ICIT
Y *
FRESHWATER EUTROPHICATION POTENTIAL (KG P EQ/HOUSEHOLD/YEAR)
CHINA 0.30 1.88 1.38 0.81 0.40 0.082 0.043 0.10 0.17 0.023 0 0.040 0.051 0.0034 0.31 0.44 0.31
INDIA 0.63 0.75 15.3 1.12 0.86 0.30 0.26 0.014 0.27 0.15 1.3E-05 0 0.011 0.013 0.0086 0.014
BANGLADESH 0.37 0.64 0.64 0.20 0.15 0.0073 0.16 0.079 7.4E-06 0 0.0056
GUATEMALA 1.95 2.36 2.36 1.36 0.22 0.064 0.94 0.13 5.1E-05 0 0.024
NIGERIA 2.65 1.26 1.23 1.48 1.05 0.049 1.20 0.13 5.3E-05 0 0.019
GHANA 0.82 0.39 0.38 0.42 0.32 0.016 0.37 0.040 1.6E-05 0 0.0059
KENYA 0.62 0.31 0.31 0.39 0.30 0.015 0.30 0.16 1.5E-05 0 0.036
UGANDA 0.81 0.41 0.40 0.48 0.39 0.018 0.39 0.21 1.9E-05 0 0.047
PHOTOCHEMICAL OXIDANT FORMATION POTENTIAL (KG NMVOC EQ/HOUSEHOLD/YEAR)
CHINA 8.96 12.5 51.9 120 5.61 5.49 1.37 9.77 1.61 0.53 0.56 1.98 2.10 1.12 9.97 5.94 9.26
INDIA 24.2 35.1 74.9 42.3 71.9 12.4 12.3 0.95 10.5 1.37 0.90 0.46 2.92 4.65 31.6 8.08
BANGLADESH 8.96 61.4 61.4 39.3 6.86 0.50 26.1 0.64 0.46 0.51 1.48
GUATEMALA 362 287 287 273 16.3 3.43 176 13.5 3.16 1.78 9.27
NIGERIA 399 455 452 280 48.9 3.13 180 13.8 3.25 1.31 34.9
GHANA 123 141 140 86.5 15.1 0.53 55.7 4.24 1.04 0.40 10.8
KENYA 106 129 129 80.1 13.9 0.88 51.1 1.38 0.92 0.37 7.42
UGANDA 138 168 169 103 18.1 0.98 66.7 1.94 1.18 0.48 9.77
NOTES FOR TABLE 1-2:
Calculated values in the table are rounded and displayed to atleast two significant figures. When determining percentiles (and accompanying color-coding), more significant digits were used. As a result, values that appear the same in the table may be color-coded differently. Cells filled with diagonal lines denote that those fuels were not assessed for that country.
* These fuels are included in the study scope only for India and/or China through a companion study conducted by the U.S. EPA.
** Net Energy Demand is Total Energy Demand minus the final energy actually delivered to the cooking pot.
TABLE 1-2: SUMMARY OF ENVIRONMENTAL IMPACTS ACROSS ALL COUNTRIES (IMPACT PER HOUSEHOLD PER YEAR), CONTINUED
COLOR KEY: 0 - 5TH PERCENTILE 5TH - 25TH PERCENTILE 25TH - 75TH PERCENTILE 75TH - 95TH PERCENTILE 95TH - 100TH PERCENTILE

GLO
BA
L AL
LIA
NC
E FO
R C
LE
AN
CO
OK
ST
OV
ES
19
UNPROCESSED SOLID BIOMASS
PROCESSED SOLID BIOMASS LIQUID/GAS OTHER
FIR
EW
OO
D
CR
OP
RE
SID
UE
DU
NG
CA
KE
CH
AR
CO
AL
BR
IQU
ET
TE
S
FR
OM
WO
OD
CH
AR
CO
AL
BR
IQU
ET
TE
S
FR
OM
BA
MB
OO
NO
N-C
AR
BO
NIZ
ED
BR
IQU
ET
TE
S
FR
OM
SA
WD
US
T
NO
N-C
AR
BO
NIZ
ED
BR
IQU
ET
TE
S
FR
OM
CR
OP
RE
SID
UE
S
WO
OD
PE
LL
ET
S
WO
OD
CH
IPS
ET
HA
NO
L F
RO
M
SU
GA
RC
AN
E
ET
HA
NO
L F
RO
M
WO
OD
BIO
GA
S F
RO
M
DU
NG
LP
G
KE
RO
SE
NE
*
NA
TU
RA
L G
AS
*
DM
E *
HA
RD
CO
AL
*
EL
EC
TR
ICIT
Y *
FRESHWATER EUTROPHICATION POTENTIAL (KG P EQ/HOUSEHOLD/YEAR)
CHINA 0.30 1.88 1.38 0.81 0.40 0.082 0.043 0.10 0.17 0.023 0 0.040 0.051 0.0034 0.31 0.44 0.31
INDIA 0.63 0.75 15.3 1.12 0.86 0.30 0.26 0.014 0.27 0.15 1.3E-05 0 0.011 0.013 0.0086 0.014
BANGLADESH 0.37 0.64 0.64 0.20 0.15 0.0073 0.16 0.079 7.4E-06 0 0.0056
GUATEMALA 1.95 2.36 2.36 1.36 0.22 0.064 0.94 0.13 5.1E-05 0 0.024
NIGERIA 2.65 1.26 1.23 1.48 1.05 0.049 1.20 0.13 5.3E-05 0 0.019
GHANA 0.82 0.39 0.38 0.42 0.32 0.016 0.37 0.040 1.6E-05 0 0.0059
KENYA 0.62 0.31 0.31 0.39 0.30 0.015 0.30 0.16 1.5E-05 0 0.036
UGANDA 0.81 0.41 0.40 0.48 0.39 0.018 0.39 0.21 1.9E-05 0 0.047
PHOTOCHEMICAL OXIDANT FORMATION POTENTIAL (KG NMVOC EQ/HOUSEHOLD/YEAR)
CHINA 8.96 12.5 51.9 120 5.61 5.49 1.37 9.77 1.61 0.53 0.56 1.98 2.10 1.12 9.97 5.94 9.26
INDIA 24.2 35.1 74.9 42.3 71.9 12.4 12.3 0.95 10.5 1.37 0.90 0.46 2.92 4.65 31.6 8.08
BANGLADESH 8.96 61.4 61.4 39.3 6.86 0.50 26.1 0.64 0.46 0.51 1.48
GUATEMALA 362 287 287 273 16.3 3.43 176 13.5 3.16 1.78 9.27
NIGERIA 399 455 452 280 48.9 3.13 180 13.8 3.25 1.31 34.9
GHANA 123 141 140 86.5 15.1 0.53 55.7 4.24 1.04 0.40 10.8
KENYA 106 129 129 80.1 13.9 0.88 51.1 1.38 0.92 0.37 7.42
UGANDA 138 168 169 103 18.1 0.98 66.7 1.94 1.18 0.48 9.77
TABLE 1-2: SUMMARY OF ENVIRONMENTAL IMPACTS ACROSS ALL COUNTRIES (IMPACT PER HOUSEHOLD PER YEAR), CONTINUED
COLOR KEY: 0 - 5TH PERCENTILE 5TH - 25TH PERCENTILE 25TH - 75TH PERCENTILE 75TH - 95TH PERCENTILE 95TH - 100TH PERCENTILE
CO
MP
AR
AT
IVE
AN
ALY
SIS
OF
FU
EL
S FO
R C
OO
KIN
G: L
IFE
CY
CL
E E
NV
IRO
NM
EN
TAL IM
PA
CT
S A
ND
EC
ON
OM
IC A
ND
SO
CIA
L CO
NS
IDE
RA
TIO
NS
// E
XE
CU
TIV
E S
UM
MA
RY
20
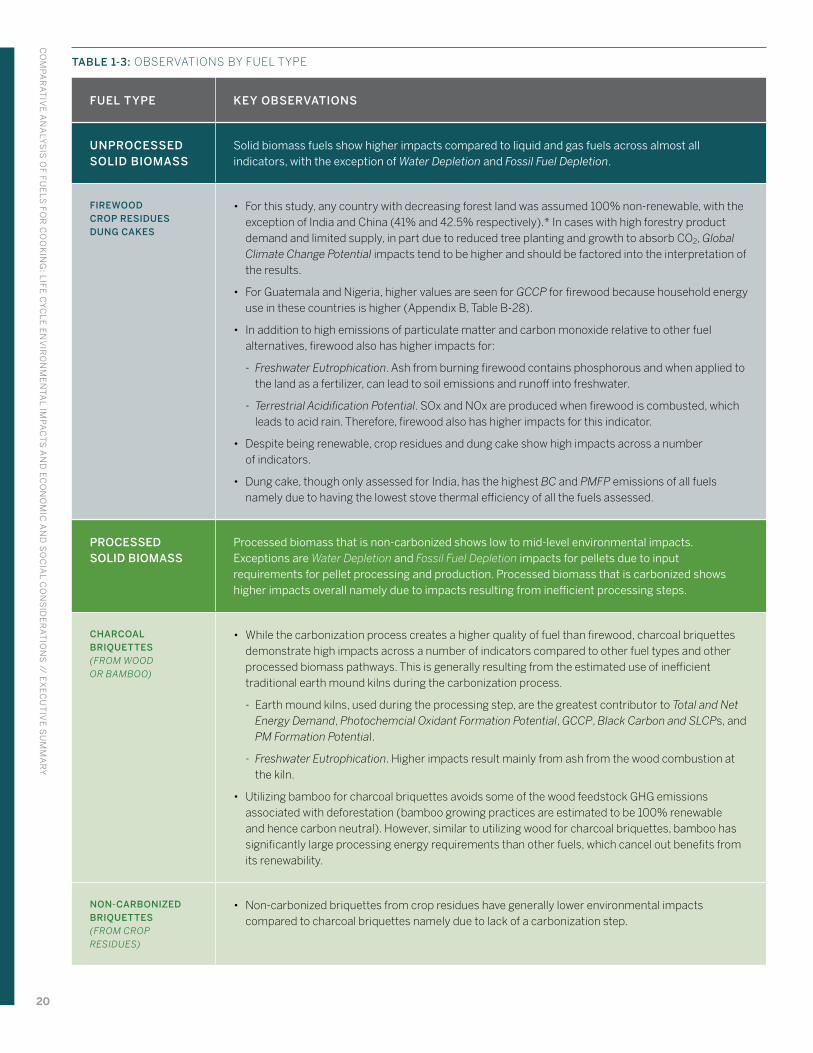
TABLE 1-3: OBSERVATIONS BY FUEL TYPE
FUEL TYPE KEY OBSERVATIONS
UNPROCESSED SOLID BIOMASS
Solid biomass fuels show higher impacts compared to liquid and gas fuels across almost all indicators, with the exception of Water Depletion and Fossil Fuel Depletion.
FIREWOOD CROP RESIDUES DUNG CAKES
• For this study, any country with decreasing forest land was assumed 100% non-renewable, with the exception of India and China (41% and 42.5% respectively).* In cases with high forestry product demand and limited supply, in part due to reduced tree planting and growth to absorb CO2, Global Climate Change Potential impacts tend to be higher and should be factored into the interpretation of the results.
• For Guatemala and Nigeria, higher values are seen for GCCP for firewood because household energy use in these countries is higher (Appendix B, Table B-28).
• In addition to high emissions of particulate matter and carbon monoxide relative to other fuel alternatives, firewood also has higher impacts for:
- Freshwater Eutrophication. Ash from burning firewood contains phosphorous and when applied to the land as a fertilizer, can lead to soil emissions and runoff into freshwater.
- Terrestrial Acidification Potential. SOx and NOx are produced when firewood is combusted, which leads to acid rain. Therefore, firewood also has higher impacts for this indicator.
• Despite being renewable, crop residues and dung cake show high impacts across a number of indicators.
• Dung cake, though only assessed for India, has the highest BC and PMFP emissions of all fuels namely due to having the lowest stove thermal efficiency of all the fuels assessed.
PROCESSED SOLID BIOMASS
Processed biomass that is non-carbonized shows low to mid-level environmental impacts. Exceptions are Water Depletion and Fossil Fuel Depletion impacts for pellets due to input requirements for pellet processing and production. Processed biomass that is carbonized shows higher impacts overall namely due to impacts resulting from inefficient processing steps.
CHARCOAL BRIQUETTES (FROM WOOD OR BAMBOO)
• While the carbonization process creates a higher quality of fuel than firewood, charcoal briquettes demonstrate high impacts across a number of indicators compared to other fuel types and other processed biomass pathways. This is generally resulting from the estimated use of inefficient traditional earth mound kilns during the carbonization process.
- Earth mound kilns, used during the processing step, are the greatest contributor to Total and Net Energy Demand, Photochemcial Oxidant Formation Potential, GCCP, Black Carbon and SLCPs, and PM Formation Potential.
- Freshwater Eutrophication. Higher impacts result mainly from ash from the wood combustion at the kiln.
• Utilizing bamboo for charcoal briquettes avoids some of the wood feedstock GHG emissions associated with deforestation (bamboo growing practices are estimated to be 100% renewable and hence carbon neutral). However, similar to utilizing wood for charcoal briquettes, bamboo has significantly large processing energy requirements than other fuels, which cancel out benefits from its renewability.
NON-CARBONIZED BRIQUETTES (FROM CROP RESIDUES)
• Non-carbonized briquettes from crop residues have generally lower environmental impacts compared to charcoal briquettes namely due to lack of a carbonization step.

GLO
BA
L AL
LIA
NC
E FO
R C
LE
AN
CO
OK
ST
OV
ES
21
FUEL TYPE KEY OBSERVATIONS
NON-CARBONIZED BRIQUETTES FROM SAWDUST, WOOD PELLETS, OR WOOD CHIPS
• Different levels of manual vs. commercialized processing were estimated based on the literature cited for each country. In commercially made non-carbonized sawdust briquettes, the wood is combusted during the drying process to remove the moisture content, resulting in higher Energy Demand impacts compared to non-carbonized briquettes from crop residues. However, the Black Carbon and SLCPs, and PM Formation impacts are generally lower for non-carbonized briquettes from sawdust.
• Non-carbonized briquettes from crop residues show lower Energy Demand when compared to firewood and carbonized briquettes, namely due to lower energy processing requirements.
• In addition to efficiency benefits from a smaller, denser, and more uniform fuel, the stoves used to burn wood chips and wood pellets (30-53% efficiency) are generally more efficient than stoves used to burn unprocessed solid biomass (8.5-13.5%). As a result, more of the energy content of the chips and pellets is converted into useful cooking energy, which is a contributing factor to its overall favorable environmental impacts, outweighing the energy inputs needed for processing.
- The Water Depletion indicator for wood pellets tend to be high as a result of electricity usage during pelletization in countries where the electricity grid mix is primarily hydropower.
- Stove thermal efficiencies for wood pellets (~53%) tend to be higher than for wood chips (~31%) resulting in lower impacts for pellets even though they consume more energy in the processing stage.
LIQUID/GAS Liquid and gas fuels that are combusted in higher efficiency stoves lead to less fuel combusted and therefore less air emissions, especially particulate matter and black carbon. Liquid and gas fuels also tend to have lower overall life cycle environmental impacts, with some exceptions. More of the heating value of the fuel is converted into useful cooking energy and therefore less fuel must be produced, transported, and burned to deliver the same amount of cooking energy resulting in lower Total and Net Energy Demand impacts.
Categories such as Fossil Fuel Depletion and Water Depletion show higher impacts as liquid/gas fuels such as LPG and ethanol often require more complex upstream processing components, i.e. the cultivation and processing of the sugarcane, and electricity requirements.
ETHANOL (FROM SUGARCANE OR WOOD)
• Ethanol produced from cellulosic/non-food feedstocks (wood, agricultural residue) has lower life cycle impacts compared to ethanol produced from sugar and starch materials.
- Water Depletion. Sugarcane undergoes more agricultural and pre-processing steps and requires more irrigation than wood residues which can be directly converted to ethanol.
- Fossil Fuel Depletion. These impacts are higher for sugarcane ethanol mainly from fertilizer use during cane production as well as diesel use for farm operations and distribution of the feedstock and fuel.
- Terrestrial Acidification. Ammonia is a main emission that leads to acidification and is emitted from fertilizers applied during sugarcane cultivation.
• Ethanol from sugarcane has lower impacts compared to solid fuels in many categories, especially on air emission indicators such as Global Climate Change Potential, Black Carbon and SLCPs, and Particular Matter Formation.
TABLE 1-3: OBSERVATIONS BY FUEL TYPE, CONTINUED

CO
MP
AR
AT
IVE
AN
ALY
SIS
OF
FU
EL
S FO
R C
OO
KIN
G: L
IFE
CY
CL
E E
NV
IRO
NM
EN
TAL IM
PA
CT
S A
ND
EC
ON
OM
IC A
ND
SO
CIA
L CO
NS
IDE
RA
TIO
NS
// E
XE
CU
TIV
E S
UM
MA
RY
22
FUEL TYPE KEY OBSERVATIONS
BIOGAS (FROM DUNG)
• Biogas from dung shows low overall life cycle environmental impacts for all countries in this study. As it uses a local byproduct and does not require upstream processing, impacts are vastly reduced.
- One exception is the Water Depletion indicator which shows some impacts due to the water needed to maintain the digester.
- Application of digested sludge from the biogas system could lead to some Eutrophication impacts, but as utilization of this co-product is outside the system boundaries of this study, Freshwater Eutrophication impacts display as zero.
LPG • Despite being a fossil fuel, when considering the energy density of the fuel, use of higher efficiency stoves, and non-renewability of biomass in many situations, LPG is comparable to other fuel alternatives and in some cases, shows lower impacts.
- The Energy Demand of LPG is low compared to many other fuels. However, Energy Demand was found to be higher in African and Latin American countries mainly due to less efficient refineries and practices, hence requiring more energy inputs.
- Not capturing the flared gas for reuse leads to lower efficiency and yield at the refinery resulting in notable Net Energy Demand burdens.
• LPG shows more favorable performance for indicators such as Global Climate Change Potential, Particulate Matter Formation, and Black Carbon and SLCPs when compared to solid biomass (especially from non-renewable sources), kerosene, natural gas and electricity.
• Water Depletion impacts trend higher generally due to the water inputs needed for the production of LPG during crude oil extraction and petroleum refining.
KEROSENE • Fossil Fuel Depletion impacts are high for kerosene** as it is a fossil fuel derived from crude oil, but it also displays high impacts for Water Depletion.
- Existing evidence shows that household use of kerosene can lead to levels of particulate matter and other pollutants that exceed WHO guidelines and is also a concern in terms of risk of burns, fires and poisoning.***
NATURAL GAS • Natural gas has low environmental impacts across the majority of life cycle impacts.****
DME • While DME is produced from coal feedstock via gasification, slightly lower Total Energy Demand impacts are seen for DME as compared to coal due to its ability to be transported in lighter weight bottles and its application in more efficient gas stoves.****
OTHER
ELECTRICITY • Electricity-related fuel combustion emissions do not occur at the household level. When viewing the results by life cycle phase, for consistency with other fuels, the fuel combustion emissions associated with electricity generation have been allocated to the use stage in this LCA.
- While household air pollution will not occur with electricity, ambient air pollution will result near the power plants generating the electricity due to the energy sources supplying the grid.
- For countries like China and India** where electricity is primarily generated from coal, its life cycle impacts for indicators such as Global Climate Change Potential, Fossil Fuel Depletion, Water Deple-tion (due to hydropower in the electricity mix), and Terrestrial Acidification Potential are notable.
TABLE 1-3: OBSERVATIONS BY FUEL TYPE, CONTINUED

GLO
BA
L AL
LIA
NC
E FO
R C
LE
AN
CO
OK
ST
OV
ES
23
FUEL TYPE KEY OBSERVATIONS
HARD COAL • Hard coal** consistently emerged as having the largest overall negative impacts since it is derived from non-renewable carbon and because thermal efficiency of coal stoves is relatively low compared to stoves for the other fossil fuel options.
• Coal has high Total Energy Demand results because of high energy requirements for coal mining and distribution.
NOTES FOR TABLE 1-3:
* At the time the modeling for this analysis was initiated, more up to date numbers on the fraction of non-renewable biomass (fNRB) (Bailis et al) were not released.
** Was only evaluated for 2 of 8 of the Alliance focus countries as part of the study conducted by the U.S. EPA.
*** WHO Guidelines for Indoor Air Quality: Household Fuel Combustion
**** Was only evaluated for 1 of 8 of the Alliance focus countries as part of the study conducted by the U.S. EPA.
TABLE 1-3: OBSERVATIONS BY FUEL TYPE, CONTINUED

1.4. RECOMMENDATIONS
Although cooking consumes most of the energy across the life cycle, results of the analysis show that other parts of the value chain contribute a high proportion of the total environmental burden. In addition to high efficiency stoves and high calorific value fuels that can reduce these energy losses, there are additional environmental, economic, and social factors to consider when prioritizing and developing policies about fuel types. Based on the results of the fuel impact study, country-specific policy considerations, available literature, and insights from the Alliance Secretariat, partners and enterprises, the next section outlines enterprise- and policy-level recommendations to scale up cleaner fuel options.
1.4.1. ENTERPRISE-LEVEL RECOMMENDATIONS
Enterprises can use the information in this study and FACIT to improve their value proposi-tion for customers and potential investors while producing non-traditional fuels in a more cost-effective way. A reduction in the use of environmentally and health harming fuels and practices can be realized as clean fuel enterprises increase their market share. The following fuel opportunities, if taken up by more fuel entrepreneurs, could lead to positive environmental impacts. (Appendix A provides a more in depth discussion for each country):
∙ Fuels produced from locally available feedstocks, including waste materials, have lower environmental impacts across many indicators, particularly when combusted in high-performing efficient stoves and when locating production and distribution in close proximity to the raw material supply. Additionally, using waste materials for productive fuel use at scale would reduce the amount available for direct combustion in traditional, inefficient stoves.
- Biogas can be produced from locally available dung in rural conditions and its resultant bioslurry can be a substitute for chemical fertilizers.
- Ethanol from cellulosic and/or non-food feedstocks can be produced from wastes such as wood or agricultural residues.
- Pellets can be sourced from locally produced wood and agricultural residue. Envi-ronmental impacts could be further reduced by utilizing waste material from other industries such as sawdust from timber companies.
∙ Fuels that governments already support/promote via subsidies or consumer education programs.
- LPG is largely subsidized in many focus countries. While it has higher fossil fuel depletion impacts, it has moderate or low impacts compared to traditional fuels in many environ-mental indicators associated with air emissions as illustrated in Table 1-2 (see page 10).
- Biogas and pellets in countries like China have received various levels of government support over the years for distribution or technology procurement. Both demonstrate favorable environmental impacts across the value chain.
∙ Fuel types that tend to be more readily accepted by consumers (e.g., fuels that can be purchased and transported to consumers in convenient quantities, or that do not require learning to use a significantly different type of stove).
- Non-carbonized briquettes from crop residues can be used with existing wood charcoal briquette stoves, and are derived from renewable agricultural wastes. This fuel has con-sistently lower environmental impacts compared to charcoal (i.e., carbonized) briquettes.
Other potential consideration for enterprises when starting up or scaling a fuel business in a sustainable manner include the following1:
∙ Production Technology: For charcoal briquettes, emission impacts from the carbonization process when using traditional kilns show high environmental impacts across a number
To access the full report online, visit: cleancookstoves.org/facit under the Resources tab.
CO
MP
AR
AT
IVE
AN
ALY
SIS
OF
FU
EL
S FO
R C
OO
KIN
G: L
IFE
CY
CL
E E
NV
IRO
NM
EN
TAL IM
PA
CT
S A
ND
EC
ON
OM
IC A
ND
SO
CIA
L CO
NS
IDE
RA
TIO
NS
// E
XE
CU
TIV
E S
UM
MA
RY
24

of indicators. Though inexpensive and mobile, the efficiency rates of traditional of kilns are typically low. Improvements in the conversion efficiency of biomass to briquettes would show potential for reductions in emissions. And when paired with incentives or financing programs, communities would be enabled to construct, purchase and/or utilize improved kilns.
∙ Distribution Logistics: Over two-thirds of the Total Energy Demand impact for LPG and ethanol from sugarcane results from the importation and distribution phase. Local pro-duction of fuels could reduce the Total Energy Demand impacts. Additionally, enterprises have found that locating upstream production facilities significant distances away from their downstream operations makes their business vulnerable to transportation disrup-tions and can jeopardize supply meeting demand.
1.4.2. POLICY-LEVEL RECOMMENDATIONS
While not a primary focus on this analysis, presented below are a brief sampling of fuel-related policies and initiatives across Alliance focus countries. Notable tradeoffs between fuels’ LCA results, used in conjunction with other resources, research, policies, and contextual factors can inform energy and environmental policy. These cases are meant to show a few examples of policies that could support or inhibit the effectiveness of various fuel value chain-related inter-ventions. While Table 1-4 (see page 27) is not a comprehensive list, it begins to show a range of polices and regulations to consider in conjunction with using an LCA as a decision-support tool.
Current fuel use patterns in each country have evolved due to availability of resources; cultural preferences; geographic dispersion of the population; poverty and awareness; existing subsidies, taxes, and trade policy; and more. Presented below are recommendations to further expand affordability, accessibility, and adoption of cleaner fuel options based on the results of the LCA as well as stakeholder insights. Policy makers can use the results of this LCA to guide decisions on legislative and economic policy instruments, strategic planning and procurement.
AGRICULTURAL AND FOREST MANAGEMENT
∙ Biomass will continue to be a dominant fuel in the household energy mix, and should be incorporated into policy planning. Zoning land for sustainable woodlots or for growing annually renewable biomass fuels should be incorporated into forest management plans. Increased growth of trees leads to greater absorption of CO2 and therefore reduction in Global Climate Change Potential as shown in the LCA results.
∙ To complement this, governments should increase regulatory involvement in informal markets for purchased firewood and traditional charcoal. This would contribute to the reduction of environmental impacts overall.
∙ Agricultural management practices, e.g. irrigation and fertilizer application as seen in the results for fuels such as ethanol from sugarcane, have an effect on the cooking fuel sup-ply chain and should be considered when developing policies related to biomass-derived cooking fuels.
∙ Policy mechanisms should take into account shifts in cooking fuel needs by season. For example, rural families in India often used fuels like LPG as a stopgap measure when firewood was too expensive during the monsoon season16 and moisture content in fuel sources such as wood and agricultural residues can affect combustion performance and emissions of the fuel.
FINANCING PROGRAMS
∙ Government financing programs should look across the fuel value chain to identify who should receive the support (consumers, producers, or both), which part(s) of the value chain should financial support target (collection, storage, transportation, manufacturing, distribution/sales), and if financial support should be based on outcomes. As seen from the LCA results, many environmental impacts result from the process of producing the fuels.
GLO
BA
L AL
LIA
NC
E FO
R C
LE
AN
CO
OK
ST
OV
ES
25

∙ In countries where waste residues can and are being used productively and where higher efficiency combustion technologies exist, national governments should provide unified policies and financial support for fuel production. This could open up more opportunities for the cleaner fuel markets to scale and reach more consumers.
∙ Biogas shows low overall environmental impacts across most indicators. Policy makers should consider providing financing options for biogas digesters and biogas stoves to improve affordability for consumers, which is often a barrier to adopting this fuel type. Different government subsidy schemes could be explored including performance-based subsidies linking the payment of subsidies to the performance of the digester or use-based subsidies to incentivize biogas users.
∙ Economic incentives, credit facilities or barriers (i.e., payment for natural resources) could be considered to enhance the procurement, construction and adoption of advanced kiln technologies to improve the conversion efficiency of wood resources. As seen in the results, traditional kilns are a major contributor to negative environmental impacts across a number of indicators. If paired with strong forest management policies, improv-ing charcoal production could have significant environmental benefts.
CO
MP
AR
AT
IVE
AN
ALY
SIS
OF
FU
EL
S FO
R C
OO
KIN
G: L
IFE
CY
CL
E E
NV
IRO
NM
EN
TAL IM
PA
CT
S A
ND
EC
ON
OM
IC A
ND
SO
CIA
L CO
NS
IDE
RA
TIO
NS
// E
XE
CU
TIV
E S
UM
MA
RY
26
GLO
BA
L AL
LIA
NC
E FO
R C
LE
AN
CO
OK
ST
OV
ES
27
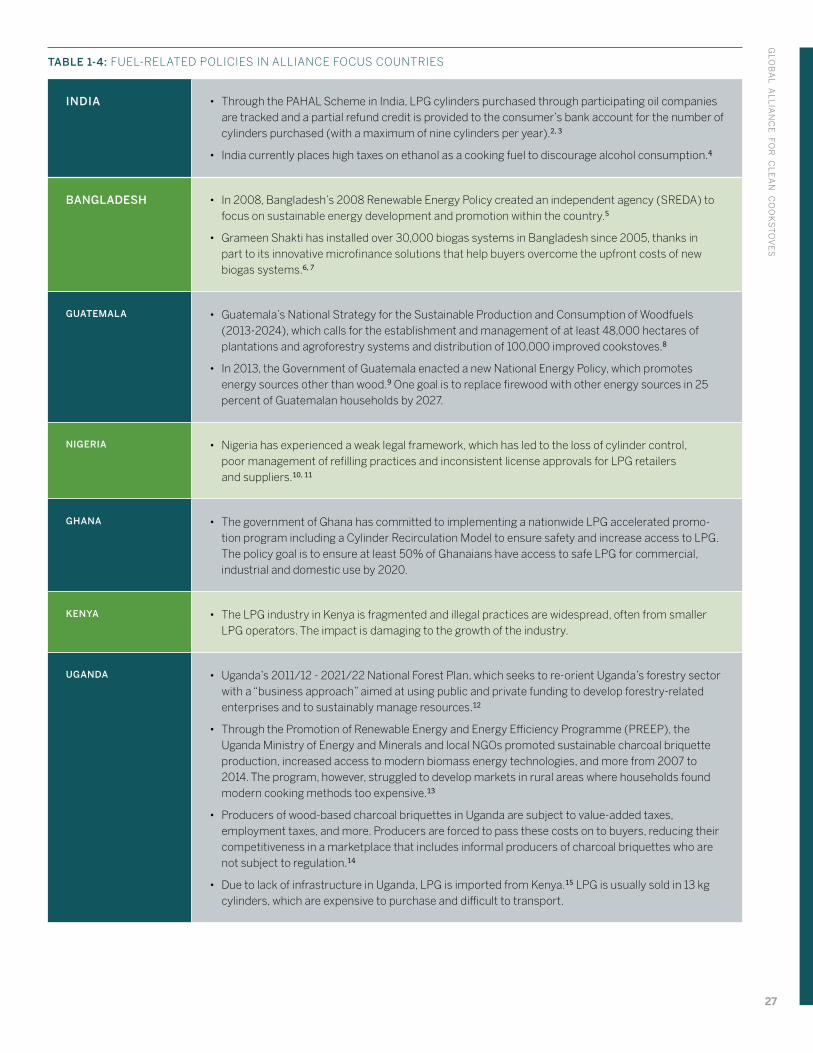
TABLE 1-4: FUEL-RELATED POLICIES IN ALLIANCE FOCUS COUNTRIES
INDIA • Through the PAHAL Scheme in India, LPG cylinders purchased through participating oil companies are tracked and a partial refund credit is provided to the consumer’s bank account for the number of cylinders purchased (with a maximum of nine cylinders per year).2, 3
• India currently places high taxes on ethanol as a cooking fuel to discourage alcohol consumption.4
BANGLADESH • In 2008, Bangladesh’s 2008 Renewable Energy Policy created an independent agency (SREDA) to focus on sustainable energy development and promotion within the country.5
• Grameen Shakti has installed over 30,000 biogas systems in Bangladesh since 2005, thanks in part to its innovative microfinance solutions that help buyers overcome the upfront costs of new biogas systems.6, 7
GUATEMALA • Guatemala’s National Strategy for the Sustainable Production and Consumption of Woodfuels (2013-2024), which calls for the establishment and management of at least 48,000 hectares of plantations and agroforestry systems and distribution of 100,000 improved cookstoves.8
• In 2013, the Government of Guatemala enacted a new National Energy Policy, which promotes energy sources other than wood.9 One goal is to replace firewood with other energy sources in 25 percent of Guatemalan households by 2027.
NIGERIA • Nigeria has experienced a weak legal framework, which has led to the loss of cylinder control, poor management of refilling practices and inconsistent license approvals for LPG retailers and suppliers.10, 11
GHANA • The government of Ghana has committed to implementing a nationwide LPG accelerated promo-tion program including a Cylinder Recirculation Model to ensure safety and increase access to LPG. The policy goal is to ensure at least 50% of Ghanaians have access to safe LPG for commercial, industrial and domestic use by 2020.
KENYA • The LPG industry in Kenya is fragmented and illegal practices are widespread, often from smaller LPG operators. The impact is damaging to the growth of the industry.
UGANDA • Uganda’s 2011/12 - 2021/22 National Forest Plan, which seeks to re-orient Uganda’s forestry sector with a “business approach” aimed at using public and private funding to develop forestry-related enterprises and to sustainably manage resources.12
• Through the Promotion of Renewable Energy and Energy Efficiency Programme (PREEP), the Uganda Ministry of Energy and Minerals and local NGOs promoted sustainable charcoal briquette production, increased access to modern biomass energy technologies, and more from 2007 to 2014. The program, however, struggled to develop markets in rural areas where households found modern cooking methods too expensive.13
• Producers of wood-based charcoal briquettes in Uganda are subject to value-added taxes, employment taxes, and more. Producers are forced to pass these costs on to buyers, reducing their competitiveness in a marketplace that includes informal producers of charcoal briquettes who are not subject to regulation.14
• Due to lack of infrastructure in Uganda, LPG is imported from Kenya.15 LPG is usually sold in 13 kg cylinders, which are expensive to purchase and difficult to transport.

SUPPORTIVE ENERGY POLICY DEVELOPMENT
∙ Switching from traditional solid fuels to electricity powered by coal shifts emissions to other points in the fuel supply chain, i.e. near the power plants. Electric/induction stoves could help reduce indoor air pollution but national energy plans should closely evaluate opportunities to move their electricity grid mix towards renewables.
∙ Policy makers and private partners should perform holistic assessments of key supply and demand drivers and identify critical investment needs to improve the market pene-tration of the fuels as well as address environmental inefficiencies.
∙ Advocacy and partnerships should focus on working with the government to reform tax/tariff/Value Added Tax (VAT) policies for both fuels, efficient stoves, and efficient production technologies and materials.
∙ In the case of LPG, strict enforcement of regulations to maintain cylinders and prevent illegal refilling and cross-filling of LPG cylinders are needed.
∙ Governments should take care that actions with other goals do not have unintended consequences that could affect access to cleaner burning and more efficient fuels. The policies should ensure the target demographic is the primary and actual beneficiary of the program to avoid the challenges faced with misuse of LPG.
LOCAL GOVERNMENT AND AGENCY INVOLVEMENT
∙ Provincial and state governments should play a key role in informing and enforcing sup-portive fuel policies, fostering clean fuel businesses, financing and distribution programs. Designing solutions (policy and business model designs) should take into account the unique features of each province or state. This includes feedstock availability, seasonality, infrastructure, available production technologies, performance of available combustion technologies, transportation distances, rural/urban profile, income level, market develop-ment, and prior policy implementation.
∙ Independent agencies should be recruited to serve as strong advocates for promoting new, cleaner pathways in cooking fuel markets alongside the Government. Independent agencies can also bridge the gap between stove technology providers and fuel providers to ensure the technologies are available that optimize the performance of the available fuels.
INFRASTRUCTURE IMPROVEMENTS
∙ Governments should focus on establishing more reliable, modern, cost-effective infra-structure for distributing LPG cylinders with more private sector suppliers entering the market. Additionally, the development of domestic LPG processing infrastructure would reduce the sector’s dependence on imports. Reducing/optimizing the distance between the various parts of the fuel supply chain can help to reduce the environmental footprint of the fuel production and distribution processes while also expanding the reach to consumers.
∙ As seen in the detailed LCA results, less efficient refineries and practices in certain coun-tries leads to higher energy demand impacts, and not capturing flared gas for reuse leads to lower efficiency and yield at the refinery resulting in high energy demand impacts. Focusing investments in improving these areas could lead to lower energy demand bur-dens and more positive environmental profiles for fuels such as LPG.
CO
MP
AR
AT
IVE
AN
ALY
SIS
OF
FU
EL
S FO
R C
OO
KIN
G: L
IFE
CY
CL
E E
NV
IRO
NM
EN
TAL IM
PA
CT
S A
ND
EC
ON
OM
IC A
ND
SO
CIA
L CO
NS
IDE
RA
TIO
NS
// E
XE
CU
TIV
E S
UM
MA
RY
28
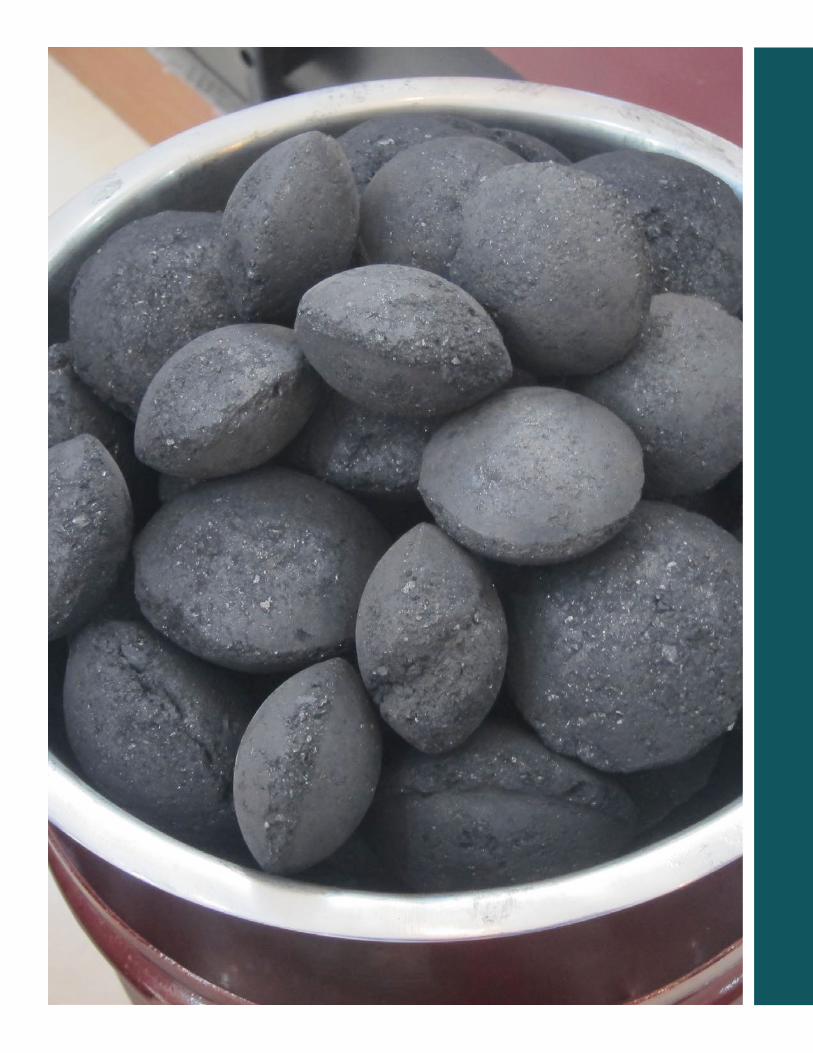
1.5. DATA GAPS AND RESEARCH NEEDS
This study demonstrates that there is potential to optimize fuel value chains from an environ-mental standpoint. However, to gain a comprehensive view of the cooking fuel opportunities, the results of this LCA study should be used in conjunction with social, economic and policy considerations, while being aware that gaps exists in all three dimensions. Through this anal-ysis, data gaps and research needs were identified that can potentially guide future research.
1.5.1. ENVIRONMENTAL DATA
For the environmental assessment, data on combustion emissions for some fuels and countries were limited and therefore had to be adapted from data for corresponding types of fuels in other countries. Energy and combustion emissions for firewood and crop residues vary depending on the type of wood or biomass being burned and their moisture content. Next steps to build upon the work completed for this study could be:
∙ Expand data on heating values and emission factors for local biomass resources in each country to provide a more representative assessment of available biomass fuel options.
∙ Develop a database with improved regional data on agricultural practices (e.g., use of large-scale mechanized agricultural methods, sustainable use of fertilizer, and irrigation requirements) that could support more accurate country-specific assessments.
∙ Conduct sensitivity analyses to understand the overall impact of LCA modeling choices on the environmental results. For examples, for crop residues, the environmental burdens for primary cultivation of the crop is assigned to the primary product, not the residues. Impacts may notably increase if conducting a sensitivity analysis that partitions some of these burdens to the residue.*
∙ Evaluate additional advanced processing technologies to understand further opportunities to improve impacts, e.g. improved kiln technologies for charcoal briquettes or capturing of flared gas in petroleum production for LPG.
While biogas and ethanol consistently showed lower life cycle impacts in many results catego-ries across all countries, there are additional implications to consider. For example, sugarcane ethanol requires energy inputs for agricultural and manufacturing. Impacts related to fertilizer production and emissions from application as well as impacts resulting from the importation and distribution can also be notable. Biogas users must have sufficient livestock to support a digester and the units are often only affordable if upfront cost of the digester can be financed. As a result, additional research and development in the following areas would be beneficial:
∙ Investigate the economic feasibility to scale up technology for local ethanol production from readily available non-food and other residues (e.g., cassava and cashew wastes) feedstocks.
∙ Improve the reliability of household biogas digesters. More research could improve the understanding of effects of climate and feedstock choice on household-level biogas digester performance.
∙ Improve the feasibility of larger biogas digesters for urban areas that could utilize food waste or other municipal wastes as feedstock (not only providing biogas fuel, but also reducing the amount of municipal waste to be disposed).
∙ For biogas, ethanol, and LPG conduct a quantitative analysis of historical demand of these fuels for cooking as well as existing infrastructure, supportive policies and financing options to provide an understanding of where these cooking fuels can reasonably be
* The U.S. EPA is undertaking a second study to extend this research, including assessing a range of stove types and efficiencies, updating stove emissions based on updated research, updating non-renewable forestry values, and conducting uncertainty analyses. Phase 2 data are expected be be available in the summer of 2017.
CO
MP
AR
AT
IVE
AN
ALY
SIS
OF
FU
EL
S FO
R C
OO
KIN
G: L
IFE
CY
CL
E E
NV
IRO
NM
EN
TAL IM
PA
CT
S A
ND
EC
ON
OM
IC A
ND
SO
CIA
L CO
NS
IDE
RA
TIO
NS
// E
XE
CU
TIV
E S
UM
MA
RY
30

brought to scale. The analysis would evaluate the economic costs and benefits, to confirm whether government subsidies are justified and make recommendations for subsidies to be more cost-effective.
1.5.2. ECONOMIC DATA
Data on cost, affordability, and use of different fuels (for cooking, heating, or other households) are among the most important criteria for determining which fuel options can be adopted, but the data were incomplete. Complete data on fuel imports, exports, and demand is needed to to assess whether a country can be self-sufficient in producing an adequate supply of fuels.
∙ Improve detailed accounting of fuel costs to the consumer (i.e., average fuel collection dis-tances, price paid, and frequency of purchase), including for fuels that are currently used at low levels and generate more thorough data on fuel imports, exports, and demand, differentiated by use.
∙ Conduct a life cycle cost (LCC) analysis. This would estimate the total cost of each fuel from fuel feedstock acquisition through final use, including agricultural or forestry opera-tions to produce fuel feedstock, harvest or collection of fuel materials, processing into the fuel product, distribution, use in a cookstove, and any waste disposal (e.g., of ash).
1.5.3. SOCIAL AND GENDER DATA
Recent efforts by the Global Alliance for Clean Cookstoves and the International Center for Research on Women (ICRW) has created a set of indicators for measuring the diverse social impacts of cookstove and fuel initiatives at the global and local program levels. However, infor-mation gaps still exist in collecting and consolidating the research and assessing the impacts across the fuel value chain before the consumer uses the fuel product.
∙ Commission research, collect data and develop case studies on socioeconomic impacts (i.e., time, cost savings, safety and protection, income-earning opportunities, women’s empower-ment and gender equality) of fuel related projects or interventions in conjunction with use of the Alliance’s Social Impact Monitoring and Evaluation framework and guidance.
∙ Develop a framework for collection of challenges and successes encountered during distribution, fuel reliability, and other parts of the fuel supply chain, as projects are being implemented so that best practices and lessons learned can be used to inform strategies to drive adoption, build effective distribution channels and increase reliability.
GLO
BA
L AL
LIA
NC
E FO
R C
LE
AN
CO
OK
ST
OV
ES
31

PHOTOGRAPHY CREDITS
Cover: Ranyee Chiang Page 2, 7, 23, 27, 29, and back cover: Seema PatelPage 8: Sophia ParisInside back cover: Project Gaia
Endnotes
1. Valdez, 2016
2. Gov. of India, 2015
3. Dalberg, 2013
4. Rajvanshi, 2006
5. GIZ, 2012
6. Grameen, 2015a
7. Grameen, 2015b
8. ESF, 2013
9. ESF, 2013
10. ESMAP, 2007
11. ESMAP, 2004
12. Ministry of Water and Environment, 2013
13. GVEP International, 2012b
14. Herzog, 2015
15. Wanjohi, 2015
16. Kojima et al., 2011
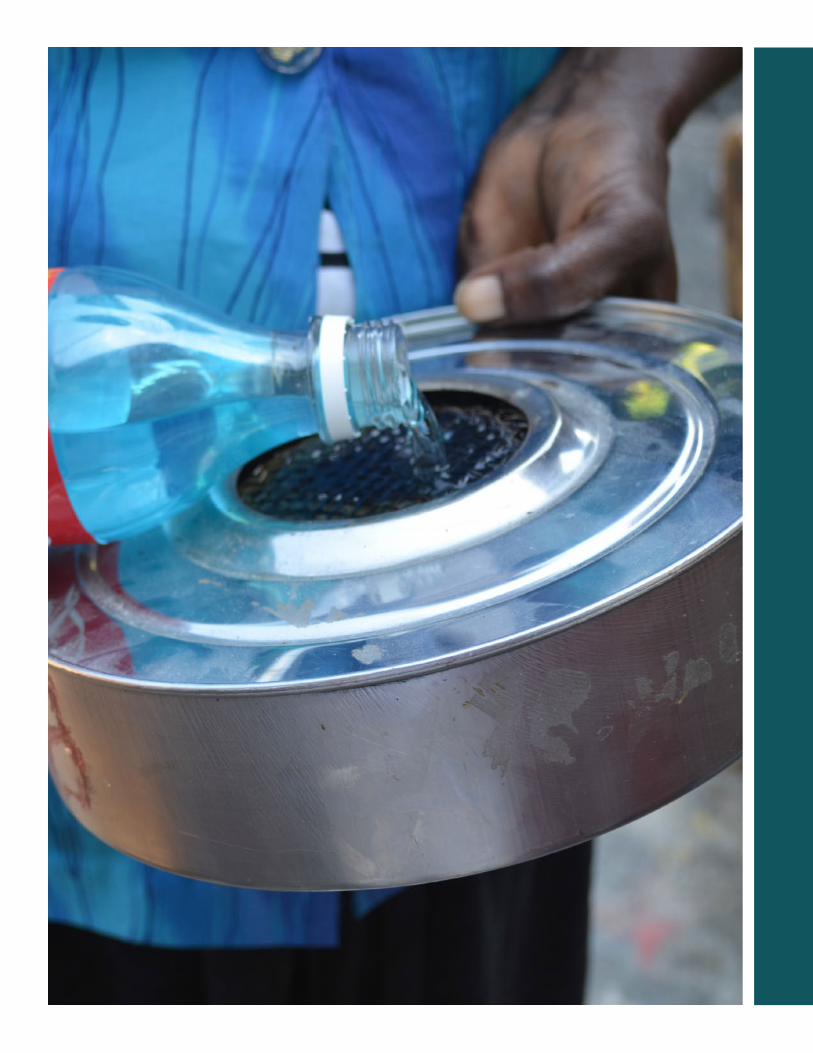

WWW.CLEANCOOKSTOVES.ORG