comparative analysis of background versus risk …...white paper comparative analysis of background...
TRANSCRIPT
WHITE PAPER
Comparative Analysis of Background versus Risk-based Cleanup Scenarios
for the Soils at Santa Susana Field Laboratory, Ventura County, California
Prepared for
National Aeronautics and Space Administration George C. Marshall Space Flight Center
March 2014

This page intentionally left blank.

Contents Section Page Acronyms and Abbreviations ............................................................................................................................. v
1 Introduction ...................................................................................................................................... 1-1 1.1 Purpose and Scope .......................................................................................................................... 1-1 1.2 Site Background ............................................................................................................................... 1-1 1.3 Cleanup Requirements and Approach ............................................................................................. 1-2 1.4 Traditional Risk Assessment and Risk Management Framework .................................................... 1-3
2 Comparative Analysis of Cleanup Scenarios Based on Human Health Risk Evaluation .......................... 2-1 2.1 Evaluation of Human Health Risks Associated with the Background Cleanup Scenario ................. 2-1
2.1.1 Methods and Assumptions ................................................................................................. 2-1 2.1.2 Background Cleanup Scenario Results ............................................................................... 2-2 2.1.3 Comparing Background and Risk-based Cleanup Levels .................................................... 2-3 2.1.4 Discussion ........................................................................................................................... 2-3
2.2 Comparison of Background and Risk-based Cleanup Scenarios for Site-specific Chemicals of Concern ............................................................................................................................................ 2-3 2.2.1 Selection of Site-specific Contaminants of Concern ........................................................... 2-3 2.2.2 Risk-based Cleanup Scenario Risk Estimates ...................................................................... 2-3 2.2.3 Background Cleanup Scenario Risk Estimates .................................................................... 2-4 2.2.4 Discussion ........................................................................................................................... 2-4
3 Comparative Analysis of Cleanup Scenarios based on Ecological Risk Evaluation ................................. 3-1 3.1 Evaluation of Ecological Risk Associated with the Background Cleanup Scenario .......................... 3-1
3.1.1 Methods and Assumptions ................................................................................................. 3-1 3.1.2 Background Cleanup Scenario Results ............................................................................... 3-1 3.1.3 Comparing Background and Risk-based Cleanup Levels .................................................... 3-2
3.2 Comparison of Background and Risk-based Cleanup Scenarios for Site-specific Chemicals of Ecological Concern....................................................................................................................... 3-2 3.2.1 Selection of Site-specific Contaminants of Ecological Concern .......................................... 3-2 3.2.2 Risk-based Cleanup Scenario Risk Estimates ...................................................................... 3-3 3.2.3 Background Cleanup Scenario Risk Estimates .................................................................... 3-3
3.3 Discussion ........................................................................................................................................ 3-3
4 Spatial Evaluation of Excavation Boundaries under Background versus Risk-Based Cleanup Scenarios .......................................................................................................................................... 4-1
5 Conclusions ....................................................................................................................................... 5-1
6 References ........................................................................................................................................ 6-1
MGM14-SSFL/CLEANUP_EVAL_PAPER/SSFL_COMPARATIVECLEANUPEVAL_PAPER.DOC III ES022514071956MGM

CONTENTS, CONTINUED
Tables
1-1 Look-up Table Values for Analytes Requiring Cleanup Under the Background Cleanup Scenario 2-1 Human Health Risk-based Screening Levels 2-2 Cancer Risk and Noncancer Hazard Estimates for Background Closure Scenario based on Look-up Table
Values 2-3 Comparison of the Human Health Protectiveness of the Risk-based Cleanup Levels to the Background
Cleanup Levels 2-4 Chemicals of Concern Summary for Average Soil (0 to 10 feet bgs) Concentrations - Risk-based Cleanup
Scenario 2-5 Risk Summary for Soil COCs - Background Cleanup Scenario vs Risk-based Cleanup Scenario 3-1 Ecological Risk-based Screening Levels 3-2 Ecological Hazard Quotients for Background Closure Scenario based on Look-up Table Values 3-3 Comparison of the Ecological Protectiveness of the Risk-based Cleanup Levels to the Background Cleanup
Levels 3-4 Ecological Risk Evaluation and Chemical of Ecological Concern Identification for Soils from 0- 6 feet bgs -
Risk-Based Cleanup Scenario 3-5 Risk Summary for Ecological Soil COCs - Background Cleanup Scenario vs Risk-based Cleanup Scenario
Figures
4-1 Estimated Excavation Boundaries Under Background Cleanup 4-2 Estimated Excavation Boundaries Under Risk-Based Cleanup
iv MGM14-SSFL/CLEANUP_EVAL_PAPER/SSFL_COMPARATIVECLEANUPEVAL_PAPER.DOC ES022514071956MGM

Acronyms and Abbreviations 95 UCL 95-percent upper confidence limit 95 USL 95-percent upper simultaneous limit AOC Administrative Order of Consent BaP benzo(a)pyrene bgs below ground surface Boeing The Boeing Company BTV background threshold value Cal/EPA California Environmental Protection Agency CERCLA Comprehensive Environmental Response, Compensation, and Liability Act COC contaminant of concern COEC contaminant of ecological concern COPC contaminant of potential concern DTSC Department of Toxic Substances Control EIS Environmental Impact Statement EPA U.S. Environmental Protection Agency EPC exposure point concentration ERA ecological risk assessment ft feet HHRA human health risk assessment HI hazard index HQ hazard quotient ID identification LUT Look-up Table MCPA 2-methyl-4-chlorophenoxyacetic acid MRL method reporting limit NASA National Aeronautics and Space Administration RBSL residential soil risk-based screening level RI Remedial Investigation RME reasonable maximum exposure SAIC Science Applications International Corporation SRAM Standardized Risk Assessment Methodology SSFL Santa Susana Field Laboratory TCDD tetrachlorodibenzo-p-dioxin TEQ toxicity equivalent USAF U.S. Air Force
MGM14-SSFL/CLEANUP_EVAL_PAPER/SSFL_COMPARATIVECLEANUPEVAL_PAPER.DOC V ES022514071956MGM
ACRONYMS AND ABBREVIATIONS
This page intentionally left blank.
vi MGM14-SSFL/CLEANUP_EVAL_PAPER/SSFL_COMPARATIVECLEANUPEVAL_PAPER.DOC ES022514071956MGM

S
InECT
tIO
rN
od 1
uction
During the National Aeronautics and Space Administration’s (NASA’s) development of an Environmental Impact Statement (EIS) for Santa Susana Field Laboratory (SSFL), NASA received many public questions about the benefits of a soil cleanup as prescribed by the 2010 Administrative Order on Consent (2010 AOC). This paper is written in an effort to address those concerns and questions and to assess the difference in cleanup requirements based on the background cleanup scenario versus a risk-based cleanup scenario. The analysis is intended to compare the level of protectiveness of cleaning up soil to background, as required by the 2010 AOC, versus cleaning up only those chemicals that pose unacceptable risk to human or ecological receptors (referred to as a risk-based cleanup).
1.1 Purpose and Scope The 2010 AOC between NASA and the California Department of Toxic Substances Control (DTSC) requires remediation of the soils on the NASA-administered property at SSFL by 2017. The soils on the NASA-administered property of SSFL will be remediated to local background values; when background values are not available, the soils will be remediated to laboratory method reporting limits (MRLs).
Cleanup decisions for the NASA-administered portions of this property are not risk-based, and the 2010 AOC requires that the site be cleaned up to background conditions, regardless of whether site contaminants are predicted to pose a risk to human health or the environment. Consequently, the cleanup effort is conservative, will affect a large area of habitat, and will be economically costly.
The objective of this paper is to evaluate the differences in general cleanup requirements between a background cleanup scenario versus a risk-based cleanup scenario typically conducted under the Comprehensive Environmental Response, Compensation, and Liability Act (CERCLA) process. To support this effort, human health and ecological risk evaluations were conducted using recently acquired field data for the sites within Groups 2, 3, 4, and 9 to identify chemicals that might pose a potential risk on a sitewide basis and potentially require cleanup. Using the results of the risk evaluations, an assessment of the differential risk between the background scenario and a risk-based cleanup scenario was presented.
It should be noted that the risk evaluations conducted as part of this effort were intended to support this comparative evaluation only and are not intended to support cleanup decisions for an individual NASA-administered site. This effort is intended to address outstanding public comments regarding the need for a comparative evaluation.
1.2 Site Background SSFL is at approximately 1,100 feet (ft) of elevation and located 29 miles northwest of downtown Los Angeles, California, in the southeastern corner of Ventura County. SSFL, which occupies approximately 2,850 acres of hilly terrain, with approximately 1,100 ft of topographic relief near the crest of the Simi Hills, is owned in part by The Boeing Company (Boeing) and in part by the U.S. Government. The land management is designated by administrative areas. NASA administers part of Area I (the former Liquid Oxygen Plant Area) and all of Area II (approximately 450 acres). Boeing owns the remainder of the SSFL property. The study area or region of influence analyzed in the EIS (NASA, 2013) is primarily the NASA-administered property in Areas I and II at SSFL.
Contamination is known to exist on NASA-administered SSFL property from previous mission activities, and NASA has declared the property excess to its mission needs. Therefore, the cleanup is required to meet the requirements of the 2010 AOC and the completion date of 2017, to reduce ongoing maintenance costs, and to prepare the property for disposition.
Since 1948, research, development, and testing of liquid-fueled rocket engines and associated components (such as pumps and valves) were the primary site activities at SSFL (Science Applications International Corporation MGM14-SSFL/CLEANUP_EVAL_PAPER/SSFL_COMPARATIVECLEANUPEVAL_PAPER.DOC 1-1 ES060713081955MGM

1. INTRODUCTION
[SAIC], 1994). The vast majority of rocket engine testing and ancillary support operations occurred from the 1950s through the early 1970s. Rocketdyne (the predecessor to Boeing) conducted these operations in Areas I and III in support of various government space programs and in Area II on behalf of the U.S. Air Force (USAF) and then of NASA. NASA gradually discontinued test activities beginning in the 1980s and conducted its final tests in 2006. Boeing has maintained the NASA portion of SSFL since 1996.
Engine testing at SSFL primarily used petroleum-based compounds as the “fuel” and liquid oxygen as the “oxidizer.” Trichloroethene was the primary solvent used for cleaning rocket engine components and for other cleaning purposes.
Before its use as a rocket engine testing facility, the land at SSFL was used for ranching and grazing. North American Aviation (a predecessor to Boeing) began using (by lease) what is now known as the northeastern portion of Area I during 1947 and 1948. The undeveloped portions of SSFL are located on the northern and southern portions; no site-related operations were conducted in these undeveloped areas. The areas are owned and operated as follows (SAIC, 1994):
• Area I (U.S. Environmental Protection Agency [EPA] identification (ID) number CAD 093365435) consists of 713 acres in the northeastern portion of the site. Boeing owns 671 acres and the remaining 42 acres are administered by NASA. Boeing has been operating the entire Area I, including the NASA portion. The 42-acre NASA-administered property in Area I formerly was administered by the USAF.
• Area II (EPA ID number CA 1800090010) consists of 410 acres in the north-central portion of the site. Area II is administered by NASA and has been operated by Boeing.
• Area III (EPA ID number CAD 093365435) consists of 114 acres in the northwestern portion of the site and is owned and operated by Boeing.
• Area IV (EPA ID number CAD 000629972 and CA 3890090001) consists of 290 acres in the extreme northwestern section of the site, and is owned and operated by Boeing. A portion of Area IV (consisting of 90 acres that house the Energy Technology Engineering Center) was leased to the U.S. Department of Energy and operated by Boeing.
• Southern Undeveloped Area in the southern portion of the site is an undeveloped, open space area that consists of approximately 1,200 acres along the southern boundary of the site. This naturally vegetated area is owned by Boeing. Industrial activities have never been conducted in this area. Northern Undeveloped Area in the northern portion of SSFL, adjacent to Areas II, III, and IV, is an undeveloped open space area consisting of about 180 acres. This naturally vegetated area has not been used for industrial activity. It is owned by Boeing.
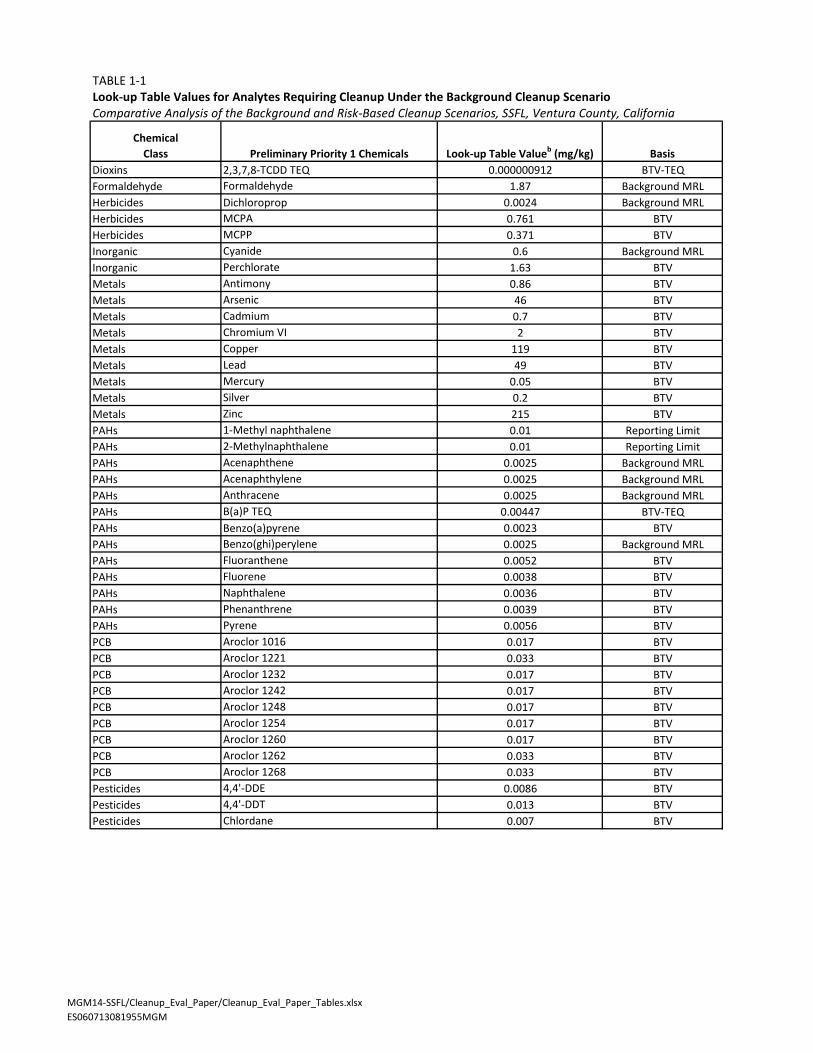
1.3 Cleanup Requirements and Approach The 2010 AOC requires cleanup of soils on the NASA-administered portions of SSFL by 2017. It also requires that soils on the NASA-administered portions of SSFL be remediated to local background concentrations known as background threshold values (DTSC, 2013a), or when background values are not available, to agreed-upon laboratory MRLs. These cleanup requirements (AOC Lookup Table [LUT] values) are not based on risks to human health or the environment.
The LUT values are from the Chemical Look-Up Table Technical Memorandum (DTSC, 2013a). DTSC developed LUT values for more than 130 chemicals based on a chemical background study of the combined Chatsworth or Santa Susana geologic formations, as well as those chemicals most frequently identified as contaminants at SSFL or of interest to DTSC (DTSC, 2012; DTSC, 2013a). The LUT values are based on either the background threshold values (BTVs) derived from the background study or an MRL for chemicals without a BTV. The MRL is the minimum level that an analytical instrument can report and provide a reliable (accurate and precise) result. All measurements have some level of uncertainty. The act of collecting samples and processing them for analysis has a level of uncertainty. In addition, there is uncertainty associated with the analytical methods used for chemical analysis. For an acceptable decision error rate, the EPA technical memorandum provided guidance that background threshold values should account for method uncertainty, so the LUT values would be the BTV, or MRL as
1-2 MGM13-SSFL/WHITE PAPER/SSFL_COMPARATIVECLEANUPEVAL_PAPER.DOC ES060713081955MGM

1. INTRODUCTION
appropriate, with method uncertainty added. Therefore, the chemical LUT values are calculated by summing the cleanup level (BTV or MRL) plus uncertainty.
For more information about DTSC’s statistical evaluation, refer to DTSC’s Statistical Methods for Application in the Chemical Soil Background Study for the Modified Site Evaluation Approach of AOCs (DOE and NASA) and for Risk Assessment-Based Approach (Boeing), Santa Susana Field Laboratory, Ventura County, California (2013b).
For additional information regarding the LUT values, refer to DTSC’s Chemical Look-Up Table Technical Memorandum, Santa Susana Field Laboratory, Ventura County, California (2013a).
Table 1-1 lists the chemicals requiring cleanup under the 2010 AOC background scenario, as well as the LUT values that serve as the preliminary cleanup values for this scenario (all tables are located at the end of the document). A total of 59 chemicals are presented Table 1-1. These chemicals were identified as requiring cleanup under the background scenario based on agreements between NASA and DTSC. These 59 chemicals are considered chemicals of potential concern (COPCs) for purposes of this white paper. The list includes contaminants detected across SSFL and includes contaminants that either exceeded background values or, for those chemicals lacking background values, exceeded laboratory MRLs. The chemicals and their associated LUT values are subject to change and are current as of June 2013.
1.4 Traditional Risk Assessment and Risk Management Framework
Human health risk assessments (HHRAs) and ecological risk assessments (ERAs) often are conducted as part of the CERCLA process to evaluate whether hazardous chemicals in environmental media might have harmed or have a potential to harm exposed ecological or human receptors. The overall objective of a CERCLA risk assessment is to provide risk-based information to environmental restoration project managers for remedial decision making (deciding whether or not cleanup of a site might be needed because of potential threats to human or ecological receptors).
HHRAs identify those contaminants of concern (COCs) that pose potential risk to human receptors and might require additional action or evaluation. EPA uses the 1 x 10⁻⁶ to 1 x 10⁻⁴ risk range as a “target range” within which EPA strives to manage risks as part of a Superfund cleanup. Exposure areas that have excess lifetime cancer risk estimates less than 1 x 10⁻⁶ are characterized as not posing a threat to human health for the evaluated exposed populations and pathways. Cancer risk estimates within the risk range (1 x 10⁻⁶ to 1 x 10⁻⁴) could warrant a risk management decision that includes evaluating site-specific characteristics and exposure scenario factors to assess whether further action (such as cleanup or mitigation) is warranted (EPA, 1991). In cases where the cumulative cancer risk estimate to an individual based on the reasonable maximum exposure (RME) is less than 1 x 10⁻⁴ and the noncarcinogenic hazard quotient (HQ) is less than 1, action generally is not warranted (EPA, 1991). Exposure areas that have hazard indexes (HIs)–the sum of the HQs for individual chemicals in the exposure area–less than 1 are characterized as not posing a threat to human health for the evaluated exposed populations and pathways. An HI of greater than 1 indicates that there is some potential for adverse noncancer health effects associated with exposure to the COCs (EPA, 1991).
ERAs identify those contaminants of ecological concern (COECs) that pose potential risk to the ecological receptors and might require additional action or evaluation. ERAs often contain detailed information regarding the contact or co-occurrence of stressors (or agents) with the biological community at a site. Exposure profiles are developed to identify ecological receptors (tissues, organisms, populations, communities, and ecosystems), habitats, and pathways of exposure. The sources and distributions of stressors in the environment also are characterized. Other information contained in ERAs might include evaluations of individual species, populations of species, general trophic levels, communities, habitat types, ecosystems, or landscapes (EPA, 2013). A risk does not exist unless an exposure has the ability to cause one or more adverse effects, and that exposure co-occurs with or contacts an ecological component long enough and at a sufficient intensity to elicit the identified adverse effect.
The main differences between traditional risk assessment and the risk evaluations conducted as part of this effort are the spatial area and the summary statistics used to evaluate risk. Site-specific risk assessments using smaller MGM14-SSFL/CLEANUP_EVAL_PAPER/SSFL_COMPARATIVECLEANUPEVAL_PAPER.DOC 1-3 ES060713081955MGM

1. INTRODUCTION
site boundaries typically would be conducted to evaluate risk on a site-by-site basis. This approach is more representative of areas that a future resident or small home range receptor would encounter over the course of exposure. When evaluating risk on a sitewide basis (a larger exposure area), as was done as part of this effort, hot spots could be overlooked and predicted risk might be less conservative. Similarly, the use of a 95-upper confidence limit of the mean (95 UCL) concentrations is also slightly more conservative than the use of average concentrations, as was done in this case, and is likely to result in slightly higher predicted risks. Consequently, as noted before, this evaluation is intended for comparative purposes only and is not intended to support actual cleanup decisions on a site-by-site basis.
1-4 MGM13-SSFL/WHITE PAPER/SSFL_COMPARATIVECLEANUPEVAL_PAPER.DOC ES060713081955MGM

SECTION 2 Comparative Analysis of Cleanup Scenarios Based on Human Health Risk Evaluation
2.1 Evaluation of Human Health Risks Associated with the Background Cleanup Scenario
An evaluation of the human health risks associated with a background cleanup scenario (for example, using the LUT values as the cleanup levels) is presented in this section. The LUT values are from the Chemical Look-Up Table Technical Memorandum (DTSC, 2013a), as discussed in Section 1.3. The soil cleanup levels for both the background cleanup scenario and the risk-based cleanup scenario also were compared.
2.1.1 Methods and Assumptions Cancer risk and noncancer hazard estimates were calculated using the risk ratio method and the site-specific suburban residential soil risk-based screening levels (RBSLs) (MWH, 2012). RBSLs are derived based on standard exposure assumptions for an RME suburban residential exposure scenario for soil, assuming no garden exposure scenario (MWH, 2012). The methods used to estimate risk and to calculate the RBSLs were consistent with the DTSC-approved Standardized Risk Assessment Manual (SRAM Rev. 2) (MWH, 2005) and with human health risk assessment procedures from the California Environmental Protection Agency ([Cal/EPA], 1992; Cal/EPA, 1994) and EPA (1989; 1991).
Risk and hazard estimates were calculated from the 59 chemicals that have been identified as COPCs that might require cleanup. As noted in Section 1.3, these 59 chemicals were identified based the frequency of detection and the detected concentrations that exceeded the cleanup levels (LUT values).
Table 2-1 provides the suburban residential soil RBSLs. Potential risks and hazards were estimated by using the risk ratio method. For cancer risk estimates, the exposure point concentration (EPC) is divided by the RBSL concentrations that are designated as being carcinogenic (cancer causing). The resulting ratio is multiplied by the target risk level (1 x 10⁻⁶) to estimate chemical-specific risk for an RME scenario. For multiple chemicals, the cancer risk estimates for the chemicals are summed separately to estimate the total cancer risk for soil.
For noncancer health hazard estimates, the EPC in surface soil and mixed zone soil is divided by the noncancer RBSL. For multiple chemicals, the resulting ratios (known as HQs) are summed. The cumulative ratio represents a noncarcinogenic HI.
As discussed in Section 1.4, cancer risk estimates less than 1 x 10⁻⁶ and exposure areas with HIs lower than 1 are characterized as not posing a threat to human health for the evaluated exposed populations and pathways.
An HHRA is associated with inherent uncertainties and limitations and relies on various assumptions. EPA’s Risk Assessment Guidance for Superfund (EPA, 1989) provides a detailed elaboration of these uncertainties, limitations, and assumptions. Specific issues associated with this comparative human health risk evaluation are discussed in the following text.
The risks estimated for this evaluation were based on the average 0- to 10-ft-below ground surface (bgs) soil concentrations using available soil samples evaluated across NASA-administered sites. The process of identifying the COPCs (Section 2.2.1) and the risk estimates for the background cleanup scenario (Section 2.2.3) used average concentrations that can result in an underestimation of risk. However, EPCs (which are based on a 95 UCL or equivalent concentration in a standard baseline HHRA) might be higher or lower at specific sites. This approach could result in an underestimation of risk and failure to identify areas in which higher EPCs occur for individual sites. For many less contaminated sites, where the site-specific EPC is less than the sitewide average
MGM14-SSFL/CLEANUP_EVAL_PAPER/SSFL_COMPARATIVECLEANUPEVAL_PAPER.DOC 2-1 ES060713081955MGM

2 COMPARATIVE ANALYSIS OF CLEANUP SCENARIOS BASED ON HUMAN HEALTH RISK EVALUATION
concentration, this approach might result in an overestimation of risks. Risk management actions, if needed, will be different for each site based on the site-specific nature and extent of contamination and the site-specific EPC.
The estimation of risk requires many assumptions to describe potential exposure situations (Cal/EPA, 1992; EPA, 1989). There are uncertainties regarding the likelihood of exposure, the frequency of contact with contaminated media, the concentration of contaminants at exposure points, and the period of exposure. These tend to simplify and approximate actual site conditions. In general, these assumptions are upper-bound assumptions intended to be conservative and yield an overestimate of the estimate of risks or hazards.
The screening approach used in this evaluation also does not account for the possibility that contaminants act synergistically or antagonistically (EPA, 1989). Therefore, there is uncertainty associated with the risk calculations, and potential risks might be overestimated or underestimated.
2.1.2 Background Cleanup Scenario Results As discussed in Section 1.3, the “background cleanup scenario” represents site cleanup to background conditions. For each chemical detected in soil samples collected from NASA-administered site, the LUT value is used as the exposure point concentration to characterize risk under the background cleanup scenario. As listed in Table 2-2, the LUT values are composed of the background value at the “upper simultaneous limit” at a 95-percent upper simultaneous limit (95 USL) (DTSC, 2012) or, when background values are not available for a chemical, the laboratory-based reporting limit concentrations (DTSC, 2013a).
This scenario is based strictly on the use of the LUT values as cleanup levels and does not account for whether chemicals are detected in soil or, if detected, exceed the RBSLs. In other words, risks to human receptors are not considered when identifying those contaminants that require cleanup. Therefore, this scenario is highly conservative because it assumes that each chemical is detected in soil and, therefore, represents the cumulative risk of the 59 chemicals that have been identified as COPCs that might require cleanup. In most NASA-administered sites at SSFL, not all 59 chemicals have been detected. And, for many chemicals, the LUT values are lower than the RBSLs for a suburban residential exposure scenario, resulting in cleanup of contaminants that do not pose a risk to human health.
The evaluation calculations were performed using suburban residential exposure factors based on the potential future land use at SSFL (MWH, 2012). The exposure factors are standard exposure assessment assumptions in accordance with Cal/EPA and EPA guidance (Cal/EPA, 2011; EPA, 1989). Cumulative cancer risk and hazard estimates are calculated for the suburban residential exposure scenario using the LUT values in an effort to consider a proven conservative approach. Table 2-2 provides the results of the human health risk calculations by chemical. For purposes of this comparative exercise it is assumed that every COPC is detected in soil, which is highly conservative. If only the detected COPCs are considered, the risk and HI would be much lower.
These results indicate that the cumulative cancer risk from exposure to LUT values of COPCs is 7 x 10⁻⁴. The primary contributor to risk is arsenic (a naturally occurring metal that is detected in every soil sample collected at SSFL), which contributes more than 99 percent of the total risk. The LUT value for arsenic is 46 milligrams per kilogram, which is based on the background concentrations and results in a 7 x 10⁻⁴ cancer risk estimate. Arsenic commonly is found at naturally occurring levels above the RBSL. Similar to arsenic, chromium VI is a naturally occurring metal that is detected in every soil sample collected as SSFL, with a cancer risk estimate of 1.5 x 10⁻⁶. If arsenic and chromium VI are removed from the risk calculation, the cumulative risk would be 2 x 10⁻⁶. No other compound contributes more than 1 x 10⁻⁶ to the total risk.
The HI from exposure to the LUT values is 2, which exceeds the noncancer threshold of 1. The primary contributor to the HI is arsenic. If the arsenic and chromium VI are removed from the HI, the HI would be 0.4, which is below the noncancer threshold.
The cumulative risk and HI estimates in this analysis are derived assuming that every COPC has been detected at a site, which is an unlikely condition, and therefore, highly conservative. If only the detected COPCs for a site are considered, the risk and HI would be much lower.
2-2 MGM13-SSFL/WHITE PAPER/SSFL_COMPARATIVECLEANUPEVAL_PAPER.DOC ES060713081955MGM
2 COMPARATIVE ANALYSIS OF CLEANUP SCENARIOS BASED ON HUMAN HEALTH RISK EVALUATION
As noted in Table 2-2, with the exception of arsenic and chromium VI, the cancer risk estimates based on the LUT values are much less than the 10-6 to 10-4 risk management range and the noncancer HQ estimates are less than the target threshold of 1. These results indicate that additional risk reduction will not be achieved by cleaning up to background or reporting limits.
2.1.3 Comparing Background and Risk-based Cleanup Levels Another way to illustrate that additional risk reduction is not achieved by cleaning up to background or reporting limits is to show how more or less conservative the LUT value is compared with the RBSL. With the exception of LUT values for arsenic and hexavalent chromium (chromium VI), the LUT values for the 59 COPCs are less than RBSLs. Similar to arsenic, chromium VI is a naturally occurring metal that is detected in every soil sample collected as SSFL. As detailed in Table 2-3, with the exception of arsenic and chromium VI, the background cleanup scenario is 1.5 times to more than 6 million times more conservative than is necessary to be protective of human health. The LUT value for acetone, for example, is 3 million times lower than the RBSL. For silver, the LUT value is 1,150 times lower than the RBSL.
2.1.4 Discussion The evaluation of the background cleanup scenario risks and the comparison of the LUT values to the RBSLs indicate that cleaning up a given site to background levels would result in excavation beyond what is required by the more traditional risk-based approach to be protective of human health.
2.2 Comparison of Background and Risk-based Cleanup Scenarios for Site-specific Chemicals of Concern
In an effort to assess the difference in general cleanup requirements based on the background cleanup scenario versus a risk-based cleanup scenario, the cancer risks and noncancer hazards were estimated for site-specific COCs based on sampling results collected for the NASA-administered sites at SSFL. This comparison exercise is completed to illustrate the potential differences between background and risk-based cleanup scenarios and is not intended to represent a standard HHRA for the individual NASA-administered sites at SSFL. Nor is it intended to provide information that supports site-management decisions–for example, cleanup or additional sampling–at individual NASA-administered sites at SSFL or for individual NASA-administered sites as a whole. Again, this exercise is intended to address outstanding public comments.
The analysis in this subsection is intended to compare the level of protectiveness by cleaning up soil to background, as required by the 2010 AOC, versus cleaning up only those chemicals that pose unacceptable risk to human receptors and require cleanup (the site-specific COCs based on potential human health risks).
2.2.1 Selection of Site-specific Contaminants of Concern The COCs were selected based on whether the average soil concentrations from samples collected from 0 to 10 ft bgs from the NASA-administered sites exceeded the lowest RBSL (between the cancer effects and the noncancer effects RBSLs). The average soil concentration was calculated for each chemical assuming one-half the reporting limit for nondetects (Table 2-4). Vinyl chloride, benzo(a)pyrene (BaP) equivalent, n-nitrosodimethylamine, arsenic, and 2,3,7,8-tetrachlorodibenzo-p-dioxin (TCDD) toxicity equivalent (TEQ) had average soil concentrations greater than their RBSLs and were identified as COCs for this comparative exercise (Table 2-4).
This analysis is for illustrative purposes, because EPCs might be lower or higher at individual NASA-administered sites, and therefore, result in a different list of COCs and different risk management actions required to address potentially unacceptable risks to human receptors.
2.2.2 Risk-based Cleanup Scenario Risk Estimates Under the risk-based cleanup scenario, cancer risk and noncancer hazard estimates were calculated for the five COCs using the RBSL as the cleanup level (Table 2-5). Risk and HQ estimates were not provided for the 54 COPCs that were not identified as COCs. Because COCs would be remediated to risk-based concentrations, the cancer risk estimates are equal for each COC to 1 x 10⁻⁶ and the HQ estimates are equal to 1. The cumulative cancer risk estimates for all of the COCs using the RBSLs as the EPC is 5 x 10⁻⁶ and the total noncancer HI is 4. MGM14-SSFL/CLEANUP_EVAL_PAPER/SSFL_COMPARATIVECLEANUPEVAL_PAPER.DOC 2-3 ES060713081955MGM

2 COMPARATIVE ANALYSIS OF CLEANUP SCENARIOS BASED ON HUMAN HEALTH RISK EVALUATION
2.2.3 Background Cleanup Scenario Risk Estimates Under the background scenario, cancer risk and noncancer hazard estimates were calculated for each COC using the LUT values for the EPC (Table 2-5). Risk and HQ estimates were not provided for 54 COPCs that were not identified as COCs. The cumulative cancer risk estimates for all COCs using the average soil concentration as the EPC is 7 x 10⁻⁴ and the total noncancer HI is 2.
As noted previously, arsenic was one of the five COCs identified. However, because the cleanup level for arsenic (based on an LUT value that is a background concentration) represents an elevated (that is, greater than 10-4) cancer risk estimate that is not site related. The results in Table 2-5 are listed without arsenic. The cumulative cancer risk estimates for all of the COCs using the average soil concentration as the EPC is 9 x 10⁻⁷ and the total noncancer HI is 0.04.
2.2.4 Discussion The background cleanup scenario results in cleanup that is generally more conservative than what is required to be protective of human health (that is, cleanup under a risk-based scenario). The comparative results provided in Table 2-5 indicate that–based on the average sitewide concentrations–cleaning up COCs in soil to background levels would result in cleanup in the NASA-administered sites beyond what is required to be protective of human health.
The ratio of the risk estimates for the risk-based cleanup scenario relative to the background cleanup scenario was calculated and is presented in Table 2-5. Because only 5 of the 59 COPCs were identified as COCs, the risk ratio was only estimated for those chemicals, as listed in Table 2-5.
The cancer risk ratio ranged from 3.3 to 5.7, with the greatest ratio associated with 2,3,7,8-TCDD TEQ. The noncancer hazard ratio ranged from 49 to 10,000, with the greatest ratio associated with vinyl chloride. Ratios greater than 1 indicate that the background cleanup scenario is more conservative than the risk-based cleanup scenario. For example, a ratio of 4 indicates that the background cleanup scenario is up to four times more conservative than what is required to be protective of human health.
Under the background cleanup scenario (when using the LUT values as the EPCs to estimate risks), 53 of the 59 chemicals identified as COPCs that are proposed for remediation do not pose an unacceptable risk to human health.
2-4 MGM13-SSFL/WHITE PAPER/SSFL_COMPARATIVECLEANUPEVAL_PAPER.DOC ES060713081955MGM

S
CompECTION 3
arative Analysis of Cleanup Scenarios based on Ecological Risk Evaluation
3.1 Evaluation of Ecological Risk Associated with the Background Cleanup Scenario
An evaluation of the ecological risks associated with a background cleanup scenario (using the LUT values as the cleanup levels) is presented in this section. The LUT values are from the Chemical Look-Up Table Technical Memorandum (DTSC, 2013a) and were developed in agreement with DTSC, as discussed in Section 1.3. As listed in Table 1-1, the LUT values are composed of the background value at the 95 USL) (DTSC, 2012) or, when background values are not available for a chemical, the laboratory-based MRL concentrations (DTSC, 2013a).
3.1.1 Methods and Assumptions The potential for adverse effects to ecological receptors under the background scenario was evaluated using ecologically relevant benchmarks called no-effect and low-effect levels. No-effect and low-effect levels are DTSC-approved calculated dose-equivalent medium concentrations for mammals and birds that are used to assess risks to terrestrial receptors exposed to soil at SSFL, as discussed in the technical memorandum, Ecological Risk-Based Screening Levels for Use in Ecological Risk Assessments at SSFL (MWH, 2011). No-effect levels generally are based on no observed adverse effect levels, while low-effect levels are based on lowest observed adverse effect levels. The no- and low-effect levels are intended to streamline the ERA process and were reviewed and agreed to by DTSC. The parameters that were used to calculate the no- and low-effect levels follow EPA and DTSC risk assessment guidance (EPA, 1998; DTSC, 1996), as well as the DTSC-approved SRAM, Revision 2 (MWH, 2005) and have been approved by DTSC for assessing risk at SSFL. Table 3-1 lists the no- and low-effect levels. It should be noted that direct exposure-based ecological risk-based screening levels also are available for plants and soil invertebrates; however, according to the SRAM, Revision 2 (MWH, 2005), plants are only evaluated quantitatively in ERAs at SSFL if evidence of plant stress is noted during site visits. Also, no- and low-effect levels for birds and mammals generally were more conservative than the soil invertebrate screening levels. Consequently, bird and mammal no- and low-effect levels were considered protective of plants and soil invertebrates. This approach might underestimate risks in instances where the terrestrial invertebrate effect levels are lower; however, it is likely to have little impact on the overall predicted risk.
Potential risks under the background cleanup scenario were estimated by dividing the LUT value by the no-effect level, as well as the low-effect level, to give a risk range. If the resulting HQ was greater than 1, the potential for risk exists and additional qualitative evaluation (comparison to background, frequency of exceedance, magnitude of exceedance, etc.) is necessary. If the resulting HQ was less than 1, then no risk is predicted.
3.1.2 Background Cleanup Scenario Results As discussed in Section 1.3, the background cleanup scenario represents site cleanup to background conditions. For each chemical detected in soil samples collected from the NASA-administered site, the LUT value, as discussed in Section 3.1 and presented in Table 1-1, is used as the EPC to characterize risk under the background cleanup scenario. This scenario is strictly concentration-based and does not account for risks to human or ecological receptors when identifying those contaminants that require cleanup. In most cases, this approach is highly conservative.
Table 3-2 provides the results of the ecological risk calculations by chemical. Of the 59 chemicals that were identified as requiring cleanup under the background scenario (Section 1.3 provides more discussion of how the 59 chemicals were selected), 73 percent (43/59) were not predicted to pose ecological risk (HQs were less than 1). For 9 contaminants, risk was predicted based on the no-effect concentration but not based on the low-effect concentration, indicating that the overall ecological risk is low. Although ecological risk was predicted for arsenic,
MGM14-SSFL/CLEANUP_EVAL_PAPER/SSFL_COMPARATIVECLEANUPEVAL_PAPER.DOC 3-1 ES060713081955MGM

3 COMPARATIVE ANALYSIS OF CLEANUP SCENARIOS BASED ON ECOLOGICAL RISK EVALUATION
copper, lead, and 2-methyl-4-chlorophenoxyacetic acid (MCPA), the LUT values were based on background values for each chemical, suggesting that residual risk is attributed to naturally occurring or ambient concentrations and is not site-related.
3.1.3 Comparing Background and Risk-based Cleanup Levels For the majority of chemicals, as listed in Table 3-3, the LUT values were 1.5 to 42,000 times more conservative than the no-effect level and 1.2 to 200,000 times more conservative than the low-effect level. This result suggests that, at a minimum, in most cases the background scenario is cleaning up to concentrations that are almost two times more conservative than necessary to protect ecological receptors. For arsenic, copper, lead, and MCPA, both the no-effect and low-effect levels were more conservative than the LUT values, which suggests that the residual risk is associated with naturally occurring concentrations and is not site-related.
3.2 Comparison of Background and Risk-based Cleanup Scenarios for Site-specific Chemicals of Ecological Concern
In an effort to assess the difference in general cleanup requirements based on the background cleanup scenario versus a risk-based cleanup scenario, risks were estimated for site-specific COCs based on sampling results collected for all of the NASA-administered sites at SSFL. The risk-based cleanup scenario represents site cleanup to concentrations that are considered to not pose unacceptable risks to ecological receptors. Risk assessment is the most commonly used approach for identifying those contaminants that require cleanup under CERCLA.
This analysis is intended to compare the level of protectiveness by cleaning up soil to background, as required by the 2010 AOC, versus cleaning up only those chemicals that pose unacceptable risk to ecological receptors. This comparison is completed to illustrate the potential differences between background and risk-based cleanup scenarios and is not intended to represent a standard risk assessment for the individual NASA-administered sites at SSFL.
3.2.1 Selection of Site-specific Contaminants of Ecological Concern To select which chemicals would require cleanup under a risk-based scenario, the soil dataset was modified to include only those soil depths that were considered to support a complete ecological exposure pathway. According to the SRAM, Revision 2 (MWH, 2005), ecological receptors might be exposed to soils from 0 to 6 ft bgs. Consequently, the available soil data from 0 to 6 ft bgs were included in the ecological dataset to identify contaminants of potential ecological concern. Soil data from deeper than 6 ft bgs are not considered to support a complete exposure pathway for ecological receptors; therefore, these data were excluded. Summary statistics for the soil data set are presented in Table 3-4. The soil data were screened to evaluate what chemicals pose potential risks to ecological receptors. Only those chemicals that were detected in one or more samples and had a detection frequency of more than 5 percent were retained for consideration. Because data were combined on a sitewide basis, this approach might result in an underestimation of risk and failure to identify areas at which hot spots occur within each individual site. However, because receptors might forage in an area larger than the site and exposure to site-related contamination might be intermittent, isolated hot spots are not likely to result in impacts on populations of receptors.
The potential for adverse effects to ecological receptors was evaluated using ecologically relevant benchmarks called no-effect and low-effect levels, as discussed in Section 3.1.1. Table 3-1 lists the no- and low-effect levels.
To select what chemicals would be identified as COECs, four HQs were calculated for each chemical, as follows: 1) the maximum detected soil concentration compared to the no-effect level; 2) the maximum detected soil concentration compared to the low-effect level; 3) the average detected soil concentration compared to the no-effect level; and 4) the average detected soil concentration compared to the low-effect level. Average concentrations were calculated using one half the reporting limit for nondetect concentrations. Calculating four HQs provides a risk range for evaluating whether a given chemical poses potential risk. In an effort to account for
3-2 MGM13-SSFL/WHITE PAPER/SSFL_COMPARATIVECLEANUPEVAL_PAPER.DOC ES060713081955MGM

2 COMPARATIVE ANALYSIS OF CLEANUP SCENARIOS BASED ON HUMAN HEALTH RISK EVALUATION
cumulative risks and to be consistent with SRAM guidance (MWH, 2005), the HQs for Arcolor-1254 and Aroclor-1260 were summed to calculate the resulting HI.
Chemicals with no-effect HQs less than 1 pose no risk and were not evaluated further. When a chemical had no-effect HQs greater than 1 but one or more low-effect HQs less than 1, the potential for risk was further evaluated qualitatively based on magnitude of exceedance, frequency of exceedance, and concentrations relative to background values, as appropriate. In some cases, chemicals with low-effect HQs less than 1 were still identified as COCs if data suggested a potential for hot spots. If the maximum detected concentration was less than the background value, the chemical was considered to be consistent with background and was not identified as a COEC.
Chemicals were identified as COECs when all of the no- and low-effect HQs were greater than 1 and the chemical was not considered to be consistent with background. If the HI for aroclors exceeded 1, all aroclors were identified as COECs regardless of the individual HQs.
Five chemicals (antimony, Aroclor-1254, Aroclor-1260, cadmium, and 2,3,7,8-TCDD TEQ), were identified as COECs (Table 3-4). All no-effect and low-effect HQs for Aroclor-1260 and cadmium exceeded 1. Although only the low-effect HQs and the no-effect HQ based on the average concentration exceeded 1 for antimony, Aroclor-1254, and 2,3,7,8-TCDD TEQ, additional evaluation indicated that these chemicals have a potential to pose risk. Antimony was detected at concentrations greater than background in 65 percent of samples, and 23 percent of samples exceeded the low-effect level. Aroclor-1254 was retained as a COEC because the cumulative risk for aroclors exceeded 1. For 2,3,7,8-TCDD TEQ, 10 percent of the samples exceeded the low-effect level and hot spots are possible. The other chemicals were considered to pose a low to negligible risk and were not identified as COECs based on the rationale provided in Table 3-4.
It should be noted that this risk evaluation is for informational purposes only and is not intended to represent risk on a site-by-site basis. Additional risk efforts for each NASA-administered site might result in a different list of COECs requiring cleanup. This risk evaluation was conducted on a sitewide basis to give the reader a broad picture of the differences between a background and a risk-based cleanup scenario.
3.2.2 Risk-based Cleanup Scenario Risk Estimates As discussed in Section 3.2.1., the low-effect levels are based on lowest observed adverse effect levels. For most ecological receptors, a low-effect level generally is considered appropriate for assessing population-level risk. Consequently, the low-effect level was used to represent the preliminary cleanup value for this comparison, as presented in Table 3-5. Because the five identified COECs (antimony, Aroclor-1260, Aroclor-1254, cadmium, and 2,3,7,8-TCDD TEQ) would be remediated to the low-effect level under the risk-based scenario , residual risk would be equivalent to an HQ of 1. HQs were not presented for chemicals that were not identified as COECs based on the risk screening presented in Section 3.2.1 (Table 3-4).
3.2.3 Background Cleanup Scenario Risk Estimates Under the background scenario, HQs were calculated by dividing the LUT value by the low-effect level for each chemical identified as a COEC (Table 3-5). The low-effect level was selected over the no-effect level because, typically, a low-effect value would be selected as a final cleanup level for populations of ecological receptors as opposed to a no-effect value. Resulting HQs were less than 1 for all COECs. Based on the ratio of the risk-based HQ to the background HQ, the background cleanup scenario is 1.2 to 5.5 times more conservative than is necessary to protect ecological receptors from identified COECs.
3.3 Discussion On the basis of the comparison of LUT values to low-effect levels (Table 3-2), the background cleanup scenario is 1.2 to 200,000 times more conservative than necessary to protect ecological receptors for each of the 59 chemicals. For the five analytes identified as potentially requiring cleanup under a risk-based scenario, the background scenario is 1.2 to 5.5 times more conservative (Table 3-5).
MGM14-SSFL/CLEANUP_EVAL_PAPER/SSFL_COMPARATIVECLEANUPEVAL_PAPER.DOC 3-3 ES060713081955MGM

3 COMPARATIVE ANALYSIS OF CLEANUP SCENARIOS BASED ON ECOLOGICAL RISK EVALUATION
Additionally, the background scenario requires cleanup of 59 chemicals. Of these 59 chemicals, 54 chemicals were not identified as posing significant risk to ecological receptors either because they are located at depths deeper than 6 ft bgs (deeper than ecological receptors would be exposed) or because the risk evaluation indicated that risk was low to negligible (as presented in Table 3-4). Consequently, large areas of habitat that do not contain contaminants at concentrations known to pose risk to ecological receptors will be dug up and destroyed under the background cleanup scenario. Consequently, if remediated, the ecosystem might never fully recover to its current state. Alternatively, if hot spot removal were conducted to address only those few contaminants found to pose potential risk to ecological receptors, impacts to the environment would be much more limited and a large majority of the current habitat would remain intact and continue to support functioning ecosystems.
3-4 MGM13-SSFL/WHITE PAPER/SSFL_COMPARATIVECLEANUPEVAL_PAPER.DOC ES060713081955MGM

S
SEC
pTIO
atN 4
ial Evaluation of Excavation Boundaries under Background versus Risk-Based Cleanup Scenarios
This discussion and the related figures are intended to provide the reader with a broad picture of the spatial impact of the background cleanup scenario versus the risk-based cleanup assessment and are for comparative purposes only. The figure representing the excavation footprint under the risk-based cleanup is based on data collected and evaluated as part of past Remedial Investigations (RIs) (as indicated in the following text) and does not include data collected subsequent to the RIs. The figure presents areas that require cleanup on a point-by-point basis as opposed to a more sitewide holistic approach (as used in Sections 2 and 3) and is a conservative representation of the areas that might require excavation under the risk-based cleanup scenario. Additionally, the risk-based screening levels used in this risk evaluation were developed subsequent to the RIs and are not the same as those values used when developing the spatial extent of areas requiring excavation under the risk-based approach. Similarly, the figure representing the background areas requiring cleanup are based on outdated LUT values and are not inclusive of all the data used as part of this risk evaluation. Consequently, as noted earlier, these figures are intended merely to give the reader a broad spatial understanding of the areas requiring cleanup under each scenario and are not intended to be representative of the risk evaluation results in Sections 2 and 3, although the overall footprints likely would be similar.
Figure 4-1 presents the general areas that would require cleanup under the background scenario. These excavation boundaries are based on the draft May 2013 LUT values; however, use of the revised June 2013 values is not likely to significantly affect the footprints. Figure 4-2 presents the general cleanup footprints based on the site-specific risk assessment results presented in the RI Reports published for the NASA-administered sites between 2007 and 2009 (MWH, 2007; NASA, 2008, 2009a, 2009b) and provides a representation of the estimated footprint that likely would require cleanup under a risk-based assessment. Because the risk assessment effort included in this white paper was conducted on a sitewide basis, it is likely less conservative than the site-specific risk assessments conducted for the RI Reports, and the resulting footprints would be smaller. Consequently, the risk-based footprints presented in Figure 4-2 are more conservative (larger) than the footprint that would be estimated based on the sitewide risk assessment in this white paper.
Under the background cleanup scenario, a total of 105 acres would require cleanup. Alternatively, only 18 acres would require cleanup under the risk-based cleanup scenario presented in previous reports. As a result, approximately 87 acres of habitat in which contaminants currently pose no risk to ecological or human health receptors would be destroyed under the background cleanup scenario. Revitalization of these habitats could take hundreds of years and these habitats might never fully recover to their current state.
MGM14-SSFL/CLEANUP_EVAL_PAPER/SSFL_COMPARATIVECLEANUPEVAL_PAPER.DOC 4-1 ES060713081955MGM

4 SPATIAL EVALUATION OF EXCAVATION BOUNDARIES UNDER BACKGROUND VERSUS RISK-BASED CLEANUP SCENARIOS
This page intentionally left blank.
4-2 MGM13-SSFL/WHITE PAPER/SSFL_COMPARATIVECLEANUPEVAL_PAPER.DOC ES060713081955MGM
S
CECT
oIO
nN 5
clusions
NASA received many public questions about the benefits of a soil cleanup as prescribed by the 2010 AOC. The objective of this paper is to address those concerns and questions, and to evaluate the differences in general cleanup requirements between a background cleanup scenario versus a risk-based cleanup scenario typically conducted under the CERCLA process. To support this effort, human health and ecological risk evaluations were conducted using recently acquired field data for the sites within Groups 2, 3, 4, and 9 to present the differential risk between the background scenario and a risk-based cleanup scenario. The risk evaluations were conducted based on standard Cal/EPA and EPA guidance.
This paper provides an evaluation of 59 chemicals. These 59 chemicals were selected as requiring cleanup under the background scenario based on agreements among NASA and DTSC. The 59 chemicals include those detected across SSFL that that exceeded the LUT values published by DTSC in May 2013.
On the basis of this comparative analysis, cleanup to the background scenario is more conservative than necessary to protect human health and the environment based on three factors: 1) application of background LUT values (cleanup levels) that are 1.2 to more than 1 million times more conservative than risk-based levels; 2) potentially requiring cleanup to meet the 2010 AOC of up to 51 chemicals that do not pose risk; and 3) potentially affecting up to 87 additional acres under the 2010 AOC as compared to a risk-based cleanup.
Consequently, the evaluation identified differing approaches and impacts, related to the benefits to human health and the environment, of cleaning up to background. The more aggressive cleanup of the site that would occur under the background cleanup (more soil removal, more trucks entering the site, more emissions, more road miles, more soil to dispose of in landfills, etc.) could result in an increase in traffic accidents and spills and more habitat modification, as well as disturbance of wildlife and more impacts to archeological resources, all of which might result in reduced net benefits when compared to the risk-based cleanup scenario.
MGM14-SSFL/CLEANUP_EVAL_PAPER/SSFL_COMPARATIVECLEANUPEVAL_PAPER.DOC 5-1 ES060713081955MGM

5 CONCLUSIONS
This page intentionally left blank.
5-2 MGM13-SSFL/WHITE PAPER/SSFL_COMPARATIVECLEANUPEVAL_PAPER.DOC ES060713081955MGM

S
REC
efTION
erenc 6
es
California Environmental Protection Agency (Cal/EPA). 1992. Supplemental Guidance for Human Health Multimedia Risk Assessment of Hazardous Waste Sites and Permitted Facilities.
California Environmental Protection Agency (Cal/EPA). 1994. Preliminary Endangerment Assessment Guidance Manual.
California Environmental Protection Agency (Cal/EPA). 2011. Human Health Risk Assessment (HHRA) Note Number 1. Recommended DTSC Default Exposure Factors for Use in Risk Assessment at California Hazardous Waste Sites and Permitted Facilities. California Department of Toxic Substances Control (DTSC), Office of Human and Ecological Risk (HERO). May 20.
Department of Toxic Substances Control (DTSC). 1996. Guidance for Ecological Risk Assessment of Hazardous Waste Sites and Permitted Facilities. July.
Department of Toxic Substances Control (DTSC). 2012. Final Chemical Soil Background Study Report. Santa Susana Field Laboratory, Ventura County, California. California Environmental Protection Agency. December.
Department of Toxic Substances Control (DTSC). 2013. Chemical Look-Up Table Technical Memorandum, Santa Susana Field Laboratory, Ventura County, California. May 21.
MWH Americas, Inc. (MWH). 2005. Standardized Risk Assessment Methodology (SRAM) Work Plan, Santa Susana Field Laboratory, Ventura County, California. Revision 2–FINAL. September.
MWH Americas, Inc. (MWH). 2007. Group 4−Southern Portion of Area II RCRA Facility Investigation Report, Santa Susana Field Laboratory, Ventura County, California. Volume I-Text, Tables, and Figures. August.
MWH Americas, Inc. (MWH). 2011. Ecological Risk-Based Screening Levels for Use in Ecological Risk Assessments at the Santa Susana Field Laboratory, Ventura County, California.
MWH Americas, Inc. (MWH). 2012. Draft Human Health Risk-Based Screening Levels (HH RBSLs) for Chemicals in Soil for Use in RCRA Facility Investigations / Remedial Investigations (RFI/RIs) at the Santa Susana Field Laboratory (SSFL), California. November 7.
National Aeronautics and Space Administration (NASA). 2008. Draft RCRA Facility Investigation Report Santa Susana Field Laboratory, Ventura County, California. November.
National Aeronautics and Space Administration (NASA). 2009a. Draft Group 3 Remedial Investigation Report at the Santa Susana Field Laboratory, Ventura County, California. March.
National Aeronautics and Space Administration (NASA). 2009b. Draft Group 9 Remedial Investigation Report at the Santa Susana Field Laboratory, Ventura County, California. November.
National Aeronautics and Space Administration (NASA). 2013. Draft Environmental Impact Statement for Proposed Demolition and Environmental Cleanup Activities at Santa Susana Field Laboratory, Ventura County, California. Prepared for George C. Marshall Space Flight Center, Huntsville, Alabama. July.
Science Applications International Corporation (SAIC). 1994. Final RCRA Facility Assessment Report for Rockwell International Corporation, Boeing Division, Santa Susana Field Laboratory. Ventura County, California. Prepared for EPA, Region 9. May.
U.S. Environmental Protection Agency (EPA). 1989. Risk Assessment Guidance for Superfund – Volume I: Human Health Evaluation Manual, Part A. Interim Final. Office of Solid Waste and Emergency Response.
MGM14-SSFL/CLEANUP_EVAL_PAPER/SSFL_COMPARATIVECLEANUPEVAL_PAPER.DOC 6-1 ES060713081955MGM

6 REFERENCES
U.S. Environmental Protection Agency (EPA). 1991. RAGS: Volume 1—HHEM Supplemental Guidance. Standard Default Exposure Factors. Interim Final. Office of Solid Waste and Emergency Response. OSWER Directive 9285.6-03.
U.S. Environmental Protection Agency (EPA). 1998. Guidelines for Ecological Risk Assessment. EPA/630/R-95/002F. April.
U.S. Environmental Protection Agency (EPA). 2013. Ecological Risk Assessment. http://www.epa.gov/superfund/programs/nrd/era.htm. Accessed April 8.
6-2 MGM13-SSFL/WHITE PAPER/SSFL_COMPARATIVECLEANUPEVAL_PAPER.DOC ES060713081955MGM

Tables

This page intentionally left blank.
Chemical Class
Dioxins Preliminary Priority 1 Chemicals
2,3,7,8‐TCDD TEQ
Look‐up Table Valueb (mg/kg) 0.000000912
Basis BTV‐TEQ
Formaldehyde Herbicides Herbicides
Formaldehyde
Dichloroprop MCPA
1.87 0.0024 0.761
Background MRL Background MRL
BTV Herbicides MCPP 0.371 BTV Inorganic Inorganic Metals Metals
Cyanide Perchlorate Antimony Arsenic
0.6 1.63 0.86 46
Background MRL BTV BTV BTV
Metals Cadmium 0.7 BTV Metals Chromium VI 2
Metals Metals
Copper Lead
119 49
BTV BTV
Metals Metals
Mercury Silver
0.05 0.2
BTV BTV
Metals Zinc 215 BTV PAHs PAHs PAHs PAHs PAHs PAHs
1‐Methyl naphthalene 2‐Methylnaphthalene Acenaphthene Acenaphthylene Anthracene
B(a)P TEQ
0.01 0.01
0.0025 0.0025 0.0025 0.00447
Reporting Limit Reporting Limit Background MRL Background MRL Background MRL
BTV‐TEQ PAHs PAHs PAHs
Benzo(a)pyrene Benzo(ghi)perylene Fluoranthene
0.0023 0.0025 0.0052
BTV Background MRL
BTV PAHs Fluorene 0.0038 BTV PAHs PAHs
Naphthalene Phenanthrene
0.0036 0.0039
BTV BTV
PAHs PCB
Pyrene Aroclor 1016
0.0056 0.017
BTV BTV
PCB Aroclor 1221 0.033 BTV PCB Aroclor 1232 0.017 BTV PCB Aroclor 1242 0.017 BTV PCB Aroclor 1248 0.017 BTV PCB Aroclor 1254 0.017 BTV PCB Aroclor 1260 0.017 BTV PCB Aroclor 1262 0.033 BTV PCB Aroclor 1268 0.033 BTV Pesticides 4,4'‐DDE 0.0086 BTV Pesticides 4,4'‐DDT 0.013 BTV Pesticides Chlordane 0.007 BTV
TABLE 1‐1 Look‐up Table Values for Analytes Requiring Cleanup Under the Background Cleanup Scenario Comparative Analysis of the Background and Risk‐Based Cleanup Scenarios, SSFL, Ventura County, California
BTV
MGM14‐SSFL/Cleanup_Eval_Paper/Cleanup_Eval_Paper_Tables.xlsx ES060713081955MGM

0.00048
0.66
0.061
0.1
0.027
0.027
0.01
0.17
0.17
0.01
0.02
0.005
0.005
0.005
0.01
0.005
0.005
0.005
0.005
TABLE 1‐1 Look‐up Table Values for Analytes Requiring Cleanup Under the Background Cleanup Scenario Comparative Analysis of the Background and Risk‐Based Cleanup Scenarios, SSFL, Ventura County, California
Chemical Class Preliminary Priority 1 Chemicals Look‐up Table Valueb (mg/kg) Basis
Pesticides Dieldrin Background MRL SVOC Benzoic acid Multi‐Lab MRL SVOC bis(2‐Ethylhexyl) phthalate BTV SVOC Butyl benzyl phthalate BTV SVOC Di‐n‐butyl phthalate Background MRL SVOC Di‐n‐octyl phthalate Background MRL SVOC N‐Nitrosodimethylamine Reporting Limit SVOC Pentachlorophenol Reporting Limit SVOC Phenol Reporting Limit VOCs 2‐Hexanone Reporting Limit VOCs Acetone Reporting Limit VOCs cis‐1,2‐Dichloroethene Reporting Limit VOCs Ethylbenzene Reporting Limit VOCs Hexachlorobutadiene Reporting Limit VOCs Methylene chloride Reporting Limit VOCs Tetrachloroethene Reporting Limit VOCs Toluene Reporting Limit VOCs Trichloroethene Reporting Limit VOCs Vinyl chloride Reporting Limit Notes: µg/kg = Micrograms per kilogram mg/kg = Milligram per kilogram B(a)P = Benzo(a)pyrene B(a)P TEQ = Benzo(a)pyrene toxic equivalency for the 7 carcinogenic PAHs (Benzo(a)pyrene, Benzo(a)anthracene, Benzo(b)fluoranthene, Benzo(k)fluoranthene, Chrysene, Dibenz(a,h)anthracene, and Indeno(1,2,3‐cd)pyrene)
Benzo(a)pyrene and B(a)P TEQ are considered a single chemical of potential concern. BTV = Background threhold value DDE = Dichlorodiphenyldichloroetheylene DDT = Dichlorodiphenyldichloroetheylene N/A = Chemicals was not detected or was not analyzed. PAH = Polycyclic aromatic hydrocarbon PCB = Polychlorinated biphenyl RBSL = Risk‐based screening level SVOC = Semivolatile organic compound TCDD = 2,3,7,8‐Tetrachlorodibenzo‐p‐dioxin VOC = Volatile organic compound a Based on March 13, 2013 query of master database for NASA SSFL Sites. b Look‐up Table Values subject to change. Department of Toxic Substances Control (DTSC). 2013. Chemical Look‐Up Table Technical Memorandum, Santa Susana Field Laboratory, Ventura County, California. June 11.
MGM14‐SSFL/Cleanup_Eval_Paper/Cleanup_Eval_Paper_Tables.xlsx ES060713081955MGM

TABLE 2‐1 Human Health Risk‐based Screening Levels Comparative Analysis of the Background and Risk‐Based Cleanup Scenarios, SSFL, Ventura County, California
Chemical Class Analyte
Suburban Residential (w/o garden)
RBSLa (mg/kg) Dioxins 2,3,7,8‐TCDD TEQ 4.81E‐06 Formaldehyde Formaldehyde 12,210 Herbicides Dichloroprop 686 Herbicides MCPA 34 Herbicides MCPP 69 Inorganic Cyanide 1,522 Inorganic Perchlorate 53 Metals Antimony 26 Metals Arsenic 0.066 Metals Cadmium 35 Metals Chromium VI 1.3 Metals Copper 3,043 Metals Lead 80 Metals Mercury 17 Metals Silver 230 Metals Zinc 22,825 PAHs 1‐Methyl naphthalene 7.3 PAHs 2‐Methylnaphthalene 162 PAHs Acenaphthene 3,226 PAHs Acenaphthylene 2,978 PAHs Anthracene 16,428 PAHs B(a)P TEQ 0.039 PAHs Benzo(ghi)perylene 1,652 PAHs Fluoranthene 2,203 PAHs Fluorene 2,177 PAHs Naphthalene 15 PAHs Phenanthrene 16,437 PAHs Pyrene 1,652 PCB Aroclor 1016 3.9 PCB Aroclor 1221 0.23 PCB Aroclor 1232 0.23 PCB Aroclor 1242 0.23 PCB Aroclor 1248 0.23 PCB Aroclor 1254 0.23 PCB Aroclor 1260 0.23 PCB Aroclor 1262 0.23 PCB Aroclor 1268 0.23 Pesticides 4,4'‐DDE 1.7 Pesticides 4,4'‐DDT 1.7 Pesticides Chlordane 1.7
MGM14‐SSFL/Cleanup_Eval_Paper/Cleanup_Eval_Paper_Tables.xlsx ES060713081955MGM

TABLE 2‐1 Human Health Risk‐based Screening Levels Comparative Analysis of the Background and Risk‐Based Cleanup Scenarios, SSFL, Ventura County, California
Chemical Class Analyte
Suburban Residential (w/o garden)
RBSLa (mg/kg) Pesticides Dieldrin 0.037 SVOC Benzoic acid 244,417 SVOC bis(2‐Ethylhexyl) phthalate 173 SVOC Butyl benzyl phthalate 274 SVOC Di‐n‐butyl phthalate 6,110 SVOC Di‐n‐octyl phthalate 2,444 SVOC N‐Nitrosodimethylamine 0.033 SVOC Pentachlorophenol 21 SVOC Phenol 18,330 VOCs 2‐Hexanone 170 VOCs Acetone 60,077 VOCs cis‐1,2‐Dichloroethene 9.2 VOCs Ethylbenzene 2.3 VOCs Hexachlorobutadiene 6.7 VOCs Methylene chloride 3.0 VOCs Tetrachloroethene 0.42 VOCs Toluene 513 VOCs Trichloroethene 0.80 VOCs Vinyl chloride 0.020 Notes: B(a)P = Benzo(a)pyrene B(a)P TEQ = Benzo(a)pyrene toxic equivalency for the 7 carcinogenic PAHs (Benzo(a)pyrene, Benzo(a)anthracene, Benzo(b)fluoranthene, Benzo(k)fluoranthene, Chrysene, Dibenz(a,h)anthracene, and Indeno(1,2,3‐cd)pyrene)
DDE = Dichlorodiphenyldichloroetheylene DDT = Dichlorodiphenyldichloroetheylene PAH = Polycyclic aromatic hydrocarbon PCB = Polychlorinated biphenyl RBSL = Risk‐based screening level SVOC = Semivolatile organic compound a: MWH Americas, Inc. (MWH). 2012. Draft Human Health Risk‐Based Screening Levels (HH RBSLs) for Chemicals in Soil for Use in RCRA Facility Investigations / Remedial Investigations (RFI/RIs) at the Santa Susana Field Laboratory (SSFL), California. November 7.
MGM14‐SSFL/Cleanup_Eval_Paper/Cleanup_Eval_Paper_Tables.xlsx ES060713081955MGM

TABLE 2‐2 Cancer Risk and Noncancer Hazard Estimates for Background Closure Scenario based on Look‐up Table Values Comparative Analysis of the Background and Risk‐Based Cleanup Scenarios, SSFL, Ventura County, California
Chemical Class Analyte CAS #
Look‐up Table
Valuesb
(mg/kg)
Cancer and Noncancer Estimates Calculated based on RME Suburban Residential Soil RBSL a
Composite Resident Soil RBSL
Cancer (TRL = 10‐6) (mg/kg)
Residential Cancer Risk Estimate
Percent Contribution
Compostie Child Resident Soil RBSL
Noncancer (THQ = 1) (mg/kg)
Residential Hazard Quotient
Percent Contribution
Dioxins 2,3,7,8‐TCDD TEQ DIOXTEQM 0.000000912 4.81E‐06 1.9E‐07 <0.01% 5.05E‐05 1.8E‐02 0.72% Formaldehyde Formaldehyde 50000 1.87 590,952 3.2E‐12 <0.01% 12,210 1.5E‐04 <0.01% Herbicides DichlorOprop 120365 0.0024 ‐ ‐ ‐ 686 3.5E‐06 <0.01% Herbicides MCPA 94746 0.761 ‐ ‐ ‐ 34 2.2E‐02 0.88% Herbicides MCPP 93652 0.371 ‐ ‐ ‐ 69 5.4E‐03 0.22% Inorganic Cyanide 57125 0.6 ‐ ‐ ‐ 1,522 3.9E‐04 <0.01% Inorganic Perchlorate 14797730 1.63 ‐ ‐ ‐ 53 3.1E‐02 1.22% Metals Antimony 7440360 0.86 ‐ ‐ ‐ 26 3.3E‐02 1.30% Metals Arsenic 7440382 46 0.066 7.0E‐04 99.54% 22 2.1E+00 84.63% Metals Cadmium 7440439 0.7 844 8.3E‐10 <0.01% 35 2.0E‐02 0.79% Metals Chromium VI 18540299 2 1.3 1.5E‐06 0.21% 234 8.5E‐03 0.34% Metals Copper 7440508 119 ‐ ‐ ‐ 3,043 3.9E‐02 1.56% Metals Mercury 7439976 0.05 ‐ ‐ ‐ 17 3.0E‐03 0.12% Metals Silver 7440224 0.2 ‐ ‐ ‐ 230 8.7E‐04 <0.01% Metals Zinc 7440666 215 ‐ ‐ ‐ 22,825 9.4E‐03 0.37% PAHs 1‐Methyl naphthalene 90120 0.01 7.3 1.4E‐09 <0.01% 2,846 3.5E‐06 <0.01% PAHs 2‐Methylnaphthalene 91576 0.01 ‐ ‐ ‐ 162 6.2E‐05 <0.01% PAHs Acenaphthene 83329 0.0025 ‐ ‐ ‐ 3,226 7.8E‐07 <0.01% PAHs Acenaphthylene 208968 0.0025 ‐ ‐ ‐ 2,978 8.4E‐07 <0.01% PAHs Anthracene 120127 0.0025 ‐ ‐ ‐ 16,428 1.5E‐07 <0.01% PAHs B(a)P TEQ PAHTEQM 0.00447 0.039 1.2E‐07 <0.01% ‐ ‐ ‐
PAHs Benzo(ghi)perylene 191242 0.0025 ‐ ‐ ‐ 1,652 1.5E‐06 <0.01% PAHs Fluoranthene 206440 0.0052 ‐ ‐ ‐ 2,203 2.4E‐06 <0.01% PAHs Fluorene 86737 0.0038 ‐ ‐ ‐ 2,177 1.7E‐06 <0.01% PAHs Naphthalene 91203 0.0036 15 2.5E‐10 <0.01% 681 5.3E‐06 <0.01% PAHs Phenanthrene 85018 0.0039 ‐ ‐ ‐ 16,437 2.4E‐07 <0.01% PAHs Pyrene 129000 0.0056 ‐ ‐ ‐ 1,652 3.4E‐06 <0.01% PCB Aroclor 1016 12674112 0.017 6.6 2.6E‐09 <0.01% 3.9 4.4E‐03 0.18% PCB Aroclor 1221 11104282 0.033 0.23 1.4E‐07 <0.01% 1.1 3.0E‐02 1.19% PCB Aroclor 1232 11141165 0.017 0.23 7.3E‐08 <0.01% 1.1 1.5E‐02 0.61% PCB Aroclor 1242 53469219 0.017 0.23 7.3E‐08 <0.01% 1.1 1.5E‐02 0.61% PCB Aroclor 1248 12672296 0.017 0.23 7.3E‐08 <0.01% 1.1 1.5E‐02 0.61% PCB Aroclor 1254 11097691 0.017 0.23 7.3E‐08 <0.01% 1.1 1.5E‐02 0.61% PCB Aroclor 1260 11096825 0.017 0.23 7.3E‐08 <0.01% 1.1 1.5E‐02 0.61% PCB Aroclor 1262 37324235 0.033 0.23 1.4E‐07 <0.01% 1.1 3.0E‐02 1.19% PCB Aroclor 1268 11100144 0.033 0.23 1.4E‐07 <0.01% 1.1 3.0E‐02 1.19% Pesticides 4,4'‐DDE 72559 0.0086 1.7 4.9E‐09 <0.01% ‐ ‐ ‐
Pesticides 4,4'‐DDT 50293 0.013 1.7 7.5E‐09 <0.01% 34 3.8E‐04 <0.01% Pesticides Chlordane 57749 0.007 1.7 4.1E‐09 <0.01% 34 2.0E‐04 <0.01% Pesticides Dieldrin 60571 0.00048 0.037 1.3E‐08 <0.01% 3.4 1.4E‐04 <0.01% SVOC Benzoic acid 65850 0.66 ‐ ‐ ‐ 244,417 2.7E‐06 <0.01% SVOC bis(2‐Ethylhexyl) phthalate 117817 0.061 173 3.5E‐10 <0.01% 1,222 5.0E‐05 <0.01% SVOC Butyl benzyl phthalate 85687 0.1 274 3.7E‐10 <0.01% 12,221 8.2E‐06 <0.01%
MGM14‐SSFL/Cleanup_Eval_Paper/Cleanup_Eval_Paper_Tables.xlsx ES060713081955MGM
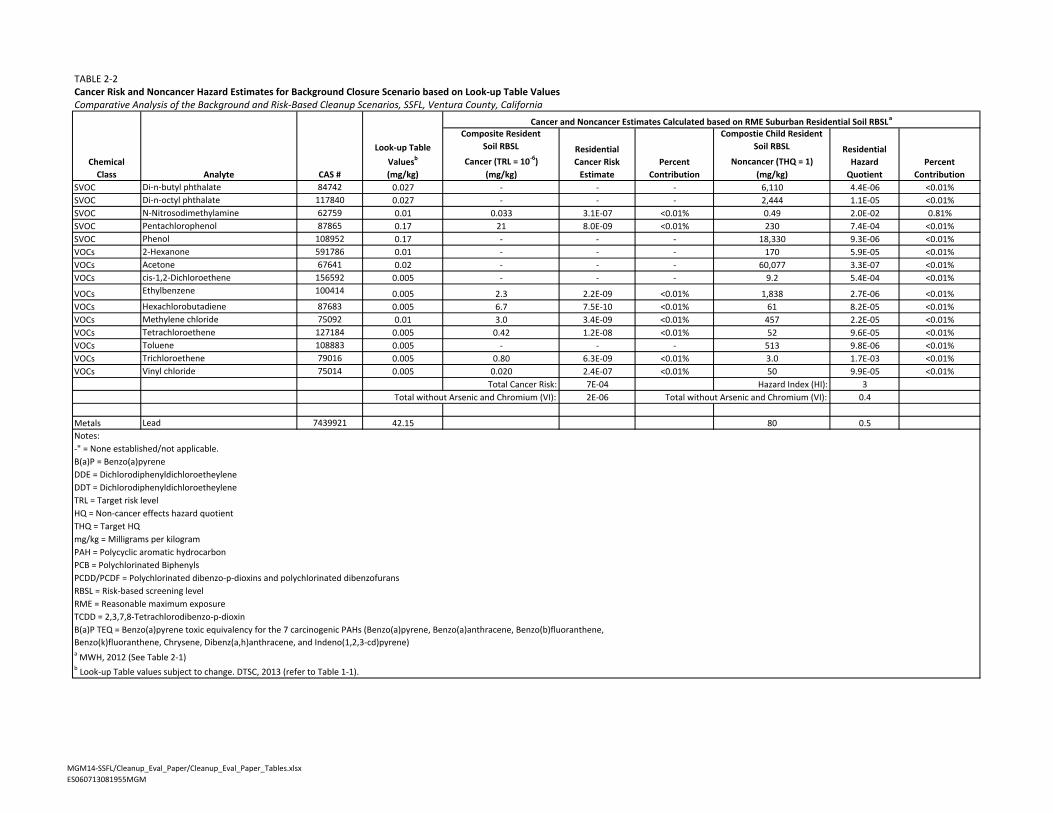
TABLE 2‐2 Cancer Risk and Noncancer Hazard Estimates for Background Closure Scenario based on Look‐up Table Values Comparative Analysis of the Background and Risk‐Based Cleanup Scenarios, SSFL, Ventura County, California
Chemical Class Analyte CAS #
Look‐up Table
Valuesb
(mg/kg)
Cancer and Noncancer Estimates Calculated based on RME Suburban Residential Soil RBSL a
Composite Resident Soil RBSL
Cancer (TRL = 10‐6) (mg/kg)
Residential Cancer Risk Estimate
Percent Contribution
Compostie Child Resident Soil RBSL
Noncancer (THQ = 1) (mg/kg)
Residential Hazard Quotient
Percent Contribution
SVOC Di‐n‐butyl phthalate 84742 0.027 ‐ ‐ ‐ 6,110 4.4E‐06 <0.01% SVOC Di‐n‐octyl phthalate 117840 0.027 ‐ ‐ ‐ 2,444 1.1E‐05 <0.01% SVOC N‐Nitrosodimethylamine 62759 0.01 0.033 3.1E‐07 <0.01% 0.49 2.0E‐02 0.81% SVOC Pentachlorophenol 87865 0.17 21 8.0E‐09 <0.01% 230 7.4E‐04 <0.01% SVOC Phenol 108952 0.17 ‐ ‐ ‐ 18,330 9.3E‐06 <0.01% VOCs 2‐Hexanone 591786 0.01 ‐ ‐ ‐ 170 5.9E‐05 <0.01% VOCs Acetone 67641 0.02 ‐ ‐ ‐ 60,077 3.3E‐07 <0.01% VOCs cis‐1,2‐Dichloroethene 156592 0.005 ‐ ‐ ‐ 9.2 5.4E‐04 <0.01%
VOCs Ethylbenzene 100414 0.005 2.3 2.2E‐09 <0.01% 1,838 2.7E‐06 <0.01% VOCs Hexachlorobutadiene 87683 0.005 6.7 7.5E‐10 <0.01% 61 8.2E‐05 <0.01% VOCs Methylene chloride 75092 0.01 3.0 3.4E‐09 <0.01% 457 2.2E‐05 <0.01% VOCs Tetrachloroethene 127184 0.005 0.42 1.2E‐08 <0.01% 52 9.6E‐05 <0.01% VOCs Toluene 108883 0.005 ‐ ‐ ‐ 513 9.8E‐06 <0.01% VOCs Trichloroethene 79016 0.005 0.80 6.3E‐09 <0.01% 3.0 1.7E‐03 <0.01% VOCs Vinyl chloride 75014 0.005 0.020 2.4E‐07 <0.01% 50 9.9E‐05 <0.01%
Total Cancer Risk: 7E‐04 Hazard Index (HI): 3 Total without Arsenic and Chromium (VI): 2E‐06 Total without Arsenic and Chromium (VI): 0.4
Metals Lead 7439921 42.15 80 0.5 Notes: ‐" = None established/not applicable. B(a)P = Benzo(a)pyrene DDE = Dichlorodiphenyldichloroetheylene DDT = Dichlorodiphenyldichloroetheylene TRL = Target risk level HQ = Non‐cancer effects hazard quotient THQ = Target HQ mg/kg = Milligrams per kilogram PAH = Polycyclic aromatic hydrocarbon PCB = Polychlorinated Biphenyls PCDD/PCDF = Polychlorinated dibenzo‐p‐dioxins and polychlorinated dibenzofurans RBSL = Risk‐based screening level RME = Reasonable maximum exposure TCDD = 2,3,7,8‐Tetrachlorodibenzo‐p‐dioxin B(a)P TEQ = Benzo(a)pyrene toxic equivalency for the 7 carcinogenic PAHs (Benzo(a)pyrene, Benzo(a)anthracene, Benzo(b)fluoranthene, Benzo(k)fluoranthene, Chrysene, Dibenz(a,h)anthracene, and Indeno(1,2,3‐cd)pyrene) a MWH, 2012 (See Table 2‐1) b Look‐up Table values subject to change. DTSC, 2013 (refer to Table 1‐1).
MGM14‐SSFL/Cleanup_Eval_Paper/Cleanup_Eval_Paper_Tables.xlsx ES060713081955MGM

TABLE 2‐3 Comparison of the Human Health Protectiveness of the Risk‐based Cleanup Levels to the Background Cleanup Levels Comparative Analysis of the Background and Risk‐Based Cleanup Scenarios, SSFL, Ventura County, California
Chemical Class Analyte CAS #
RME Suburban Residential Soil RBSLa
Lookup Table
Value [LUTV]b
(mg/kg)
Ratio of Cleanup Levels: Risk‐based Cleanup Scenario to
Background Cleanup Scenario (Lowest RBLSL / LUTV)
Human Health Risk‐Management Summary Composite Resident Cancer (TRL = 10‐6)
(mg/kg)
Composite Child Resident Noncancer (THQ=1)
(mg/kg) Lowest RBSL (mg/kg)
Metals Arsenic 7440382 6.58E‐02 2.16E+01 6.58E‐02 46 0.001 Lookup Table Value is 700 times less conservative than the Lowest RBSL Metals Chromium VI 18540299 1.29E+00 2.34E+02 1.29E+00 2 0.6 Lookup Table Value is 1.5 times less conservative than the Lowest RBSL Metals Lead 7439921 ‐ 8.00E+01 8.00E+01 49 2 Lookup Table Value is 1.6 times more conservative than the Lowest RBSL SVOC N‐Nitrosodimethylamine 62759 3.25E‐02 4.89E‐01 3.25E‐02 0.01 3 Lookup Table Value is 3.3 times more conservative than the Lowest RBSL VOCs Vinyl chloride 75014 2.04E‐02 5.05E+01 2.04E‐02 0.005 4 Lookup Table Value is 4.1 times more conservative than the Lowest RBSL Dioxins 2,3,7,8‐TCDD TEQ DIOXTEQM 4.81E‐06 5.05E‐05 4.81E‐06 0.000000912 5 Lookup Table Value is 5.3 times more conservative than the Lowest RBSL PCB Aroclor 1262 37324235 2.32E‐01 1.10E+00 2.32E‐01 0.033 7 Lookup Table Value is 7 times more conservative than the Lowest RBSL PCB Aroclor 1268 11100144 2.32E‐01 1.10E+00 2.32E‐01 0.033 7 Lookup Table Value is 7 times more conservative than the Lowest RBSL PCB Aroclor 1221 11104282 2.32E‐01 1.10E+00 2.32E‐01 0.033 7 Lookup Table Value is 7 times more conservative than the Lowest RBSL #N/A B(a)P TEQ PAHTEQM 3.87E‐02 ‐ 3.87E‐02 0.00447 9 Lookup Table Value is 8.7 times more conservative than the Lowest RBSL PCB Aroclor 1232 11141165 2.32E‐01 1.10E+00 2.32E‐01 0.017 14 Lookup Table Value is 14 times more conservative than the Lowest RBSL PCB Aroclor 1242 53469219 2.32E‐01 1.10E+00 2.32E‐01 0.017 14 Lookup Table Value is 14 times more conservative than the Lowest RBSL PCB Aroclor 1248 12672296 2.32E‐01 1.10E+00 2.32E‐01 0.017 14 Lookup Table Value is 14 times more conservative than the Lowest RBSL PCB Aroclor 1254 11097691 2.32E‐01 1.10E+00 2.32E‐01 0.017 14 Lookup Table Value is 14 times more conservative than the Lowest RBSL PCB Aroclor 1260 11096825 2.32E‐01 1.10E+00 2.32E‐01 0.017 14 Lookup Table Value is 14 times more conservative than the Lowest RBSL Metals Copper 7440508 ‐ 3.04E+03 3.04E+03 119 26 Lookup Table Value is 26 times more conservative than the Lowest RBSL Metals Antimony 7440360 ‐ 2.64E+01 2.64E+01 0.86 31 Lookup Table Value is 31 times more conservative than the Lowest RBSL Inorganic Perchlorate 14797730 ‐ 5.33E+01 5.33E+01 1.63 33 Lookup Table Value is 33 times more conservative than the Lowest RBSL Herbicides MCPA 94746 ‐ 3.43E+01 3.43E+01 0.761 45 Lookup Table Value is 45 times more conservative than the Lowest RBSL Metals Cadmium 7440439 8.44E+02 3.51E+01 3.51E+01 0.7 50 Lookup Table Value is 50 times more conservative than the Lowest RBSL Pesticides Dieldrin 60571 3.69E‐02 3.43E+00 3.69E‐02 0.00048 77 Lookup Table Value is 77 times more conservative than the Lowest RBSL VOCs Tetrachloroethene 127184 4.16E‐01 5.20E+01 4.16E‐01 0.005 83 Lookup Table Value is 83 times more conservative than the Lowest RBSL Metals Zinc 7440666 ‐ 2.28E+04 2.28E+04 215 106 Lookup Table Value is 110 times more conservative than the Lowest RBSL SVOC Pentachlorophenol 87865 2.12E+01 2.30E+02 2.12E+01 0.17 125 Lookup Table Value is 120 times more conservative than the Lowest RBSL Pesticides 4,4'‐DDT 50293 1.74E+00 3.43E+01 1.74E+00 0.013 134 Lookup Table Value is 130 times more conservative than the Lowest RBSL VOCs Trichloroethene 79016 7.97E‐01 2.99E+00 7.97E‐01 0.005 159 Lookup Table Value is 160 times more conservative than the Lowest RBSL Herbicides MCPP 93652 ‐ 6.86E+01 6.86E+01 0.371 185 Lookup Table Value is 180 times more conservative than the Lowest RBSL Pesticides 4,4'‐DDE 72559 1.74E+00 ‐ 1.74E+00 0.0086 202 Lookup Table Value is 200 times more conservative than the Lowest RBSL PCB Aroclor 1016 12674112 6.63E+00 3.86E+00 3.86E+00 0.017 227 Lookup Table Value is 230 times more conservative than the Lowest RBSL Pesticides Chlordane 57749 1.69E+00 3.43E+01 1.69E+00 0.007 241 Lookup Table Value is 240 times more conservative than the Lowest RBSL VOCs Methylene chloride 75092 2.97E+00 4.57E+02 2.97E+00 0.01 297 Lookup Table Value is 300 times more conservative than the Lowest RBSL Metals Mercury 7439976 ‐ 1.68E+01 1.68E+01 0.05 335 Lookup Table Value is 340 times more conservative than the Lowest RBSL VOCs Ethylbenzene 100414 2.31E+00 1.84E+03 2.31E+00 0.005 463 Lookup Table Value is 460 times more conservative than the Lowest RBSL PAHs 1‐Methyl naphthalene 90120 7.29E+00 2.85E+03 7.29E+00 0.01 729 Lookup Table Value is 730 times more conservative than the Lowest RBSL Metals Silver 7440224 ‐ 2.30E+02 2.30E+02 0.2 1,150 Lookup Table Value is 1200 times more conservative than the Lowest RBSL VOCs Hexachlorobutadiene 87683 6.67E+00 6.11E+01 6.67E+00 0.005 1,334 Lookup Table Value is 1300 times more conservative than the Lowest RBSL VOCs cis‐1,2‐Dichloroethene 156592 ‐ 9.22E+00 9.22E+00 0.005 1,845 Lookup Table Value is 1800 times more conservative than the Lowest RBSL Inorganic Cyanide 57125 ‐ 1.52E+03 1.52E+03 0.6 2,536 Lookup Table Value is 2500 times more conservative than the Lowest RBSL SVOC Butyl benzyl phthalate 85687 2.74E+02 1.22E+04 2.74E+02 0.1 2,738 Lookup Table Value is 2700 times more conservative than the Lowest RBSL SVOC bis(2‐Ethylhexyl) phthalate 117817 1.73E+02 1.22E+03 1.73E+02 0.061 2,842 Lookup Table Value is 2800 times more conservative than the Lowest RBSL PAHs Naphthalene 91203 1.46E+01 6.81E+02 1.46E+01 0.0036 4,050 Lookup Table Value is 4100 times more conservative than the Lowest RBSL Formaldehyde Formaldehyde 50000 5.91E+05 1.22E+04 1.22E+04 1.87 6,530 Lookup Table Value is 6500 times more conservative than the Lowest RBSL PAHs 2‐Methylnaphthalene 91576 ‐ 1.62E+02 1.62E+02 0.01 16,216 Lookup Table Value is 16000 times more conservative than the Lowest RBSL VOCs 2‐Hexanone 591786 ‐ 1.70E+02 1.70E+02 0.01 17,033 Lookup Table Value is 17000 times more conservative than the Lowest RBSL SVOC Di‐n‐octyl phthalate 117840 ‐ 2.44E+03 2.44E+03 0.027 90,525 Lookup Table Value is 91000 times more conservative than the Lowest RBSL VOCs Toluene 108883 ‐ 5.13E+02 5.13E+02 0.005 102,520 Lookup Table Value is 100000 times more conservative than the Lowest RBSL SVOC Phenol 108952 ‐ 1.83E+04 1.83E+04 0.17 107,825 Lookup Table Value is 110000 times more conservative than the Lowest RBSL SVOC Di‐n‐butyl phthalate 84742 ‐ 6.11E+03 6.11E+03 0.027 226,312 Lookup Table Value is 230000 times more conservative than the Lowest RBSL Herbicides Dichloroprop 120365 ‐ 6.86E+02 6.86E+02 0.0024 285,867 Lookup Table Value is 290000 times more conservative than the Lowest RBSL PAHs Pyrene 129000 ‐ 1.65E+03 1.65E+03 0.0056 295,071 Lookup Table Value is 300000 times more conservative than the Lowest RBSL SVOC Benzoic acid 65850 ‐ 2.44E+05 2.44E+05 0.66 370,328 Lookup Table Value is 370000 times more conservative than the Lowest RBSL PAHs Fluoranthene 206440 ‐ 2.20E+03 2.20E+03 0.0052 423,691 Lookup Table Value is 420000 times more conservative than the Lowest RBSL PAHs Fluorene 86737 ‐ 2.18E+03 2.18E+03 0.0038 572,930 Lookup Table Value is 570000 times more conservative than the Lowest RBSL PAHs Benzo(ghi)perylene 191242 ‐ 1.65E+03 1.65E+03 0.0025 660,958 Lookup Table Value is 660000 times more conservative than the Lowest RBSL
MGM14‐SSFL/Cleanup_Eval_Paper/Cleanup_Eval_Paper_Tables.xlsx ES060713081955MGM

TABLE 2‐3 Comparison of the Human Health Protectiveness of the Risk‐based Cleanup Levels to the Background Cleanup Levels Comparative Analysis of the Background and Risk‐Based Cleanup Scenarios, SSFL, Ventura County, California
Chemical Class Analyte CAS #
RME Suburban Residential Soil RBSLa
Lookup Table
Value [LUTV]b
(mg/kg)
Ratio of Cleanup Levels: Risk‐based Cleanup Scenario to
Background Cleanup Scenario (Lowest RBLSL / LUTV)
Human Health Risk‐Management Summary Composite Resident Cancer (TRL = 10‐6)
(mg/kg)
Composite Child Resident Noncancer (THQ=1)
(mg/kg) Lowest RBSL (mg/kg)
PAHs Acenaphthylene 208968 ‐ 2.98E+03 2.98E+03 0.0025 1,191,150 Lookup Table Value is 1200000 times more conservative than the Lowest RBSL PAHs Acenaphthene 83329 ‐ 3.23E+03 3.23E+03 0.0025 1,290,292 Lookup Table Value is 1300000 times more conservative than the Lowest RBSL VOCs Acetone 67641 ‐ 6.01E+04 6.01E+04 0.02 3,003,863 Lookup Table Value is 3000000 times more conservative than the Lowest RBSL PAHs Phenanthrene 85018 ‐ 1.64E+04 1.64E+04 0.0039 4,214,523 Lookup Table Value is 4200000 times more conservative than the Lowest RBSL PAHs Anthracene 120127 ‐ 1.64E+04 1.64E+04 0.0025 6,571,078 Lookup Table Value is 6600000 times more conservative than the Lowest RBSL Notes: Table is sorted by column I. ‐' = none established/not applicable. B(a)P = Benzo(a)pyrene B(a)P TEQ = Benzo(a)pyrene toxic equivalency for the 7 carcinogenic PAHs (Benzo(a)pyrene, Benzo(a)anthracene, Benzo(b)fluoranthene, Benzo(k)fluoranthene, Chrysene, Dibenz(a,h)anthracene, and Indeno(1,2,3‐cd)pyrene) DDE = Dichlorodiphenyldichloroetheylene DDT = Dichlorodiphenyldichloroetheylene EPC = Exposure point concentration TRL = Target risk level HQ = Non‐cancer effects hazard quotient THQ = Target HQ mg/kg = Milligrams per kilogram PAH = Polycyclic aromatic hydrocarbon PCB = Polychlorinated biphenyl PCDD/PCDF = Polychlorinated dibenzo‐p‐dioxins and polychlorinated dibenzofurans Ratio = Lowest RBSL divided by the EPC RBSL = Risk‐based screening level RME = Reasonable maximum exposure TCDD: 2,3,7,8‐Tetrachlorodibenzo‐p‐dioxin a MWH, 2012 (See Table 2‐1) b Look‐up Table values subject to change. DTSC, 2013 (See Table 1‐1)
MGM14‐SSFL/Cleanup_Eval_Paper/Cleanup_Eval_Paper_Tables.xlsx ES060713081955MGM

TABLE 2‐4 Chemicals of Concern Summary for Average Soil (0 to 10 feet bgs) Concentrations ‐ Risk‐based Cleanup Scenario Comparative Analysis of the Background and Risk‐Based Cleanup Scenarios, SSFL, Ventura County, California
Chemical Class Analyte CAS #
Exposure Point
Concentrationb
(mg/kg)
Calculated based on RME Suburban Residential Soil RBSL a
Contaminant Concern
ofComposite Resident ‐6 )RBSL Cancer (10 (mg/kg)
Residential Cancer Risk Estimate
Child RBSL (HQ=1)
Noncancer (mg/kg)
Residential Hazard Index
Dioxins 2,3,7,8‐TCDD TEQ DIOXTEQM 0.012 4.81E‐06 2.49E‐03 5.05E‐05 2.37E+02 Yes Formaldehyde Formaldehyde 50000 2.9 590,952 4.97E‐12 12,210 2.40E‐04 No Herbicides Dichlorprop 120365 N/A ‐ ‐ 686 ‐ N/A Herbicides MCPA 94746 N/A ‐ ‐ 34 ‐ N/A Herbicides MCPP 93652 N/A ‐ ‐ 69 ‐ N/A Inorganic Cyanide 57125 N/A ‐ ‐ 1,522 ‐ N/A Inorganic Perchlorate 14797730 N/A ‐ ‐ 53 ‐ N/A Metals Antimony 7440360 1.0 ‐ ‐ 26 3.83E‐02 No Metals Arsenic 7440382 5.4 0.066 8.17E‐05 22 2.49E‐01 Yes Metals Cadmium 7440439 0.55 844 6.46E‐10 35 1.55E‐02 No Metals Chromium VI 18540299 0.53 1.3 4.10E‐07 234 2.26E‐03 No Metals Copper 7440508 21 ‐ ‐ 3,043 6.93E‐03 No
Metals Mercury 7439976 0.058 ‐ ‐ 17 3.44E‐03 No Metals Silver 7440224 1.4 ‐ ‐ 230 6.30E‐03 No Metals Zinc 7440666 84 ‐ ‐ 22,825 3.69E‐03 No PAHs 1‐Methyl naphthalene 90120 0.026 7.3 3.61E‐09 2,846 9.25E‐06 No PAHs 2‐Methylnaphthalene 91576 0.096 ‐ ‐ 162 5.95E‐04 No PAHs Acenaphthene 83329 0.079 ‐ ‐ 3,226 2.45E‐05 No PAHs Acenaphthylene 208968 0.074 ‐ ‐ 2,978 2.49E‐05 No PAHs Anthracene 120127 0.085 ‐ ‐ 16,428 5.20E‐06 No PAHs B(a)P TEQ PAHTEQM 0.039 0.039 1.00E‐06 ‐ ‐ Yes PAHs Benzo(ghi)perylene 191242 0.087 ‐ ‐ 1,652 5.26E‐05 No PAHs Fluoranthene 206440 0.15 ‐ ‐ 2,203 6.76E‐05 No PAHs Fluorene 86737 0.078 ‐ ‐ 2,177 3.59E‐05 No PAHs Naphthalene 91203 0.076 15 5.24E‐09 681 1.12E‐04 No PAHs Phenanthrene 85018 0.13 ‐ ‐ 16,437 7.61E‐06 No PAHs Pyrene 129000 0.15 ‐ ‐ 1,652 9.22E‐05 No PCB Aroclor 1016 12674112 0.060 6.6 9.02E‐09 3.9 1.55E‐02 No PCB Aroclor 1221 11104282 N/A 0.23 ‐ 1.1 ‐ N/A PCB Aroclor 1232 11141165 N/A 0.23 ‐ 1.1 ‐ N/A PCB Aroclor 1242 53469219 0.058 0.23 2.51E‐07 1.1 5.29E‐02 No PCB Aroclor 1248 12672296 0.062 0.23 2.65E‐07 1.1 5.59E‐02 No PCB Aroclor 1254 11097691 0.082 0.23 3.51E‐07 1.1 7.40E‐02 No PCB Aroclor 1260 11096825 0.11 0.23 4.91E‐07 1.1 1.03E‐01 No PCB Aroclor 1262 37324235 N/A 0.23 ‐ 1.1 ‐ N/A PCB Aroclor 1268 11100144 N/A 0.23 ‐ 1.1 ‐ N/A Pesticides 4,4'‐DDE 72559 0.037 1.7 2.11E‐08 ‐ ‐ No Pesticides 4,4'‐DDT 50293 0.039 1.7 2.24E‐08 34 1.14E‐03 No Pesticides Chlordane 57749 0.0090 1.7 5.32E‐09 34 2.62E‐04 No Pesticides Dieldrin 60571 0.037 0.037 9.89E‐07 3.4 1.06E‐02 No
MGM14‐SSFL/Cleanup_Eval_Paper/Cleanup_Eval_Paper_Tables.xlsx ES060713081955MGM

TABLE 2‐4 Chemicals of Concern Summary for Average Soil (0 to 10 feet bgs) Concentrations ‐ Risk‐based Cleanup Scenario Comparative Analysis of the Background and Risk‐Based Cleanup Scenarios, SSFL, Ventura County, California
Chemical Class Analyte CAS #
Exposure Point
Concentrationb
(mg/kg)
Calculated based on RME Suburban Residential Soil RBSL a
Contaminant Concern
ofComposite Resident ‐6 )RBSL Cancer (10 (mg/kg)
Residential Cancer Risk Estimate
Child RBSL (HQ=1)
Noncancer (mg/kg)
Residential Hazard Index
SVOC Benzoic acid 65850 0.69 ‐ ‐ 244,417 2.81E‐06 No SVOC bis(2‐Ethylhexyl) phthalate 117817 0.17 173 1.00E‐09 1,222 1.42E‐04 No SVOC Butyl benzyl phthalate 85687 0.15 274 5.31E‐10 12,221 1.19E‐05 No SVOC Di‐n‐butyl phthalate 84742 0.32 ‐ ‐ 6,110 5.25E‐05 No SVOC Di‐n‐octyl phthalate 117840 0.14 ‐ ‐ 2,444 5.91E‐05 No SVOC N‐Nitrosodimethylamine 62759 0.17 0.033 5.25E‐06 0.49 3.49E‐01 Yes SVOC Pentachlorophenol 87865 0.89 21 4.18E‐08 230 3.86E‐03 No SVOC Phenol 108952 0.46 ‐ ‐ 18,330 2.51E‐05 No VOCs 2‐Hexanone 591786 0.014 ‐ ‐ 170 8.39E‐05 No VOCs Acetone 67641 0.37 ‐ ‐ 60,077 6.21E‐06 No VOCs cis‐1,2‐Dichloroethene 156592 0.041 ‐ ‐ 9.2 4.50E‐03 No
VOCs Ethylbenzene 100414 0.030 2.3 1.28E‐08 1,838 1.61E‐05 No VOCs Hexachlorobutadiene 87683 N/A 6.7 ‐ 61 ‐ N/A VOCs Methylene chloride 75092 0.12 3.0 4.15E‐08 457 2.70E‐04 No VOCs Tetrachloroethene 127184 0.031 0.42 7.41E‐08 52 5.93E‐04 No VOCs Toluene 108883 0.029 ‐ ‐ 513 5.67E‐05 No VOCs Trichloroethene 79016 0.29 0.80 3.67E‐07 3.0 9.79E‐02 No VOCs Vinyl chloride 75014 0.058 0.020 2.86E‐06 50 1.16E‐03 Yes
Total: Total without Arsenic:
3E‐03 1 3E‐03 1
Metals Lead 7439921 18 80 2.67E‐01 Notes: '‐' = None established/not applicable. B(a)P = Benzo(a)pyrene B(a)P TEQ = Benzo(a)pryene toxic equivalency for the 7 carcinogenic PAHs (Benzo(a)pyrene, Benzo(a)anthracene, Benzo(b)fluoranthene, Benzo(k)fluoranthene, Chrysene, Dibenz(a,h)anthracene, and Indeno(1,2,3‐cd)pyrene) DDE = Dichlorodiphenyldichloroetheylene DDT = Dichlorodiphenyldichloroetheylene HQ = Hazard quotient mg/kg = Milligrams per kilogram N/A = Chemicals was not detected or was not analyzed. PAH = Polycyclic aromatic hydrocarbon PCB = Polychlorinated biphenyl
PCDD/PCDF = Polychlorinated dibenzo‐p‐dioxins and polychlorinated dibenzofurans RBSL = Risk‐based screening level RME = Reasonable maximum exposure SVOC = Semivolatile organic compound TCDD = 2,3,7,8‐Tetrachlorodibenzo‐p‐dioxin VOCs = Volatile organic compound a MWH, 2012 (See Table 2‐1) b EPC based on average concentration for 0 to 10 feet below ground surface (bgs) soil at NASA sites using one‐half reporting limit for the non‐detects. c Chemical of concerns are based on chemicals with average soil concentrations greater than the RBSL.
MGM14‐SSFL/Cleanup_Eval_Paper/Cleanup_Eval_Paper_Tables.xlsx ES060713081955MGM

TABLE 2‐5 Risk Summary for Soil COCs ‐ Background Cleanup Scenario vs Risk‐based Cleanup Scenario Comparative Analysis of the Backgorund and Risk‐Based Cleanup Scenarios, SSFL, Ventura County, California
Comparative Anal
Chemical Class
ysis of the Background
Analyte
and Risk‐Based Cleanup Scenario
CAS #
Assumed Exposure Point Concentration Risk for COCs
Look‐up Table
Valuesa
Risk‐based Screening Levelb Cancer Risk Estimate Non‐cancer HQ Estimate
Cancer Effects RBSL
Non‐Cancer Effects RBSL
Background Cleanup
Scenario c,d
Risk‐based Cleanup
Scenario c,e
Ratio of Risk‐based Cleanup Scenario to Background
Cleanup Scenario
Background Cleanup
Scenario c,d
Risk‐based Cleanup
Scenario c,e
Ratio of Risk‐based Cleanup Scenario to Background
Cleanup Scenario Dioxins 2,3,7,8‐TCDD TEQ DIOXTEQM 0.0000 4.8E‐06 5.1E‐05 2E‐07 1.E‐06 5.3 1.8E‐02 1 55 Metals Arsenic 7440382 46.0000 0.066 22 7E‐04 1.E‐06 0.0014 2.1E+00 1 0.47 PAHs B(a)P TEQ PAHTEQM 0.0045 0.039 ‐ 1E‐07 1.E‐06 8.7 ‐ ‐ ‐SVOC N‐Nitrosodimethylamine 62759 0.0100 0.033 0.49 3E‐07 1.E‐06 3.3 2.0E‐02 1 49 VOCs Vinyl chloride 75014 0.0050 0.020 50 2E‐07 1.E‐06 4.1 9.9E‐05 1 10,091
Total without Total:
Arsenic: 7E‐04 9E‐07
5E‐06 4E‐06
0.007 5
2 0.04
4 3
1.8 78
Notes: B(a)P = Benzo(a)pyrene DDT = Dichlorodiphenyldichloroetheylene B(a)P TEQ = Benzo(a)pyrene toxic equivalency for the 7 carcinogenic PAH = Polycyclic aromatic hydrocarbon PAHs (Benzo(a)pyrene, Benzo(a)anthracene, Benzo(b)fluoranthene, PCB = Polychlorinated biphenyl Benzo(k)fluoranthene, Chrysene, Dibenz(a,h)anthracene, and RBSL = Risk‐based screening level Indeno(1,2,3‐cd)pyrene) SVOC = Semivolatile organic compound COC = Contaminant of concern TCDD = 2,3,7,8‐Tetrachlorodibenzo‐p‐dioxin DDE = Dichlorodiphenyldichloroetheylene VOCs = Volatile organic compound "‐‐ : Not a COPC. Exposure point concentration is less than the RBSL. a Look‐up Table values subject to change. DTSC, 2013 (See Table 1‐1).
b MWH, 2012 (See Table 2‐1) c COCs identified based on average soil (0 to 10 feet bgs) concentration (detect) exceeding the RBSL. d Cancer risk estimate calculated using the LUTV as the exposure point concentration and the cancer‐effects RBSL. Non‐cancer hazard estimate calculated using the LUTV as the exposure point concentration and the non‐cancer‐effects RBSL e Cancer risk estimate calculated using the RBSL as the exposure point concentration and the cancer‐effects RBSL. Non‐cancer hazard estimate calculated using the RBSL as the exposure point concentration and the non‐cancer‐effects RBSL
MGM14‐SSFL/Cleanup_Eval_Paper/Cleanup_Eval_Paper_Tables.xlsx ES060713081955MGM

TABLE 3‐1 Ecological Risk‐based Screening Levels Comparative Analysis of the Background and Risk‐Based Cleanup Scenarios, SSFL, Ventura County, California
Chemical Class
Analyte Ecological RBSLs (mg/kg)a
No Effect Level Low Effect Level VOCs Acetone 46 230 VOCs cis‐1,2‐Dichloroethene 210 220 VOCs Ethylbenzene 79 240 VOCs Hexachlorobutadiene 0.02 0.11 VOCs 2‐Hexanone 23 170 VOCs Methylene chloride 27 230 VOCs Tetrachloroethene 2 11 VOCs Toluene 59 590 VOCs Trichloroethene 1.8 18 VOCs Vinyl chloride 0.8 8 PAHs 1‐Methyl naphthalene 52 260 PAHs 2‐Methylnaphthalene 53 260 PAHs Acenaphthene 3 31 PAHs Acenaphthylene 0.3 3.3 PAHs Anthracene 2.8 28 PAHs Benzo(a)pyrene 3.1 190 PAHs Benzo(ghi)perylene 4.1 220 PAHs Fluoranthene 54 880 PAHs Fluorene 1.9 19 PAHs Naphthalene 26 130 PAHs Phenanthrene 1.3 13 PAHs Pyrene 1.2 73 SVOC bis(2‐Ethylhexyl) phthalate 0.3 65 SVOC Di‐n‐butyl phthalate 0.1 1.1 SVOC Di‐n‐octyl phthalate 13 130 SVOC Benzoic acid 4.5 45 SVOC Butyl benzyl phthalate 90 260 SVOC Pentachlorophenol 2.8 10 SVOC Phenol 5.1 51 SVOC N‐Nitrosodimethylamine 6.5 79 Formaldehyde Formaldehyde 43,000 380,000 PCB Aroclor 1016 0.12 1.2 PCB Aroclor 1221 0.18 1.8 PCB Aroclor 1232 0.082 0.82 PCB Aroclor 1242 0.043 0.43 PCB Aroclor 1248 0.0064 0.064 PCB Aroclor 1254 0.039 0.39 PCB Aroclor 1260 0.025 0.25 PCB Aroclor 1262 ‐‐ ‐‐
PCB Aroclor 1268 ‐‐ ‐‐
Metals Antimony 0.042 2 Metals Arsenic 2.1 31 Metals Cadmium 0.019 0.81 Metals Chromium VI 7.3 30 Metals Copper 1.1 24 Metals Lead 0.018 39 Metals Mercury 0.87 1.7 Metals Silver 0.99 29
MGM14‐SSFL/Cleanup_Eval_Paper/Cleanup_Eval_Paper_Tables.xlsx ES060713081955MGM

TABLE 3‐1 Ecological Risk‐based Screening Levels Comparative Analysis of the Background and Risk‐Based Cleanup Scenarios, SSFL, Ventura County, California
Chemical Class
Analyte Ecological RBSLs (mg/kg)a
No Effect Level Low Effect Level Metals Zinc 19 320 Cyanide Cyanide 0.18 1.8 Inorganic Perchlorate 0.5 7.7 Pesticides 4,4'‐DDE 0.0041 0.28 Pesticides 4,4'‐DDT 0.0035 0.58 Pesticides Chlordane 1.1 5.6 Pesticides Dieldrin 0.013 0.58 Herbicides Dichloroprop 0.79 3.9 Herbicides MCPA 0.12 0.61 Herbicides MCPP 2.5 7.4 Dioxins 2,3,7,8‐TCDD TEQ 0.0000005 0.000005 Notes: DDE = Dichlorodiphenyldichloroetheylene DDT = Dichlorodiphenyldichloroetheylene PAH = Polycyclic aromatic hydrocarbon PCB = Polychlorinated biphenyl SVOC = Semivolatile organic compound RBSL = Risk‐based screening level VOCs = Volatile organic compound a: MWH Americas, Inc. (MWH). 2011. Ecological Risk‐Based Screening Levels for Use in Ecological Risk Assessments at the Santa Susana Field Laboratory, Ventura County, California.
MGM14‐SSFL/Cleanup_Eval_Paper/Cleanup_Eval_Paper_Tables.xlsx ES060713081955MGM
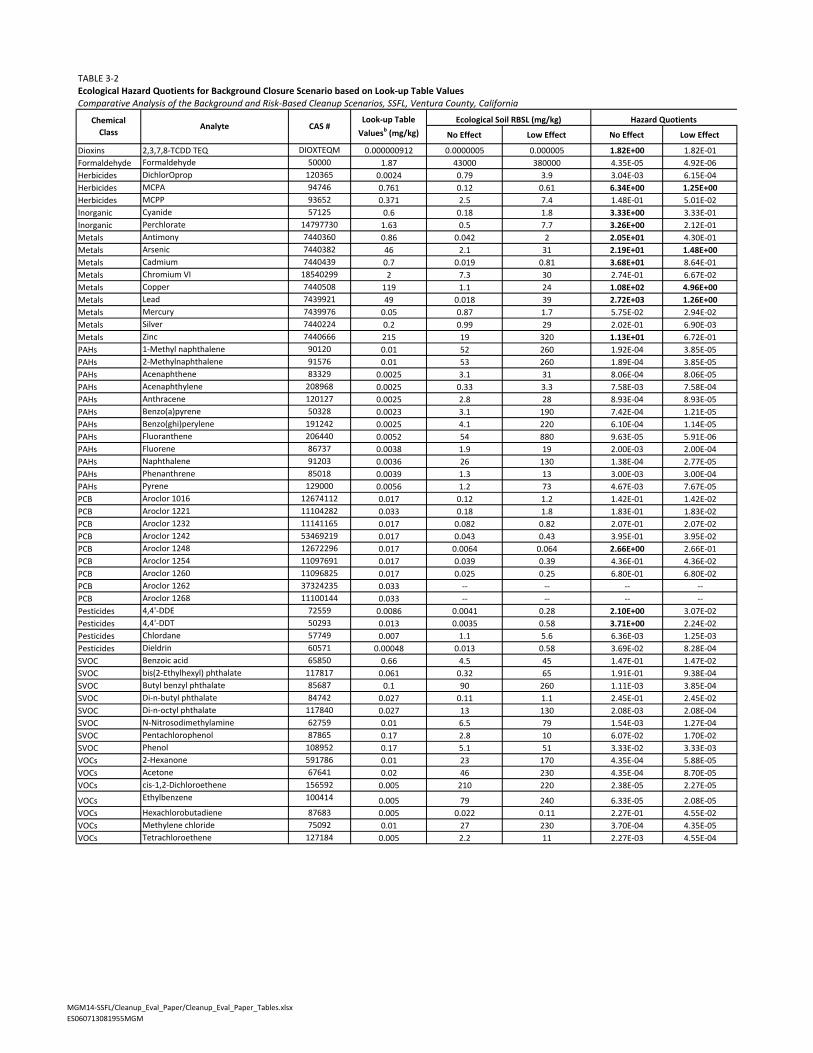
TABLE 3‐2 Ecological Hazard Quotients for Background Closure Scenario based on Look‐up Table Values Comparative Analysis of the Background and Risk‐Based Cleanup Scenarios, SSFL, Ventura County, California
Chemical Class
Analyte CAS # Look‐up Table
Valuesb (mg/kg)
Ecological Soil RBSL (mg/kg) Hazard Quotients
No Effect Low Effect No Effect Low Effect
Dioxins 2,3,7,8‐TCDD TEQ DIOXTEQM 0.000000912 0.0000005 0.000005 1.82E+00 1.82E‐01 Formaldehyde Formaldehyde 50000 1.87 43000 380000 4.35E‐05 4.92E‐06 Herbicides DichlorOprop 120365 0.0024 0.79 3.9 3.04E‐03 6.15E‐04 Herbicides MCPA 94746 0.761 0.12 0.61 6.34E+00 1.25E+00 Herbicides MCPP 93652 0.371 2.5 7.4 1.48E‐01 5.01E‐02 Inorganic Cyanide 57125 0.6 0.18 1.8 3.33E+00 3.33E‐01 Inorganic Perchlorate 14797730 1.63 0.5 7.7 3.26E+00 2.12E‐01 Metals Antimony 7440360 0.86 0.042 2 2.05E+01 4.30E‐01 Metals Arsenic 7440382 46 2.1 31 2.19E+01 1.48E+00 Metals Cadmium 7440439 0.7 0.019 0.81 3.68E+01 8.64E‐01 Metals Chromium VI 18540299 2 7.3 30 2.74E‐01 6.67E‐02 Metals Copper 7440508 119 1.1 24 1.08E+02 4.96E+00 Metals Lead 7439921 49 0.018 39 2.72E+03 1.26E+00 Metals Mercury 7439976 0.05 0.87 1.7 5.75E‐02 2.94E‐02 Metals Silver 7440224 0.2 0.99 29 2.02E‐01 6.90E‐03 Metals Zinc 7440666 215 19 320 1.13E+01 6.72E‐01 PAHs 1‐Methyl naphthalene 90120 0.01 52 260 1.92E‐04 3.85E‐05 PAHs 2‐Methylnaphthalene 91576 0.01 53 260 1.89E‐04 3.85E‐05 PAHs Acenaphthene 83329 0.0025 3.1 31 8.06E‐04 8.06E‐05 PAHs Acenaphthylene 208968 0.0025 0.33 3.3 7.58E‐03 7.58E‐04 PAHs Anthracene 120127 0.0025 2.8 28 8.93E‐04 8.93E‐05 PAHs Benzo(a)pyrene 50328 0.0023 3.1 190 7.42E‐04 1.21E‐05 PAHs Benzo(ghi)perylene 191242 0.0025 4.1 220 6.10E‐04 1.14E‐05 PAHs Fluoranthene 206440 0.0052 54 880 9.63E‐05 5.91E‐06 PAHs Fluorene 86737 0.0038 1.9 19 2.00E‐03 2.00E‐04 PAHs Naphthalene 91203 0.0036 26 130 1.38E‐04 2.77E‐05 PAHs Phenanthrene 85018 0.0039 1.3 13 3.00E‐03 3.00E‐04 PAHs Pyrene 129000 0.0056 1.2 73 4.67E‐03 7.67E‐05 PCB Aroclor 1016 12674112 0.017 0.12 1.2 1.42E‐01 1.42E‐02 PCB Aroclor 1221 11104282 0.033 0.18 1.8 1.83E‐01 1.83E‐02 PCB Aroclor 1232 11141165 0.017 0.082 0.82 2.07E‐01 2.07E‐02 PCB Aroclor 1242 53469219 0.017 0.043 0.43 3.95E‐01 3.95E‐02 PCB Aroclor 1248 12672296 0.017 0.0064 0.064 2.66E+00 2.66E‐01 PCB Aroclor 1254 11097691 0.017 0.039 0.39 4.36E‐01 4.36E‐02 PCB Aroclor 1260 11096825 0.017 0.025 0.25 6.80E‐01 6.80E‐02 PCB Aroclor 1262 37324235 0.033 ‐‐ ‐‐ ‐‐ ‐‐
PCB Aroclor 1268 11100144 0.033 ‐‐ ‐‐ ‐‐ ‐‐
Pesticides 4,4'‐DDE 72559 0.0086 0.0041 0.28 2.10E+00 3.07E‐02 Pesticides 4,4'‐DDT 50293 0.013 0.0035 0.58 3.71E+00 2.24E‐02 Pesticides Chlordane 57749 0.007 1.1 5.6 6.36E‐03 1.25E‐03 Pesticides Dieldrin 60571 0.00048 0.013 0.58 3.69E‐02 8.28E‐04 SVOC Benzoic acid 65850 0.66 4.5 45 1.47E‐01 1.47E‐02 SVOC bis(2‐Ethylhexyl) phthalate 117817 0.061 0.32 65 1.91E‐01 9.38E‐04 SVOC Butyl benzyl phthalate 85687 0.1 90 260 1.11E‐03 3.85E‐04 SVOC Di‐n‐butyl phthalate 84742 0.027 0.11 1.1 2.45E‐01 2.45E‐02 SVOC Di‐n‐octyl phthalate 117840 0.027 13 130 2.08E‐03 2.08E‐04 SVOC N‐Nitrosodimethylamine 62759 0.01 6.5 79 1.54E‐03 1.27E‐04 SVOC Pentachlorophenol 87865 0.17 2.8 10 6.07E‐02 1.70E‐02 SVOC Phenol 108952 0.17 5.1 51 3.33E‐02 3.33E‐03 VOCs 2‐Hexanone 591786 0.01 23 170 4.35E‐04 5.88E‐05 VOCs Acetone 67641 0.02 46 230 4.35E‐04 8.70E‐05 VOCs cis‐1,2‐Dichloroethene 156592 0.005 210 220 2.38E‐05 2.27E‐05
VOCs Ethylbenzene 100414 0.005 79 240 6.33E‐05 2.08E‐05 VOCs Hexachlorobutadiene 87683 0.005 0.022 0.11 2.27E‐01 4.55E‐02 VOCs Methylene chloride 75092 0.01 27 230 3.70E‐04 4.35E‐05 VOCs Tetrachloroethene 127184 0.005 2.2 11 2.27E‐03 4.55E‐04
MGM14‐SSFL/Cleanup_Eval_Paper/Cleanup_Eval_Paper_Tables.xlsx ES060713081955MGM

TABLE 3‐2 Ecological Hazard Quotients for Background Closure Scenario based on Look‐up Table Values Comparative Analysis of the Background and Risk‐Based Cleanup Scenarios, SSFL, Ventura County, California
Chemical Class
Analyte CAS # Look‐up Table
Valuesb (mg/kg)
Ecological Soil RBSL (mg/kg) Hazard Quotients
No Effect Low Effect No Effect Low Effect
VOCs Toluene 108883 0.005 59 590 8.47E‐05 8.47E‐06 VOCs Trichloroethene 79016 0.005 1.8 18 2.78E‐03 2.78E‐04 VOCs Vinyl chloride 75014 0.005 0.78 7.8 6.41E‐03 6.41E‐04 Notes: ‐" = None established/not applicable. DDE = Dichlorodiphenyldichloroetheylene DDT = Dichlorodiphenyldichloroetheylene HQ = Hazard quotient mg/kg = Milligrams per kilogram PAH = Polycyclic aromatic hydrocarbon PCB = Polychlorinated biphenyl PCDD/PCDF = Polychlorinated dibenzo‐p‐dioxins and polychlorinated dibenzofurans RBSL = Risk‐based Screening level RME = Reasonable maximum exposure TCDD = 2,3,7,8‐Tetrachlorodibenzo‐p‐dioxin TEQ = Toxic equivalency a MWH, 2012 (See Table 1‐1) b Look‐up Table values subject to change (See Table 1‐1)
MGM14‐SSFL/Cleanup_Eval_Paper/Cleanup_Eval_Paper_Tables.xlsx ES060713081955MGM

This page intentionally left blank.

TABLE 3‐3 Comparison of the Ecological Protectiveness of the Risk‐based Cleanup Levels to the Background Cleanup Levels Comparative Analysis of the Background and Risk‐Based Cleanup Scenarios, SSFL, Ventura County, California
Chemical Class Analyte CAS #
Ecological RBSL (mg/kg)a
Lookup Table
Value (LUTV)b
(mg/kg)
Ratio of Cleanup Levels (RBSL/LUTV)
Ecological Risk‐Management Summary
No Effect Low Effect No Effect Low Effect No Effect Low Effect Inorganic Cyanide 57125 0.18 1.8 0.6 0.30 3.0 LUTV is 3.3 times less conservative than the No Effect RBSL LUTV is 3 times more conservative than the Low Effect RBSL Inorganic Perchlorate 14797730 0.5 7.7 1.63 0.3 5 LUTV is 3.3 times less conservative than the No Effect RBSL LUTV is 4.7 times more conservative than the Low Effect RBSL Formaldehyde Formaldehyde 50000 43000 380000 1.87 22995 203209 LUTV is 23000 times more conservative than the No Effect RBSL LUTV is 200000 times more conservative than the Low Effect RBSL Herbicides MCPA 94746 0.12 0.61 0.761 0.16 0.80 LUTV is 6.3 times less conservative than the No Effect RBSL LUTV is 1.2 times less conservative than the Low Effect RBSL Herbicides MCPP 93652 2.5 7.4 0.371 6.74 20 LUTV is 6.7 times more conservative than the No Effect RBSL LUTV is 20 times more conservative than the Low Effect RBSL Herbicides Dichloroprop 120365 0.79 3.9 0.0024 329 1625 LUTV is 330 times more conservative than the No Effect RBSL LUTV is 1600 times more conservative than the Low Effect RBSL Metals Arsenic 7440382 2.1 31 46 0.05 0.67 LUTV is 22 times less conservative than the No Effect RBSL LUTV is 1.5 times less conservative than the Low Effect RBSL Metals Chromium VI 18540299 7.3 30 2 3.65 15 LUTV is 3.7 times more conservative than the No Effect RBSL LUTV is 15 times more conservative than the Low Effect RBSL Metals Lead 7439921 0.018 39 49 0.00 0.80 LUTV is 2700 times less conservative than the No Effect RBSL LUTV is 1.3 times less conservative than the Low Effect RBSL Metals Copper 7440508 1.1 24 119 0.01 0.20 LUTV is 110 times less conservative than the No Effect RBSL LUTV is 5 times less conservative than the Low Effect RBSL Metals Antimony 7440360 0.042 2 0.86 0.05 2.33 LUTV is 20 times less conservative than the No Effect RBSL LUTV is 2.3 times more conservative than the Low Effect RBSL Metals Cadmium 7440439 0.019 0.81 0.7 0.03 1.16 LUTV is 37 times less conservative than the No Effect RBSL LUTV is 1.2 times more conservative than the Low Effect RBSL Metals Zinc 7440666 19 320 215 0.09 1.49 LUTV is 11 times less conservative than the No Effect RBSL LUTV is 1.5 times more conservative than the Low Effect RBSL Metals Mercury 7439976 0.87 1.7 0.05 17.40 34 LUTV is 17 times more conservative than the No Effect RBSL LUTV is 34 times more conservative than the Low Effect RBSL Metals Silver 7440224 0.99 29 0.2 4.95 145 LUTV is 5 times more conservative than the No Effect RBSL LUTV is 150 times more conservative than the Low Effect RBSL PAHs 1‐Methyl naphthalene 90120 52 260 0.01 5200.00 26000 LUTV is 5200 times more conservative than the No Effect RBSL LUTV is 26000 times more conservative than the Low Effect RBSL PAHs Naphthalene 91203 26 130 0.0036 7222 36111 LUTV is 7200 times more conservative than the No Effect RBSL LUTV is 36000 times more conservative than the Low Effect RBSL PAHs 2‐Methylnaphthalene 91576 53 260 0.01 5300 26000 LUTV is 5300 times more conservative than the No Effect RBSL LUTV is 26000 times more conservative than the Low Effect RBSL PAHs Pyrene 129000 1.2 73 0.0056 214 13036 LUTV is 210 times more conservative than the No Effect RBSL LUTV is 13000 times more conservative than the Low Effect RBSL PAHs Fluoranthene 206440 54 880 0.0052 10385 169231 LUTV is 10000 times more conservative than the No Effect RBSL LUTV is 170000 times more conservative than the Low Effect RBSL PAHs Fluorene 86737 1.9 19 0.0038 500 5000 LUTV is 500 times more conservative than the No Effect RBSL LUTV is 5000 times more conservative than the Low Effect RBSL PAHs Benzo(a)pyrene 50328 3.1 190 0.0023 1348 82609 LUTV is 1300 times more conservative than the No Effect RBSL PAHs Benzo(ghi)perylene 191242 4.1 220 0.0025 1640 88000 LUTV is 1600 times more conservative than the No Effect RBSL LUTV is 88000 times more conservative than the Low Effect RBSL PAHs Acenaphthylene 208968 0.33 3.3 0.0025 132 1320 LUTV is 130 times more conservative than the No Effect RBSL LUTV is 1300 times more conservative than the Low Effect RBSL PAHs Acenaphthene 83329 3.1 31 0.0025 1240 12400 LUTV is 1200 times more conservative than the No Effect RBSL LUTV is 12000 times more conservative than the Low Effect RBSL PAHs Phenanthrene 85018 1.3 13 0.0039 333 3333 LUTV is 330 times more conservative than the No Effect RBSL LUTV is 3300 times more conservative than the Low Effect RBSL PAHs Anthracene 120127 2.8 28 0.0025 1120 11200 LUTV is 1100 times more conservative than the No Effect RBSL LUTV is 11000 times more conservative than the Low Effect RBSL PCB Aroclor 1262 37324235 ‐‐ ‐‐ 0.033 ‐‐ ‐‐ No RBSLs No RBSLs PCB Aroclor 1268 11100144 ‐‐ ‐‐ 0.033 ‐‐ ‐‐ No RBSLs No RBSLs PCB Aroclor 1221 11104282 0.18 1.8 0.033 5.45 55 LUTV is 5.5 times more conservative than the No Effect RBSL LUTV is 55 times more conservative than the Low Effect RBSL PCB Aroclor 1232 11141165 0.082 0.82 0.017 4.82 48 LUTV is 4.8 times more conservative than the No Effect RBSL LUTV is 48 times more conservative than the Low Effect RBSL PCB Aroclor 1242 53469219 0.043 0.43 0.017 2.53 25 LUTV is 2.5 times more conservative than the No Effect RBSL LUTV is 25 times more conservative than the Low Effect RBSL PCB Aroclor 1248 12672296 0.0064 0.064 0.017 0.38 3.76 LUTV is 2.7 times less conservative than the No Effect RBSL LUTV is 3.8 times more conservative than the Low Effect RBSL PCB Aroclor 1254 11097691 0.039 0.39 0.017 2.29 23 LUTV is 2.3 times more conservative than the No Effect RBSL LUTV is 23 times more conservative than the Low Effect RBSL PCB Aroclor 1260 11096825 0.025 0.25 0.017 1.47 15 LUTV is 1.5 times more conservative than the No Effect RBSL LUTV is 15 times more conservative than the Low Effect RBSL PCB Aroclor 1016 12674112 0.12 1.2 0.017 7.06 71 LUTV is 7.1 times more conservative than the No Effect RBSL LUTV is 71 times more conservative than the Low Effect RBSL Pesticides Dieldrin 60571 0.013 0.58 0.00048 27.08 1208 LUTV is 27 times more conservative than the No Effect RBSL LUTV is 1200 times more conservative than the Low Effect RBSL Pesticides 4,4'‐DDT 50293 0.0035 0.58 0.013 0.27 45 LUTV is 3.7 times less conservative than the No Effect RBSL LUTV is 45 times more conservative than the Low Effect RBSL Pesticides 4,4'‐DDE 72559 0.0041 0.28 0.0086 0.48 33 LUTV is 2.1 times less conservative than the No Effect RBSL LUTV is 33 times more conservative than the Low Effect RBSL Pesticides Chlordane 57749 1.1 5.6 0.007 157.14 800 LUTV is 160 times more conservative than the No Effect RBSL LUTV is 800 times more conservative than the Low Effect RBSL SVOC N‐Nitrosodimethylamine 62759 6.5 79 0.01 650.00 7900 LUTV is 650 times more conservative than the No Effect RBSL LUTV is 7900 times more conservative than the Low Effect RBSL SVOC Pentachlorophenol 87865 2.8 10 0.17 16.47 59 LUTV is 16 times more conservative than the No Effect RBSL LUTV is 59 times more conservative than the Low Effect RBSL SVOC Butyl benzyl phthalate 85687 90 260 0.1 900 2600 LUTV is 900 times more conservative than the No Effect RBSL LUTV is 2600 times more conservative than the Low Effect RBSL SVOC bis(2‐Ethylhexyl) phthalate 117817 0.32 65 0.061 5.25 1066 LUTV is 5.2 times more conservative than the No Effect RBSL LUTV is 1100 times more conservative than the Low Effect RBSL SVOC Di‐n‐octyl phthalate 117840 13 130 0.027 481.5 4815 LUTV is 480 times more conservative than the No Effect RBSL LUTV is 4800 times more conservative than the Low Effect RBSL SVOC Phenol 108952 5.1 51 0.17 30.0 300 LUTV is 30 times more conservative than the No Effect RBSL LUTV is 300 times more conservative than the Low Effect RBSL SVOC Di‐n‐butyl phthalate 84742 0.11 1.1 0.027 4.07 41 LUTV is 4.1 times more conservative than the No Effect RBSL LUTV is 41 times more conservative than the Low Effect RBSL SVOC Benzoic acid 65850 4.5 45 0.66 6.82 68 LUTV is 6.8 times more conservative than the No Effect RBSL LUTV is 68 times more conservative than the Low Effect RBSL VOCs Vinyl chloride 75014 0.78 7.8 0.005 156.00 1560 LUTV is 160 times more conservative than the No Effect RBSL LUTV is 1600 times more conservative than the Low Effect RBSL VOCs Tetrachloroethene 127184 2.2 11 0.005 440.00 2200 LUTV is 440 times more conservative than the No Effect RBSL LUTV is 2200 times more conservative than the Low Effect RBSL VOCs Trichloroethene 79016 1.8 18 0.005 360.00 3600 LUTV is 360 times more conservative than the No Effect RBSL LUTV is 3600 times more conservative than the Low Effect RBSL VOCs Methylene chloride 75092 27 230 0.01 2700.00 23000 LUTV is 2700 times more conservative than the No Effect RBSL LUTV is 23000 times more conservative than the Low Effect RBSL
MGM14‐SSFL/Cleanup_Eval_Paper/Cleanup_Eval_Paper_Tables.xlsx ES060713081955MGM

TABLE 3‐3 Comparison of the Ecological Protectiveness of the Risk‐based Cleanup Levels to the Background Cleanup Levels Comparative Analysis of the Background and Risk‐Based Cleanup Scenarios, SSFL, Ventura County, California
Chemical Class Analyte CAS #
Ecological RBSL (mg/kg)a
Lookup Table
Value (LUTV)b
(mg/kg)
Ratio of Cleanup Levels (RBSL/LUTV)
Ecological Risk‐Management Summary
No Effect Low Effect No Effect Low Effect No Effect Low Effect VOCs Ethylbenzene 100414 79 240 0.005 15800.00 48000 LUTV is 16000 times more conservative than the No Effect RBSL LUTV is 48000 times more conservative than the Low Effect RBSL VOCs Hexachlorobutadiene 87683 0.022 0.11 0.005 4.40 22 LUTV is 4.4 times more conservative than the No Effect RBSL LUTV is 22 times more conservative than the Low Effect RBSL VOCs cis‐1,2‐Dichloroethene 156592 210 220 0.005 42000.00 44000 LUTV is 42000 times more conservative than the No Effect RBSL LUTV is 44000 times more conservative than the Low Effect RBSL VOCs 2‐Hexanone 591786 23 170 0.01 2300 17000 LUTV is 2300 times more conservative than the No Effect RBSL LUTV is 17000 times more conservative than the Low Effect RBSL VOCs Toluene 108883 59 590 0.005 11800 118000 LUTV is 12000 times more conservative than the No Effect RBSL LUTV is 120000 times more conservative than the Low Effect RBSL VOCs Acetone 67641 46 230 0.02 2300 11500 LUTV is 2300 times more conservative than the No Effect RBSL LUTV is 12000 times more conservative than the Low Effect RBSL Dioxins 2,3,7,8‐TCDD TEQ DIOXTEQM 0.0000005 0.000005 0.000000912 0.55 5 LUTV is 1.8 times less conservative than the No Effect RBSL LUTV is 5.5 times more conservative than the Low Effect RBSL Notes: ‐' = None established/not applicable. DDE = Dichlorodiphenyldichloroetheylene DDT = Dichlorodiphenyldichloroetheylene EPC = Exposure point concentration HQ = Hazard quotient mg/kg = Milligrams per kilogram PAH = Polycyclic aromatic hydrocarbon PCB = Polychlorinated biphenyl PCDD/PCDF = Polychlorinated dibenzo‐p‐dioxins and polychlorinated dibenzofurans Ratio = Lowest RBSL divided by the EPC RBSL = Risk‐based screening level RME = Reasonable maximum exposure TCDD: 2,3,7,8‐Tetrachlorodibenzo‐p‐dioxin TEQ = Toxic equivalency a : MWH, 2011 (See Table 3‐1) b Look‐up Table values subject to change (See Table 1‐1)
MGM14‐SSFL/Cleanup_Eval_Paper/Cleanup_Eval_Paper_Tables.xlsx ES060713081955MGM

TABLE 3‐4 Ecological Risk Evaluation and Chemical of Ecological Concern Identification for Soils from 0‐ 6 feet bgs ‐ Risk‐Based Cleanup Scenario Comparative Analysis of the Backgorund and Risk‐Based Cleanup Scenarios, SSFL, Ventura County, California
Analyte Detects Sample Number FOD
Summary Statistics (mg/kg) Background
Valuec
RBSLs (mg/kg) Maximum‐Based HQ Average‐Based HQ
COEC? Rationale Maximum of
Detects Average b No Effect Level Low Effect Level No Effect Low Effect No Effect Low Effect
1‐Methyl naphthalene 11 397 2.8% 0.019 0.017 ‐‐ 52 260 0.0004 0.0001 3.3E‐04 6.5E‐05 No HQs less than one, FOD less than 5 percent
2‐Hexanonea 0 448 0.0% ‐‐ ‐‐ ‐‐ 23 170 ‐‐ ‐‐ ‐‐ ‐‐ No Not detected
2‐Methylnaphthalene 19 449 4.2% 27.4 0.13 ‐‐ 53 260 0.52 0.11 0.002 5.0E‐04 No HQs less than one, FOD less than 5 percent
4,4'‐DDE 3 36 8.3% 0.0037 0.038 0.00647 0.0041 0.28 0.90 0.01 9.3 0.14 No HQs less than one, consistent with background value
4,4'‐DDT 3 36 8.3% 0.0037 0.038 0.009655 0.0035 0.58 1.06 0.01 11 0.07 No Consistent with background value, low effect HQs less than one
Acenaphthene 25 464 5.4% 2.24 0.039 0.0018 3.1 31 0.72 0.07 0.01 0.001 No HQs less than one
Acenaphthylene 19 463 4.1% 0.338 0.033 ‐‐ 0.33 3.3 1.02 0.10 0.10 0.010 No Low mangitude of exceedance; low effect HQ less than one, FOD less than 5 percent
Acetone 88 508 17.3% 3.4 0.72 ‐‐ 46 230 0.07 0.01 0.02 0.003 No HQs less than one
Anthracene 34 464 7.3% 1.46 0.036 ‐‐ 2.8 28 0.52 0.05 0.01 0.001 No HQs less than one
Antimony 144 347 41.5% 25.3 1.3 0.738 0.042 2 602 12.7 31 0.65 Yes 65% of detections exceed background and 23% exceed the low effect level
Aroclor 1254 34 190 17.9% 8.09 0.078 ‐‐ 0.039 0.39 207 20.7 2.0 0.20 Yes Cumulative risk (sum of PCB HQs) greater than one based on low effect HQ
Aroclor 1260 21 190 11.1% 49 0.28 ‐‐ 0.025 0.25 1960 196 11 1.1 Yes Average greater than low effect value Total Aroclor Risk ‐‐ 190 ‐‐ ‐‐ ‐‐ ‐‐ ‐‐ ‐‐
2167 217 13 1.3
Yes Because cumulative hazard index exceeds one, both aroclors are identified as COECs.
Arsenic 345 359 96.1% 33.5 5.0 39.7 2.1 31 16 1.08 2.4 0.16 No Consistent with background
Benzo(a)pyrene 59 464 12.7% 1.7 0.040 ‐‐ 3.1 190 0.5 0.01 0.01 2.1E‐04 No HQs less than one
Benzo(ghi)perylene 60 464 12.9% 1.8 0.039 0.001507 4.1 220 0.44 0.01 0.010 1.8E‐04 No HQs less than one
Benzoic acid 9 141 6.4% 0.708 0.41 ‐‐ 4.5 45 0.16 0.02 0.09 0.009 No HQs less than one
Bis(2‐ethylhexyl) phthalate 56 425 13.2% 19 0.12 0.0398 0.32 65 59.4 0.29 0.38 0.002 No Low effect HQs less than one
Butyl benzyl phthalate 20 399 5.0% 0.0977 0.078 0.0667 90 260 0.0011 0.0004 8.7E‐04 3.0E‐04 No HQs less than one
Cadmium 320 363 88.2% 244 0.95 0.579 0.019 0.81 12842 301 50 1.2 Yes 25/363 exceed background, average exceeds low effect level; potential for hot spots
Chlordane (Technical) 1 28 3.6% 0.0029 0.0035 ‐‐ 1.1 5.6 0.0026 0.0005 0.003 6.3E‐04 No HQs less than one, FOD less than 5 percent
Chromium VI 1 37 2.7% 1.06 0.64 ‐‐ 7.3 30 0.15 0.04 0.09 0.02 No HQs less than one, FOD less than 5 percent
cis‐1,2‐Dichloroethene 21 508 4.1% 0.51 0.076 ‐‐ 210 220 0.0024 0.0023 3.6E‐04 3.5E‐04 No HQs less than one, FOD less than 5 percent
Copper 365 368 99.2% 3500 40 102 1.1 24 3182 146 36 1.7 No Less than 3% exceed background value (9/368)
Dieldrin 4 36 11.1% 0.0041 0.037 0.000166 0.013 0.58 0.32 0.01 2.8 0.06 No HQs less than one
Di‐n‐butyl phthalate 35 425 8.2% 0.25 0.077 ‐‐ 0.11 1.1 2.27 0.23 0.70 0.07 No Low mangitude of exceedance; low effect HQs less than one
Di‐n‐octyl phthalate 5 399 1.3% 0.0443 0.078 ‐‐ 13 130 0.0034 0.0003 0.006 6.0E‐04 No HQs less than one, FOD less than 5 percent
2,3,7,8‐TCDD TEQ 134 148 90.5% 0.000075 0.0000027 3.58E‐08 0.0000005 0.000005 150 15.0 5.4 0.54 Yes Over 10% exceed low effect level; potential for hot spots
Ethylbenzene 10 547 1.8% 1.2 0.069 ‐‐ 79 240 0.02 0.01 8.7E‐04 2.9E‐04 No HQs less than one, FOD less than 5 percent
Fluoranthene 70 464 15.1% 1.9 0.042 0.003455 54 880 0.04 0.002 7.8E‐04 4.8E‐05 No HQs less than one
Fluorene 19 464 4.1% 2.22 0.040 ‐‐ 1.9 19 1.17 0.12 0.02 0.002 No Low mangitude of exceedance; low effect HQs less than one, FOD less than 5 percent
Formaldehyde 19 49 38.8% 28000 4410 ‐‐ 43000 380000 0.65 0.07 0.10 0.01 No HQs less than one
Hexachlorobutadienea 0 465 0.0% ‐‐ ‐‐ ‐‐ 0.02 0.11 ‐‐ ‐‐ ‐‐ ‐‐ No Not detected
Lead 369 372 99.2% 1360 15 42.15 0.018 39 75556 34.9 833 0.38 No Less than 2% of concentrations exceed background (6/372)
Mercury 297 388 76.5% 20.1 0.081 0.0411 0.87 1.7 23.10 11.8 0.09 0.05 No Only 1 of 388 samples exceed low effect level; average concentration less than no effect level.
Methylene chloride 54 511 10.6% 0.52 0.29 ‐‐ 27 230 0.02 0.002 0.01 0.001 No HQs less than one
Naphthalene 29 485 6.0% 3.96 0.049 ‐‐ 26 130 0.15 0.03 0.002 3.8E‐04 No HQs less than one
n‐Nitrosodimethylamine 10 369 2.7% 0.00098 0.00056 ‐‐ 6.5 79 0.00015 0.00001 8.6E‐05 7.1E‐06 No HQs less than one, FOD less than 5 percent
Pentachlorophenola
0 141 0.0% ‐‐ ‐‐ ‐‐ ‐‐ ‐‐ ‐‐ ‐‐ ‐‐ ‐‐ No Not detected
Perchloratea 0 2 0.0% ‐‐ ‐‐ ‐‐ ‐‐ ‐‐ ‐‐ ‐‐ ‐‐ ‐‐ No Not detected
Phenanthrene 66 464 14.2% 5.99 0.062 0.002635 1.3 13 4.61 0.46 0.05 0.005 No Low effect HQs less than one
Phenol 14 141 9.9% 5.36 0.37 ‐‐ 5.1 51 1.05 0.11 0.07 0.007 No Low mangitude of exceedance; low effect HQs less than one
Pyrene 88 464 19.0% 5.5 0.054 0.00376 1.2 73 4.58 0.08 0.05 7.4E‐04 No Low effect HQs less than one
Silver 205 372 55.1% 328 2.1 0.138 0.99 29 331 11.3 2.1 0.07 No Less than 1% exceed low effect level (3/372).
MGM14‐SSFL/Cleanup_Eval_Paper/Cleanup_Eval_Paper_Tables.xlsx ES060713081955MGM

TABLE 3‐4 Ecological Risk Evaluation and Chemical of Ecological Concern Identification for Soils from 0‐ 6 feet bgs ‐ Risk‐Based Cleanup Scenario Comparative Analysis of the Backgorund and Risk‐Based Cleanup Scenarios, SSFL, Ventura County, California
Analyte Detects Sample Number FOD
Summary Statistics (mg/kg) Background
Valuec
RBSLs (mg/kg) Maximum‐Based HQ Average‐Based HQ
COEC? Rationale Maximum of
Detects Average b No Effect Level Low Effect Level No Effect Low Effect No Effect Low Effect
Tetrachloroethene 8 518 1.5% 2.13 0.073 ‐‐ 2.2 11 0.97 0.19 0.03 0.007 No HQs less than one, FOD less than 5 percent
Toluene 25 547 4.6% 0.031 0.067 ‐‐ 59 590 0.00 0.00 0.001 1.1E‐04 No HQs less than one, FOD less than 5 percent
Trichloroethene 51 521 9.8% 140 0.57 ‐‐ 1.8 18 77.8 7.78 0.32 0.03 No Less than 0.6% exceed the low effect level (3/521); average concentration less than no effect level.
Vinyl chloride 2 518 0.4% 0.008 0.14 ‐‐ 0.78 7.8 0.01 0.001 0.18 0.02 No HQs less than one, FOD less than 5 percent
Zinc 356 360 98.9% 5050 78 185 19 320 266 15.8 4.1 0.24 No Less than 2% exceed background value (6/360). Notes: DDE = Dichlorodiphenyldichloroetheylene DDT = Dichlorodiphenyldichloroetheylene COEC = Chemical of ecological concern FOD = Frequency of detection HQ = Hazard quotient mg/kg = Milligram per kilogram µg/kg = Micrograms per kilogram TCDD = 2,3,7,8‐Tetrachlorodibenzo‐p‐dioxin TEQ = Toxic equivalency Analytes in bold are identified as chemicals of ecological concern a Some analytes were identified as analytes for remediation under the background scenario but were either not detected on NASA property or in soils from 0 to 6 feet bgs. However, these analytes have been retained here for consistency. b Average calculated using 1/2 the reporting limit of analytes in soils from 0 to 6 feet bgs. c Background values (DTSC, 2013).
MGM14‐SSFL/Cleanup_Eval_Paper/Cleanup_Eval_Paper_Tables.xlsx ES060713081955MGM

TABLE 3‐5 Risk Summary for Ecological Soil COCs ‐ Background Cleanup Scenario vs Risk‐based Cleanup Scenario Comparative Analysis of the Backgorund and Risk‐Based Cleanup Scenarios, SSFL, Ventura County, California
Comparative Analysis of the Backgroun
Analyte
Preliminary Cleanup Values (mg/kg) Residual Risk (HQ) Ratio of Risk‐Based HQ to
Background HQ Background (LUTV)a Risk‐Based (Low Effect
Level) Background Scenario Risk‐Based Scenario Antimony 0.86 2 0.43 1 2.3
Aroclor 1254 0.17 0.39 0.44 1 2.3 Aroclor 1260 0.17 0.25 0.68 1 1.5 Cadmium 0.7 0.81 0.86 1 1.2 2,3,7,8‐TCDD TEQ 0.000000912 0.000005 0.18 1 5.5 Notes: HQ = Hazard quotient LUTV = Lookup table values mg/kg = Milligram per kilogram TCDD = 2,3,7,8‐Tetrachlorodibenzo‐p‐dioxin TEQ = Toxic equivalency a Look‐up Table Value subject to change. DTSC, 2013 (see Table 1‐1). Representative of background threshold values or reporting limits when no background values were available.
MGM14‐SSFL/Cleanup_Eval_Paper/Cleanup_Eval_Paper_Tables.xlsx ES060713081955MGM

This page intentionally left blank.

Figures

This page intentionally left blank.

NASAAREA II
AREA IAREA IV
AREA III
UNDEVELOPED AREABOEING
UNDEVELOPED AREABOEING
NASAAREA I
UNDEVELOPED AREA
BOEING
1800
1750
1850
1900
1700
1950
2000
1650
1600
2050
2100
1550
2150
1500
1450
14
00
1350
1300
2200
2000
1850
1750
18
00
2000
170
0
1900
1850
2100
2050
1950
1900
1850
1800
1900
1850
2150
1800
1450
2000
1950
1900
1950
13
50
1750
18
00
2000
2050
1850
2050
20001850
2150
21
50
1800
2100
2000
1850
2000
1900
2050
2050
1900
1850
1950
1650
1850
1800
1800
2000
Silvernale
R-1 pond
R-2A
Perimeter Pond
Coca Skim Pond
Horse Pond
Figure 4-1Estimated Excavation Boundaries Under Background CleanupNASA - Santa Susana Field LaboratoryEIS Summary of Alternatives Eliminated From Further Evaluation
02-Aug-2013Drawn By:A. Cooley
Map Document: O:\NASA\SSFL\maps\EIS_Summary_ProposedCleanup.mxd
LegendEstimated Soil Cleanup Boundariesfor Proposed Action
Additional Footprint (Staging, Stockpiling, Access)
Paved Road
Dirt Road
Stream
Contour
Existing Structure
Pond, with water
Pond, without water
Pond, historical
Administrative Boundary
SSFL Property Boundary
UNDEVELOPED
Index Map
Santa Susana Field Laboratory
Map Area
AREA I
UNDEVELOPED AREA
AREA II
AREA IV
AREA III
UNDEVELOPED
AREA 1
0 1,000 2,000500Feet
0 300 600150Meters
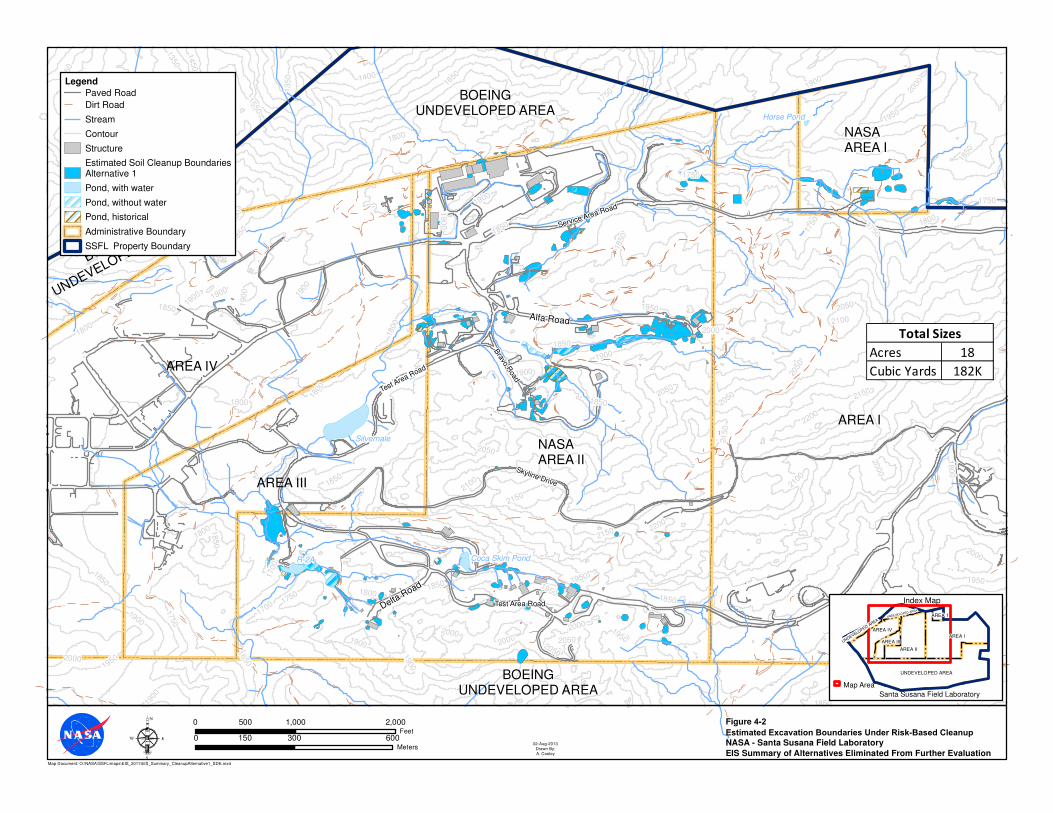
Alfa Road
Skyline Drive
Service Area Road
Delta R
oad
Test Area Road
Test Area Road
Bravo R
oad
NASAAREA II
NASAAREA I
AREA I
AREA IV
AREA III
BOEINGUNDEVELOPED AREA
BOEINGUNDEVELOPED AREA
BOEING
UNDEVELOPED AREA
1800
1750
1850
1900
1950
2000
1700
1650
1600
2050
2100
2150
1550
1500
1450
1400
1350
1300
2200
1850
1700
2050
2200
1650
1900
2150
180
01950
1750
1950
1900
2000
1900
2050
1950
1850
19
00
1900
2000
1450
1850
1900
1850
2150
2100
1850
1950
1750
1900
2050
13
50
1850
1750
2100
1800
19
00
1900
1850
2050
185
0
180
0
1750
2000
2000
2050
1800
2100
1900
1750
1950
2000
1950
1800
1850
1800
1750
1850
1850
1900
2000
21
50
1900
1900
2000
1850
1850
1800
2050
2000
1800
1800
1950
1700
Silvernale
R-2A Coca Skim Pond
Horse Pond
Figure 4-2Estimated Excavation Boundaries Under Risk-Based Cleanup NASA - Santa Susana Field Laboratory
EIS Summary of Alternatives Eliminated From Further Evaluation
02-Aug-2013Drawn By:A. Cooley
Map Document: O:\NASA\SSFL\maps\EIS_2011\EIS_Summary_CleanupAlternative1_SDE.mxd
0 1,000 2,000500Feet
Legend
Paved Road
Dirt Road
Stream
Contour
Structure
Estimated Soil Cleanup BoundariesAlternative 1
Pond, with water
Pond, without water
Pond, historical
Administrative Boundary
SSFL Property Boundary
UNDEVELOPED AREA
Index Map
Santa Susana Field Laboratory
Map Area
AREA I
UNDEVELOPED AREA
AREA II
AREA IV
AREA III
UNDEVELOPED AREA
AREA 1
0 300 600150Meters
Acres 18
Cubic Yards 182K
Total Sizes