company’s release to the market of its results for the
TRANSCRIPT

QBE Insurance Group Limited ABN 28 008 485 014 Level 18, 388 George Street, SYDNEY NSW 2000 Australia GPO Box 82, Sydney NSW 2001 telephone + 612 9375 4444 • facsimile + 612 9231 6104 www.qbe.com
12 August 2021 The Manager Market Announcements Office ASX Limited Level 4 Exchange Centre 20 Bridge Street SYDNEY NSW 2000 Dear Sir/Madam, QBE results presentation for the half year ended 30 June 2021 Further to the Company’s release to the market of its results for the half year ended 30 June 2021, please find attached a copy of the presentation to be delivered to the market today. This release has been authorised by the QBE Board of Directors. Yours faithfully
Carolyn Scobie Company Secretary Attachment


1H21 average rate increase 9.7%
Compound premium rate increases in
all regions
Some signs momentum is moderating,
particularly in International Markets
Australia Pacific pricing recovered
after COVID-19 relief initiatives
Combined operating ratio 93.3%
GWP growth 20%
Attritional claims ratio down 1.8%
Cat claims 1.6% above allowance
Favourable prior accident year
claims development of 1.1%
Adjusted cash profit ROE of 11.9%
Net investment return of 0.4% or
1.4% (ex RFR)
$132M mark-to-market losses on FI
due to higher risk-free rates
FI running yield 0.4%
Maintaining conservative asset
allocation
Closing FUM $27.9B
Capital at S&P ‘AA’ level
Debt to equity 31.1%
Regulatory capital at 1.73x

7,887 7,637 8,041
10,203$10B
$6B
$8B
1H191H18 1H20 1H21
FX 4.6% 4.7%
8.7%9.7%
1H18 1H211H19 1H20
95.8% 95.2%
97.4%
93.3%
6.0%
103.4%
1H18 1H211H19 1H20
51.3%
47.7%
45.5%
43.7%
1H211H18 1H201H19
7.8% 8.2% 7.5% 8.1%
1.9%3.2% 5.5%
7.0% Cat
Large
1H211H18
11.4%
1H19 1H20
9.7%
13.0%15.1%
GLRC
(1.2%)
(2.2%)
(4.0%)
1.1%
2H19 1H20 2H20 1H21
Reported
COVID-19
3.1%
82%81% 85%85%70% 71%
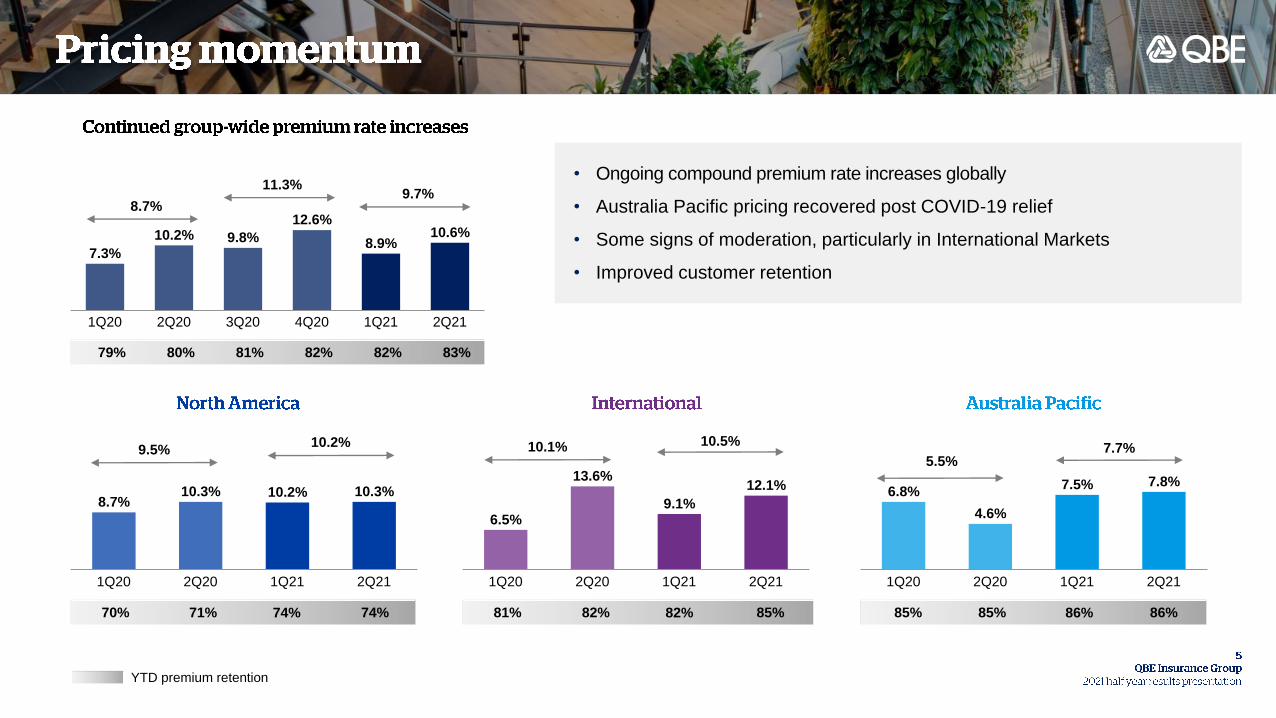
• Ongoing compound premium rate increases globally
• Australia Pacific pricing recovered post COVID-19 relief
• Some signs of moderation, particularly in International Markets
• Improved customer retention
74%
YTD premium retention
11.3%
10.2% 7.7%
85% 86%
9.5%5.5%
9.7%
79% 80% 81% 82% 82% 83%
8.7%
74% 82% 86%
7.3%
10.2% 9.8%
12.6%
8.9%10.6%
2Q214Q203Q201Q20 2Q20 1Q21
8.7%10.3% 10.2% 10.3%
1Q211Q20 2Q20 2Q21
6.5%
13.6%
9.1%
12.1%
1Q20 2Q20 1Q21 2Q21
10.5%10.1%
6.8%
4.6%
7.5% 7.8%
1Q20 2Q212Q20 1Q21

$8,041M
$10,203M
$4B
$5B
$6B
$7B
$8B
$9B
$10B
1H20 FX North America International Australia Pacific 1H21
11%
20% growth
18%
17%

• Attritional claims ratio continues to benefit from compound premium rate
increases and sustained underwriting discipline
47.7%
45.5%
43.7%44.0%
43.0%
45.0%
46.0%
47.0%
48.0%
49.0%
1H19 1H211H20
47.4%
45.2%
44.2%
42.0%
43.0%
44.0%
45.0%
46.0%
47.0%
48.0%
49.0%
50.0%
51.0%
1H19 1H20 1H21
44.0%
42.7%
39.1%
37.0%
38.0%
39.0%
40.0%
41.0%
42.0%
43.0%
44.0%
45.0%
1H201H19 1H21
52.8%
49.3%49.6%
44.0%
46.0%
48.0%
50.0%
52.0%
54.0%
56.0%
1H19 1H20 1H21


1H20 1H21
Gross written premium $M 8,041 10,203
Net earned premium $M 5,556 6,571
Net claims ratio (ex RFR) % 66.7 64.3
Net commission ratio % 16.4 15.3
Expense ratio % 14.3 13.7
COR (ex RFR) % 97.4 93.3
Net investment return % (0.7) 0.4
Underwriting result $M (189) 642
Net investment income $M (60) 58
Profit before tax $M (249) 530
Net profit (loss) after income tax $M (712) 441
Adjusted cash profit (loss) after income tax $M (666) 463
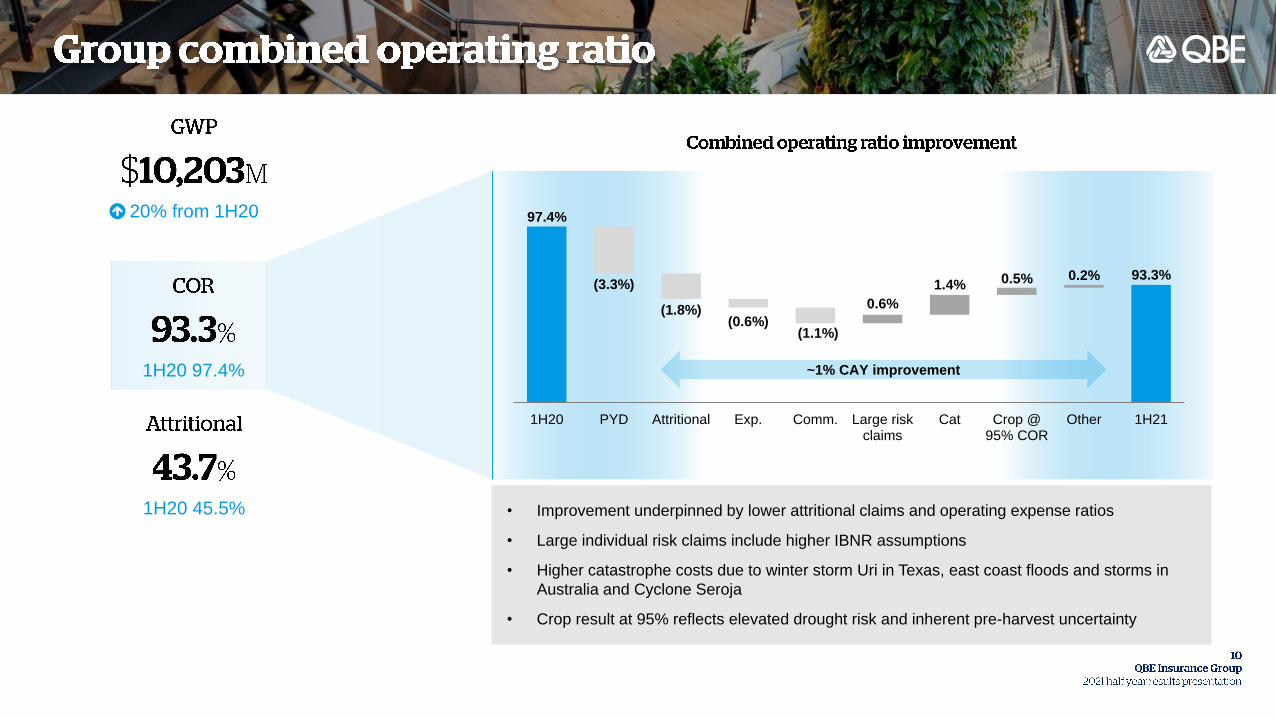
20% from 1H20
1H20 45.5%
1H20 97.4%
• Improvement underpinned by lower attritional claims and operating expense ratios
• Large individual risk claims include higher IBNR assumptions
• Higher catastrophe costs due to winter storm Uri in Texas, east coast floods and storms in
Australia and Cyclone Seroja
• Crop result at 95% reflects elevated drought risk and inherent pre-harvest uncertainty
97.4%
93.3%(3.3%)
(1.8%)(0.6%)
(1.1%)
0.6%
1.4% 0.5% 0.2%
1H20 PYD Attritional Exp. Comm. Large riskclaims
Cat Crop @95% COR
Other 1H21
~1% CAY improvement

96.6% 95.9%
103.8%
100.9%
(0.2%)
5.7%
7.4%
(0.7%)
107.9%
1H20 1H21 1H20 1H21 1H20 1H21 1H20 1H21
COVID-19
impact
31% from 1H20
1H20 45.2%
1H20 103.8%
• Premium growth of 17% excluding Crop
• COR improvement driven by lower attritional claims and operating expense ratios
• Catastrophe claims above allowance due to winter storm Uri in Texas
• Claims experience on prior accident years broadly in-line with expectations
=+ +

• Premium growth of 11%
• Attritional claims ratio improved 3.6%
• Large individual risk claims increased 2.7% primarily due to higher IBNR assumptions
• Catastrophe claims below allowance but up relative to benign prior period
11% from 1H20
1H20 42.7%4
1H20 92.8%
93.1%91.9%
92.8%89.1%(1.7%) (1.3%)
1.4%
(1.5%)
98.7%
1H20 1H21 1H20 1H21 1H20 1H21 1H20 1H21
+ =+
COVID-19
impact

90.2% 90.8%
95.3%
91.0%
6.1%
1.4% (1.0%)
(1.2%)
96.4%
1H20 1H21 1H20 1H21 1H20 1H21 1H20 1H21
18% from 1H20
1H20 49.3%
1H20 95.3%
• Premium growth of 18%
• Attritional claims ratio impacted by higher weather related claims
• Catastrophe claims above allowance due to east coast floods & storms and Cyclone Seroja
• LMI COR of 49% vs 55% at 1H20
+ =+
COVID-19

1.3%
0.2% 0.2%
0.3%
0.5%
0.2%
1H21
1.7%
Credit spreadcontribution
1H19
Wtd avgrisk-free rate
1H20
0.7%
0.4%
FI yield (ex RFR) 66 0.5
Credit spreads MTM 26 0.2
Growth assets 119 11.8
Expenses & other (21) (0.2)
Net return (ex RFR) 190 1.4
Asset RFR impact (132) (1.0)
Net return 58 0.4
• Maintaining conservative asset allocation• Benefit from modestly short tactical
positioning resulted in unrealised gains from
net RFR movement of $73M
3% 3% 1%
0%
Infrastructureassets
Privateequity
Unlistedproperty
7%
14% 36% 38% 12%
AA BBBAAA A
100%
Corporate bonds
Government bonds
Short-term money
Other fixed income
Growth assets
Alternative
investments
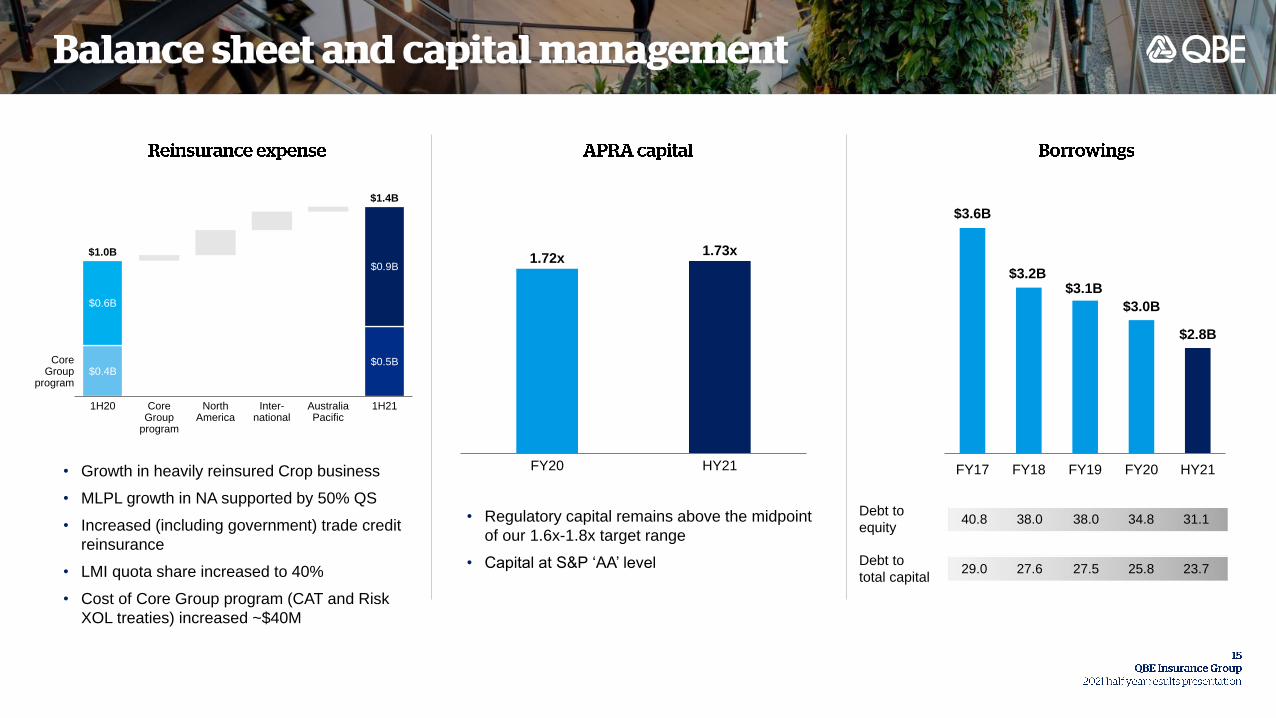
• Regulatory capital remains above the midpoint
of our 1.6x-1.8x target range
• Capital at S&P ‘AA’ level
$3.6B
$3.2B$3.1B
$3.0B
$2.8B
FY17 FY18 FY19 FY20 HY21
Debt to
equity38.0 38.0
27.5
40.8
29.0 27.6Debt to
total capital
34.8
25.8
Inter-national
$0.4B
$0.6B
1H20 NorthAmerica
Core Group
program
AustraliaPacific
$0.5B
$0.9B
1H21
CoreGroup
program
$1.0B
$1.4B
• Growth in heavily reinsured Crop business
• MLPL growth in NA supported by 50% QS
• Increased (including government) trade credit
reinsurance
• LMI quota share increased to 40%
• Cost of Core Group program (CAT and Risk
XOL treaties) increased ~$40M
1.72x1.73x
FY20 HY21
31.1
23.7

17QBE Insurance Group
Targeted and disciplined growth
Portfolio optimisation and improved capital allocation
Enhanced customer connectivity
Technology and operating model modernisation
Culture accelerator


19QBE Insurance Group
1. All figures are in US$
2. Combined operating ratios (COR) exclude the impact of changes in risk-free rates used to discount net outstanding claims
3. Premium growth rates are quoted on a constant currency basis
4. Premium rate change excludes North America Crop and/or Australian compulsory third party motor (CTP)
5. Attritional claims ratios exclude North America Crop and/or Australian lenders’ mortgage insurance (LMI)
6. Adjusted net cash profit (loss) after tax adjusts for Additional Tier 1 capital coupon accruals, amortisation and restructuring costs
7. North America and International historical results have been restated for the transfer of North America’s inward reinsurance
business to QBE Re, part of International
8. Prior accident year claims development excludes North America Crop development that is matched by premium cessions under
the MPCI scheme
9. Prior periods (2019 and earlier) are presented on a continuing operations basis and adjusted basis as presented in prior half year
reports
10. 2020 figures exclude the impact of COVID-19
11. APRA PCA calculations at 30 June 2021 are indicative. Prior year calculation has been updated to be consistent with APRA
returns finalised subsequent to year end
12. Insurance Financial Strength ratings (FSR) reflects ability of an insurer to meet its obligations and claims. FSR is applicable to
operating insurance entities
13. Issuer Credit Rating (ICR) reflects ability of the company to pay the security holder’s interest in addition to principal repayment
14. For capital markets issuances, the date to first call is subject to APRA approval

The information in this presentation provides an overview of the results for the
half year ended 30 June 2021.
This presentation should be read in conjunction with all information which QBE
has lodged with the Australian Securities Exchange (“ASX”). Copies of those
lodgments are available from either the ASX website www.asx.com.au or QBE’s
website www.qbe.com.
The information is supplied in summary form and is therefore not necessarily
complete. Prior to making a decision in relation to QBE’s securities, products or
services, investors, potential investors and customers must undertake their own
due diligence as to the merits and risks associated with that decision, which
includes obtaining independent financial, legal and tax advice on their personal
circumstances. No representation or warranty is made as to the accuracy,
completeness or reliability of the information.
This presentation contains certain “forward-looking information” and “forward-
looking statements” within the meaning of applicable securities laws. The words
“anticipate”, “believe”, “expect”, “project”, “forecast”, “estimate”, “likely”, “intend”,
“should”, “could”, “may”, “target”, “plan”, “outlook” and other similar expressions
are intended to identify forward-looking statements. Indications of, and guidance
on, future earnings and financial position and performance are also forward-
looking statements.
Such forward-looking statements are not guarantees of future performance and
involve known and unknown risks, uncertainties and other factors, many of
which are beyond the control of QBE that may cause actual results to differ
materially from those either expressed or implied in such statements. There can
be no assurance that actual outcomes will not differ materially from these
statements. You are cautioned not to place undue reliance on forward-looking
statements. Such forward-looking statements only speak as of the date of this
presentation and QBE assumes no obligation to update such information.
Any forward-looking statements assume large individual risk and catastrophe
claims do not exceed the allowance in our business plans; no reduction in
premium rates in excess of our business plans; no significant fall in equity
markets and interest rates; no major movement in budgeted foreign exchange
rates; no material change to key inflation and economic growth forecasts;
recoveries from our strong reinsurance panel; no unplanned asset sales and no
substantial change in regulation. Should one or more of these assumptions
prove incorrect, actual results may differ materially from the expectations
described in this presentation.
This presentation does not constitute an offer or invitation for the sale or
purchase of securities. In particular, this presentation does not constitute an
offer of securities for sale in the United States, or to any person that is, or is
acting for the account or benefit of, any U.S. Person, or in any other jurisdiction
in which such an offer would be illegal. Securities of QBE may not be offered or
sold in the United States or to, or for the account or benefit of, any U.S. Persons
without registration under the Securities Act or an exemption from registration.


Commercial & domestic property
Professional indemnity
Motor & motor casualty Public/product
liability
Marine energy & aviation
Workers’ compensation
Accident &health
Financial & credit
Other
Marine energy& aviation
Agriculture Commercial & domestic property
Motor & motor casualty
Public/productliability
Accident &health
Workers’ compensation
Financial &credit
Professionalindemnity
QBE is an international general insurance and reinsurance group, with substantial operations in North America, Europe and Australia. QBE also
operates its captive reinsurer in Bermuda. QBE is listed on the Australian Securities Exchange, headquartered in Sydney, Australia and lead
regulated by APRA
QBE had gross written premium (GWP) of $10,203 million for the half year ended 30 June 2021
Agriculture
Commercial &domestic property
Workers’ compensation
Public/productliability
Professional indemnity
Accident & health
Motor & motor casualty
Marine energy& aviation Financial &
credit
31% from 1H20 11% from 1H20 18% from 1H20

1H20 1H21
$M % $M %
US dollar 8,756 36 8,909 32
Australian dollar 6,179 25 7,604 27
Sterling 3,849 16 4,836 17
Euro 3,169 13 3,738 14
Canadian dollar 1,235 5 1,426 5
New Zealand dollar 367 2 458 2
Hong Kong dollar 360 1 376 1
Singapore dollar 171 1 192 1
Other 346 1 325 1
Total 24,432 100 27,864 100
1H20 1H21
$M % $M %
US dollar 4,107 51 5,126 50
Australian dollar 1,720 21 2,365 23
Sterling 810 10 910 9
Euro 768 10 957 9
New Zealand dollar 141 2 187 2
Canadian dollar 138 2 185 2
Hong Kong dollar 118 1 109 1
Singapore dollar 88 1 91 1
Other 151 2 273 3
Total 8,041 100 10,203 100
1. Continuing operations basis

$1
$2
$3
$4
$5
$6
$7
$8
$9
$0$2$4$6$8$10$12$14$16$18$20
Corn Soybean
-10%
-
10%
20%
30%
40%
50%
60%
70%
Feb20 May20 Aug20 Nov20 Feb21 May21
Corn Soy
Feb20 “Base”
MPCI premiums are largely driven by
commodity prices in Spring (Feb avg)
Corn +20%
Soybean +33%
• Corn and Soybean price increases driving MPCI
premium growth
• Current US drought conditions may impact harvest in
key states:
• California but mostly irrigated
• North Dakota, South Dakota and Minnesota
$1,296M
$1,912M
1H20
+31%
+16%
Commodity prices Organic growth 1H21
~$400M
~$200M
+48% growth

• All Additional Tier 1 Capital and Tier 2 Capital must include loss absorption provisions
(via conversion or write-down) upon a non-viability trigger event
• In 2020, APRA announced that will it align its prudential standards and practices with
the International Association of Insurance Supervisors’ (IAIS) Common Framework for
the Supervision of Internationally Active Insurance Group (ComFrame) and classified
QBE as an Internationally Active Insurance Group (IAIG)
• It is expected that this classification will enhance APRA’s group-wide supervision of
QBE and promote the coordination of supervisory activities efficiently and effectively
between APRA and other international supervisors
Common Equity
Tier 1 Capital
Additional Tier 1
Capital
Tier 2 Capital
Source: Prudential Standard GPS 112, “Capital
Adequacy: Measurement of Capital”, July 2019
CET1 >
60% of PCA Total Tier 1 >
80% of PCA
31 DEC
2020
30 JUN
2021
Ordinary share capital and reserves 7,606 7,954
Net surplus relating to insurance liabilities 1,194 1,342
Regulatory adjustments to Common Equity Tier 1 Capital (3,125) (3,123)
Common Equity Tier 1 Capital 5,675 6,173
Additional Tier 1 Capital – Capital securities 886 886
Total Tier 1 Capital 6,561 7,059
Tier 2 Capital – Subordinated debt and hybrid securities 2,787 2,745
Total capital base 9,348 9,804
Insurance risk charge 3,305 3,426
Insurance concentration risk charge 561 561
Asset risk charge 2,265 2,432
Operational risk charge 571 605
Less: Aggregation benefit (1,268) (1,343)
APRA Prescribed Capital Amount (PCA) 5,434 5,681
PCA multiple 1.72x 1.73x
CET1 ratio (APRA requirement >60%) 104% 109%

31 DEC 2020 30 JUN 2021
Investments and cash 27,735 27,864
Trade and other receivables 5,760 7,678
Intangibles 2,534 2,495
Other assets 1,786 1,408
Assets 37,815 39,445
Insurance liabilities, net 22,518 23,828
Borrowings 2,955 2,751
Other liabilities 3,850 4,026
Liabilities 29,323 30,605
Net assets 8,492 8,840
Shareholders’ funds 7,605 7,953
Capital notes 886 886
Non-controlling interests 1 1
Total equity 8,492 8,840
• PYD favourable $71M (1H20 $120M adverse); positive development in North
America
• Risk margin largely unchanged (1H20 $138M increase includes COVID-19 impact)
• $205M favourable risk-free rate impact (1H20 $335M adverse)
• Probability of adequacy at 92.3% (FY20 92.5%)
• $200 million of Tier 2 subordinated debt repaid in March 2021
• Debt to equity ratio 31.1% (FY20 34.8%)
• QBE is rated by four major rating agencies and is committed to maintaining current
ratings
A+ A-
Long term FSR Debt issue ICR Outlook
A1 A3
A+ A-
A -
Stable
Negative
Negative
Stable
May 2021
December 2020
December 2020
March 2021
Effective date

Weighted average time to first call: 3.6yrs
Issued instruments Issue date First call date Coupon Maturity date
1H21 Balance
sheet value
($M)
Equity
accounted
Additional Tier 1 (AT1) Capital Notes Nov-17 May-25 5.250% Perp 393
Capital Notes May-20 May-25 5.875% Perp 493
AT1 subtotal 886
Debt
accounted
Tier 2
AUD 16NC6 Aug-20 Aug-26 3M BBSW + 2.75% Aug-36 373
GBP 26NC6 May-16 May-22 6.115% May-42 453
USD 27NC7 Oct-16 Nov-23 7.500% Nov-43 400
USD 30NC10 Nov-14 Dec-24 6.750% Dec-44 697
USD 30NC10 Nov-15 Nov-25 6.100% Nov-45 300
USD 30NC10 Jun-16 Jun-26 5.875% Jun-46 522
Tier 2 subtotal 2,745
Senior USD 2023 Senior Sep-17 - 3.000% May-23 6
Total instruments 3,637
453 400
697886 895
300
20252022 2023 2024 2026
6
Tier 2
AT1
Senior

Our Sustainability Framework helps us drive performance, manage risks
and identify opportunities across the areas of sustainability that are most
important to our business, customers and stakeholders
See the Sustainability section of our website for more information.

See the Sustainability section of our website for more information
Achieve our ambition to grow our impact investments to $2 billion by 2025. Refer to
the Premiums4Good section of our website for more information.
Continue to manage climate risk in line with the recommendations of the Financial
Stability Board’s Task Force on Climate-related Financial Disclosures.
Continue to integrate environmental and social considerations into our investment
and underwriting business according to our new Environmental & Social Risk
Framework.
Transition our investment portfolio to net-zero greenhouse gas emissions by 2050,
according to our commitment to UN-convened Net-Zero Asset Owner Alliance.
Refer to our 2020 Annual Report for more information.
Deliver commitments outlined in our Sustainability Scorecard which are aligned to
our priority United Nations Sustainable Development Goals (SDGs):
Recognised in the Top 100 of Equileap's 2021 Gender Equality Global Report & Ranking
for progressing our gender equality agenda. Equileap ranks over 3,500 companies
worldwide based on gender pay gap, work-life balance and parental leave policies.
Published QBE’s Group Human Rights Policy outlining our commitment to continue to
integrate human rights considerations across the business according to international
principles.
QBE is a founding partner of the National Work + Family Standards, launched in
partnership with UNICEF Australia and Parents at Work, and became one of the first
organisations in Australia certified as a Family Friendly Workplace. The standards
provide best practices and minimum ways to build family-friendly workplace cultures.
Launched QBE's first Syndicated Sustainability Linked Loan, connecting the interest
charged on the structured facility to sustainability KPIs linked to renewable electricity,
women in leadership and Premiums4Good impact investments.
Supported vulnerable communities around the world through our disaster relief and
resilience partnership with Red Cross and Save the Children. Since 2019, the
partnership have enabled rapid disaster relief in response to catastrophic events.
Awarded Green insurer of the Year in Finder Green Awards 2021 for the
second year in a row. The award recognises our progress on using renewable
energy, our environmental targets and our commitment to managing climate
risks in investment and risk decisions.
Refer to our 2020 Sustainability Report for more information