companyreport podravka 0607:podravka - poslovni dnevnik€¦ · podravka the reasons for such a...
TRANSCRIPT

CompanyReport
Growth through own brands and acquisitions
Food & Beverages/Pharmaceuticals /Croatia
RESEARCHR Z B G r o u p
J J A S O N D J F M A M J350
400
450
500
550
600
650
700
750
800
850
PODRAVKACROATIA CROBEX - P I
FY 2006 and 1Q 2007 results: Podravka's 2006 results made a rather poor impression.Instead of the announced HRK 100 mn of net profit, Podravka realized only HRK 60.4 mn,which is 3.6% lower yoy. Podravka explained that high restructuring expenses were themain reason for this low profit. The group's sales increased by a low 0.8%. Reasons forsuch a performance can be found in the discontinued distribution of Nestle in the marketsof SEE and restrictive measures imposed by the Croatian Institute for Health Insurancewhich affected Belupo (the pharmaceuticals segment). In 1Q the overall sales revenue fellby 5.5% for which again the discontinued Nestle distribution is to blame, whereas net profit decreased by 8% in 1Q.
Outlook: Podravka is at the moment in a restructuring phase with the purpose of makingoverall business and production processes as well as marketing functions more economic.The restructuring process is scheduled to be finished by the end of 2008e, therefore we canexpect that the result that Podravka will realise in 2007e and 2008e will again be burdened by these costs. Podravka is now focused on achieving higher organic growth.The company wants to accomplish this goal through growth of own brands, as well as strategic partnerships and acquisitions of brands. Distribution contracts, such as the onewith Nestle, are not in the company’s future strategy.
Valuation: In order to set the target price for Podravka we have used two valuation modelsa DCF and a peer analysis. Based on a DCF valuation we set our 12-month price targetat HRK 664 (HRK 643 at the beginning of 2008e). In the peer valuation we have separately compared Podravka's F&B segment with WE peer companies and thePharmaceuticals segment with EE peer companies. Based on the multiples EV/Sales andEV/EBITDA we have derived a price of HRK 493 per share. By averaging the two valuation methods, we set our single price target at HRK 579.
Price 12.06.07 577.00Price target (HRK) 579.00Volatility risk mediumYear high/low 635.00/380.00Currency HRKHRK/EUR 7.36Market capitalisation in HRK mn 3,127.4Free float 68.9%Free float (HRK mn) 2,149.5 ø daily turnover (12 m) in HRK mn 2.5Index CROEMIISIN code HRPODRRA0004Bloomberg PODRRA CZReuters PODR.ZADatastream code CR:PODwww.podravka.hr
Source: Thomson Financial DatastreamKey ratiosin HRK 12/2005 12/2006 12/2007e 12/2008e 12/2009eEPS reported 11.73 11.31 15.71 21.05 26.74PE reported 27.1 41.6 36.7 27.4 21.6Adjusted EPS diluted 11.39 10.99 15.26 20.44 25.97Adjusted PE diluted 27.9 42.8 37.8 28.2 22.2Operating cash flow per share 57.84 45.51 69.43 67.18 57.14Price cash flow 5.5 10.3 8.3 8.6 10.1Book value per share 358.81 326.22 373.98 389.96 408.60Price book value 0.9 1.4 1.5 1.5 1.4Dividend per share 4.98 5.00 5.00 8.00 8.50Dividend yield 1.6% 1.1% 0.9% 1.4% 1.5%EV/adjusted EBITDA 7.6 10.3 10.3 9.2 8.3
Source: Podravka, Raiffeisen estimates
Analyst: Lidija BrkanicTel.: +385/161 74-336e-mail: [email protected] by: Raiffeisen Centrobank, A-1015 Vienna, Tegetthoffstrasse 1Disclosures: www.rcb.atSupervisory authority: Financial Market Authority
PodravkaHold
June 13, 2007

Podravka
The reasons for such a performance are multiple. Belupo, the pharma segment, isaffected by the restrictive measures imposed by the Croatian Institute for HealthInsurance (which corrected the prices three times during 2006) as well as a decreaseof prices of the medicines Irumed and Iruzid which were transferred from the cardio-vascular group to the group of generic medicines.
RESEARCHR Z B G r o u p
2
Sales growth of a low 0.8%
Restrictive measures imposed bythe Croatian Institute for HealthInsurance affected Belupo sales
Podravka – FY 2006 results In 2006 the Podravka group realized only a slight increase in sales of 0.8%. The Foodand Beverages (F&B) segment realized a yoy growth of 2%, while Pharmaceuticalssegment sales fell by 1%. Such a small increase in total sales is somewhat disappointing since the company started the year with a solid yoy growth which peaked in 2Q (+7.0% yoy), whereas in the second half of 2006 Podravka realized alower result when compared with the same quarters last year.
Looking back...
-15.0%
-10.0%
-5.0%
0.0%
5.0%
10.0%
15.0%
20.0%
4Q 04 1Q 05 2Q 05 3Q 05 4Q 05 1Q 06 2Q 06 3Q 06 4Q 06
Domestic sales Foreign sales Total sales
Source: Podravka, Raiffeisen Research
Quaterly sales changes (%)
-15.0%
-10.0%
-5.0%
0.0%
5.0%
10.0%
15.0%
20.0%
25.0%
30.0%
1Q 05 2Q 05 3Q 05 4Q 05 1Q 06 2Q 06 3Q 06 4Q 06
Food and beverages Pharmaceuticals Merchendise Total sales
Source: Podravka, Raiffeisen Research
Sales by segments, quaterly changes

Podravka
Within the F&B segment, the sub-segment of merchandise which in the previous yearsrealized most of the sales revenues (24% in 2005) noted a yoy drop of 1%. An explanation can be found in the fact that the company totally stopped distributingNestle products to retail shops in Bosnia and Herzegovina and Macedonia (from September 1), and partially also in Serbia (from July 1). The contract with Nestleexpires at the end of 2007 in all its forms and in all markets.
Another complaint regarding the 2006 result is the fact that the F&B segment generated an organic growth (F&B without merchandise) of only 2%. If the organicgrowth rate is compared with the rate of inflation in Croatia which on average amounted to 3.2% in 2006, it is obvious that the realized growth rate is not sufficient.But if looked at from the bright side, on the domestic market, which realizes 54.2% oftotal sales, the organic growth rate amounts to 4%. The organic growth rate on foreignmarkets is also positive (6.3% on average), with the exception of the CE market, whichregistered a fall of 9%. This fall is assigned to a significant reduction in production ofprivate labels in the “Rice and legumes“ segment, a reduction of service production forKraft Foods (Tang) and reduced sales of dried fruit as a low-profit program, with thepurpose of improving the profitability of that market. Nevertheless, when summed up,sales on foreign markets fell by 1.6% yoy.
Discontinued distribution of Nestlein the SEE markets
Poor organic growth
RESEARCHR Z B G r o u p
3
0.0%
3.0%
6.0%
9.0%
12.0%
15.0%
18.0%
21.0%
Vege
ta -
food
sea
soni
ngs
Podr
avka
dish
es
Chi
ldre
n's
food
, sw
eets
and
sna
cks
Mea
t and
mea
t pro
duct
s
Beve
rage
s
Rice
, leg
umes
and
oth
er p
rodu
cts
Frui
t and
veg
etab
les
Mer
chan
dise
Oth
er (F
&B)
Phar
mac
eutic
als
Serv
ices
2005 2006
Source: Podravka, Raiffeisen Research
Sales per product groups, as % of total sales
Other (F&B); 3.7%
Merchandise19.0%
Fruit and vegetables 7.1%Rice, legumes and
other products; 4.3%
Meat and meat products Beverages; 4.5%
Children's food, sweets and snacks
Podravka dishes 7.0%
8.4%
9.5%
Vegeta - food seasonings
18.8%
Services; 0.3%
Pharmaceuticals17.5%
Source: Podravka, Raiffeisen Research
Sales structure in 2006
Podravka
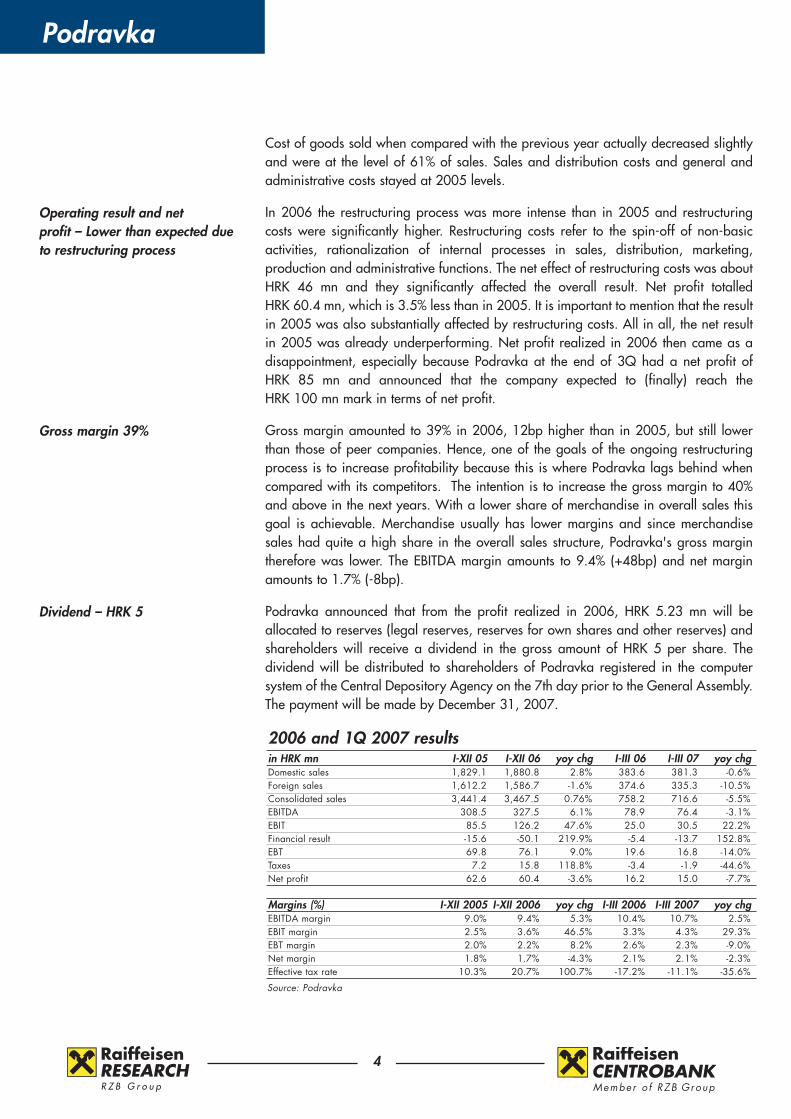
Cost of goods sold when compared with the previous year actually decreased slightlyand were at the level of 61% of sales. Sales and distribution costs and general andadministrative costs stayed at 2005 levels.
In 2006 the restructuring process was more intense than in 2005 and restructuringcosts were significantly higher. Restructuring costs refer to the spin-off of non-basic activities, rationalization of internal processes in sales, distribution, marketing, production and administrative functions. The net effect of restructuring costs was aboutHRK 46 mn and they significantly affected the overall result. Net profit totalled HRK 60.4 mn, which is 3.5% less than in 2005. It is important to mention that the resultin 2005 was also substantially affected by restructuring costs. All in all, the net resultin 2005 was already underperforming. Net profit realized in 2006 then came as adisappointment, especially because Podravka at the end of 3Q had a net profit of HRK 85 mn and announced that the company expected to (finally) reach the HRK 100 mn mark in terms of net profit.
Gross margin amounted to 39% in 2006, 12bp higher than in 2005, but still lowerthan those of peer companies. Hence, one of the goals of the ongoing restructuringprocess is to increase profitability because this is where Podravka lags behind when compared with its competitors. The intention is to increase the gross margin to 40%and above in the next years. With a lower share of merchandise in overall sales thisgoal is achievable. Merchandise usually has lower margins and since merchandisesales had quite a high share in the overall sales structure, Podravka's gross margin therefore was lower. The EBITDA margin amounts to 9.4% (+48bp) and net marginamounts to 1.7% (-8bp).
Podravka announced that from the profit realized in 2006, HRK 5.23 mn will be allocated to reserves (legal reserves, reserves for own shares and other reserves) andshareholders will receive a dividend in the gross amount of HRK 5 per share. The dividend will be distributed to shareholders of Podravka registered in the computersystem of the Central Depository Agency on the 7th day prior to the General Assembly.The payment will be made by December 31, 2007.
Operating result and net profit – Lower than expected dueto restructuring process
Gross margin 39%
Dividend – HRK 5
RESEARCHR Z B G r o u p
4
2006 and 1Q 2007 resultsin HRK mn I-XII 05 I-XII 06 yoy chg I-III 06 I-III 07 yoy chgDomestic sales 1,829.1 1,880.8 2.8% 383.6 381.3 -0.6%Foreign sales 1,612.2 1,586.7 -1.6% 374.6 335.3 -10.5%Consolidated sales 3,441.4 3,467.5 0.76% 758.2 716.6 -5.5%EBITDA 308.5 327.5 6.1% 78.9 76.4 -3.1%EBIT 85.5 126.2 47.6% 25.0 30.5 22.2%Financial result -15.6 -50.1 219.9% -5.4 -13.7 152.8%EBT 69.8 76.1 9.0% 19.6 16.8 -14.0%Taxes 7.2 15.8 118.8% -3.4 -1.9 -44.6%Net profit 62.6 60.4 -3.6% 16.2 15.0 -7.7%
Margins (%) I-XII 2005 I-XII 2006 yoy chg I-III 2006 I-III 2007 yoy chgEBITDA margin 9.0% 9.4% 5.3% 10.4% 10.7% 2.5%EBIT margin 2.5% 3.6% 46.5% 3.3% 4.3% 29.3%EBT margin 2.0% 2.2% 8.2% 2.6% 2.3% -9.0%Net margin 1.8% 1.7% -4.3% 2.1% 2.1% -2.3%Effective tax rate 10.3% 20.7% 100.7% -17.2% -11.1% -35.6%
Source: Podravka
Podravka
Podravka's business result in 1Q developed in-line with expectations. Due to lowermerchandise sales, the overall sales revenue fell by 5.5%. The entire and partialdiscontinuation of distribution of Nestle products for the markets of Bosnia andHerzegovina and Macedonia on the one hand and Serbia on the other hand resultedin a drop of merchandise sales by 46%. The food and beverages segment realized anorganic growth of 2.9%, but altogether, F&B sales fell by 6.3%. What is new in 1Q results is the way Podravka will henceforth report the F&B sales structure. This isdue to the focus on its strongest brands, complexity management, internal changes intracking sales of Podravka brands, the purchase of the EVA brand and the intendedpurchase of the Warzywko and Perfecta brands, sales will be reported in the following groups of products in the following periods:
� Food seasonings (Vegeta, Warzywko, Perfecta)� Podravka meals – from now on this segment will include the following product
groups from the previous classification: Podravka meals, Fruit and vegetables, Riceand legumes, other products and Mill products.
� Baby food, Sweets and Snacks� Meat and canned fish products – includes the meat program from the previous
classification and the newly purchased EVA brand (fish cans)� Beverages� Commercial goods
Pharmaceuticals sales experienced a slight fall of 0.6% in 1Q. Sales on the Croatianmarket fell by 10%, whereas foreign markets realized 50% sales growth, mostly dueto the sales growth in the Russian market.
The restructuring process paid off in terms of lower costs. Operating costs fell by 7%.The biggest contribution to a fall in costs is attributed to 10% lower COGS because ofa drop in the share of the commercial goods in total sales and due to the results ofcomplexity management. Commendable is the fact that COGS is now at the level of58% of sales. Sales and distribution costs increased by 1%, while General and administrative costs fell by 7%. Altogether, gross profit improved by 1.9% yoy, but theresult on the lower levels is weaker. EBITDA dropped by 3%, and net profit by 8%.
Even though the 1Q result is somewhat weaker, we are optimistic about it. Gross margin amounts to 42% (in 2006 it amounted to 39%) and its increase can be attributed both to complexity management and to lower Nestle sales. The EBITDAmargin amounts to 10.7% (+30bp) and net margin stayed at last year’s level of 2.1%.
Restructuring and growth plansPodravka is at the moment undergoing a process of restructuring with the purpose ofmaking overall business and production processes as well as marketing functionsmore economic. In 2006 Podravka discontinued its non-basic activities, continued therationalization of internal processes in sales, distribution, marketing, production andadministrative functions. In 1Q these activities included the spin-off of office buildingcleaning, perimeter and drains cleaning, laundry, green surfaces maintenance, amerger of operating sales teams and marketing for the Croatian market within the
Change in the way Podravka willreport F&B sales
COGS decreased to the level of58% of sales
RESEARCHR Z B G r o u p
5
1Q 2007 results

Podravka
F&B segment and moving the production of Lagris to Slovakia and continuing the production in the Czech Republic without the need for additional hiring. The restructuring process is scheduled to be finished by the end of 2008, therefore we canexpect that the result that Podravka will realise in 2007 and 2008 will again be burdened by these costs.
Besides the ongoing restructuring process, Podravka is focused on achieving higherorganic growth. The company wants to accomplish this goal through growth of ownbrands as well as strategic partnerships and acquisitions of brands. Distribution contracts, such as the one with Nestle, are not in the company’s future strategy. Themanagement said that Podravka would only accept merchandise distribution if a market on which the company is present seeks for a more different product mix whichcould be provided through merchandise distribution. Nevertheless, Podravka still hasa couple of distribution contracts in force, but these are of minor importance than itscontract with Nestle was. The latest one signed was with SMS, a food company fromSplit, which concerns a five-year cooperation contract and agreement that Podravkatakes over the sales and distribution of SMS products. To this end, Podravka and SMSFood Development Centre signed a Cooperation Contract on joint development offood products. Based on this contract, SMS Food Development Centre will provide theservices of science-research work, development and advancement of technologicalprocedures of preserving, final processing, processing and production of food products, quality assessment, assessment of nutritional values, and sanitary quality ofvictuals and objects of general purpose, consultation and education of employees forPodravka.
The strategy of focusing on itself and organic growth in our opinion is good forPodravka in order to strengthen its own brands and differentiate oneself from thecompetitors in the region, all with the goal of achieving a recognizable companyimage and creating added value for all stakeholders.
Latest acquisitions – Istravino BAP, EVA and WarzywkoIstravino non-alcoholic beverages segment – The latest acquisition. The non-alcoholicbeverages segment includes Lero juices and syrups, as well as licence agreementswhich Istravino has with the respective parent companies for production of Oranginaand Cockta. Podravka took over the non-alcoholic beverages production plant andthe production will be kept in Rijeka, where Istravino is based. The plant employsaround 80 people. Total turnover of the non-alcoholic beverages in Istravino was onthe level of HRK 100 mn in 2006. The newly acquired plant will merge with Podravkabeverages so after realisation of the acquisition Podravka's volume in beverages willincrease considerably, placing Podravka beverages among the top players on theCroatian non-alcoholic beverages market. Podravka beverages in 2006 accountedfor HRK 155.7 mn of sales revenue. The acquisition price is rumoured to be at a Priceto Sales ratio of 1.4.
EVA tinned fish – After first having a distribution contract with Zadar-based Adria,Podravka recognized the potential of the tinned fish category and purchased the Evabrand late last year. The Eva brand has been present in the markets of Croatia andSouth-East Europe for a number of years, but it has not been significantly developed
Strategy – growth through ownbrands, strategic partnerships andacquisition of brands
RESEARCHR Z B G r o u p
6

Podravka
lately. Integrated into Podravka's system, Eva will be the flagship of the future development of the Fish and fish products category. Podravka's goal for the Evabrand in the markets of Croatia and South-Eastern Europe it is to be the leading company in satisfying consumer needs in the area of tinned fish and other fish products. These are the markets where the Eva brand is very well accepted and is perceived as a domestic brand in the minds of consumers. EVA in 2006 accountedfor around HRK 70 mn of sales revenue. Podravka expects to increase EVA salesrevenue by 25% in 2007 and 80% in the next three years, respectively. Podravka didnot publish the price at which the Eva brand was acquired, but the price is rumouredto be in the range of HRK 13-18 mn.
Warzywko, Perfecta – Warzywko, the former Kamis brand, is the third-strongestbrand on the Polish market of universal food seasonings and it accounts for more than10% of the market. Competition in the segment of universal food seasonings in thePolish market is the strongest in Europe. Warzywko universal food seasoning has itsown positioning and a particular segment of consumers. Under the Warzywko brand,besides the universal food supplement, Podravka also took over some other smallercategories of products, e.g. bouillons. Next to the Warzywko brand Podravka hasalso taken over Perfecta from Kamis, a brand for universal food seasonings registered on the markets of Russia, Ukraine and Romania, which will additionallystrengthen Podravka's position in those countries. Negotiations on the acquisition ofthese brands lasted for more than 6 months, and after the deal was closed Podravkaawaits the Polish Agency for Market Competition to approve this purchase. Assumingthat the Agency will approve the purchase, Podravka will strengthen its leading position and significantly increase its market share in universal food seasonings inPoland. This business move will enable Podravka, among other things, to increaseproduction volumes in its Polish Vegeta factory. Existing production is expected toincrease by more than 20%, which will bring significant synergy effects to the company.
RESEARCHR Z B G r o u p
7

Podravka
When planning the sales of Podravka group we planned sales separately for the F&Bsegment and the Pharma segment.
Up to now we planned the total sales for the F&B segment, which we now find difficult since the cooperation with Nestle will be terminated at the end of 2007.Podravka has not announced publicly the sales structure of Nestle products (or themerchandise) by countries and quarters and it is clear how difficult it is to plan merchandise sales in the future years. Therefore, we are no longer focused on totalsales but sales without merchandise, i.e. on the company's internal (organic) growth.At the same time, until summer 2006 we did not know that Podravka would gradually start terminating their cooperation with Nestle, but we assumed that theagreement would be terminated at the end of 2007 in all its forms and in all markets,as is the case with Croatia. As already mentioned, Podravka entirely stopped distributing Nestle products to retail shops in Bosnia and Herzegovina andMacedonia (from September 1, 2006), and partially also in Serbia (from July 1,2006). However, we believe that this gradual termination of cooperation is more convenient for Podravka, because it strengthens and accelerates their focus on organic growth.
In the past five years the Podravka Group realized an average annual organic growthof 4%, while the growth of the entire group was 7.3% primarily due to an increase inthe merchandise segment. Although the profitability of Podravka Food and Beveragessegment is very low in comparison with the largest food companies, an insufficientorganic growth, i.e. low focus on their own strongest brands, is something we havemostly held against the company's management. The development of new and innovative products within the scope of the strongest brands and their introductioninto the market accompanied by marketing support is the area in which we have noticed the most significant progress over the past two years. Vegeta and Lino, measured by the recognition of the brands and the market share in these segments,are the most significant brands of the Podravka food segment, and the new productssuch as Vegeta Mediteran and Pikant, Čokolino Crunch and MAXI, Čokolino creamspread, Lino baby food with probiotics, etc. are the best way to preserve and enrichthe value of these brands. Podravka has announced that their goal is to continue launching a new product every month, and the completion of a baby food factory atthe beginning of this year should be a good encouragement for the innovators.
Podravka started with complexity management in 2006. This is a method of portfoliomonitoring with the aim of deciding how long a certain product should be kept on themarket. The decision is made by the manufacturers on the basis of turnover and profitability of the product. By withdrawing the products with low turnover and unsatisfactory margins, a new window of opportunity opens for those products whichhave higher probability of market success. The outcome Podravka targets to achieveis to retain its most competitive products in shops and to maintain higher margins.
Our expectations for the upcoming period are conservative. The main characteristicsof our assessments are the continuation of current trends and slightly higher profitability in the next two years, i.e. until the restructuring process is finished. We
Gradual termination of Nestle cooporation increases the planningrisk in the F&B segment
Complexity managements since to 2006
RESEARCHR Z B G r o u p
8
Outlook
Podravka
support our assumptions also with the fact that the contract with Nestle will be terminated at the end of 2007, which we expect to show a considerable effect onsales in the next two years. Altogether, our forecast is moderate organic growth of theF&B segment.
In other words, we assessed the company under the assumption of the currentmanagement board. Although the management board has been talking for some timeabout refocusing on sales and net profit, up to this point we have not noticed much progress in profitability. There are some business improvements in theway Podravka performed the necessary reallocation of costs from unnecessary expenses to those necessary for their survival in the market (cost savings allocated tomarketing costs) and some savings in terms of operating costs (especially COGS), butwe find this still insufficient. The current restructuring process is still too slow and wehope that the termination of the Nestle agreement indeed gave a strong boost to themanagement and that positive consequences will start to show more noticeableeffects.
The Pharmaceuticals segment is significantly subject to the influence of restrictive measures imposed by the Croatian Institute for Health Insurance which affected thesales of Belupo’s two biggest-selling medicines - Irumed and Iruzid. We plannedmoderate sales growth of the pharmaceuticals segment, especially because it will taketime for the marketing (and overall) focus on OTC medicine sales to show effect.
Pharmaceutical segment burdenedby external effects
RESEARCHR Z B G r o u p
9
The sales model is split according to the product groups Food and Beverages,Merchandise and Pharmaceuticals. Podravka's overall sales in the next two years(2007e and 2008e) are going to be significantly affected by the termination of the contract with Nestle, with a recovery of sales growth rates in 2009e.
In Croatia we planned Food and Beverages sales separately by product groups:Vegeta (food seasonings); Podravka dishes; Baby food, sweets and snacks; Meat andmeat products; Beverages and Other F&B, whereas we planned F&B export sales bymarkets: Bosnia and Herzegovina; Serbia, Kosovo and Montenegro; Czech Republic;Poland and Others.
For Vegeta Croatia we planned a moderate sales growth due to a steady marketshare which could experience a little increase when introducing new Vegeta varietiesto the market (such as Vegeta Pikant, which was recently introduced). For 2007e weplanned Vegeta sales growth of 2%, in 2008e 1% and no sales growth in the following years (terminal growth of 0%).
For Podravka dishes we also forecasted a moderate sales growth of 2.8% in 2007e,2% in 2008e and 2% and in 2009e 1.5% (terminal growth of 0%) expecting a stablemarket share development.
Podravka started with experimental production in its new children-food factory at thebeginning of 2007 (the factory was scheduled to be finished at the end of 2006). Thecapacity of the new plant is 7,000 t of children's food, which marks an increase of
Planning model - Sales
Podravka
60% vs. the previous plant. Total capex amounted to HRK 100 mn. With the new production plant, new children’s food products and a strong marketing focus on thisparticular product segment, we planned a higher sales growth on the Croatian market in the next years. In 2007e we forecast sales growth of 6%, in 2008e 4% andin 2009e 3.5% (terminal growth of 2%).
Podravka started with the restructuring process within the Meat and Meat Processingsegment Danica in February 2007e. The plan is to merge sales operations and reorganize marketing and product development units. In the segment of Meat andMeat Products we based our forecast on the expected growth rates of consumption ofmeat in Croatia. Meat consumption in Croatia is still below average EU meat consumption and it is expected that with an increase in personal income, consumption of meat will also increase. Hence, we planned Meat and Meat Productsegment growth rates as follows: 6% in 2007e, 5% in 2008e and 4.5% in 2009e (terminal growth rate of 3%).
Podravka Beverages together with the newly acquired non-alcoholic segment ofIstravino, is shooting to become one of the major players on the Croatian beveragesmarket. Hence, in 2007e we planned beverages sales growth of 70% (since BAPIstravino was acquired in the second quarter of 2007e, we suppose that its sales willbe added to Podravka beverages sales starting at the end of 2Q). In 2008e we forecast further growth of 10% and in 2009e another 7%, respectively (terminal growth of 2%).
For the Other Food and Beverages segment we planned a moderate increase of 3%in 2007e, 2008e and 2009e (terminal growth rate of 2%).
When planning merchandise sales, we had to take the termination of the contract withNestle into consideration. With the guidance given by Podravka, we planned thatmerchandise sales will drop by 26.8% in 2007e. Podravka stopped distributing Nestleproducts to retail shops in Bosnia and Herzegovina and Macedonia totally (fromSeptember 1, 2006), and in Serbia partially (from July 1, 2006). Another drop inmerchandise sales should be seen in 2008e, since the contract for distribution on theCroatian market will be terminated as well. We planned that in 2008e Podravka willno longer earn revenues from distribution of Nestle. Hence, in 2008e we forecasteda drop in merchandise sales of another 58.3%. Nevertheless, Podravka will still havesome contracts in force, such as the one recently signed with SMS and Unilever (concerning Algida ice-cream distribution). Therefore, in the years from 2008eonwards we planned moderate growth of 3.4% with a terminal value merchandisesales growth rate of 2%.
When planning Pharmaceuticals sales in Croatia we needed to take into consideration restrictive measures imposed by the Croatian Institute for HealthInsurance. Restrictive measures considerably affected the previous periods' sales ofBelupo’s two most abundant medicines - Irumed and Iruzid. We expect that this trendwill also continue in 2007e. Belupo therefore started a strong marketing campaign ofover-the-counter medicines and sees this segment as a product group that could generate revenue in the future. We planned that Belupo sales in Croatia will grow asthe CPI grows, that is 3.2% in 2007e, 3.7% in 2008e and 3.6% in 2009e (terminalgrowth of 4%).
Restructuring of Meat and Meatprocessing segment
Termination of Nestle contract
OTC sales to offset restrictive insurance measures
RESEARCHR Z B G r o u p
10

Podravka
To sum up, we expect that the Croatian market will see growth of 5% in 2007e, a dropin sales of 3% in 2008e due to the termination of the distribution contract with Nestleat the end of 2007 and further growth of 4% in 2009e.
Sales in the markets of SEE (Bosnia and Herzegovina, Macedonia, Serbia,Montenegro and Kosovo) are, like in Croatia, considerably affected by the termination of the distribution contract with Nestle. Consequently, Podravka’s focus isto increase sales of Podravka brands. We find this achievable especially because ofthe mitigating fact that Podravka brands are widely recognized and approved on themarkets of ex-Yugoslavia. Furthermore, we are of the opinion that these markets arewhere Podravka can achieve stronger sales growth. We expect that the market ofBosnia and Herzegovina will grow at the rate of 5% in 2007e and 2008e and by 4%in 2009e (terminal growth rate of 3%).
Podravka still wholesales Nestle products in Serbia. In 2007e we expect a total salesgrowth on the market of Serbia, Montenegro and Kosovo (Nestle + Podravka brands)of 5%. In 2008e we expect to see growth at a lower rate of 4% due to the termination of the contract with Nestle, and in 2009e another 5% (terminal growthrate of 4%).
In 2006 Podravka started reorganizing its production and affiliated companies in theCzech Republic, Slovakia and Poland (explained on the previous pages). Thence, weexpect that the Czech market will see growth rates as follows: 0% in 2007e (due to asignificant reduction in production of private labels in the "Rice and legumes" segment, reduction of service production for Kraft Foods (Tang) and reduced sales ofdried fruit as a low-profit program), 2.6% in 2008e and 2.9% in 2009e (terminalgrowth rate of 0%). On the Polish market we expect to see a stronger growth due tothe acquisition of the food seasoning company Warzywko. Accordingly, we expect tosee a growth rate of 2.5% in 2007 (since Podravka still waits for the Polish agencyfor market competition to approve this purchase), 3% in 2008e and another 2.8% in2009e (terminal growth rate of 1%).
On other markets where Podravka is present, we forecast a cumulative growth rate of3% in 2007, 2% in 2008e and 1.5% in 2009e (terminal growth rate of 1.5%).
To sum up, we expect export sales growth rates as follows: -1% in 2007 and 0% in2008e, respectively, due to the termination of the contract with Nestle. In 2009e ourforecast is a growth rate of 3%.
When planning costs, we needed to take into consideration the restructuring processthat Podravka is currently undergoing, which is expected to be finished by the end of2008e. We expect that the restructuring process will have a strong influence on theoverall result (appears within COGS, selling costs and administrative costs).Therefore, we expect that the gross margin will be at the level of 39.5% in 2007e and2008e (even though the merchandise sales will drop – merchandise usually has a margin of about 19-20%). In 2009e we expect that the gross margin will increase to40.5% (terminal gross margin 40%). Our forecast of the EBITDA margin is as follows:9.8% in 2007e, 10.8% in 2008e and 11.3% in 2009e.
Development of SEE sales
Reorganization in Czech Republic,Slovakia and Poland
RESEARCHR Z B G r o u p
11

Podravka
Target price: HRK 579
RESEARCHR Z B G r o u p
12
In 2007e we expect sales growth of 2.4% and in 2008e a drop in sales of 2% (dueto the termination of Nestle distribution), and further growth of 3.3% in 2009e.
Discounted Cash Flow AssumptionsIn the determination of the WACC we assume a risk-free rate of 4.8%, a market riskpremium of 5%, a beta of 0.9, a tax rate of 20% and a ratio of equity to total capital of 70%. We derive a WACC of 7.2% (6.8% in perpetuity). Based on a DCFvaluation we set our 12-month price target of HRK 664 (HRK 643 at the beginning of2008e).
International Comparative ValuationIn the peer valuation we have separately compared Podravka Food and Beveragessegment with West-European peer companies and Belupo (pharmaceuticals segment)with East-European peer companies. Based on multiples EV/Sales, and EV/EBITDAwe have derived a price of HRK 493 per share.
In the parallel analysis we have separately valued two business fields, Food andBeverages and Pharmaceuticals. For F&B we have used EV/Sales and EV/EBITDAindicators of market benchmark, discounted by 20% considering the significantlylower profitability. The result totaled HRK 1.8 billion at the company level. ForPharmaceuticals we used the same indicators as for the pharmaceutical companies inthe Central and Eastern Europe. As Belupo realizes almost the same profitability asits parallel group, but has significantly lower growth rates, we have requested a 10%discount and have come to the result of HRK 1.7 billion at the company level. We summed up the values calculated for F&B and Pharmaceutics at the company level(HRK 3.5 billion) and subtracted the net debt amount (HRK 853 mn) in order to calculate the equity (HRK 2.6 billion, HRK 493 per share).
...and the target price is...By averaging two valuation methods, we set our single price target of HRK 579. Inrelationship to the current price of HRK 577 our price target represents an upsidepotential of 0.3%. Hence, we recommend holding the share.
Main risks to the planning modelExcept for the market risk, i.e. the case that realized sales are lower than we haveforecasted, we see the main risk to our expectations in the deterioration of margins,slower than anticipated restructuring process as well as higher restructuring costs.These changes influence the DCF valuation considerably.
Valuation

Podravka
RESEARCHR Z B G r o u p
13
Podravka vs. European Food and Beverages benchmark
Source: Bloomberg, Raiffeisen estimates
EBITDA margin Debt to Equity Ratio ROE Payout Ratio Sales growth 07e (%)Koniklije Numico 19.1 190.4 26.1 n.a. 31.9Rieber & Son 12.0 76.7 11.4 60.0 19.8CSM N.V. 7.9 79.6 11.7 82.7 -7.5Tate & Lyle 11.9 111.9 23.0 56.1 13.9Danisco 19.3 107.4 4.6 58.5 17.3Unilever 15.6 75.3 48.4 81.2 3.2Uniq 4.6 127.8 -28.2 n.a. -6.1Nestle 16.6 42.5 18.2 44.3 8.1Median 13.8 93.5 15.0 59.3 11.0Mean 13.4 101.4 14.4 63.8 10.1Podravka Group 9.4 70.0 3.29 44.4 2.8
Peer group - Pharmaceuticals
Source: Bloomberg, Raiffeisen estimates
EV/Sales EV/EBITDA EBITDA Margin Sales Growth (%)2007e 2008e 2007e 2008e 2007e 2007e
Zentiva 3.5 3.0 12.0 10.3 29.6 14.1Krka 3.9 3.3 13.2 11.6 29.9 16.5Egis 1.6 1.4 9.4 8.1 16.9 3.3Gedeon Richter 3.4 2.9 11.5 9.9 29.7 -1.06Median 3.5 2.9 11.8 10.1 29.7 8.69Mean 3.1 2.6 11.5 10.0 26.6 8.21
Peer group - Food and Beverages
Source: Bloomberg, Raiffeisen estimates
EV/Sales EV/EBITDA2007e 2008e 2007e 2008e
Koniklije Numico 2.9 2.6 14.1 12.5Rieber & Son 1.2 1.1 8.8 8.1CSM N.V. 0.9 0.9 9.4 8.0Tate & Lyle 1.1 1.1 8.2 8.5Danisco 2.1 2.1 12.8 12.4Unilever 0.9 0.9 5.8 5.3Uniq 0.5 0.5 14.4 10.6Nestle 1.9 1.8 11.5 10.5Median 1.3 1.2 9.4 8.5Mean 1.5 1.4 9.6 8.7
Peer Valuation: Food and Beverages segment
Source: Bloomberg, Raiffeisen estimates
2007e 2008e AverageSales (wo merchendise), HRK mn 2,384.3 2,525.2EV/Sales 1.3 1.2Derived Enterprise Value - F&B 3,116.3 3,140.1 3,128.2
EBITDA, HRK mn 155.4 160.1EV/EBITDA 9.4 8.5Derived Enterprise Value - F&B 1,457.5 1,363.9 1,410.7
Derived Enterprise value (HRK mn) 2,269.4Discount -20%Target Enterprise Value - Food and Beverages 1,815.5

Podravka
RESEARCHR Z B G r o u p
14
Peer Valuation: Belupo (Pharmaceuticals segment)
Source: Bloomberg, Raiffeisen estimates
2007e 2008e AverageSales, HRK mn 626.6 653.0EV/Sales 3.5 2.9Derived Enterprise Value - Belupo 2,187.3 1,912.3 2,049.8
EBITDA, HRK mn 150.9 156.6EV/EBITDA 11.8 10.1Derived Enterprise Value - Belupo 1,773.7 1,583.2 1,678.5
Derived Enterprise value (HRK mn) 1,864.1Discount -10%Target Enterprise Value - Belupo 1,677.7
Peer Valuation - Podravka Group
Source: Bloomberg, Raiffeisen estimates
Derived Value - Podravka Group 3,499.5Derived Value - Podravka Group 3,493.3Net Debt 853.0Podravka Group 2,640.2Value per share 493.1

Podravka
RESEARCHR Z B G r o u p
15
FCF projection
Source: Raiffeisen estimates
FCF projection (HRK mn) 2007e 2008e 2009e 2010e 2011e 2012e TV CFNOPLAT 113.6 136.1 163.6 186.0 210.9 233.1 233.1Adj. NOPLAT 113.6 136.1 163.6 186.0 210.9 233.1 233.1Depreciation of PPE & intangibles 206.3 206.6 201.7 190.0 180.0 170.0 170.0Gross investment in PPE & intangibles -200.0 -220.0 -150.0 -160.0 -160.0 -170.0 -187.4Change in working capital 64.2 42.6 -39.5 -59.7 -30.6 -47.5 -18.9NWC/Sales 22.3% 21.6% 22.0% 22.5% 22.2% 22.5% 23.0%Change in LT provisions other than tax -16.2 3.2 0.0Net acquisitions & disposals 0.0 0.0 0.0 0.0 0.0 0.0Free cash flow to firm 167.8 168.6 175.8 156.3 200.3 185.5 196.7Adj. free cash flow to firm 167.8 168.6 175.8 156.3 200.3 185.5 196.7EV DCF, mid-year assumption 3,942.9 4,074.1MV of non-operating assets -2.1 -2.1MV of net debt 496.0 384.3MV of minorities 0.0 0.0Adjustments to EV 0.0 0.0Fair value of equity 3,444.9 3,687.6Shares outstanding (mn) 5.4 5.4Price target per share per 01/01 (in HRK) 643.4 688.7
Value drivers 2007e 2008e 2009e 2010e 2011e 2012e TV CFConsolidated sales yoy 2.4% -2.0% 3.3% 5.0% 5.0% 4.0% 2.0%EBITDA margin 9.8% 10.8% 11.3% 11.2% 11.2% 11.2% 11.2%Rate of taxes paid -20.0% -20.0% -20.0% -20.0% -20.0% -20.0% -20.0%Working capital/sales 22.3% 21.6% 22.0% 22.5% 22.2% 22.5% 23.0%Capex/depreciation 97.0% 106.5% 74.4% 84.2% 88.9% 100.0% 110.2%Free cash flow margin 4.7% 4.8% 4.9% 4.1% 5.1% 4.5% 4.8%
WACC 2007e 2008e 2009e 2010e 2011e 2012e TV CFTarget capital structure (at MV) 70.0% 70.0% 70.0% 70.0% 70.0% 70.0% 70.0%Debt/equity ratio (at MV) 42.9% 42.9% 42.9% 42.9% 42.9% 42.9% 42.9%Risk free rate (local) 4.8% 4.8% 4.7% 4.6% 4.6% 4.6% 4.6%Equity market premium 5.0% 5.0% 5.0% 4.5% 4.5% 4.5% 4.5%Levered beta 0.9 0.9 0.9 0.9 0.9 0.9 0.9Cost of equity 9.3% 9.3% 9.2% 8.7% 8.7% 8.7% 8.7%Cost of debt 5.0% 5.0% 5.0% 5.0% 5.0% 5.0% 5.0%Tax rate -20.0% -20.0% -20.0% -20.0% -20.0% -20.0% -20.0%WACC 7.7% 7.7% 7.6% 7.3% 7.3% 7.3% 7.3%
Growth sensitivity (HRK)0.5% 1.0% 1.5% 2.0% 2.5% 3.0% 3.5%
5.8% 674.2 742.7 827.3 934.5 1,074.5 1,265.4 1,540.96.3% 608.0 663.8 731.3 814.7 920.2 1,058.3 1,246.46.8% 552.3 598.5 653.5 720.0 802.2 906.3 1,042.37.3% 504.9 543.7 589.2 643.4 709.0 790.0 892.67.8% 464.0 496.9 535.2 580.1 633.5 698.1 778.08.3% 428.3 456.6 489.1 526.8 571.1 623.8 687.58.8% 397.0 421.5 449.5 481.5 518.7 562.3 614.2
Margin sensitivity (HRK)3.0% 3.5% 4.0% 4.5% 5.0% 5.5% 6.0%5.8% 657.5 749.8 842.1 934.5 1,026.8 1,119.2 1,211.56.3% 574.7 654.7 734.7 814.7 894.6 974.6 1,054.66.8% 509.3 579.6 649.8 720.0 790.3 860.5 930.77.3% 456.3 518.6 581.0 643.4 705.8 768.1 830.57.8% 412.3 468.2 524.2 580.1 636.0 691.9 747.88.3% 375.4 425.9 476.4 526.8 577.3 627.8 678.38.8% 343.8 389.7 435.6 481.5 527.4 573.3 619.2
WA
CCW
ACC
Podravka
RESEARCHR Z B G r o u p
16
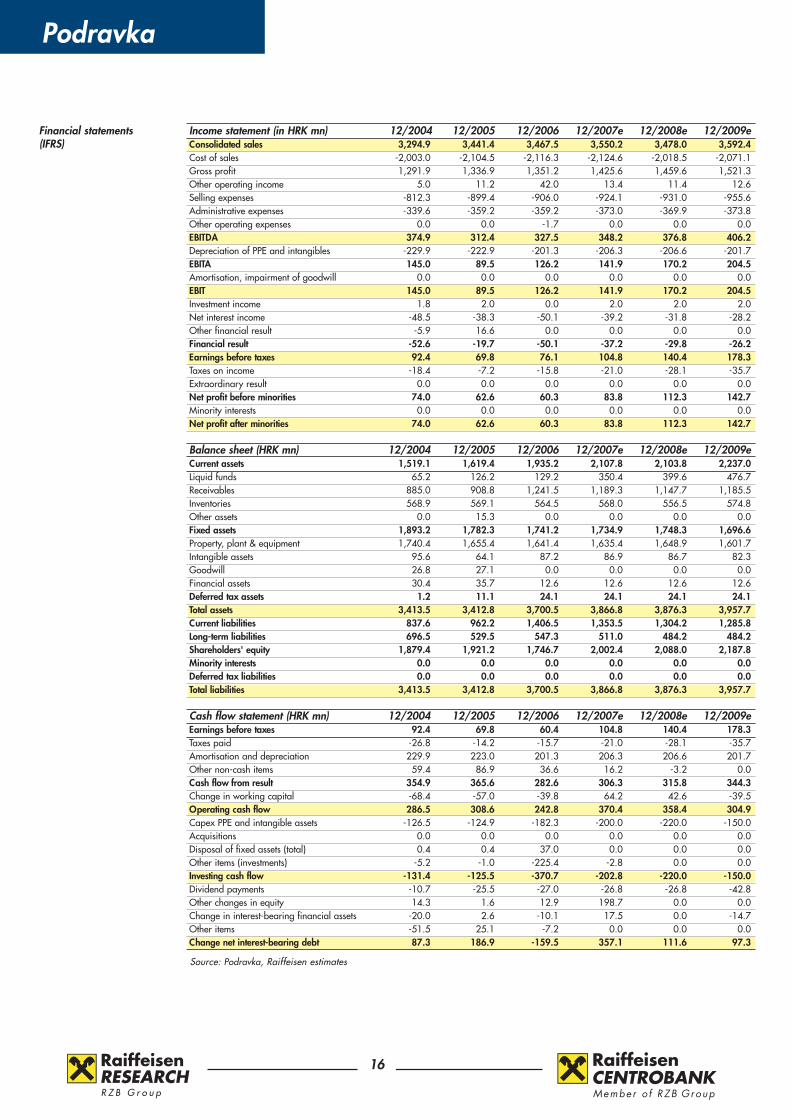
Financial statements(IFRS)
Source: Podravka, Raiffeisen estimates
Income statement (in HRK mn) 12/2004 12/2005 12/2006 12/2007e 12/2008e 12/2009eConsolidated sales 3,294.9 3,441.4 3,467.5 3,550.2 3,478.0 3,592.4Cost of sales -2,003.0 -2,104.5 -2,116.3 -2,124.6 -2,018.5 -2,071.1Gross profit 1,291.9 1,336.9 1,351.2 1,425.6 1,459.6 1,521.3Other operating income 5.0 11.2 42.0 13.4 11.4 12.6Selling expenses -812.3 -899.4 -906.0 -924.1 -931.0 -955.6Administrative expenses -339.6 -359.2 -359.2 -373.0 -369.9 -373.8Other operating expenses 0.0 0.0 -1.7 0.0 0.0 0.0EBITDA 374.9 312.4 327.5 348.2 376.8 406.2Depreciation of PPE and intangibles -229.9 -222.9 -201.3 -206.3 -206.6 -201.7EBITA 145.0 89.5 126.2 141.9 170.2 204.5Amortisation, impairment of goodwill 0.0 0.0 0.0 0.0 0.0 0.0EBIT 145.0 89.5 126.2 141.9 170.2 204.5Investment income 1.8 2.0 0.0 2.0 2.0 2.0Net interest income -48.5 -38.3 -50.1 -39.2 -31.8 -28.2Other financial result -5.9 16.6 0.0 0.0 0.0 0.0Financial result -52.6 -19.7 -50.1 -37.2 -29.8 -26.2Earnings before taxes 92.4 69.8 76.1 104.8 140.4 178.3Taxes on income -18.4 -7.2 -15.8 -21.0 -28.1 -35.7Extraordinary result 0.0 0.0 0.0 0.0 0.0 0.0Net profit before minorities 74.0 62.6 60.3 83.8 112.3 142.7Minority interests 0.0 0.0 0.0 0.0 0.0 0.0Net profit after minorities 74.0 62.6 60.3 83.8 112.3 142.7
Balance sheet (HRK mn) 12/2004 12/2005 12/2006 12/2007e 12/2008e 12/2009eCurrent assets 1,519.1 1,619.4 1,935.2 2,107.8 2,103.8 2,237.0Liquid funds 65.2 126.2 129.2 350.4 399.6 476.7Receivables 885.0 908.8 1,241.5 1,189.3 1,147.7 1,185.5Inventories 568.9 569.1 564.5 568.0 556.5 574.8Other assets 0.0 15.3 0.0 0.0 0.0 0.0Fixed assets 1,893.2 1,782.3 1,741.2 1,734.9 1,748.3 1,696.6Property, plant & equipment 1,740.4 1,655.4 1,641.4 1,635.4 1,648.9 1,601.7Intangible assets 95.6 64.1 87.2 86.9 86.7 82.3Goodwill 26.8 27.1 0.0 0.0 0.0 0.0Financial assets 30.4 35.7 12.6 12.6 12.6 12.6Deferred tax assets 1.2 11.1 24.1 24.1 24.1 24.1Total assets 3,413.5 3,412.8 3,700.5 3,866.8 3,876.3 3,957.7Current liabilities 837.6 962.2 1,406.5 1,353.5 1,304.2 1,285.8Long-term liabilities 696.5 529.5 547.3 511.0 484.2 484.2Shareholders' equity 1,879.4 1,921.2 1,746.7 2,002.4 2,088.0 2,187.8Minority interests 0.0 0.0 0.0 0.0 0.0 0.0Deferred tax liabilities 0.0 0.0 0.0 0.0 0.0 0.0Total liabilities 3,413.5 3,412.8 3,700.5 3,866.8 3,876.3 3,957.7
Cash flow statement (HRK mn) 12/2004 12/2005 12/2006 12/2007e 12/2008e 12/2009eEarnings before taxes 92.4 69.8 60.4 104.8 140.4 178.3Taxes paid -26.8 -14.2 -15.7 -21.0 -28.1 -35.7Amortisation and depreciation 229.9 223.0 201.3 206.3 206.6 201.7Other non-cash items 59.4 86.9 36.6 16.2 -3.2 0.0Cash flow from result 354.9 365.6 282.6 306.3 315.8 344.3Change in working capital -68.4 -57.0 -39.8 64.2 42.6 -39.5Operating cash flow 286.5 308.6 242.8 370.4 358.4 304.9Capex PPE and intangible assets -126.5 -124.9 -182.3 -200.0 -220.0 -150.0Acquisitions 0.0 0.0 0.0 0.0 0.0 0.0Disposal of fixed assets (total) 0.4 0.4 37.0 0.0 0.0 0.0Other items (investments) -5.2 -1.0 -225.4 -2.8 0.0 0.0Investing cash flow -131.4 -125.5 -370.7 -202.8 -220.0 -150.0Dividend payments -10.7 -25.5 -27.0 -26.8 -26.8 -42.8Other changes in equity 14.3 1.6 12.9 198.7 0.0 0.0Change in interest-bearing financial assets -20.0 2.6 -10.1 17.5 0.0 -14.7Other items -51.5 25.1 -7.2 0.0 0.0 0.0Change net interest-bearing debt 87.3 186.9 -159.5 357.1 111.6 97.3

Podravka
RESEARCHR Z B G r o u p
17
Financial ratios
Source: Podravka, Raiffeisen estimates
Changes yoy 12/2004 12/2005 12/2006 12/2007e 12/2008e 12/2009eConsolidated sales yoy 2.4% 4.4% 0.8% 2.4% -2.0% 3.3%EBITDA yoy 11.3% -16.7% 4.8% 6.3% 8.2% 7.8%EBITA yoy 29.5% -38.3% 41.1% 12.5% 19.9% 20.2%EBIT yoy 29.5% -38.3% 41.1% 12.5% 19.9% 20.2%EBT yoy 173.5% -24.5% 9.1% 37.6% 34.0% 27.0%Net profit after minorities yoy 643.5% -15.5% -3.6% 38.9% 34.0% 27.0%
Margins 12/2004 12/2005 12/2006 12/2007e 12/2008e 12/2009eGross margin 39.2% 38.8% 39.0% 40.2% 42.0% 42.3%EBITDA margin 11.4% 9.1% 9.4% 9.8% 10.8% 11.3%EBITA margin 4.4% 2.6% 3.6% 4.0% 4.9% 5.7%EBIT margin 4.4% 2.6% 3.6% 4.0% 4.9% 5.7%EBT margin 2.8% 2.0% 2.2% 3.0% 4.0% 5.0%Net margin 2.2% 1.8% 1.7% 2.4% 3.2% 4.0%
Balance sheet (HRK mn) 12/2004 12/2005 12/2006 12/2007e 12/2008e 12/2009eNet working capital 888.1 848.7 856.4 792.2 749.6 789.0Net interest-bearing debt 880.5 693.6 853.0 496.0 384.3 287.0Capital employed 2,835.7 2,754.2 2,728.9 2,863.5 2,886.6 2,951.5Market capitalisation 1,289.0 1,702.7 2,516.6 3,089.4 3,089.4 3,089.4Enterprise value 2,149.7 2,373.8 3,369.6 3,587.5 3,475.8 3,378.5
Financing (x) 12/2004 12/2005 12/2006 12/2007e 12/2008e 12/2009eInterest cover 6.5 7.6 5.9 7.1 7.9 9.1Internal financing ratio 2.3 2.5 1.5 1.9 1.6 2.0Net gearing 46.8% 36.1% 48.8% 24.8% 18.4% 13.1%Quick ratio 1.1 1.1 1.0 1.1 1.2 1.3Fixed assets cover 1.4 1.4 1.3 1.4 1.5 1.6Capex/depreciation 0.6 0.6 0.9 1.0 1.1 0.7Equity ratio 55.1% 56.3% 47.2% 51.8% 53.9% 55.3%
Profitability 12/2004 12/2005 12/2006 12/2007e 12/2008e 12/2009eReturn on assets 3.5% 2.9% 3.0% 3.3% 3.9% 4.6%Return on equity 4.0% 3.3% 3.3% 4.5% 5.5% 6.7%Return on capital employed 4.2% 3.6% 3.8% 4.4% 5.3% 6.2%
Per share data (HRK) 12/2004 12/2005 12/2006 12/2007e 12/2008e 12/2009eWeighted avg. no. of shares (mn) 5.3 5.3 5.3 5.3 5.3 5.3EPS reported 14.04 11.73 11.31 15.71 21.05 26.74EPS pre-goodwill 14.04 11.73 11.31 15.71 21.05 26.74Adjusted EPS diluted 13.49 11.39 10.99 15.26 20.44 25.97Operating cash flow per share 54.34 57.84 45.51 69.43 67.18 57.14Book value per share 348.47 358.81 326.22 373.98 389.96 408.60Dividend per share 4.94 4.98 5.00 5.00 8.00 8.50Payout ratio 36.0% 42.6% 44.4% 31.9% 38.1% 31.9%
Valuation (x) 12/2004 12/2005 12/2006 12/2007e 12/2008e 12/2009ePE reported 17.0 27.1 41.6 36.7 27.4 21.6PE pre-goodwill 17.0 27.1 41.6 36.7 27.4 21.6Adjusted PE diluted 17.7 27.9 42.8 37.8 28.2 22.2Price cash flow 4.4 5.5 10.3 8.3 8.6 10.1Price book value 0.7 0.9 1.4 1.5 1.5 1.4Dividend yield 2.1% 1.6% 1.1% 0.9% 1.4% 1.5%Free cash flow yield 12.4% 10.8% 3.3% 5.5% 4.5% 5.0%EV/sales 0.7 0.7 1.0 1.0 1.0 0.9EV/EBITDA 5.7 7.6 10.3 10.3 9.2 8.3EV/EBIT 14.8 26.5 26.7 25.3 20.4 16.5EV/operating cash flow 7.5 7.7 13.9 9.7 9.7 11.1Adjusted EV/CE 0.8 0.9 1.3 1.4 1.3 1.3Adjusted EV/CE vs. ROCE/WACC 2.4 2.0 1.6

Acknowledgements
RESEARCHR Z B G r o u p
18
This report has been prepared by Raiffeisen Centrobank for information purposes only. Maximum care has been taken to ensure that the information contained herein is not untrue, however,its complete accuracy or correctness cannot be guaranteed. This report is aimed solely at professional investors who are expected to make their own investment decisions without placing unduereliance on the information interpreted by Raiffeisen Centrobank, which under no circumstance accepts any responsibility for consequences arising from the use of this report. This information may not be reproduced, transmitted or distributed (in whole or in part) by any other person. Unless otherwise stated, all views (including statements and forecasts) are solely thoseof Raiffeisen Centrobank and are subject to change without notice.
Raiffeisen Centrobank may have effected an own account transaction in any investment mentioned herein or related investments and or may have a position or holding in such investments asa result. Raiffeisen Centrobank may have been, or might be, acting as a manager or co-manager of a public offering of any securities mentioned in this report or in any related security.
This document does not constitute an offer or invitation to subscribe for or purchase any securities and neither this document nor anything contained herein shall form the basis of any contractor commitment whatsoever. Raiffeisen Centrobank is regulated by the Austrian Financial Markets Authority.
Disclosure: -
1. RCB or an affiliated company (individually or together) owns more than 5 % of the issued share capital of the issuer. 2. The issuer owns more than 5 % of the issued share capital of RCB or an affiliated company.3. RCB or an affiliated company acts as a market maker (or specialist) or designated sponsor or stabilizing manager of the securities of the issuer.4. RCB or an affiliated company was a manager or co-manager of a public offering of securities of the issuer within the last 12 months.5. RCB or an affiliated company has agreed to render (and to receive compensation for) other investment banking services to the issuer within the last 12 months.6. The analyst owns securities of the issuer analysed by him. 7. The analyst is on the Supervisory Board/Board of Directors of the issuer analysed by him.8. The analyst has received or acquired securities of the issuer before launch of the public offering of such securities.9. The remuneration of the analyst is linked to investment banking services rendered by RCB or an affiliated company.
Raiffeisen Centrobank’s rating and risk classification system:
Risk ratings: indicators of potential price fluctuations are: low, medium, high.Risk ratings take into account volatility. Fundamental criteria might lead to a change in the risk classification. Also, the classification may change over the course of time.
Investment ratings: indicators of the expected return within a 6-12-month period from the date of the initial rating.Buy: 10% or more for low/medium risk shares, 15% for high risk sharesHold: -10% to +10% for low/medium risk shares, -15% to +15% for high risk sharesSell: < -10% for low/medium risk shares, < -15% for high risk shares
Price targets are determined by the fair value derived from a peer group comparison and/or our DCF model. Other fundamental factors (M&A activities, capital markets transactions, sharebuybacks, sector sentiment etc.) are taken into account as well.
Upon the release of a research paper, investment ratings are determined by the ranges described above. Interim deviations from the above mentioned ranges will not cause a change in therecommendation automatically but will become subject to review.
Raiffeisen Centrobank AG - Your contacts:A-1010 Vienna, Tegetthoffstraße 1, Internet: http://www.rcb.at, E-mail: [email protected]
Sales & Trading Tel.: +43/1515 20-0Wilhelm Celeda (Head) ext. 402
International Institutional SalesKlaus della Torre (Head) ext. 472Susanne Bixner ext. 161Anne Englert ext. 458Oliver Fendt ext. 498Elena Filonova ext. 436Rainer Girsch ext. 465Reinhard Haushofer ext. 477György Karolyi ext. 437Tomislav Pasalic ext. 435Georg Scholz ext. 398 Andreas Steinbichler ext. 471
Salestrading BlocktradesPatrik Steirer (Head) ext. 409Michael Kriechbaum ext. 464Michael Schützenauer ext. 462Stefan Waidhofer ext. 463Wojciech Kolacz ext. 343Christof Wallner ext. 457
Company Research Tel.: +43/1515 20-0Birgit Kuras (Head of Research) ext. 150Stefan Maxian (Head of CEE) ext. 177Claudia Vince-Bsteh (Head of AT) ext. 170Reinhard Ebenauer ext. 175Roman Herzog ext. 168Katharina Kastenberger ext. 155Klaus Küng ext. 158Bernd Maurer ext. 169Klaus Ofner ext. 178 Leopold Salcher ext. 176Teresa Schinwald ext. 179 Jovan Sikimic ext. 184Arno Supper ext. 153Tobias Winter ext. 174
Ionut Gutis ext. [email protected]
Iuliana Mocanu ext. [email protected]
Russia Tel.: +7/495 721-0Madina Butaeva (Head) ext. [email protected]
Anna Yudina ext. [email protected]
Serbia Tel: +381/11 220-0 Aleksandra Vukosavljevic ext. [email protected]
Slovenia Tel.: +386/2 2293-0Darko Kovacic ext. [email protected]
Layout Tel.: +43/1515 20-0Martin Hamak ext. 208Günther Heil ext. 282Klaudia Neumayr ext. 378
Croatia Tel.: +385 1 61 74-0Denis Dolinar ext. [email protected]
Lidija Brkanic ext. [email protected]
Czech Republic Tel.: +420/221 14-0Jindrich Svatek ext. [email protected]
Hungary Tel.: +36/1484-0Levente Blahó ext. [email protected]
Ákos Herczenik ext. [email protected]
Poland Tel.: +48/22 585-0Piotr Her ext. [email protected]
Marcin Palenik ext. [email protected]
Romania Tel.: +40/21 306-0Bogdan Campianu (Head) ext. [email protected]
Oleg Galbur (Head) ext. [email protected]
Alexandru Combei ext. [email protected]
Bogdan Gogu ext. [email protected]