company research apollo tyresfrrshares.com/researchreport/apollo_tyres_initiating...company research...
TRANSCRIPT

Research Associate: Pooja Jain October 8, [email protected], Tel: +9122
Apollo Tyres
Date: 08.10.2012
Investment Overview:
• Apollo Tyres, the leading player in the truck and bus radial (TBR) tyre segment, is expected to be a key beneficiary of the likely shift towards radialisation in the TBR segment.
• The company, which recorded an annual turnover of $2.5 billion during 2011-12, clocking a 37% growth yearon-year, was eyeing a turnover of $3 billion in 2012-13 fiscal.
• In revenue break-up terms, India contributes 67%, Europe 23% and South Africa 10%, with the replacement market bringing in 73% of revenues and original equipment manufacturers 27%.
• Despite tough market conditions, where there has been flat growth in both commercial vehicles and passenger cars, net sales for Apollo had grown quarter-to-quarter and this was due to its focus on replacement market and exports.
• Net Sales of the company are expected to grow at a CAGR of 10% over 2012 to 2014E respectively.
• On October 1, 2012 themembers have approved a hike in investment limit of foreign institutional investors to 40 percent from 30 percent earlier. The board also approved raising up to Rs 800 crore or USD 150 million via qualified institutional placement.
• Apollo Tyres will invest Rs 300and make it an export unit for industrial tyres to Europe, South Africa and North America.
Company Research
Research Associate: Pooja Jain October 8, 2012, Tel: +9122 43344222
Apollo Tyres, the leading player in the truck and bus radial (TBR) tyre segment, is expected to be a key beneficiary of the likely shift towards radialisation in the TBR segment.
The company, which recorded an annual turnover of $2.5 billion during
12, clocking a 37% growth year-year, was eyeing a turnover of $3
up terms, India contributes 67%, Europe 23% and South Africa 10%, with the replacement market bringing in 73% of revenues and original equipment manufacturers 27%.
Despite tough market conditions, where there has been flat growth in both commercial vehicles and passenger cars, net sales for Apollo had grown
quarter and this was due to on replacement market and
Net Sales of the company are expected to grow at a CAGR of 10%
to 2014E respectively.
ctober 1, 2012 the board members have approved a hike in investment limit of foreign institutional investors to 40 percent from 30 percent earlier. The board also approved raising up to Rs 800 crore or USD 150 million via qualified institutional
will invest Rs 3000 mn in its Kalamassery unit in Kerala in the next two years and make it an export unit for industrial tyres to Europe, South Africa and North America.
Research outlook
CMP (Rs)
Target price
Period
Recommendation
Shareholders Information
Date
Market cap (Rs. Mn)
1 Year Price Var%
52 Week High (Rs)
52 Week Low (Rs)
Industry PE
Share Holding Pattern As on 30
Promoters
FII
DII
Others
Total
Stock Performance (1 year)
Company Research
Research Associate: Pooja Jain October 8, 2012
in its Kalamassery unit in Kerala in the next two years and make it an export unit for industrial tyres to Europe, South Africa and North America.
Research outlook
89.7
106.2
One year
ACCUMULATE
Shareholders Information
08-October-12
45211
74.72
102.45
52.00
8.83
As on 30th June 2012
46.94%
22.55%
13.36%
17.15%
100.00%

Company Research
October 8, 2012
COMPANY BACKGROUND:
Set up in 1972, Apollo Tyres manufactures automotive bias and radial tyres,and tubes. The
company has plants in Kochi (Kerala), Vadodara (Gujarat), Pune (Maharashtra), and Chennai
(Tamil Nadu). Its product profile includes leading brands in the T&B, light truck, passenger
car, and farm vehicle segments in India, which cater to both the OEM and replacement
markets. In April 2006, the company wholly acquired Dunlop Tyres for Rs.2.9 billion. Dunlop
Tyres is a private limited company, incorporated in South Africa; it has three manufacturing
units in South Africa and Zimbabwe, and produces a range of bias and radial products. In May
2009, Apollo Tyres acquired Vredestein—a niche player in the premium, high-speed PCR
segment in Europe—from Amtel NV, Russia. Vredestein was set up in 1946 as a joint venture
between Vredestein Banden BV and BF Goodrich Tires. In 1977, the Dutch government
acquired a 51 per cent stake in Vredestein, and in 2005, the company was acquired by Amtel
NV. Vredestein has a manufacturing unit at Enschede, near Amsterdam (The Netherlands),
with capacity to manufacture 5.5 million tyres per annum. Vredestein has two brands:
Vredestein in the premium segment and Maloya in the mid-range segment.
For 2011-12, Apollo Tyres had a Profit after tax (PAT) of Rs. 4121.20mn on net sales of Rs.
121532.87 mn, against a PAT of Rs.4408.02mn on net sales of Rs.88677.18mn for 2010-11.
For the three months ended June 30, 2012, Apollo Tyres reported a PAT of Rs. 1388.92 mn
on net sales of Rs.31647.02 mn, against a PAT of Rs.775.06 mn on net sales of Rs.28224.09
mn for the corresponding period of the previous year.

Industry Snapshot:
The Indian tyre industry is expected to continue its growth and is expected to
witness a turnover growth of more than 10% CAGR during the period between
FY’12 and FY’14. The increasing level of investments to increase production
capacity should drive the Indian tyre industry in the coming years.
Market share
In India 65% of tyre demand comes from replacement market, in which the T&B
(Truck & Bus) segments contribute 57% of the total volume. T&B tyre segment is
highly dominated by Apollo, MRF, CEAT and JK tyre. Currently top four players
has 74% market share in Indian tyres Industry.
Company Research
The Indian tyre industry is expected to continue its growth and is expected to
witness a turnover growth of more than 10% CAGR during the period between
increasing level of investments to increase production
capacity should drive the Indian tyre industry in the coming years.
Market share – Indian Tyre Industry (%)
In India 65% of tyre demand comes from replacement market, in which the T&B
segments contribute 57% of the total volume. T&B tyre segment is
highly dominated by Apollo, MRF, CEAT and JK tyre. Currently top four players
has 74% market share in Indian tyres Industry.
MRF tyre, 27%
Apollo tyre, 19%
JK Tyre, 16%
Ceat, 12%
Others tyres, 26%
Company Research
October 8, 2012
The Indian tyre industry is expected to continue its growth and is expected to
witness a turnover growth of more than 10% CAGR during the period between
increasing level of investments to increase production
capacity should drive the Indian tyre industry in the coming years.
In India 65% of tyre demand comes from replacement market, in which the T&B
segments contribute 57% of the total volume. T&B tyre segment is
highly dominated by Apollo, MRF, CEAT and JK tyre. Currently top four players

Company Research
October 8, 2012
Quarterly Results Update:
• Top-line grows by 12.13% yoy:
Apollo Tyres has posted top line of Rs. 31647.02 mn against Rs. 28224.09 mn for the same
quarter previous year, a growth of 12.13% on y-o-y basis where as PAT for the quarter was
Rs. 1388.92mn against Rs. 775.06 mn for the same quarter last year, and a growth of 79.20%
on y-o-y basis. The company has reported an EPS of Rs.2.74 for the quarter ended June 30,
2012 as compared to Rs.1.53 for the quarter ended June 30, 2011. India operation revenues
grew by 10% led by 4% volume growth and 6% on account of price and mix. India operations
reported an EBITDA margin of 10.3% versus 7.6% in 1QFY12.
• Lower raw material cost has led improvement in EBIDTA margin:
EBIDTA rose 51.03% to Rs. 3515.9Mn and EBIDTA margin jumped 285 bps YoY on the back
of subdued raw material prices. Natural rubber, which has been 15% lower YoY, led the
decline in raw material (RM) costs. Raw material cost as a % of sales declined from 66% in
1QFY12 and 65.3% in 4QFY12 to 61.8% in 1QFY13. Going forward, we expect RM costs to
remain subdued.
• International operations grew by 23.12%:
Apollo tyres revenue from international operations grew by 23.12%. Revenue from south
African operations posted a positive surprise with a growth of 40% due to better product mix
and price hike taken during Q1FY13. Turnaround in operations at South Africa, which reported
EBIT margins of 1.36% as against a negative 1.83%, was a positive surprise.
Revenue growth from the European operations was on a slower side due to volume decline. However product mix helped the company report 7.6% revenue growth at Rs6,496mn and there was also increase in EBIT margin of 14.32% as against 9.76% almost 456bps increase.
Despite soft demand from the domestic OE segment and European region, volumes are
expected to grow in double digits. Natural rubber prices continue to remain soft and that
should be positive for the margins.
Other Conference call highlights:
• In the domestic market, the company demand from the OE segment has been soft and the growth is largely coming from the replacement market. Outlook on replacement demand remains positive and the OE demand could be a bit of challenge.
• In the South African market, competition from Chinese imports remains a challenge.
• In the European market, the industry volumes in 1QFY13 were down by 15%. European markets remain weak and the company is not expecting volume growth from the European operations in FY13.

• During the quarter, inventory levels increased in India and Europe demand. However the management hopes to correct that in 2QFY13.
• In 1QFY13, the company took price hikes in the domestic T&B replacementSouth Africa.
• In the near term, the company does not expect sharp movement in that will provide more stability to the margins.
• During the quarter, average price of key raw materials were Rs85/kg, NTFC - Rs255/kg and SR
• At the Chennai plant the company has reacheto reach the terminal 450MTPD capacity by end 2012.
Investment rationale:
De-risked business model and strong brands are APTY's key strengths:Apollo tyres operations are spread across three different geographies and have presence in most of the product segments within the tyre industry. Such a spread out revenue model provides cushion to the revenues and profits of the company during difficult times. APTY hstrong brands in each of its operational zones. For APTY, 'Apollo', 'Dunlop' and 'Vredestein' are the key brands in Indian, South African and European markets respectively. Company's other brands line Regal, Kaizen and Maloya support their more product through a strong distribution network across all the three geographies.
Sales Contribution:
South Africa
Company Research
During the quarter, inventory levels increased in India and Europe operations duedemand. However the management hopes to correct that in 2QFY13.
In 1QFY13, the company took price hikes in the domestic T&B replacement
In the near term, the company does not expect sharp movement in natural rubberthat will provide more stability to the margins.
During the quarter, average price of key raw materials were - NR - Rs210/kg,Rs255/kg and SR - Rs190/kg.
At the Chennai plant the company has reached production capacity of 350MTPDto reach the terminal 450MTPD capacity by end 2012.
risked business model and strong brands are APTY's key strengths:operations are spread across three different geographies and have presence in most
of the product segments within the tyre industry. Such a spread out revenue model provides cushion to the revenues and profits of the company during difficult times. APTY hstrong brands in each of its operational zones. For APTY, 'Apollo', 'Dunlop' and 'Vredestein' are the key brands in Indian, South African and European markets respectively. Company's other brands line Regal, Kaizen and Maloya support their more established counterparts. APTY sells its product through a strong distribution network across all the three geographies.
India
66%
South Africa
10%
Europe
23%
Others
1%
Company Research
October 8, 2012
operations due to weak
In 1QFY13, the company took price hikes in the domestic T&B replacement market and in
natural rubber prices and
Rs210/kg, carbon black -
d production capacity of 350MTPD and expects
risked business model and strong brands are APTY's key strengths: operations are spread across three different geographies and have presence in most
of the product segments within the tyre industry. Such a spread out revenue model provides cushion to the revenues and profits of the company during difficult times. APTY has created strong brands in each of its operational zones. For APTY, 'Apollo', 'Dunlop' and 'Vredestein' are the key brands in Indian, South African and European markets respectively. Company's other
established counterparts. APTY sells its product through a strong distribution network across all the three geographies.

Current investment cycle over, debt to start coming down going forward Over the past couple of years included capacity enhancement at various location andChennai. With the current round ofexpect debt levels to stabilize and come down gradually for APTY. Reduction in debt levels will reduce the interest burden that is on a rise over the past few years. With majority of thecapex getting over in FY12, we expect the company's free cash flow to turnFurther the company has not chalked out any major capex forcompany to use this cash to lower its debt levels. Replacement demand to offset current slowdown in OEM segment sales:
The macro-economy is under pressure, OEM rates and high inflation. Thus in such a situation the company is able to generate its revenue from replacement market. The company derives 63% of its consolidated revenue from the replacement market and hence growth. Other factors such as soft raw material prices etc will continue to drive earnings growth of the company in the next two years. We expect replacement demand to remain relatively stable over the next two years on the back of the boom in automobile sales witnessed during FY09 and FY12. Robust growth in local passenger car
Lower raw material costs of tyres will led to improvement in EBIDTA margins
bottomline:
We expect Apollo tyres EBIDTA margin to remain double
decline in raw material and price hike coming into play. In FY10
CAGR of 35% resulting in huge pressure on margins of companie
15,52,703
3,84,194
0
5,00,000
10,00,000
15,00,000
20,00,000
25,00,000
30,00,000
35,00,000
40,00,000
2008-09
Passenger Vehicles
Company ResearchCurrent investment cycle over, debt to start coming down going forward
Over the past couple of years (FY10 and FY11), APTY invested Rs46bnincluded capacity enhancement at various location and investment in its greenfield capacity at Chennai. With the current round of investment cycle expected to come to an end by FY12, we
stabilize and come down gradually for APTY. Reduction in debt levels the interest burden that is on a rise over the past few years. With majority of the
capex getting over in FY12, we expect the company's free cash flow to turnFurther the company has not chalked out any major capex for FY13 and we expect the company to use this cash to lower its debt levels.
offset current slowdown in OEM segment sales:
economy is under pressure, OEM sales also feel pressure due to high interest rates and high inflation. Thus in such a situation the company is able to generate its revenue from replacement market. The company derives 63% of its consolidated revenue from the replacement market and hence we expect it to reap the benefits of robust automobile sales growth. Other factors such as soft raw material prices etc will continue to drive earnings growth of the company in the next two years. We expect replacement demand to remain
er the next two years on the back of the boom in automobile sales witnessed during FY09 and FY12.
in local passenger car and commercial vehicle sales
Lower raw material costs of tyres will led to improvement in EBIDTA margins
We expect Apollo tyres EBIDTA margin to remain double – digits in FY13 on the basis of
decline in raw material and price hike coming into play. In FY10-12, rubber prices grew by
CAGR of 35% resulting in huge pressure on margins of companies in the tyre space. In order
15,52,703
19,51,333
25,01,54226,18,072
3,84,194
5,32,721
6,84,9058,09,532
2009-10 2010-11 2011-12
Passenger Vehicles Commercial Vehicles
Company Research
October 8, 2012
Current investment cycle over, debt to start coming down going forward:
(FY10 and FY11), APTY invested Rs46bn towards capex that investment in its greenfield capacity at
investment cycle expected to come to an end by FY12, we stabilize and come down gradually for APTY. Reduction in debt levels
the interest burden that is on a rise over the past few years. With majority of the capex getting over in FY12, we expect the company's free cash flow to turn positive in FY13.
FY13 and we expect the
offset current slowdown in OEM segment sales:
sales also feel pressure due to high interest rates and high inflation. Thus in such a situation the company is able to generate its revenue from replacement market. The company derives 63% of its consolidated revenue from the
we expect it to reap the benefits of robust automobile sales growth. Other factors such as soft raw material prices etc will continue to drive earnings growth of the company in the next two years. We expect replacement demand to remain
er the next two years on the back of the boom in automobile sales
in FY09-FY12
Lower raw material costs of tyres will led to improvement in EBIDTA margins and
digits in FY13 on the basis of
12, rubber prices grew by
s in the tyre space. In order
26,18,072
8,09,532
12

to pass on rising raw material costs, the company had to resort to frequent price hikes in the
replacement market. Price hikes taken during FY10
domestic rubber prices have softened and a
to lower raw material costs in 1QFY13, the company reported improvement of
270/480/300bps YoY in EBITDA margins of its Indian/European/South African operations at
10.3%/18.3%/4.8%, respectively.
Raw material costs to decline in FY13
Natural Rubber prices in India have come down by 12.18% since April 2012. We expect this to
be positive for tyre companies as natural rubber accounts for 65% of raw material costs.
Further fall in raw material prices, we expect Apollo tyres to improve in E
FY13. In Q1FY13, the company had reported an improvement of
the drop in raw material costs.
Sharp decline in rubber price since April 2012:
Source: Rubberboard.org
215 212 195 200
203 196171 178
050
100
150200
250300
350
400450
Domestic prices
Company Researchto pass on rising raw material costs, the company had to resort to frequent price hikes in the
replacement market. Price hikes taken during FY10-12 will turn out to be good in FY13 as
domestic rubber prices have softened and are down 10% from the average price in FY12. Due
to lower raw material costs in 1QFY13, the company reported improvement of
270/480/300bps YoY in EBITDA margins of its Indian/European/South African operations at
10.3%/18.3%/4.8%, respectively.
costs to decline in FY13:
Natural Rubber prices in India have come down by 12.18% since April 2012. We expect this to
be positive for tyre companies as natural rubber accounts for 65% of raw material costs.
Further fall in raw material prices, we expect Apollo tyres to improve in E
FY13. In Q1FY13, the company had reported an improvement of 286 bps
the drop in raw material costs.
Sharp decline in rubber price since April 2012:
200 190 188 193 197 194 188
178 199 196 202 203 202183
Domestic prices international prices
Company Research
October 8, 2012
to pass on rising raw material costs, the company had to resort to frequent price hikes in the
12 will turn out to be good in FY13 as
re down 10% from the average price in FY12. Due
to lower raw material costs in 1QFY13, the company reported improvement of
270/480/300bps YoY in EBITDA margins of its Indian/European/South African operations at
Natural Rubber prices in India have come down by 12.18% since April 2012. We expect this to
be positive for tyre companies as natural rubber accounts for 65% of raw material costs.
Further fall in raw material prices, we expect Apollo tyres to improve in EBITDA margin in
286 bps YoY largely due to
184 173
168152

FY12 raw material costs break up
Source: Ace Equity
Raw material costs as a percentage of sales
Source: Ace Equity
Natural rubber prices unlikely to rise in the near term:
International rubber prices have declined 31% Since April 2012 and are down 56% from their
peak in February 2011 following slowing Chinese and US automobile sales. As the US and
China are the biggest automobile markets in the world, most of the demand for natural rubber
comes from these countries and hence there is a strong co
and automobile sales. Given the weak global scenario, rubber prices are unlikely to gain
momentum and hence we expect rubber prices to remain stable in the near term.
% of Raw material
Carbon Black
62.68%
0.00%
10.00%
20.00%
30.00%
40.00%
50.00%
60.00%
70.00%
80.00%
2008
Raw material as a % of Sales
Company ResearchFY12 raw material costs break up
Raw material costs as a percentage of sales
Natural rubber prices unlikely to rise in the near term:
International rubber prices have declined 31% Since April 2012 and are down 56% from their
following slowing Chinese and US automobile sales. As the US and
China are the biggest automobile markets in the world, most of the demand for natural rubber
comes from these countries and hence there is a strong co-relation between rubber prices
obile sales. Given the weak global scenario, rubber prices are unlikely to gain
momentum and hence we expect rubber prices to remain stable in the near term.
10.16
5.58
11.21
7.1362.11
% of Raw material
Carbon Black Chemicals Fabric Others Rubber
68.44%
56.58%60.31%
66.38%
2009 2010 2011 2012
Raw material as a % of Sales
Company Research
October 8, 2012
International rubber prices have declined 31% Since April 2012 and are down 56% from their
following slowing Chinese and US automobile sales. As the US and
China are the biggest automobile markets in the world, most of the demand for natural rubber
relation between rubber prices
obile sales. Given the weak global scenario, rubber prices are unlikely to gain
momentum and hence we expect rubber prices to remain stable in the near term.
61.83%
Q1FY13

Company Research
October 8, 2012
Radial tyres are more cost – effective
The initial price of radial tyres is around 20-25 percent more than crossply tyres and it is
feasible to retread them only twice as compared to the cross-ply tyres, which can be retreaded
three times. the running life of a radial tyre is estimated to be around 40 percent more than a
cross-ply tyre and it gives higher fuel efficiency because of lower wear and tear and higher
resistance levels according to CARE research. Radial tyres are expensive when compared to
cross- ply tyre and hence the shift towards truck and bus radial tyre is happening at slowest
pace. The demand for radial tyre has increased from OEM segment.
Tyre Industry is related with the automobile sector, if there is any slow down in the auto
sector for a longer period of time, the demand of tyres will have negative impact.
However we expect the demand from OEM to pick up in Q3FY13 as vehicle sales pick
up in the festive season.
Peer Comparsion:
Apollo Tyres MRF Ceat JK Tyres &
Inds. Good year India
Balkrishna Inds
Sales growth (5 yr CAGR) 20.97% 14.06% 10.28% 4.69% 10.49% 21.62%
Net Profit growth (5 yr CAGR) 8.85% 33.96% -35.67% -189.46% 18.37% 18.99%
EBIDTA Margin (%) 9.36% 7.79% 5.92% 4.46% 7.49% 16.92%
Net Profit Margin (%) 3.19% 5.82% 0.39% -0.51% 3.99% 8.82%
Return on Equity 15.73% 31.06% 2.77% -5.13% 22.24% 27.28%
Return on Assets 9.86% 16.24% 1.44% -1.90% 22.00% 15.43%
Return on Capital Employed 16.11% 25.87% 12.13% 6.28% 35.00% 19.98%
TTM P/E 20.52 5.41 5.13 12.84 12.07 9.64
Note: MRF Financial year ending September 2011
MRF has given superior return as compared to Apollo tyres. MRF is a market leader in the tyres
industry with a 27% market share in every segment. Whereas Apollo tyres is second largest
tyre manufacturer with a leadership position in the heavy and light commercial vehicle (LCV)
tyre segments, with a 23% and 26% market share respectively.
Over the past 5 years, Apollo tyres have seen dynamic growth in both its revenue as well as
earnings. On a consolidated basis, revenues grew at a compounded annual growth rate
(CAGR) of 20.97% while net profits grew at a CAGR of 8.85%. FY12 EBIDTA and net margins
were 9.36% and 3.19% respectively; while Return on Equity and Return on Capital employed
were 15.73% and 16.11% respectively. The company net profit margin is declining due to rise
in interest cost.

Company Research
October 8, 2012
Company is able to make a growth trend on account of the acquisitions it has made in recent
years. In other words, its growth also has some inorganic component to it. The growth for MRF
on the other hand has been all organic.
Financial Highlights:
Q-O-Q Performance (In Rs Mn)
Particulars Q1 FY13 Q1 FY12 YoY (%) Q4 FY12 QoQ (%)
Net Sales 31647.02 28224.09 12.13% 32313.97 -2.06%
Expenditure 28131.12 25896.07 8.63% 28711.68 -2.02%
as % of sales 88.89% 91.75% 88.85%
Consumption of RM 19567.97 18629.13 5.04% 20929.38 -6.50%
% of Sales 61.83% 66.00% 64.77%
Employee Cost 3881.99 3433.42 13.06% 3022.82 28.42%
% of Sales 12.27% 12.16% 19.90%
other Expenditure 4681.16 3833.52 22.11% 4759.48 -1.65%
% of Sales 14.79% 13.58% 14.73%
EBIDTA 3515.9 2328.02 51.03% 3602.29 -2.40%
Depreciation 935.54 753.68 24.13% 901.81 3.74%
EBIT 2580.36 1574.34 63.90% 2700.48 -4.45%
Other Income 98.37 116.81 -15.79% 263.09 -62.61%
Interest 750.62 642.52 16.82% 868.12 -13.53%
EBT 1928.11 1048.63 83.87% 2095.45 -7.99%
TAX EXPENSES 539.19 273.57 97.09% 514.91 4.72%
PAT 1388.92 775.06 79.20% 1580.54 -12.12%
EPS 2.74 1.53 79.08% 3.11 -11.90%
Margins (%)
EBIDTA 11.11% 8.25% 286 bps 11.15% (4 bps)
EBIT 8.15% 5.58% 258 bps 8.36% (20 bps)
EBT 6.09% 3.72% 238 bps 6.48% (39 bps)
PAT 4.39% 2.75% 164 bps 4.89% (50bps)
Source: Ace equity
Segment Quarterly Summary
Segment Details (Rs. Mn) Q1 FY13 Q1 FY12 YoY (%) Q4 FY12 QoQ (%)
Europe
Net Sales 6,496.29 6,035.24 7.64% 6,773.84 -4.10%
EBIT 930.52 589.17 57.94% 1,190.20 -21.82%
Margins (%) 14.32% 9.76% 17.57%
India
Company Research
October 8, 2012
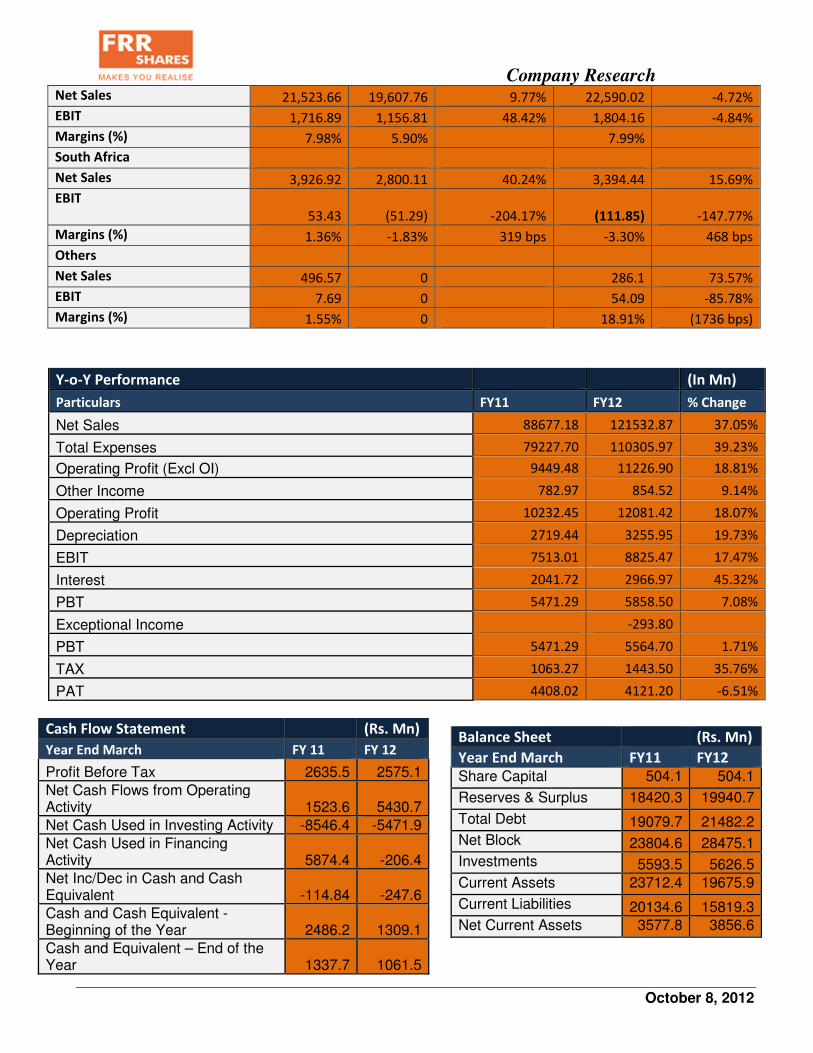
Net Sales 21,523.66 19,607.76 9.77% 22,590.02 -4.72%
EBIT 1,716.89 1,156.81 48.42% 1,804.16 -4.84%
Margins (%) 7.98% 5.90% 7.99%
South Africa
Net Sales 3,926.92 2,800.11 40.24% 3,394.44 15.69%
EBIT
53.43
(51.29) -204.17%
(111.85) -147.77%
Margins (%) 1.36% -1.83% 319 bps -3.30% 468 bps
Others
Net Sales 496.57 0 286.1 73.57%
EBIT 7.69 0 54.09 -85.78%
Margins (%) 1.55% 0 18.91% (1736 bps)
Y-o-Y Performance (In Mn)
Particulars FY11 FY12 % Change
Net Sales 88677.18 121532.87 37.05%
Total Expenses 79227.70 110305.97 39.23%
Operating Profit (Excl OI) 9449.48 11226.90 18.81%
Other Income 782.97 854.52 9.14%
Operating Profit 10232.45 12081.42 18.07%
Depreciation 2719.44 3255.95 19.73%
EBIT 7513.01 8825.47 17.47%
Interest 2041.72 2966.97 45.32%
PBT 5471.29 5858.50 7.08%
Exceptional Income -293.80
PBT 5471.29 5564.70 1.71%
TAX 1063.27 1443.50 35.76%
PAT 4408.02 4121.20 -6.51%
Balance Sheet (Rs. Mn)
Year End March FY11 FY12
Share Capital 504.1 504.1
Reserves & Surplus 18420.3 19940.7
Total Debt 19079.7 21482.2
Net Block 23804.6 28475.1 Investments 5593.5 5626.5
Current Assets 23712.4 19675.9
Current Liabilities 20134.6 15819.3 Net Current Assets 3577.8 3856.6
Cash Flow Statement (Rs. Mn)
Year End March FY 11 FY 12
Profit Before Tax 2635.5 2575.1
Net Cash Flows from Operating Activity 1523.6 5430.7
Net Cash Used in Investing Activity -8546.4 -5471.9
Net Cash Used in Financing Activity 5874.4 -206.4
Net Inc/Dec in Cash and Cash Equivalent -114.84 -247.6
Cash and Cash Equivalent - Beginning of the Year 2486.2 1309.1
Cash and Equivalent – End of the Year 1337.7 1061.5

Company Research
October 8, 2012
Valuation-
• In the standalone operations, the replacement demand is relatively stronger than the OEM
demand. We expect this trend to continue in the near term and expect OEM demand to pick-up
over the medium term. Further margins are expected to remain stable in the near term.
• In South Africa, the economic situation remains challenging but the company is hopeful of
volume growth. During the quarter, the company almost broke even at the net profit level.
• In Europe, volumes are under pressure and there is no major volume growth expectation in
FY13. However, the European operation can surprise positively on the EBITDA margin front as
2Q and 3Q are strong quarters due to demand coming from winter tyres.
• So over all the volumes are expected to remain slightly under stress but there can be positives
on the margin front.
• We are anticipating the rubber prices to fall in near future which will help the company to improve
its profitability thus, we expect FY13 EPS to be at Rs. 12 and estimate P/E to be 8.85 times thus
target for the stock is Rs 106.2. At the current market price of Rs 89.70, the stock trades at
about 7.48 times its likely FY13 per share. We recommend you to ‘ACCUMULATE the stock at
Rs. 75 or lower'. Given the company’s stable balance sheet, expanding product range,
expanding product market and steady growth, we believe these valuations provide a good entry
point for long term investors.
Disclaimer:
The information in this document has been printed on the basis of publicly available information,
internal data and other reliable source believed to be true and is for general guidance only. While every
effort is made to ensure the accuracy and completeness of information contained, the company makes no
guarantee and assumes no liability for any errors or omissions of the information. No one can use the
information as the basis for any claim, demand or cause of action. FRR Shares And Securities Ltd., and
affiliates, including the analyst who have issued this report, may, on the date of this report, and from time
to time, have long or short positions in, and buy or sell the securities of the companies mentioned herein
or engage in any other transaction involving such securities and earn brokerage or compensation or act as
advisor or have other potential conflict of interest with respect to companies mentioned herein or
inconsistent with any recommendation and related information and opinions. FRR Shares And Securities
Ltd. and affiliates may seek to provide or have engaged in providing corporate finance, investment
banking or other advisory services in a merger or specific transaction to the companies referred to in this
report, as on the date of this report or in the past.