company presentation - february · pdf filethat otherwise relate to objectives, strategies,...
TRANSCRIPT

Company Presentation - February 2013

2
Statements included or incorporated in these materials that use the words "believe", "anticipate", "estimate", "target", or "hope", or
that otherwise relate to objectives, strategies, plans, intentions, beliefs or expectations or that have been constructed as statements as
to future performance or events, are "forward-looking statements" within the meaning are not guarantees of future performance and
involve risks and uncertainties that could cause actual results to differ materially from historical results or those anticipated at the time
the forward-looking statements are made. MINT undertakes no obligation to publicly update or revise any forward-looking statement,
whether as a result of new information, future events or otherwise. MINT makes no representation whatsoever about the opinion or
statements of any analyst or other third party. MINT does not monitor or control the content of third party opinions or statements and
does not endorse or accept any responsibility for the content or the use of any such opinion or statement.
FORWARD LOOKING STATEMENT Disclaimer

Agenda 2012 Performance Recap
Hotel & Mixed Use Business Restaurant Business
Other Important Information
Avani Sepang Goldcoast Resort, Malaysia
2012 Performance Recap

Performance Recap ANOTHER RECORD-HIGH PERFORMANCE
MINT REPORTED RECORD-HIGH NET PROFIT OF THB 3.4 BILLION, A 78% INCREASE YoY EXCLUDING EXTRAORDINARY ITEMS (18% INCREASE FROM REPORTED NET PROFIT), ATTRIBUTABLE TO IMPROVEMENT OF ALL THREE BUSINESS UNITS, ESPECIALLY FROM THE HOTEL & MIXED USE BUSINESS, WHICH INCLUDES IMPROVED CORE HOTEL OPERATIONS TOGETHER WITH STRONG PERFORMANCE OF ANANTARA KIHAVAH AND ST. REGIS HOTEL, THE NOW PROFITABLE ANANTARA VACATION CLUB AND THE CONSOLIDATION OF OAKS.
5
1,000
2,000
3,000
4,000
2011A Hotel & Mixed Use Restaurant Retail Trading 2012A
One-time items
2,880
3,409
1,919
NPAT (THB Million)
5%
6%
7%
8%
9%
10%
11%
2011A Hotel & Mixed Use Restaurant Retail Trading 2012A
10.3%
7.0%*
NPAT Margin
+78% YoY (Excl one-time items)
* Excludes gain on reclassification of investments in S&P, netted off with impairment charge of China business

9.5%
Complete by 2015 64% of Total 50% of Total
KEY 2012 FINANCIAL & OPERATIONAL TARGETS ACHIEVED ALL KEY 2012 TARGETS ARE ACHIEVED / ON TRACK.
6
2011 Actual 2012 Target 2012 Actual
NPAT Growth
ROIC
Int’l Contribution - Revenue
Int’l Contribution - NPAT
Hotel Occupancy
Hotel ADR
Hotel RevPar
Sale of St. Regis Residences
Hotel Acquisition
Restaurant SSS Growth
Restaurant Outlet Expansion
Organic Revenue Growth
Sale of AVC
Restaurant Acquisition
55%* 15-20% p.a. 78%*
14.7%* >15% by 2016 13.2%
24% 40% by 2016 29%
7% 50% by 2016 21%
65% ~70% 69%
-5% ~0-3% 4%
17% High Single Digit 11%
49% of Total Complete by 2013 73% of Total
USD 19mn USD 40+ mn USD 51mn
Oaks N/A Bundarika
9.0% 4-5% 5.5%
8-10% 9.9%
11%* 12-15% 13%*
Ribs & Rumps; Remaining 30% of Thai Express;
Additional 5% of S&P N/A Riverside
On Track
On Track
On Track
On Track
Sale of The Estate Samui
Note: * Exclude one time items: gain in reclassification of investment in S&P, netted off with impairment charge of China business in 2011
On Track
Performance Recap

Hotel & Mixed Use Business
Pool Villa, Anantara Vacation Club Phuket

Key Development IMPROVING HOTEL OPERATIONS
ALL HOTEL STATISTICS SAW IMPRESSIVE IMPROVEMENTS YoY IN 2012. 2012 REVPAR IS STILL BELOW THE 2008 PEAK LEVEL BECAUSE OF THE CHANGE OF MIX WITH THE ADDITION OF OAKS. NEVERTHELESS, THE NOTABLY HIGHER NUMBER OF ROOMS IN THE PORTFOLIO LED TO A SUBSTANTIAL INCREASE IN TOTAL REVENUE AMOUNT.
8
THB
* Note: Hotel Statistics include Oaks Hotel & Resort
NUMBER OF HOTEL ROOMS
0
3,000
6,000
9,000
12,000
2008 2009 2010 2011 2012
MLR
Managed
Joint-venture
Owned3,102
3,552 4,114
9,575 10,348
OCCUPANCY
65%
52% 52%
65% 69%
20%
40%
60%
80%
2008 2009 2010 2011 2012
ADR
6,339 5,880 5,695
5,385 5,589
2,000
4,000
6,000
8,000
2008 2009 2010 2011 2012
REVPAR
4,142
3,076 2,976
3,479
3,871
1,000
2,000
3,000
4,000
5,000
2008 2009 2010 2011 2012
THB
THB
+4% YoY
+11% YoY
+8% YoY
+4% YoY

COMPANY OWNED HOTELS – 2012 TO DATE
THE ADDITION OF OWNED HOTELS WILL SUPPORT MINT’S STRATEGY TO GROW REVENUE AND NET PROFIT SIZE OF THE HOTEL BUSINESS. MINT CONTINUES TO LOOK FOR OPPORTUNITIES TO EXPAND ITS OWNED HOTEL PORTFOLIO IN THE RIGHT MARKETS.
9
Acquisition of Bundarika, Phuket (To be rebranded to Anantara)
• 15 minutes south of Phuket International Airport
Expected Launch Date:
• 2H13
• 77 keys on 23 rais of beachfront land
• Hoi An: a short walk from Ancient Town
• Quy Nhon: private beach
Location:
Size:
Location:
• Currently in operation, but rebranding expected to be within 6-12 months
• South- west coast of Sri Lanka
Launch Date: • Oct 2012
• 105 keys of beachfront land
Location:
Size:
• South- west coast of Sri Lanka
Expected Launch Date:
• 2014
• 60 keys on 6 rais of beachfront land
Location:
Size:
Size: • Hoi An: 96 keys • Quy Nhon: 63 keys
Ambalangoda
Key Development
PHUKET
KALUTARA, SRI LANKA
VIETNAM
AMBALANGODA, SRI LANKA
Acquisition of Life Resorts, Vietnam (Hoi An to be rebranded to Anantara, Quy Nhon to be rebranded to Avani)
Expected Launch Date:
Kani Lanka in Sri Lanka has successfully been rebranded to Avani Acquisition of Paradise Island Resorts, to be constructed into Avani
Bentota
Kalutara

HOTEL MANAGEMENT – 2012 TO DATE
AS MINT’S OWN BRANDS – ANANTARA, AVANI AND OAKS – GAIN THEIR RECOGNITION IN THE MARKET, MINT CONTINUES TO EXPAND ITS HOTEL MANAGEMENT PORTFOLIO. ASSET LIGHT HELPS SUPPORT MINT’S OVERALL STRATEGY IN THE IMPROVEMENT OF PROFITABILITY AS WELL AS IMPROVEMENT OF ROIC.
10
Egypt
Key Development
Eastern Mangroves Hotel & Spa by Anantara, Abu Dhabi
222 Rooms / Opened June 2012
Avani Sepang Goldcoast Resort, Malaysia 315 Rooms / Operated Nov 2012
Anantara Bali Uluwatu Resort & Spa 77 Rooms / Opened June 2012
Anantara Sanya Resort & Spa, China 122 Rooms / Opened Nov 2012
Oaks Bangkok Sathorn 115 Rooms / Opened Oct 2012

FURTHER ENHANCEMENT OF REVPAR
MINT CONTINUES TO STRENGTHEN ITS MARKETING AND DISTRIBUTION CHANNELS TO ENSURE CONTINUOUS GROWTH GOING FORWARD. MINT CONSISTENTLY LOOKS FOR CREATIVE WAYS TO FURTHER STRENGTHEN ITS EXISTING CUSTOMER BASE AS WELL AS INITIATES ITS PRESENCE IN NEW MARKETS.
11
Add sales offices in key strategic markets: 4 new sales offices in 2012 - China, Russia, India and UAE
Increase road shows in non-conventional markets
Initiate PR activities including face-to-face visits to key media regionally & internationally to increase awareness
Organize “Familiarization Trips” for travel agents and journalists to experience the properties
Strengthen Sales & Marketing Capability
Anantara.com website was upgraded with advanced internet booking engine
Increase conversion rate on-line using social media network
Increase On-Line Booking
Going Forward
Sales offices Sales offices opened in 2012

STRENGTHENING OF HOTEL’S NON-TRADITIONNAL MARKETS
ALTHOUGH CHINA AND RUSSIA REPRESENTED ONLY 10% OF MINT’S TOTAL FEEDER MARKETS BASED ON ROOM NIGHTS IN 2012, THE YIELDS THEY GENERATED WERE RELATIVELY MUCH HIGHER AS THEY MOSTLY STAYED AT HIGHER-ROOM-RATE HOTELS, E.G. IN MALDIVES AND PHUKET.
Going Forward
12
MINT’s 2012 Feeder Markets
China 6% Russia
4%
Others 90%
Maldives Hotels
19% Anantara
& JW Marriott Phuket
8% Four Seasons Group 17%
St. Regis 5%
Others 51%
Maldives Hotels
26%
Anantara & JW
Marriott Phuket
34%
Four Seasons Group
3%
St. Regis 1%
Others 36%
Average ADR*: Bt 10,058 Average ADR*: Bt 15,929
Average ADR: Bt 5,589
* The pie charts include total room nights of MINT hotel portfolio (excluding Oaks), while average daily rates of China and Russia markets are calculated from Maldives hotels, Anantara Phuket, JW Marriott Phuket, Four Seasons group and St. Regis (excluding others)

OAKS HOTELS & RESORTS – 2012 TO DATE
SINCE MINT’S STRATEGIC ACQUISITION OF OAKS, OAKS CONTINUES TO GROW BOTH WITHIN AUSTRALIA AND NEW MARKETS. OAKS WILL REMAIN ONE OF MINT’S MAJOR CONTRIBUTORS GOING FORWARD.
13
• Grand Hotel, Gladstone, to become a 140-room hotel (by 2013)
• 50% stake in Tidal Swell, the owner of four properties currently managed by Oaks
• Oasis Resort Caloundra, 158 hotel rooms and 9 apartments, together with MLR in Sunshine Coast
• Oaks Hyde Park Plaza, Sydney, 13 units
OAKS’ CONTRIBUTION TO MINT’S HOTEL & MIXED-USE BUSINESS IS SIGNIFICANT
2011 2012
Others
Oaks
OAKS’ REVENUE CONTRIBUTION TO TOTAL HOTEL
& MIXED-USE
OAKS’ EBITDA CONTRIBUTION TO TOTAL HOTEL
& MIXED-USE 23%
77%
31%
69%
32%
68%
2011 2012
Others
Oaks
23%
77%
31%
69%
Key Development
SELECTIVE ASSETS ACQUISITIONS ADDITIONAL MLR CONTRACTS
• Broome (140 rooms)
• Monkomo (56 rooms)
• Regis (90 rooms)
• William Street (220 rooms)
• New greenfield development to be settled between 2014 - 2015 • Oaks Carlyle (87 rooms) • Oaks Milton (298 rooms) • Oaks River Marque (152 rooms) • Oaks Emerald (120 rooms)
Oaks Bangkok Sathorn
EXPANSION OF OAKS OUTSIDE OF ITS HOME MARKETS
• First move into Asia through management contract of Oaks Bangkok Sathorn with 115 rooms (previously part of Anantara Sathorn)
• Opening Oaks Sanya in China and Oaks Liwa Suites in Abu Dhabi in 2013
OAK’S POST-ACQUISITION STRATEGIES

14
EXPANSION INTO MARKETS INSIDE AND OUTSIDE THAILAND WILL CONTRIBUTE WELL TO REVENUE & PROFIT IN COMING YEARS.
MINT’S HOTEL EXPANSION PLANS
Hotel Investment
2014
10 Hotels / 830 Rooms
• Xishuangbanna, China (103 Rooms)
• Layan, Thailand (77 Rooms)
• Doha, Qatar (117 Rooms)
• Palm Jumeirah, UAE (293 Rooms)
• Chengdu, China (150 Rooms)
• Al Yamm, UAE (30 Rooms)
• Al Sahael, UAE (30 Rooms)
20 Hotels & Properties / 2,323 Rooms
Management Contract
2013
Total
• Masai Mara Camp,
Kenya (16 Rooms)
• Amboseli Camp,
Kenya (16 Rooms)
• Grand Hotel,
Gladstone
Australia
(96 Rooms)
• Phuket –
Bundarika
(77 Rooms)
• Hoi An,
Vietnam
(96 Rooms)
• Sri Lanka
(141 Rooms)
• Chongqing, China (150 Rooms)
• Baoting, China (130 Rooms)
• Salalah, Oman (136 Rooms)
• Luang Prabang, Laos (115 Rooms)
• Al Akhdar, Oman (123 Rooms)
• Al Madina, Oman (120 Rooms)
• Mahabalipuram, India (130 Rooms)
• Qiandao Lake, China (120 Rooms)
• La Chaland, Mauritius (160 Rooms)
• Bangkok
(249 Rooms)
2015
• Ambalangoda,
Sri Lanka
(60 Rooms)
• Meru, Kenya
(16 Rooms)
• Sanya, China
(120 Rooms)
• Liwa Suites,
Abu Dhabi
(54 Rooms)
• William St.,
Melbourne
(220 Rooms)
• Udaipur, India (70 Rooms)
• Wayanad, India (95 Rooms)
• Quy Nhon,
Vietnam
(63 Rooms)
Going Forward
• Carlyle
(87 rooms)
• Milton
(298 rooms)
• Emerald
(120 rooms)
In the
process of
negotiation

2011 2012
2011 2012
Residential Properties
RESIDENTIAL PROPERTIES & AVC – 2012 TO DATE
REAL ESTATES IS ANOTHER IMPORTANT DRIVER, WITH REVENUE CONTRIBUTION OF APPROXIMATELY 20% TO THE HOTEL AND MIXED USE BUSINESS. WHILE WE PLAN A PIPELINE OF RESIDENTIAL PROPERTIES TO ENSURE THE CONTINUATION OF THE REVENUE FROM THE BUSINESS, AVC WILL HELP FURTHER STRENGTHEN THE REVENUE STREAM OF THE REAL ESTATES BUSINESS IN THE LONG TERM.
15
Anantara Vacation Club
Sold 64%
Inventory 36%
Sold 73%
Inventory 27%
Thailand 22%
Singapore 19%
Hong Kong 12%
Malaysia 11%
China 9%
Australia 4%
Japan 3%
UAE 2%
Others 18%
AVC Members
Revenue
Net Profit
Key Development
2006 2007 2008 2009 2010 2011 2012
22
46
59
2010 2012 Jan 2013
Inventories
Samui Phuket
Bangkok Bali
Queenstown
Phuket (Purpose-built)
Sanya + +

DRIVING ANANTARA VACATION CLUB
SALES OF AVC ARE EXPECTED TO CONTINUE RISING SIGNIFICANTLY WITH BOTTOM LINE STARTING TO CONTRIBUTE STRONGLY TO THE GROUP’S PROFITABILITY IN 2013-2014
16
Thailand
New Zealand
Bali
Sri Lanka
Middle East
Australia
China
Mauritius
Maldives
South Africa
More Inventories in More Destinations Horizontal Expansion into New Markets
Stable Revenue Stream
Bangkok Phuket Samui
Bali
+
4Q10A 2011A 2012A 2013E 2017E
22 +3 +21
+>100
22 25 46 >146 Up to 400 in 10 Destinations
Key focus for 2013 includes China and potentially the Middle East
Bangkok, Samui, Phuket, Bali, Queenstown, China
Vertical Efficiency to Maximize Profit
Improve efficiency of sales & marketing
Learn & better understand new markets
Cost & expenses to be gradually driven down by scale
Going Forward
2011 2012 2013F 2014F 2015F 2016F 2017F
Revenue
Sales Offices
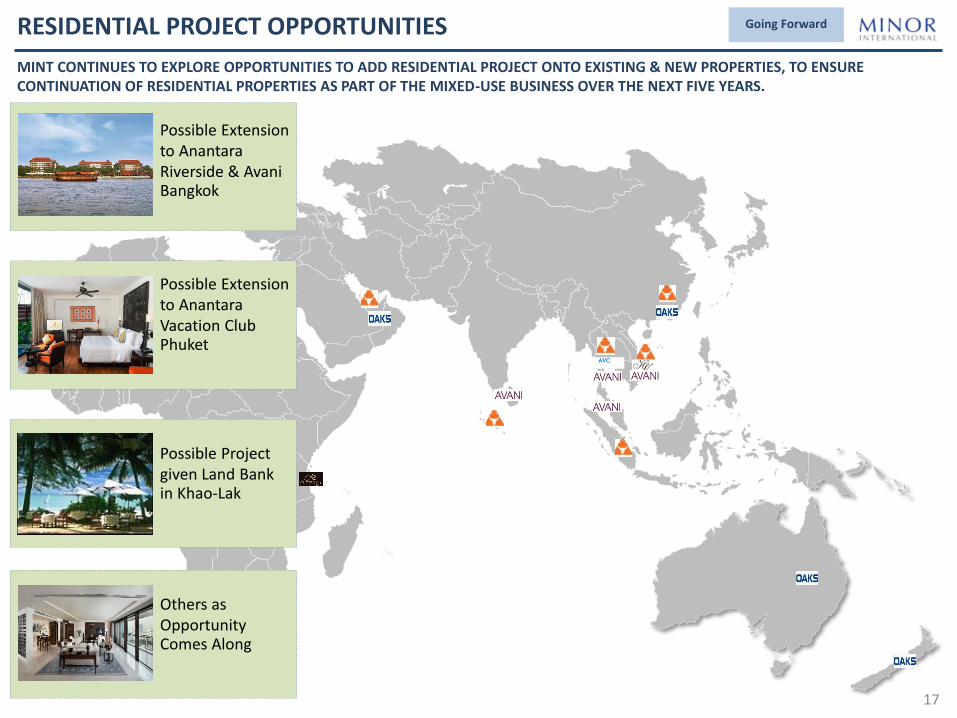
RESIDENTIAL PROJECT OPPORTUNITIES
17
Egypt
AVC
Egypt
Possible Extension to Anantara Riverside & Avani Bangkok
Possible Extension to Anantara Vacation Club Phuket
Possible Project given Land Bank in Khao-Lak
Others as Opportunity Comes Along
MINT CONTINUES TO EXPLORE OPPORTUNITIES TO ADD RESIDENTIAL PROJECT ONTO EXISTING & NEW PROPERTIES, TO ENSURE CONTINUATION OF RESIDENTIAL PROPERTIES AS PART OF THE MIXED-USE BUSINESS OVER THE NEXT FIVE YEARS.
Going Forward

Restaurant Business

SSS & TSS Growth
RESTAURANT SALES GROWTH
RESTAURANT BUSINESS CONTINUES TO SEE ROBUST AND STABLE GROWTH. SAME-STORE-SALES SHOWED REASONABLE GROWTH IN 2012, ON THE BACK OF STRONG DOMESTIC CONSUMPTION IN THAILAND, TOGETHER WITH EFFECTIVE MARKETING CAMPAIGNS.
19
7.8%
12.3%
9.8%
6.5%
7.6% 6.5%
3.3%
4.6%
11.9%
17.4%
14.4%
12.7%
16.0%
13.6% 12.5%
11.4%
0%
5%
10%
15%
20%
1Q11 2Q11 3Q11 4Q11 1Q12 2Q12 3Q12 4Q12
Same Store Sales Growth Total System Sales Growth
Key Development
1,043 1,112 1,148 No. of Outlets
1,257
3.9%
-2.7%
3.7%
9.0%
5.5%
19.1%
11.9%
9.8%
14.1% 15.1%
-5%
0%
5%
10%
15%
20%
2008 2009 2010 2011 2012
1,381
Top 3 2012 TSS:
Dairy Queen 30.2%
(SSS 17.5% + 17.5% outlet expansion)
Swensen’s 18.9%
(SSS 10.7% + 5.2% outlet expansion)
The Pizza Company 14.6%
(SSS 5.9% + 5.4% outlet expansion)

RESTAURANT OUTLET EXPANSION
MINT CONTINUES TO EXPAND NUMBER OF OUTLETS BY 8-10% PER ANNUM, WITH THE FOCUS PRIMARILY ON MARKETS THAT WE ALREADY HAVE PRESENCE IN.
20
SSS & TSS
2005 2011 2012 2017F
2005 2011 2012 2017F
34%
66%
34%
66% 7%
93%
36%
64% 558
2,749
Restaurant Outlets Breakdown by Geography
43%
57% 14% 86%
45%
55%
1,381
558
2,749
Restaurant Outlets Breakdown by Ownership
Franchised
Owned
1,257
1,257
45%
55%
1,381
Key Development
International
Thailand
2012 New Markets Expansion
+9.9% YoY
+9.9% YoY
Two equity-owned Swensen’s
outlets in the Maldives
First franchised The Coffee Club outlet in Egypt
First flagship The Coffee Club outlet
in Bangkok
Acquisition of Beijing Riverside & Courtyard in
China

RESTAURANT HIGHLIGHTS
MINT CONTINUES TO IMPROVE THE OPERATIONS OF ITS EXISTING FOOD BRANDS, WHILE LOOKING FOR OPPORTUNITIES TO ADD NEW BRANDS AND NEW CONCEPTS TO ITS ALREADY DIVERSE PORTFOLIO.
21
Key Development
Offered product variation with the aim to capture new
customers through the launch of its very own fried chicken
Developed store segmentation with
renovation of stores into new concept
Strengthened Western Dining Positioning
Aggressively expanded domestic franchising with additional 53 franchised
stores in 2012
Launched BK Grill concept at all stores
Continued efforts in the integration of Ribs and
Rumps since the acquisition
Rationalized outlets, relaunched Xin Wang menus
and put in place new management
Added Beijing Riverside to the portfolio through the
acquisition

BEIJING RIVERSIDE & COURTYARD
AS PART OF MINT’S FIVE-YEAR STRATEGY, IN ADDITION TO ORGANIC GROWTH, MINT ALSO LOOKS FOR ACQUISITION OPPORTUNITIES. MINT ACQUIRED BEIJING RIVERSIDE AT THE END OF 2012 WITH PLANS TO EXPAND BOTH IN ITS HOME COUNTRY, CHINA, AND POTENTIALLY INTO OTHER COUNTRIES.
22
Key Development
Basic Information
• Established in 2005
• Distinctive chain of casual-concept restaurants in China, specializing in Sichuan barbecue fish
• 21 restaurants across Beijing and Shanghai
Ownership
• Initial 49% stake, with MINT holding the majority of the Board seats
• Another 11-30% stake in Riverside in two years, subject to a performance hurdle
• The remaining shares of Riverside will continue to be held by the original founders
Investment Rationales
• China is a country of vast opportunities that arise from its rapidly growing middle class, accumulation of wealth, and increasing domestic consumption
• Riverside is already profitable, and therefore will bring in immediate earnings contribution to MINT
• Back office of the China operations will be combined for higher efficiency
• The acquisition will be a turning point MINT’s China food business operationally and financially in 2013
952
MINT RestaurantRevenues
100% ofRiverside
13,192
2012 Comparative Revenues
• Although contribution from Riverside is small initially, it is expected to become more meaningful as aggressive pace of growth is expected THB
Million

GROWING THAILAND RESTAURANT BUSINESS
THAILAND CONSUMPTION WILL CONTINUE TO GROW WITH THE EXPANSION OF THE MIDDLE CLASS, AS WELL AS URBANIZATION. MINT’S RESTAURANT BUSINESS WILL CONTINUE TO EXPAND WITH MALL OPERATORS.
23
34% 40%
2010 2020F
17% 41%
2009 2020F
+6pp
+24pp
Going Forward
Mid- to High Income Households % of Total
Urban Population % of Total Expansion of Mall Operators
Source: World Health Organization, National Statistical Office, Central Intelligence Agency
Key Strategies
Continue to expand outlets, in particular through franchise model in upcountry
Continue to improve efficiencies through distribution centers
Develop and expand new products

FURTHER GROWING RESTAURANT’S INTERNATIONAL BUSINESS
INTERNATIONAL BUSINESS CONTINUES TO BE A MAJOR PART OF MINT’S RESTAURANT BUSINESS. MINT WILL EXPAND PRIMARILY IN ITS MAJOR MARKETS – SINGAPORE, AUSTRALIA AND CHINA – AS WELL AS INTO OTHER COUNTRIES IN THE REGION.
24
Egypt
International Franchise China
Singapore Australia
Going Forward
Continue to grow existing markets
Expand into new markets including the Middle East and Indochina
Expand Riverside concept
Grow Sizzler while rationalize The Pizza Company
Selectively look for opportunities for Thai Express and The Coffee Club
Consolidate back office operations for efficiency
Expand Thai Express equity stores in Southeast Asia
Develop and introduce new concept under Thai Express Group
Continue the integration of Ribs and Rumps
Expand The Coffee Club franchise in the domestic Australian market
Internationalize The Coffee Club

Other Important Information

RETAIL TRADING
RETAIL TRADING BUSINESS SEES SIGNS OF IMPROVEMENT WITH STRONG SAME STORES SALE GROWTH IN THE FOURTH QUARTER OF 2012. MINT CONTINUES TO EXPAND ITS CURRENT BRAND PORTFOLIO, DESPITE THE CLOSING OF THREE COSMETICS BRANDS UPON EXPIRATION OF DISTRIBUTION CONTRACTS.
26
SSS & TSS
SSS & TSS - Quarterly
2011A Fashion Cosmetics Household 2012A
246
+20 -29
235
Number of Points of Sale
17.2%
52.8%
29.4%
-11.5% -6.8% -4.4% -10.1%
7.2%
21.0% 43.0%
26.0%
-4.0% 5.0%
23.0%
16.3%
24.2%
-20%
0%
20%
40%
60%
1Q11 2Q11 3Q11 4Q11 1Q12 2Q12 3Q12 4Q12
5.5%
-16.5%
14.4% 14.6%
-2.1%
9.0%
-17.0%
16.8% 18.9%
14.6%
-20%
-10%
0%
10%
20%
2008 2009 2010 2011 2012
-2
+6
+3
+2
+3
+2
+4
+3
-14
-12
-6
Three cosmetics brands have been closed
down during 2012 as distribution contracts
expired
Key Development
Comparable Sales Growth Total Store Sales Growth

SUSTAINABILITY PROGRAM
27
Focus on “Top Talent Development” across
Organization
Created Strategic CSR Platform around
Community Priorities that are Related to Our
Business:
• Education – English program at schools/ universities
• Hospitality Skills Development – top talent be assigned as trainer in the university
• Agriculture – support our farmers • Environment – manage the
environment impacts, especially at our hotel sites
MINT SEES SUSTAINABILITY AS A CRUCIAL PART OF ITS STRATEGY. THE GOAL IS TO DEVELOP FUTURE LEADERS TO SUSTAIN MINT’S SUCCESS AND IMPROVE COMMUNITIES’ AND THE COUNTRY’S HUMAN CAPITAL.
Going Forward

-
2.0
4.0
6.0
8.0
-
2,000
4,000
6,000
8,000
10,000
2012 2013F 2014F 2015F 2016F 2017F
28
CAPEX & BALANCE SHEET STRENGTH
IN ADDITION TO COMMITTED CAPEX, MINT ALSO SET ASIDE ADDITIONAL CAPEX FOR FUTURE ACQUISITIONS AND NEW INITIATIVES. WITH ITS BALANCE SHEET STRENGTH, MINT WILL BE ABLE TO FINANCE ITS CAPEX REQUIREMENTS.
Committed CAPEX & New Opportunities Leverage Ratios
X THB million
Additional CAPEX (non-committed average per annum) for New Opportunity/Acquisition(s)
Restaurant Hotel & Mixed-use Retail trading
EBITDA coverage on committed CAPEX
Going Forward
1.06
1.25
0.0
0.2
0.4
0.6
0.8
1.0
1.2
1.4
1Q11 2Q11 3Q11 4Q11 1Q12 2Q12 3Q12 4Q12
Interest Bearing Debt to Equity
Net Interest Bearing Debt to Equity
Internal Policy
X
Interest Bearing Debt to Net Replacement Value
* Incremental capital increase from MINT W-4 exercise, assuming 100% MINT-W4 Conversion
THB million
Back-up Financing
0
10,000
20,000
30,000
40,000
50,000
Outstanding Borrowing &Equity
Un-Utilized Facility
Debt Debt
Shareholders’ Equity
Equity*

FIVE-YEAR ASPIRATIONS
29
22 hotels
676 restaurants
316 retail shops & POS
(14,524 Sqm)
2007
82 hotels
67 residences built to date
46 timeshare units
1,381 restaurants
235 retail shops & POS
(20,062 Sqm)
2012
> 140 hotels
> 200 residences built to date
> 400 timeshare units
> 2,700 restaurants
> 260 retail shops & POS
(>23,000 Sqm)
2017F
NPAT (THB) 1.6bn
1.6bn 3.4bn
Going Forward

MINT’S FIVE-YEAR STRATEGY 2013-2017
MINT’S FIVE-YEAR STRATEGY WAS FORMULATED MAINLY BASED ON THE FOLLOWING THREE KEY PILLARS, WITH CLEAR GOALS AS WELL AS MEASUREMENTS.
30
Going Forward
NPAT growth of ~15-20% CAGR ROIC of >15%
Growth Pillars
Measure-ments
Drive Profitable Portfolio of Own Brands
Continually Enhance Asset Productivity
Expand Internationally Through Strategic
Investments & Acquisitions
Asset-light
Model
Mixed-use
Initiatives
Total-system-sales growth of over 15%
Revenues growth
of over 10%
Improvement of margins
Revenues from overseas of over 40%
Net profit from overseas
of 50%
2017 Goals

Appendix
Anantara Sanya Resort And Spa, China

-
2,000
4,000
6,000
8,000
10,000
1Q11 2Q11 3Q11 4Q11 1Q12 2Q12 3Q12 4Q12
Restaurant Hotel & Mixed-Use
Retail Trading Gain on Reclassification
32
4Q12 & 2012 Results 2012 REVENUE INCREASE OF 21%
THB million +21% YoY (Excl S&P Gain)
6,679
MINT REPORTED 2012 REVENUE INCREASE OF 21% YoY (EXCLUDING ONE-TIME GAIN), ATTRIBUTABLE TO STRONG PERFORMANCE OF HOTEL & MIXED-USE AND RESTAURANT BUSINESSES, FULL OPERATIONS OF ANANTARA KIHAVAH IN THE MALDIVES AND ST. REGIS HOTEL BANGKOK, INCREASED POPULARITY OF ANANTARA VACATION CLUB, TOGETHER WITH FULL YEAR CONSOLIDATION OF OAKS.
6,278
8,030
of Investment in S&P
7,345
8,768*
Restaurant 40%
Hotel & Mixed-Use
50%
Retail Trading
10%
7,524
* Note: Revenue of Anantara Vacation Club associated with the inventory unit transfer in 1Q12 of THB 80 million has been adjusted to conform with the figures in this period
-
10,000
20,000
30,000
40,000
2011 2012
32,993
+21% YoY (Excl S&P Gain)
28,332
THB million
Restaurant
Hotel & Mixed-Use
Retail Trading 7,842
6,976
Gain on reclassification of Investment in S&P
27,278
8,859
-400
-
400
800
1,200
1,600
2,000
2,400
1Q11 2Q11 3Q11 4Q11 1Q12 2Q12 3Q12 4Q12
Restaurant Hotel & Mixed-Use
Retail Trading Gain on Reclassification
33
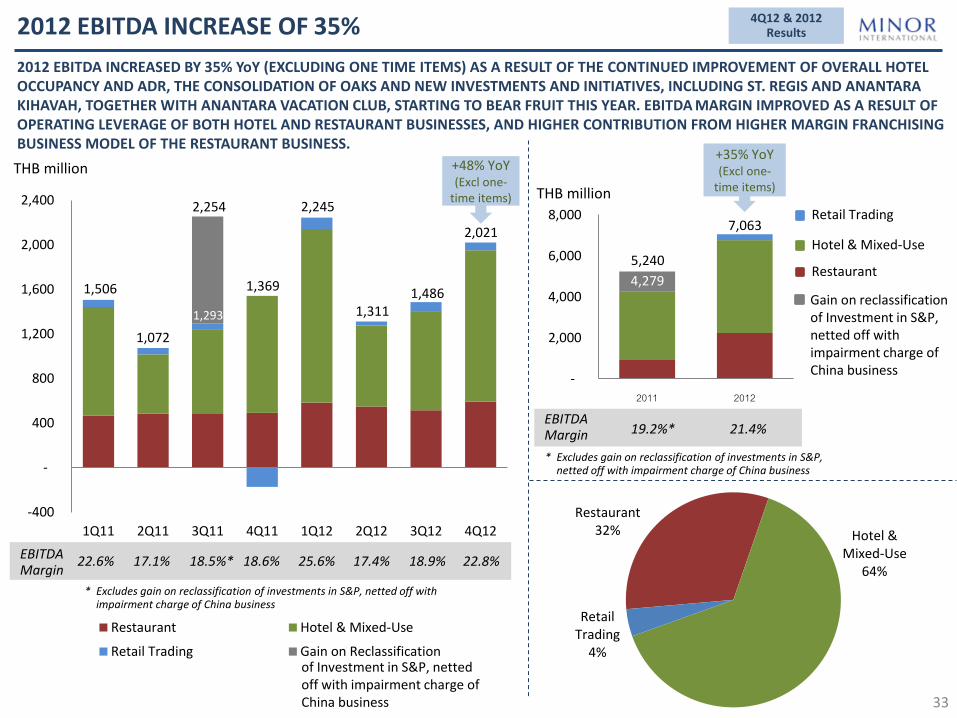
2012 EBITDA INCREASE OF 35%
2012 EBITDA INCREASED BY 35% YoY (EXCLUDING ONE TIME ITEMS) AS A RESULT OF THE CONTINUED IMPROVEMENT OF OVERALL HOTEL OCCUPANCY AND ADR, THE CONSOLIDATION OF OAKS AND NEW INVESTMENTS AND INITIATIVES, INCLUDING ST. REGIS AND ANANTARA KIHAVAH, TOGETHER WITH ANANTARA VACATION CLUB, STARTING TO BEAR FRUIT THIS YEAR. EBITDA MARGIN IMPROVED AS A RESULT OF OPERATING LEVERAGE OF BOTH HOTEL AND RESTAURANT BUSINESSES, AND HIGHER CONTRIBUTION FROM HIGHER MARGIN FRANCHISING BUSINESS MODEL OF THE RESTAURANT BUSINESS.
THB million
22.6% EBITDA Margin
1,506
1,072
+48% YoY (Excl one-
time items)
17.1% 18.5%*
* Excludes gain on reclassification of investments in S&P, netted off with impairment charge of China business
2,254
of Investment in S&P, netted off with impairment charge of China business
1,369
18.6%
2,245
25.6%
Restaurant 32% Hotel &
Mixed-Use 64%
Retail Trading
4%
4Q12 & 2012 Results
1,311
17.4%
-
2,000
4,000
6,000
8,000
2011 2012
7,063
5,240
+35% YoY (Excl one-
time items)
EBITDA Margin
THB million
19.2%* 21.4%
Restaurant
Hotel & Mixed-Use
Retail Trading
1,486
1,293
18.9%
4,279
* Excludes gain on reclassification of investments in S&P, netted off with impairment charge of China business
Gain on reclassification of Investment in S&P, netted off with impairment charge of China business
2,021
22.8%

-200
-
200
400
600
800
1,000
1,200
1,400
1Q11 2Q11 3Q11 4Q11 1Q12 2Q12 3Q12 4Q12
Restaurant Hotel & Mixed-Use
Retail Trading Gain on Reclassification
34
2012 NET PROFIT INCREASE OF 78%
THB million
2012 NET PROFIT ROSE 78% YoY (EXCLUDING ONE TIME ITEMS) AS A RESULT OF IMPROVED PERFORMANCE OF ALL THREE BUSINESSES, TOGETHER WITH THE CONSOLIDATION OF OAKS. THE GROWTH RATE OF NET PROFIT EXCEEDED THAT OF REVENUE DUE TO THE IMPROVED PROFITABILITY OF HOTEL& MIXED-USE AND RESTAURANT BUSINESSES, WITH NET MARGIN EXPANDING TO 10.3% IN 2012.
823
12.3% Net Margin
280
4.5% 4.9%*
1,306
+151% YoY (Excl one-
time items)
472
6.4% 14.5%
1,276
Restaurant 35%
Hotel & Mixed-Use
61%
Retail Trading
4%
4Q12 & 2012 Results
364
4.8%
-1,000
-
1,000
2,000
3,000
4,000
2011 2012
Net Margin 10.3% 7.0%*
THB million
+78% YoY (Excl one-time items
2,880 3,409
345
585
7.5%
* Excludes gain on reclassification of investments in S&P, netted off with impairment charge of China business
of Investment in S&P, netted off with impairment charge of China business
1,919
Restaurant
Hotel & Mixed-Use
Retail Trading
Gain on reclassification of Investment in S&P, netted off with impairment charge of China business
* Excludes gain on reclassification of investments in S&P, netted off with impairment charge of China business
1,184
13.4%

35
FINANCIAL PERFORMANCE – HOTEL & MIXED-USE Hotel Updates
Revenue
EBITDA
NPAT
EBITDA Margin
Net Margin
1Q11
THB million
2,876 2,598
3,308 3,875
4,527
3,480 3,834
4,549
975
533 755
1,050
1,559
726 890
1,360
33.9%
586
38 101
433
881
90 273
841
20.4%
2012 REVENUE AND PROFIT FROM HOTEL & MIXED-USE BUSINESS CONTINUED TO SEE IMPRESSIVE GROWTH YoY WITH IMPROVED MARGINS.
20.5%
1.5%
2Q11
2012 overall occupancy & ADR of MINT’s hotel portfolio improved YoY, due to the uninterrupted favorable climate, together with MINT’s continued marketing effort, throughout the year;
The new Anantara Kihavah and St. Regis Bangkok, which reported losses during start-up stage, saw considerable increase in occupancy, helping both top line and the profitability of the hotel portfolio;
Consolidation of Oaks’ performance since June 2011 was another main contribution, while post-acquisition plan is on track;
Sales of Anantara Vacation Club is becoming a meaningful contribution to MINT’s real estates business, with the business becoming profitable in 2012;
Even excluding Oaks, performance of MINT’s hotel & mixed use business continued to improve, with 2012 revenue increase of 16% and EBITDA increase of 27% YoY.
Key Highlights
22.8%
3.0%
3Q11 4Q11
27.1%
11.2%
1Q12
+17% YoY
34.4%
19.5%
16,390
12,657
3,313
4,535
1,157
2,085
2011 2012
20.9%
9.1% 17.6%
+30% YoY
+94% YoY
2.6%
2Q12
+29% YoY
+37% YoY
+80% YoY
26.2% 28.3%
4Q12
23.2%
18.5%
29.9%
7.1%
3Q12

36
HOTEL PERFORMANCE – 4Q12
Systemwide
Organic
Hotel ARR (Bt/night)
4Q12 4Q11 Chg 4Q12 4Q11 %Chg 4Q12 4Q11 Chg
Anantara 60% 58% 3% 6,906 7,239 -5% 4,167 4,178 0%
Marriott 83% 65% 18% 4,359 4,029 8% 3,607 2,614 38%
Four Seasons 71% 42% 29% 9,068 9,970 -9% 6,426 4,197 53%
Oaks 77% 79% -2% 5,071 4,880 4% 3,917 3,856 2%
Others 58% 44% 14% 5,983 5,302 13% 3,449 2,335 48%
Average
(incl. Oaks) 71% 68% 3% 5,740 5,483 5% 4,075 3,737 9%
Average
(excl. Oaks) 64% 56% 9% 6,476 6,456 0% 4,171 3,602 16%
Avg - Thailand 70% 54% 16% 5,029 4,808 5% 3,517 2,595 36%
Avg - Overseas
(incl. Oaks) 72% 76% -5% 6,083 5,754 6% 4,350 4,384 -1%
Avg - Overseas
(excl. Oaks) 53% 62% -9% 10,470 11,366 -8% 5,539 7,044 -21%
Occupancy (%) RevPar (Bt/night)
Hotel ARR (Bt/night)
4Q12 4Q11 Chg 4Q12 4Q11 %Chg 4Q12 4Q11 Chg
Anantara 64% 58% 6% 6,926 7,239 -4% 4,427 4,178 6%
Marriott 83% 65% 18% 4,359 4,029 8% 3,607 2,614 38%
Four Seasons 71% 42% 29% 9,068 9,970 -9% 6,426 4,197 53%
Oaks 77% 79% -2% 5,071 4,880 4% 3,917 3,856 2%
Others 57% 44% 13% 6,253 5,302 18% 3,553 2,335 52%
Average
(incl. Oaks) 73% 68% 4% 5,726 5,483 4% 4,160 3,737 11%
Average
(excl. Oaks) 67% 56% 11% 6,514 6,456 1% 4,372 3,602 21%
Avg - Thailand 70% 54% 16% 5,029 4,808 5% 3,517 2,595 36%
Avg - Overseas
(incl. Oaks) 74% 76% -2% 6,083 5,754 6% 4,508 4,384 3%
Avg - Overseas
(excl. Oaks) 58% 62% -4% 12,654 11,366 11% 7,283 7,044 3%
Occupancy (%) RevPar (Bt/night)
Hotel Updates

37
HOTEL PERFORMANCE – 2012
Systemwide
Organic
Hotel ARR (Bt/night)
2012 2011 Chg 2012 2011 %Chg 2012 2011 Chg
Anantara 57% 52% 6% 6,554 6,829 -4% 3,752 3,526 6%
Marriott 75% 67% 8% 4,047 3,643 11% 3,050 2,450 25%
Four Seasons 64% 50% 14% 8,455 8,660 -2% 5,374 4,325 24%
Oaks 77% 79% -2% 5,138 4,977 3% 3,945 3,917 1%
Others 55% 45% 10% 6,075 4,925 23% 3,315 2,193 51%
Average
(incl. Oaks) 69% 65% 5% 5,589 5,385 4% 3,871 3,479 11%
Average
(excl. Oaks) 61% 55% 6% 6,196 5,772 7% 3,769 3,186 18%
Avg - Thailand 65% 56% 9% 4,819 4,640 4% 3,126 2,575 21%
Avg - Overseas
(incl. Oaks) 72% 73% -1% 5,960 5,882 1% 4,268 4,267 0%
Avg - Overseas
(excl. Oaks) 49% 54% -5% 11,265 9,809 15% 5,574 5,311 5%
Occupancy (%) RevPar (Bt/night)
Hotel ARR (Bt/night)
2012 2011 Chg 2012 2011 %Chg 2012 2011 Chg
Marriott 60% 52% 8% 6,564 6,829 -4% 3,908 3,526 11%
Anantara 75% 67% 8% 4,047 3,643 11% 3,050 2,450 25%
Four Seasons 64% 50% 14% 8,455 8,660 -2% 5,374 4,325 24%
Oaks 77% 79% -2% 5,138 4,977 3% 3,945 3,917 1%
Other 54% 45% 9% 6,164 4,925 25% 3,327 2,193 52%
Average
(incl. Oaks) 70% 65% 6% 5,584 5,385 4% 3,919 3,479 13%
Average
(excl. Oaks) 62% 55% 7% 6,204 5,772 7% 3,867 3,186 21%62% 55%
Avg - Thailand 65% 56% 9% 4,819 4,640 4% 3,126 2,575 21%
Avg - Overseas
(incl. Oaks) 73% 73% 1% 5,960 5,882 1% 4,358 4,267 2%
Avg - Overseas
(excl. Oaks) 53% 54% -1% 12,162 9,809 24% 6,487 5,311 22%
Occupancy (%) RevPar (Bt/night)
Hotel Updates

MINT’S COMPOSITION OF HOTEL ROOMS ARE EXPECTED TO CHANGE OVER THE NEXT FIVE YEARS. MINT WILL FOCUS ON THE EXPANSION OF OUR OWN BRANDS, ANANTARA AND OAKS, MORE EXPONENTIALLY THROUGH ASSET LIGHT MODEL (MANAGEMENT CONTRACTS), WITH GEOGRAPHICAL FOCUS OUTSIDE OF THAILAND.
MINT’S HOTEL PORTFOLIO
No of rooms
-
2,000
4,000
6,000
8,000
10,000
12,000
14,000
16,000
2005 2012 2017F
Others Oaks
Avani Anantara
Four Seasons Marriott
2,169
14,573
55% 5% 4%
20%
26%
3%
19%
51%
35%
6%
8% 45%
6%
-
2,000
4,000
6,000
8,000
10,000
12,000
14,000
16,000
2005 2012 2017F
Managed
Joint Venture
Own Equity
92% 23% 22% 8%
7% 5%
70%
73%
2,169
-
2,000
4,000
6,000
8,000
10,000
12,000
14,000
16,000
2005 2012 2017F
International
Outside Bangkok
Bangkok
36% 15% 12% 56%
15% 11%
8%
70% 76%
2,169
By Location By Ownership By Brand
38
5%
10,348
7%
5%
14,573
10,348
14,573
10,348
Hotel Updates
No of rooms No of rooms

-10%
0%
10%
20%
30%
0
5
10
15
20
25
30
1998 1999 2000 2001 2002 2003 2004 2005 2006 2007 2008 2009 2010 2011 2012 2013F
Tourist Arrival % Change
HOTEL INDUSTRY OUTLOOK IS EXPECTED TO REMAIN STRONG ON THE BACK OF INCREASING TOURIST ARRIVAL.
Million Tourists Arrival to Thailand – Yearly Trend
Source: Tourism Authority of Thailand and Bank of Thailand
TOURIST ARRIVAL TO THAILAND
Million Tourist Arrival to Thailand – Monthly Trend
39
-40%
-20%
0%
20%
40%
60%
80%
0.0
0.5
1.0
1.5
2.0
2.5
3.0
Jan-10 Apr-10 Jul-10 Oct-10 Jan-11 Apr-11 Jul-11 Oct-11 Jan-12 Apr-12 Jul-12 Oct-12
Hotel Updates
0
1,000,000
2,000,000
3,000,000
China Japan Russia Korea India
2011 2012
0
100,000
200,000
300,000
400,000
Thailand East Asia Europe The Americas South Asia Oceania Middle East Africa & Others
2011 2012
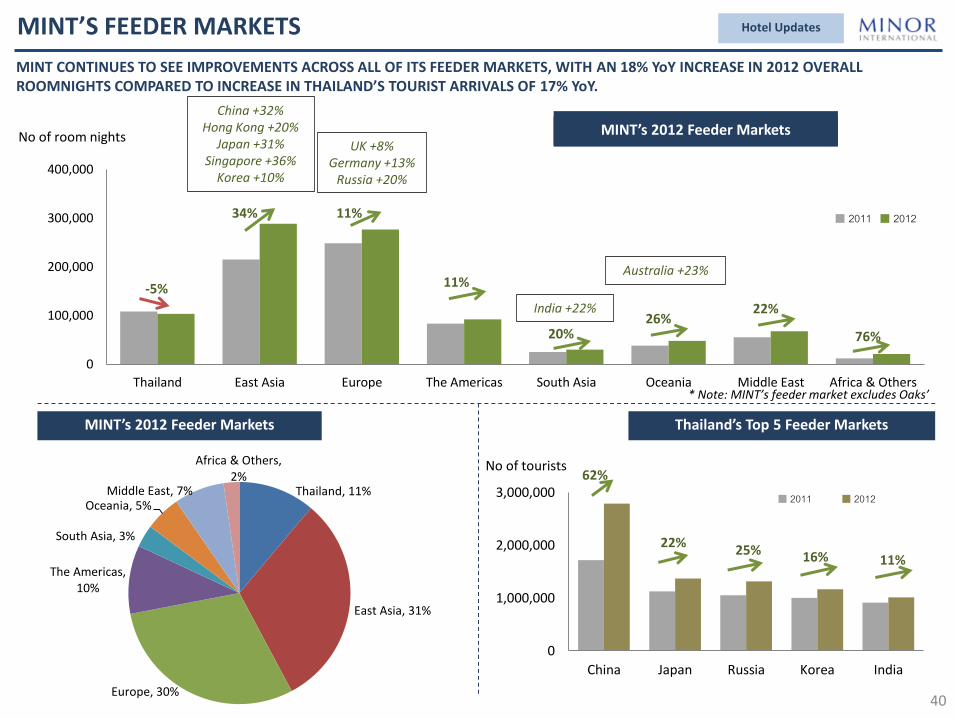
MINT’S FEEDER MARKETS
No of room nights
MINT’s 2012 Feeder Markets Thailand’s Top 5 Feeder Markets
No of tourists
MINT’s 1H12 Feeder Markets
* Note: MINT’s feeder market excludes Oaks’
40
Hotel Updates
-5%
34% 11%
11%
20% 26%
MINT’s 2012 Feeder Markets
76%
22%
MINT CONTINUES TO SEE IMPROVEMENTS ACROSS ALL OF ITS FEEDER MARKETS, WITH AN 18% YoY INCREASE IN 2012 OVERALL ROOMNIGHTS COMPARED TO INCREASE IN THAILAND’S TOURIST ARRIVALS OF 17% YoY.
China +32% Hong Kong +20%
Japan +31% Singapore +36%
Korea +10%
UK +8% Germany +13%
Russia +20%
Australia +23%
India +22%
62%
22% 25% 16% 11%
Thailand, 11%
East Asia, 31%
Europe, 30%
The Americas, 10%
South Asia, 3%
Oceania, 5% Middle East, 7%
Africa & Others, 2%

Hotel Updates
BANGKOK HAS SEEN AGGRESSIVE INCREASE IN NEW SUPPLY DURING 2010 – 2012, BUT THE RATE IS EXPECTED TO SLOW DOWN IN THE NEXT FEW YEARS.
0
5,000
10,000
15,000
20,000
2000 2001 2002 200 200 200 200 200 2008 2009 2010 2011 2012 201 201
No of rooms
Source: HVS Reseach
2012 No. of Rooms
Sofitel Bangkok, Sukhumvit 13
W Hotel Bangkok
Hotel Okura Bangkok
Hansar Bangkok
Hotel Sofitel So Bangkok
The Siam, Bangkok
Surya by Supatra
344
403
240
94
238
39
68
2013F
The Langham Sukhumvit Bangkok
Langham Place, Phayathai, Bangkok
230
400
No. of Rooms
LUXURY HOTEL SUPPLY IN BANGKOK
2014F
41
Jumeirah Bangkok
Park Hyatt Bangkok
305
222

DIVERSIFICATION OUTSIDE BANGKOK
WITH ITS EXPANSION OUTSIDE OF THAILAND AS WELL AS INCREASING CONTRIBUTION FROM MIXED USE BUSINESSES, MINT IS LESS DEPENDENT ON ITS BANGKOK HOTEL PORTFOLIO. NEVERTHELESS, DESPITE THE OVERSUPPLY OF HOTELS IN BANGKOK, MINT’S BANGKOK HOTEL PORTFOLIO IS STILL SEEING SIGNIFICANT IMPROVEMENT IN REVPAR OF 40% YoY.
42
Hotel Updates
25% 24% 32% 16% 15%
75% 76% 68% 84% 85%
0%
25%
50%
75%
100%
2008 2009 2010 2011 2012
Outside Bangkok
Bangkok
Number of hotel rooms in Bangkok doubled over the past 5 years
26% 28% 25% 14% 14%
74% 72% 75% 86% 86%
0%
25%
50%
75%
100%
2008 2009 2010 2011 2012
Other Hotel &Mixed Use
Bangkok
5,097
4,255 3,951
3,542 3,857
3,389
2,394 2,025 1,788
2,499
66%
56%
51% 51%
65%
0%
20%
40%
60%
80%
0
2,000
4,000
6,000
8,000
2008 2009 2010 2011 2012
0
300
600
900
1,200
1,500
2008 2009 2010 2011 2012
Managed
Owned
No of rooms
Revpar ADR % Occupancy
769 864
1,300
1,518 1,518
However, the contribution in terms of number of rooms in Bangkok significantly declined as the expansion is faster outside of Bangkok
Despite the oversupply of hotels in Bangkok, MINT’s Bangkok hotel portfolio improves significantly, with 2012 revpar increase of 40% YoY
The revenue contribution also significantly declined over the five years, in line with the contribution from number of rooms
THB Occupancy

872
1,173
1,923 2,238
43
2012 PERFORMANCE OF THE RESTAURANT BUSINESS CONTINUED TO EXHIBIT STRONG AND STABLE GROWTH, WITH REVENUE GROWTH OF 13% AND NET PROFIT GROWTH OF 35% YoY
FINANCIAL PERFORMANCE - RESTAURANT
Revenue
EBITDA
NPAT
EBITDA Margin
Net Margin
1Q11
THB million
2,963 2,901 2,880 2,954
3,451
3,237 3,097
3,406
467 483 481 492 583
549 515 592
15.8%
205 218 224 225
319 273 276 306
6.9%
Key Highlights
Most brands continued to exhibit strong and positive same store sales growth in 2012, from increases in both revenue per customer and customer count. The increase were mainly due to a combination of robust domestic consumption and successful marketing strategies;
Same store sales growth, together with outlet expansion, translated into strong total system sales growth of 15.1% in 2012;
The full consolidation of Thai Express’ performance, the 31% share of profit in S&P Syndicate and higher franchise fees, helped improve the restaurant business’s margin;
EBITDA & net profit margin expanded despite the minimum wage increase which was implemented since October 2011, attributable to improved cost structure, operating leverage and increasing franchise fees.
Restaurant Update
16.6%
2Q11
7.5%
16.7%
3Q11*
7.8%
4Q11
16.6%
7.6%
1Q12
9.2%
+13% YoY
+16% YoY
+35% YoY
16.9%
+15% YoY
+20% YoY
+20% YoY
17.0%
2Q12
8.4%
16.4% 17.0%
2011*
7.0%
2012
10.3%
16.6%
3Q12
8.9%
*Note: Excluding gain on reclassification of Investment in S&P, netted off with impairment charge of China business
9.0%
4Q12
17.4%
11,697 13,192

44
FOOD AND PAPER COSTS AS A PERCENTAGE OF SALES HAS COME DOWN OVER THE PAST FIVE YEARS AS A RESULT OF CONTINUED EFFECTIVE COST MANAGEMENT PROGRAM.
EFFECTIVE MANAGEMENT OF FOOD COSTS
35.9%
34.1%
34.9% 35.2% 35.2%
33.3%
33.0%
33.9%
34.5%
33.2% 33.2% 33.0%
34.0%
32.7%
31.8% 31.7%
32.0%
31.5%
31.7%
31.5% 31%
32%
33%
34%
35%
36%
1Q08 2Q08 3Q08 4Q08 1Q09 2Q09 3Q09 4Q09 1Q10 2Q10 3Q10 4Q10 1Q11 2Q11 3Q11 4Q11 1Q12 2Q12 3Q12 4Q12
% of Food & Paper Costs to Sales
Fixed Long-Term Contract
Prices
Menu-Mix Re-Engineering
Supply Chain Management
Maximization of FTA Benefit
Pro-Active Inventory
Management
Strategy
Note: Food and paper costs as a percentage of sales rose in first quarter of every year as a result of “Buy-one-get-one-free” promotional campaign launched in March of every year to celebrate the anniversary of The Pizza Company
Restaurant Update

45
RESTAURANT PERFORMANCE
Brand SSS (%) TSS (%)
4Q12 4Q11 2012 2011 4Q12 4Q11 2012 2011
The Pizza Company -0.8% 11.3% 5.9% 11.7% 4.2% 18.2% 14.6% 15.6%
Swensen’s 14.2% -0.3% 10.7% 3.6% 22.2% 8.6% 18.9% 11.8%
Sizzler 14.6% 5.0% 6.1% 11.8% 12.6% 8.3% 7.0% 14.5%
Dairy Queen 9.1% 20.7% 17.5% 16.7% 27.5% 30.8% 30.2% 23.8%
Burger King 18.2% 16.9% 10.2% 21.8% 19.5% 6.9% 10.8% 17.1%
The Coffee Club 2.3% 5.5% 3.1% 8.8% 8.7% 13.7% 10.3% 15.8%
Ribs & Rumps -0.8% N/A -0.5% N/A 46.5% N/A 270.7% N/A
Thai Express 1.8% -3.7% -0.4% -1.6% 4.2% -0.3% 5.2% 0.9%
Average 4.6% 6.5% 5.5% 9.0% 11.4% 12.7% 15.1% 14.1%
Average Thailand 7.5% 9.3% 8.6% 11.8% 13.8% 15.3% 15.9% 16.9%
Restaurant Update

RESTAURANT OUTLETS – 2012
Brand No. of outlets No. of outlets
Total Equity Franchise Thailand International
The Pizza Company 198 94 255 37 292
Swensen’s 124 157 259 22 281
Sizzler 45 - 39 6 45
Dairy Queen 237 72 309 - 309
Burger King 29 - 29 - 29
The Coffee Club 26 287 8 305 313
Ribs & Rumbs 9 3 - 12 12
Thai Express 56 8 - 64 64
Riverside 21 - - 21 21
Others 15 - 15 - 15
Total 760 621 914 467 1,381
46
Restaurant Update

267 562 487
683 751 1,097
1,097
46
55
(131)
61
1,054
1,054 1,054
4.8%
19.0% 20.8% 22.9%
26.3%
31.3% 31.3%
-10%
0%
10%
20%
30%
40%
-500
0
500
1,000
1,500
2,000
2,500
3,000
2006 2007 2008 2009 2010 2011 2012
Gain from investment reclassification
Unrealized gain (loss)
Investment Cost
% shareholding
47
S&P OPERATES A CHAIN OF RESTAURANTS AND BAKERY SHOPS WITH OVER 400 OUTLETS IN 7 COUNTRIES PRODUCING AND DISTRIBUTING FOOD AND BAKERY PRODUCTS UNDER THE S&P BRAND. SINCE 3Q11, S&P’S PERFORMANCE HAS BEEN RECOGNIZED THROUGH EQUITY ACCOUNTING METHOD. 2012 REVENUES INCREASED AS A RESULT OF BOTH DOMESTIC AND INTERNATIONAL EXPANSION, WHILE MARGINS IMPROVED BECAUSE OF INCREASE IN RETAIL PRICE, EFFICIENT PROCUREMENT AND LOWER MARKETING EXPENSES.
CONTINUED & STRENGTHENING PARTNERSHIP WITH S&P
Shareholding Structure
MINT’s Investment in S&P
THB million
313
617 744
1,805
Revenue
EBITDA
NPAT
EBITDA Margin
Net Margin
THB million
2,151
356 617
2010 2008 2009
4,437 4,761 5,340
5,941 6,653
583 674 817
962
1,216
13.1% 14.2% 15.3%
225 293 383 454
708
5.1% 6.2% 7.2%
16.2%
7.6%
2011
39% 39%
26% 31%
35% 30%
0%
20%
40%
60%
80%
100%
Pre-Tender Offer Post-Tender Offer
Others
MINT
Sila-on & Riva Families
5%
+12% YoY
+26% YoY
+56% YoY 2,151
Restaurant Update
18.3%
10.6%
2012

4
289
2,923
3,412
48
Retail Trading Update
2012 REVENUE OF RETAIL TRADING & CONTRACT MANUFACTURING INCREASED BY 17% PRIMARILY AS A RESULT OF EXPANSION OF KEY FASHION BRANDS ESPECIALLY IN 4Q12, INCREASE IN ORDERS OF CONTRACT MANUFACTURING, TOGETHER WITH INSURANCE CLAIMS FROM FLOOD RECEIVED IN 1Q12 AND 3Q12. AS A RESULT, EBITDA AND NET PROFIT INCREASED SIGNIFICANTLY IN 2012.
FINANCIAL PERFORMANCE – RETAIL TRADING & CONTRACT MANUFACTURING
Revenue
EBITDA
NPAT
EBITDA Margin
Net Margin
1Q11
THB million 840
779 789
516
789 807 911 905
64 57 56
-173
103
36 81 69
7.6%
32 23 21
-186
76
1 36 37
3.8%
Key Highlights
7.3%
2Q11
3.0%
13.1%
9.6%
7.2%
2.6%
3Q11
2012 revenue from retail trading increased by 16% YoY, primarily from the expansion of points of sale of the key fashion brands, despite the decline in number of cosmetic points of sale. Retail trading is seeing a turn around with same store sales growth turning positive in 4Q12;
2012 revenue from contract manufacturing increased by 18% YoY, from partial recovery of insurance claim in 1Q12 and 3Q12, together with increased order since its full operation in mid-2012;
As a result, EBITDA and net profit margins of retail trading & contract manufacturing business increased significantly in 2012;
-33.5%
4Q11
-36.2%
1Q12
+17% YoY
N/A
+75% YoY
4.5%
0.2%
2Q12
0.1% 8.5%
-3.8%
2011
4.4%
2012
8.9%
3.9%
3Q12
7.6%
4.1%
4Q12
-110
N/A
N/A
N/A 150