company overviewmalee.listedcompany.com/misc/presn/20170324-malee-am-fy2016.pdf · philippines ”...
TRANSCRIPT

Malee Group Public Company Limited
Analyst Meeting
Swissocirctel LE CONCORDE
24 March 2017
Disclaimers
1
The information contained herein is intended to represent the Companyrsquos operating
and financial position at a given point in time and may also contain forward looking
information which only reflects expectations based on the prevailing geo-political
economic and non-controllable factors Such information has been obtained from
sources believed to be most reliable and the means in analyzing and preparation of
such information for disclosure are based on approve practices and principles in the
investment industry The views are based on assumption subject to various risks and
uncertainties and no assurance is made as to whether such future events will occur
No assurance is made as to the accuracy or completeness of information presented
in this document
Agenda
2
bull Company Overview
bull Business Update
bull Results of Operations and Profitability
bull Forward Looking
100 4949100
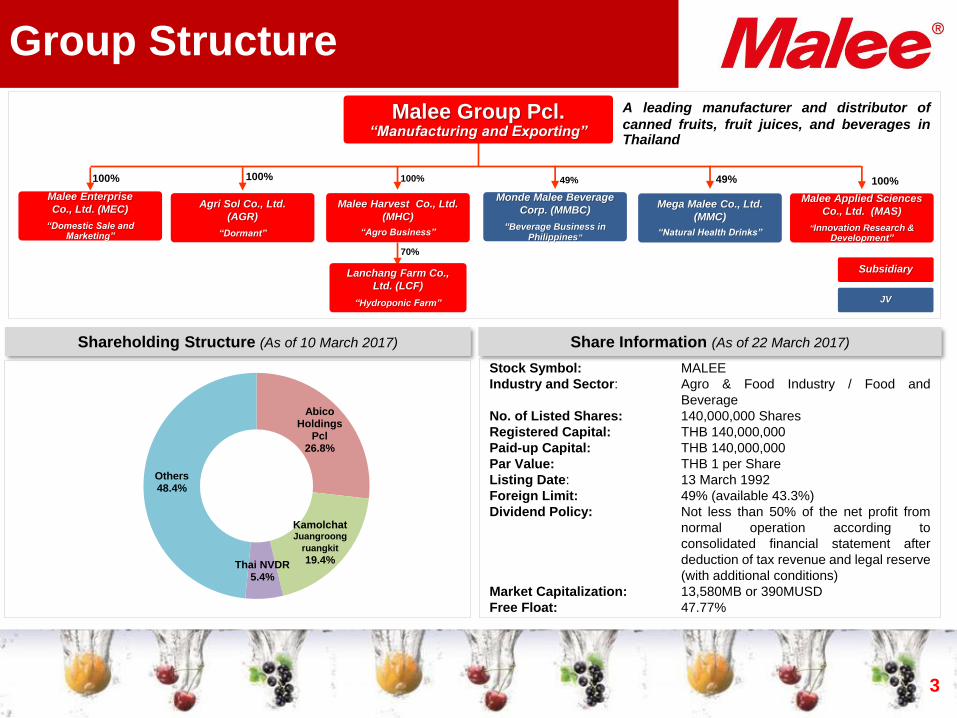
Stock Symbol MALEE
Industry and Sector Agro amp Food Industry Food and
Beverage
No of Listed Shares 140000000 Shares
Registered Capital THB 140000000
Paid-up Capital THB 140000000
Par Value THB 1 per Share
Listing Date 13 March 1992
Foreign Limit 49 (available 433)
Dividend Policy Not less than 50 of the net profit from
normal operation according to
consolidated financial statement after
deduction of tax revenue and legal reserve
(with additional conditions)
Market Capitalization 13580MB or 390MUSD
Free Float 4777
Group Structure
3
Group Structure
Malee Group PclldquoManufacturing and Exportingrdquo
Malee Enterprise
Co Ltd (MEC)
ldquoDomestic Sale and Marketingrdquo
Share Information (As of 22 March 2017)
Abico Holdings
Pcl268
KamolchatJuangroong
ruangkit
194Thai NVDR54
Others484
A leading manufacturer and distributor of
canned fruits fruit juices and beverages in Thailand
100
70
Shareholding Structure (As of 10 March 2017)
Agri Sol Co Ltd
(AGR)
ldquoDormantrdquo
Malee Harvest Co Ltd
(MHC)
ldquoAgro Businessrdquo
Monde Malee Beverage
Corp (MMBC)
ldquoBeverage Business in Philippinesrdquo
Mega Malee Co Ltd
(MMC)
ldquoNatural Health Drinksrdquo
Lanchang Farm Co
Ltd (LCF)
ldquoHydroponic Farmrdquo JV
Subsidiary
Malee Applied Sciences
Co Ltd (MAS)
ldquoInnovation Research amp Developmentrdquo
100
Milestones
4
20131978
1981
1992
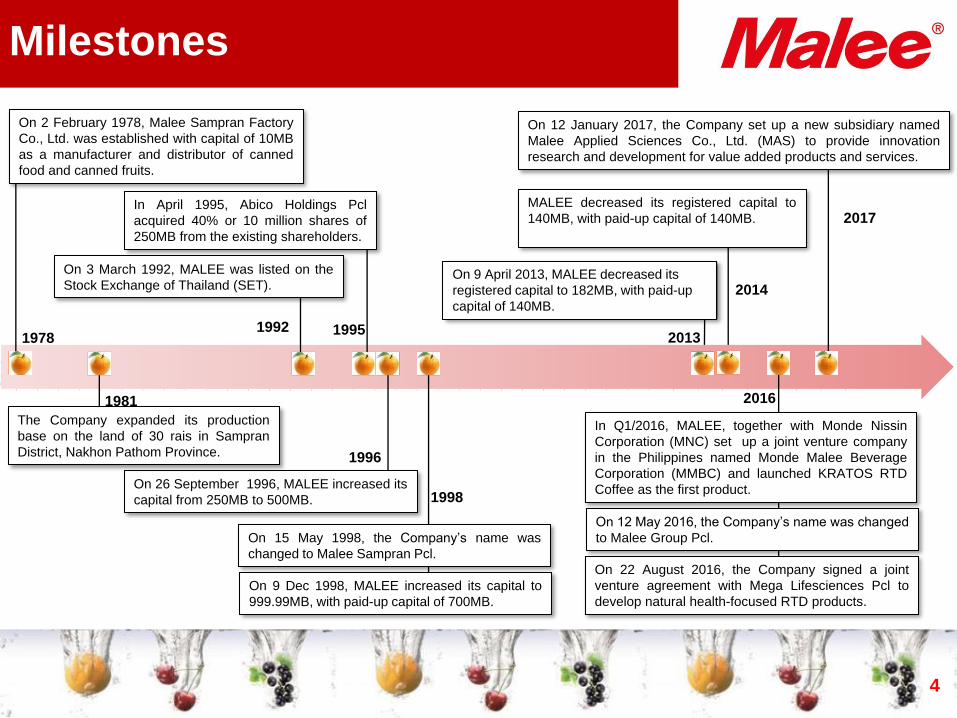
On 26 September 1996 MALEE increased its
capital from 250MB to 500MB
1995
On 9 April 2013 MALEE decreased its
registered capital to 182MB with paid-up
capital of 140MB
2014
2016
On 2 February 1978 Malee Sampran Factory
Co Ltd was established with capital of 10MB
as a manufacturer and distributor of canned
food and canned fruits
On 3 March 1992 MALEE was listed on the
Stock Exchange of Thailand (SET)
1998
1996
MALEE decreased its registered capital to
140MB with paid-up capital of 140MB
The Company expanded its production
base on the land of 30 rais in Sampran
District Nakhon Pathom Province
In April 1995 Abico Holdings Pcl
acquired 40 or 10 million shares of
250MB from the existing shareholders
On 15 May 1998 the Companyrsquos name was
changed to Malee Sampran Pcl
On 9 Dec 1998 MALEE increased its capital to
99999MB with paid-up capital of 700MB
2017
On 12 January 2017 the Company set up a new subsidiary named
Malee Applied Sciences Co Ltd (MAS) to provide innovation
research and development for value added products and services
On 12 May 2016 the Companyrsquos name was changed
to Malee Group Pcl
In Q12016 MALEE together with Monde Nissin
Corporation (MNC) set up a joint venture company
in the Philippines named Monde Malee Beverage
Corporation (MMBC) and launched KRATOS RTD
Coffee as the first product
On 22 August 2016 the Company signed a joint
venture agreement with Mega Lifesciences Pcl to
develop natural health-focused RTD products
13021600 1682 1537
1931 21402357
2615 27062822
2964
2797 2405 2021
1546 898
15101737
16032065
2567
35782062
869
25 (93) (295)131 106 228
646283 307 331 530
-1000
0
1000
2000
3000
4000
5000
6000
7000
2006 2007 2008 2009 2010 2011 2012 2013 2014 2015 2016
Unit Baht Million
CMG Brand Net Profit
10-Yr Historical Performance
5
FloodImpact
2016
Historical
Highest Sales
CMG Contract Manufacturing
bull Prior to 2009 major contribution of CMG was
from canned fruits
bull Discontinued the canned pineapple production
in 2009 and canned sweet corn in 2013
Malee Brand Portfolio
6
Daily Nutrition
Functionality Tactical
Malee 100Juice UHT
Malee 100
Juice Pasteurize
Malee Coco
Malee Nutrients
Malee i-Corn
Malee
HealtiPlus
Malee Food
Service
Malee
Tropical
Malee
Canned
Fruit
OTHERS
Canned Fruit
Dairy Product
Other Beverages
First Choice Farmer
Chokchai Farm
UHT Pasteurize
Canned
Sweetened
Condensed Non Dairy Creamer
TurBusta Maxx
Malee Light
Malee Probiotics
Agenda
7
bull Company Overview
bull Business Update
bull Results of Operations and Profitability
bull Forward Looking
Premium Market (100 RTD Fruit
Juice) 5195MB
37
Medium Market (40-99 RTD
Fruit Juice)1252MB
9(+2 YoY)
Economy Market (20-39 RTD
Fruit Juice)3097MB
22(-7 YoY)
Super Economy Market (lt19
RTD Fruit Juice) 2385MB
17(+13 YoY)
Others2055MB
15
(+7 YoY)
(-13 YoY)
Domestic RTD Fruit Juice
Market
8
Source Neilson
MAT Dec 2016 Market Value of 13982 MB Growth of 1 YoY
Premium Juice UHT Market Share
9
MAT Dec 2016 Market Value of 4802 MB Growth of 9 YoY
Tipco28
Malee 21
Unif13
Doikham20
UFC1 Cocomax
9
Others8
Tipco33
Malee 22
Unif15
Doikham18
UFC1
Cocomax5 Others
6
MAT Dec 2015 MAT Dec 2016
Note Including Coconut Water
Source Neilson
5255 56
48 4746 42
4748 45 44
52 53 5458
53
25
30
35
40
45
50
55
60
Q115 Q215 Q315 Q415 Q116 Q216 Q316 Q416
Brand CMG
Sales Structure
10
CMG Contract Manufacturing
Domestic International Business Brand Contract Manufacturing
2016 Domestic sales growth was 3 YoY
2016 Export sales growth was 67 YoY
2016 Brand sales growth was 5 YoY
2016 CMG sales growth was 39 YoY
7971 69 68 66 63
57 58
2129 31 32 34 37 43 42
0
10
20
30
40
50
60
70
80
90
Q115 Q215 Q315 Q415 Q116 Q216 Q316 Q416
Domestic Export
Malee Applied Sciences
ndash New Subsidiary
11
Malee Applied Sciences Co Ltd
(MAS) wholly owned by MALEE was
set up on 12 January 2017
Initial capital investment is Baht 10
million
MAS will enhance the Companyrsquos
capability in innovation research and
development for value added products
and services
MAS also hopes to support farmersrsquo
income with its value added by-
products
Agenda
12
bull Company Overview
bull Business Update
bull Results of Operations and Profitability
bull Forward Looking
Q42016 Net profit growth was attained by the
Companyrsquos strategy and internal management
for efficiency enhancement and cost reduction
2016 Net profit growth was marked by
improved sales revenue while costs were well
managed including production cost selling
expenses and finance costs
2016 Net profit achieved the second highest
profit since 2012 the year in which the
Company benefited from the great flood in
2011
Loss recognized of 40MB from MMBC in
Q42016 was foreseen and according to plan
of the Company that there was high spending
at the beginning as we launched more new products into the market
1542 1507
53896541
0
1000
2000
3000
4000
5000
6000
7000
Q415 Q416 2015 2016
-2
YoY
+21
YoY
Financial Highlights
13
Q42016 Sales growth dropped YoY due to
slower domestic consumption
2016 Sales growth was supported by sales
increase both in Brand and CMG both of
which rose domestically and internationally
In 2016 the Company achieved its highest
record of annual sales since establishment in
1978
1276 1252 1319 1542 1533 1741 17601507
0
500
1000
1500
2000
2500
3000
3500
4000
Q115 Q215 Q315 Q415 Q116 Q216 Q316 Q416
Sales Revenue
Unit Million Baht
85 8258
105 110143
161
117
0
50
100
150
200
250
300
Q115Q215Q315Q415Q116Q216Q316Q416
Net Profit
Unit Million Baht
105 117
331
530
0
100
200
300
400
500
600
Q415 Q416 2015 2016
+11
YoY
+60
YoY
Remark Sales reclassified from net sales of trade rebates
Profitability Margin
14
Q42016 GPM improved YoY due
to enhanced production efficiency
2016 GPM increased as a result of
reduced cost of production per unit in
relation to higher utilization rate as
well as improved cost management
Improved selling expenses to sales
was supported by the grouprsquos cost
control policy and increased sales
ratio of CMG
Q42016 NPM improved YoY due to
efficiency enhancement and cost
reduction despite sales drop YoY
2016 NPM increased from
improved sales revenue while costs
were well managed including
production cost selling expenses
and finance costs
309 323 331 297 299 322 340 322
00
50
100
150
200
250
300
350
400
450
500
Q115 Q215 Q315 Q415 Q116 Q216 Q316 Q416
Gross Profit Margin
297 322 314 322
00
50
100
150
200
250
300
350
400
450
500
Q415 Q416 2015 2016
171 171 203154 146 138 162 129
0050
100150200250300350400450500
Q115 Q215 Q315 Q415 Q116 Q216 Q316 Q416
Selling Expenses Sales
154 129174 144
0050
100150200250300350400450500
Q415 Q416 2015 2016
65 6544
68 7181 91
78
00
20
40
60
80
100
120
140
160
180
200
Q115 Q215 Q315 Q415 Q116 Q216 Q316 Q416
Net Profit Margin
68 7861
81
0020406080
100120140160180200
Q415 Q416 2015 2016
Remark Trade rebates reclassified from selling expenses to net sales
Remark Shut down expense and damaged goods reclassified from administrative expenses to cost of sales
2944 2843 2977 3042 3070 3213 3406 3640
00500000
1000000150000020000002500000300000035000004000000
Q115 Q215 Q315 Q415 Q116 Q216 Q316 Q416
Total Assets
Statement of Financial Position
15
Increased assets from the end of last
year were mainly resulted from
additional investment in machinery as
well as higher inventories
Increased liabilities from the end of last
year were due to higher short-term loans
for investment in machinery and
liabilities under financial lease
Increased equity of parent Companys
shareholders was contributed by
operating profit during the year
Unit Million Baht
1814 1685 1831 1788 1705 1804 1944 2061
00
500000
1000000
1500000
2000000
2500000
Q115 Q215 Q315 Q415 Q116 Q216 Q316 Q416
Total Liabilities
Unit Million Baht
1126 1156 1144 1250 1359 1403 1458 1575
00200000400000600000800000
10000001200000140000016000001800000
Q115 Q215 Q315 Q415 Q116 Q216 Q316 Q416
Equity
Unit Million Baht
Liquidity
16
Reduced current ratio YoY was mainly due to
lower trade receivables higher short-term
loans and higher liabilities under financial
lease while higher inventories resulted in
decreased quick ratio
Improved cash cycle days YoY was due to
shortened collection days and inventory days
in spite of reduced payment days
Higher IBDE from the end of 2015 was due
to higher short-tem loans from financial
institutions and increased liabilities under
financial lease agreements
Lower DE ratio was resulted from reduced
trade payables while the Companyrsquos retained
earnings increased following incurring profits
106 107 106 113 119 119 111095
058 055 053066 070 067 059 050
300400500600700800900
1000110012001300
Q115 Q215 Q315 Q415 Q116 Q216 Q316 Q416
Current Ratio (x) Quick Ratio (x)
083 074 087 068051 050 059 075
161 146160
143125 129 133 131
00
500
1000
1500
2000
2500
3000
Q115 Q215 Q315 Q415 Q116 Q216 Q316 Q416
IBDE (x) DE (x)
80 84 95 90 78 74 78 77
00
20000
40000
60000
80000
100000
120000
Q115 Q215 Q315 Q415 Q116 Q216 Q316 Q416
Cash Cycle Days
150 151 137 148 157192
218 204
00
50
100
150
200
250
Q115 Q215 Q315 Q415 Q116 Q216 Q316 Q416
ROA
Return to Shareholders
17
Improved ROA and ROE YoY was supported by a
substantial increase of net profit
The Company has continuously paid dividend to its
shareholders twice a year since 2012 operation
period
The Company has a policy to pay dividend not less
than 50 of the net profit from normal operation
according to consolidated financial statement after
deduction of tax revenue and legal reserve (with
additional conditions)
Remark Annualized
280 278 273 293 286 325399 375
0050
100150200250300350400450
Q115 Q215 Q315 Q415 Q116 Q216 Q316 Q416
ROE
Remark Annualized
150105 111 120
190
00200400600800
100012001400160018002000
2012 2013 2014 2015 2016
Dividend per Share
Remark Adjusted at par value of 100 Baht
Unit Baht
Agenda
18
bull Company Overview
bull Business Update
bull Results of Operations and Profitability
bull Forward Looking
2017 Looking Ahead
19
Domestic Brand
Renovations Portfolio
Management
CMG
Diversification
International Business
Strategic Expansion
Added to MSCI Global Small Cap IndexesEffective as of the close of 30 November 2016
Share Endorsements
20
Partner
ldquoVery Goodrdquo Level of CG Scoring
For more information please visit our website httpwwwmaleecothor contact irmaleecoth Tel +66 64 301 7978
Disclaimers
1
The information contained herein is intended to represent the Companyrsquos operating
and financial position at a given point in time and may also contain forward looking
information which only reflects expectations based on the prevailing geo-political
economic and non-controllable factors Such information has been obtained from
sources believed to be most reliable and the means in analyzing and preparation of
such information for disclosure are based on approve practices and principles in the
investment industry The views are based on assumption subject to various risks and
uncertainties and no assurance is made as to whether such future events will occur
No assurance is made as to the accuracy or completeness of information presented
in this document
Agenda
2
bull Company Overview
bull Business Update
bull Results of Operations and Profitability
bull Forward Looking
100 4949100
Stock Symbol MALEE
Industry and Sector Agro amp Food Industry Food and
Beverage
No of Listed Shares 140000000 Shares
Registered Capital THB 140000000
Paid-up Capital THB 140000000
Par Value THB 1 per Share
Listing Date 13 March 1992
Foreign Limit 49 (available 433)
Dividend Policy Not less than 50 of the net profit from
normal operation according to
consolidated financial statement after
deduction of tax revenue and legal reserve
(with additional conditions)
Market Capitalization 13580MB or 390MUSD
Free Float 4777
Group Structure
3
Group Structure
Malee Group PclldquoManufacturing and Exportingrdquo
Malee Enterprise
Co Ltd (MEC)
ldquoDomestic Sale and Marketingrdquo
Share Information (As of 22 March 2017)
Abico Holdings
Pcl268
KamolchatJuangroong
ruangkit
194Thai NVDR54
Others484
A leading manufacturer and distributor of
canned fruits fruit juices and beverages in Thailand
100
70
Shareholding Structure (As of 10 March 2017)
Agri Sol Co Ltd
(AGR)
ldquoDormantrdquo
Malee Harvest Co Ltd
(MHC)
ldquoAgro Businessrdquo
Monde Malee Beverage
Corp (MMBC)
ldquoBeverage Business in Philippinesrdquo
Mega Malee Co Ltd
(MMC)
ldquoNatural Health Drinksrdquo
Lanchang Farm Co
Ltd (LCF)
ldquoHydroponic Farmrdquo JV
Subsidiary
Malee Applied Sciences
Co Ltd (MAS)
ldquoInnovation Research amp Developmentrdquo
100
Milestones
4
20131978
1981
1992
On 26 September 1996 MALEE increased its
capital from 250MB to 500MB
1995
On 9 April 2013 MALEE decreased its
registered capital to 182MB with paid-up
capital of 140MB
2014
2016
On 2 February 1978 Malee Sampran Factory
Co Ltd was established with capital of 10MB
as a manufacturer and distributor of canned
food and canned fruits
On 3 March 1992 MALEE was listed on the
Stock Exchange of Thailand (SET)
1998
1996
MALEE decreased its registered capital to
140MB with paid-up capital of 140MB
The Company expanded its production
base on the land of 30 rais in Sampran
District Nakhon Pathom Province
In April 1995 Abico Holdings Pcl
acquired 40 or 10 million shares of
250MB from the existing shareholders
On 15 May 1998 the Companyrsquos name was
changed to Malee Sampran Pcl
On 9 Dec 1998 MALEE increased its capital to
99999MB with paid-up capital of 700MB
2017
On 12 January 2017 the Company set up a new subsidiary named
Malee Applied Sciences Co Ltd (MAS) to provide innovation
research and development for value added products and services
On 12 May 2016 the Companyrsquos name was changed
to Malee Group Pcl
In Q12016 MALEE together with Monde Nissin
Corporation (MNC) set up a joint venture company
in the Philippines named Monde Malee Beverage
Corporation (MMBC) and launched KRATOS RTD
Coffee as the first product
On 22 August 2016 the Company signed a joint
venture agreement with Mega Lifesciences Pcl to
develop natural health-focused RTD products
13021600 1682 1537
1931 21402357
2615 27062822
2964
2797 2405 2021
1546 898
15101737
16032065
2567
35782062
869
25 (93) (295)131 106 228
646283 307 331 530
-1000
0
1000
2000
3000
4000
5000
6000
7000
2006 2007 2008 2009 2010 2011 2012 2013 2014 2015 2016
Unit Baht Million
CMG Brand Net Profit
10-Yr Historical Performance
5
FloodImpact
2016
Historical
Highest Sales
CMG Contract Manufacturing
bull Prior to 2009 major contribution of CMG was
from canned fruits
bull Discontinued the canned pineapple production
in 2009 and canned sweet corn in 2013
Malee Brand Portfolio
6
Daily Nutrition
Functionality Tactical
Malee 100Juice UHT
Malee 100
Juice Pasteurize
Malee Coco
Malee Nutrients
Malee i-Corn
Malee
HealtiPlus
Malee Food
Service
Malee
Tropical
Malee
Canned
Fruit
OTHERS
Canned Fruit
Dairy Product
Other Beverages
First Choice Farmer
Chokchai Farm
UHT Pasteurize
Canned
Sweetened
Condensed Non Dairy Creamer
TurBusta Maxx
Malee Light
Malee Probiotics
Agenda
7
bull Company Overview
bull Business Update
bull Results of Operations and Profitability
bull Forward Looking
Premium Market (100 RTD Fruit
Juice) 5195MB
37
Medium Market (40-99 RTD
Fruit Juice)1252MB
9(+2 YoY)
Economy Market (20-39 RTD
Fruit Juice)3097MB
22(-7 YoY)
Super Economy Market (lt19
RTD Fruit Juice) 2385MB
17(+13 YoY)
Others2055MB
15
(+7 YoY)
(-13 YoY)
Domestic RTD Fruit Juice
Market
8
Source Neilson
MAT Dec 2016 Market Value of 13982 MB Growth of 1 YoY
Premium Juice UHT Market Share
9
MAT Dec 2016 Market Value of 4802 MB Growth of 9 YoY
Tipco28
Malee 21
Unif13
Doikham20
UFC1 Cocomax
9
Others8
Tipco33
Malee 22
Unif15
Doikham18
UFC1
Cocomax5 Others
6
MAT Dec 2015 MAT Dec 2016
Note Including Coconut Water
Source Neilson
5255 56
48 4746 42
4748 45 44
52 53 5458
53
25
30
35
40
45
50
55
60
Q115 Q215 Q315 Q415 Q116 Q216 Q316 Q416
Brand CMG
Sales Structure
10
CMG Contract Manufacturing
Domestic International Business Brand Contract Manufacturing
2016 Domestic sales growth was 3 YoY
2016 Export sales growth was 67 YoY
2016 Brand sales growth was 5 YoY
2016 CMG sales growth was 39 YoY
7971 69 68 66 63
57 58
2129 31 32 34 37 43 42
0
10
20
30
40
50
60
70
80
90
Q115 Q215 Q315 Q415 Q116 Q216 Q316 Q416
Domestic Export
Malee Applied Sciences
ndash New Subsidiary
11
Malee Applied Sciences Co Ltd
(MAS) wholly owned by MALEE was
set up on 12 January 2017
Initial capital investment is Baht 10
million
MAS will enhance the Companyrsquos
capability in innovation research and
development for value added products
and services
MAS also hopes to support farmersrsquo
income with its value added by-
products
Agenda
12
bull Company Overview
bull Business Update
bull Results of Operations and Profitability
bull Forward Looking
Q42016 Net profit growth was attained by the
Companyrsquos strategy and internal management
for efficiency enhancement and cost reduction
2016 Net profit growth was marked by
improved sales revenue while costs were well
managed including production cost selling
expenses and finance costs
2016 Net profit achieved the second highest
profit since 2012 the year in which the
Company benefited from the great flood in
2011
Loss recognized of 40MB from MMBC in
Q42016 was foreseen and according to plan
of the Company that there was high spending
at the beginning as we launched more new products into the market
1542 1507
53896541
0
1000
2000
3000
4000
5000
6000
7000
Q415 Q416 2015 2016
-2
YoY
+21
YoY
Financial Highlights
13
Q42016 Sales growth dropped YoY due to
slower domestic consumption
2016 Sales growth was supported by sales
increase both in Brand and CMG both of
which rose domestically and internationally
In 2016 the Company achieved its highest
record of annual sales since establishment in
1978
1276 1252 1319 1542 1533 1741 17601507
0
500
1000
1500
2000
2500
3000
3500
4000
Q115 Q215 Q315 Q415 Q116 Q216 Q316 Q416
Sales Revenue
Unit Million Baht
85 8258
105 110143
161
117
0
50
100
150
200
250
300
Q115Q215Q315Q415Q116Q216Q316Q416
Net Profit
Unit Million Baht
105 117
331
530
0
100
200
300
400
500
600
Q415 Q416 2015 2016
+11
YoY
+60
YoY
Remark Sales reclassified from net sales of trade rebates
Profitability Margin
14
Q42016 GPM improved YoY due
to enhanced production efficiency
2016 GPM increased as a result of
reduced cost of production per unit in
relation to higher utilization rate as
well as improved cost management
Improved selling expenses to sales
was supported by the grouprsquos cost
control policy and increased sales
ratio of CMG
Q42016 NPM improved YoY due to
efficiency enhancement and cost
reduction despite sales drop YoY
2016 NPM increased from
improved sales revenue while costs
were well managed including
production cost selling expenses
and finance costs
309 323 331 297 299 322 340 322
00
50
100
150
200
250
300
350
400
450
500
Q115 Q215 Q315 Q415 Q116 Q216 Q316 Q416
Gross Profit Margin
297 322 314 322
00
50
100
150
200
250
300
350
400
450
500
Q415 Q416 2015 2016
171 171 203154 146 138 162 129
0050
100150200250300350400450500
Q115 Q215 Q315 Q415 Q116 Q216 Q316 Q416
Selling Expenses Sales
154 129174 144
0050
100150200250300350400450500
Q415 Q416 2015 2016
65 6544
68 7181 91
78
00
20
40
60
80
100
120
140
160
180
200
Q115 Q215 Q315 Q415 Q116 Q216 Q316 Q416
Net Profit Margin
68 7861
81
0020406080
100120140160180200
Q415 Q416 2015 2016
Remark Trade rebates reclassified from selling expenses to net sales
Remark Shut down expense and damaged goods reclassified from administrative expenses to cost of sales
2944 2843 2977 3042 3070 3213 3406 3640
00500000
1000000150000020000002500000300000035000004000000
Q115 Q215 Q315 Q415 Q116 Q216 Q316 Q416
Total Assets
Statement of Financial Position
15
Increased assets from the end of last
year were mainly resulted from
additional investment in machinery as
well as higher inventories
Increased liabilities from the end of last
year were due to higher short-term loans
for investment in machinery and
liabilities under financial lease
Increased equity of parent Companys
shareholders was contributed by
operating profit during the year
Unit Million Baht
1814 1685 1831 1788 1705 1804 1944 2061
00
500000
1000000
1500000
2000000
2500000
Q115 Q215 Q315 Q415 Q116 Q216 Q316 Q416
Total Liabilities
Unit Million Baht
1126 1156 1144 1250 1359 1403 1458 1575
00200000400000600000800000
10000001200000140000016000001800000
Q115 Q215 Q315 Q415 Q116 Q216 Q316 Q416
Equity
Unit Million Baht
Liquidity
16
Reduced current ratio YoY was mainly due to
lower trade receivables higher short-term
loans and higher liabilities under financial
lease while higher inventories resulted in
decreased quick ratio
Improved cash cycle days YoY was due to
shortened collection days and inventory days
in spite of reduced payment days
Higher IBDE from the end of 2015 was due
to higher short-tem loans from financial
institutions and increased liabilities under
financial lease agreements
Lower DE ratio was resulted from reduced
trade payables while the Companyrsquos retained
earnings increased following incurring profits
106 107 106 113 119 119 111095
058 055 053066 070 067 059 050
300400500600700800900
1000110012001300
Q115 Q215 Q315 Q415 Q116 Q216 Q316 Q416
Current Ratio (x) Quick Ratio (x)
083 074 087 068051 050 059 075
161 146160
143125 129 133 131
00
500
1000
1500
2000
2500
3000
Q115 Q215 Q315 Q415 Q116 Q216 Q316 Q416
IBDE (x) DE (x)
80 84 95 90 78 74 78 77
00
20000
40000
60000
80000
100000
120000
Q115 Q215 Q315 Q415 Q116 Q216 Q316 Q416
Cash Cycle Days
150 151 137 148 157192
218 204
00
50
100
150
200
250
Q115 Q215 Q315 Q415 Q116 Q216 Q316 Q416
ROA
Return to Shareholders
17
Improved ROA and ROE YoY was supported by a
substantial increase of net profit
The Company has continuously paid dividend to its
shareholders twice a year since 2012 operation
period
The Company has a policy to pay dividend not less
than 50 of the net profit from normal operation
according to consolidated financial statement after
deduction of tax revenue and legal reserve (with
additional conditions)
Remark Annualized
280 278 273 293 286 325399 375
0050
100150200250300350400450
Q115 Q215 Q315 Q415 Q116 Q216 Q316 Q416
ROE
Remark Annualized
150105 111 120
190
00200400600800
100012001400160018002000
2012 2013 2014 2015 2016
Dividend per Share
Remark Adjusted at par value of 100 Baht
Unit Baht
Agenda
18
bull Company Overview
bull Business Update
bull Results of Operations and Profitability
bull Forward Looking
2017 Looking Ahead
19
Domestic Brand
Renovations Portfolio
Management
CMG
Diversification
International Business
Strategic Expansion
Added to MSCI Global Small Cap IndexesEffective as of the close of 30 November 2016
Share Endorsements
20
Partner
ldquoVery Goodrdquo Level of CG Scoring
For more information please visit our website httpwwwmaleecothor contact irmaleecoth Tel +66 64 301 7978

Agenda
2
bull Company Overview
bull Business Update
bull Results of Operations and Profitability
bull Forward Looking
100 4949100
Stock Symbol MALEE
Industry and Sector Agro amp Food Industry Food and
Beverage
No of Listed Shares 140000000 Shares
Registered Capital THB 140000000
Paid-up Capital THB 140000000
Par Value THB 1 per Share
Listing Date 13 March 1992
Foreign Limit 49 (available 433)
Dividend Policy Not less than 50 of the net profit from
normal operation according to
consolidated financial statement after
deduction of tax revenue and legal reserve
(with additional conditions)
Market Capitalization 13580MB or 390MUSD
Free Float 4777
Group Structure
3
Group Structure
Malee Group PclldquoManufacturing and Exportingrdquo
Malee Enterprise
Co Ltd (MEC)
ldquoDomestic Sale and Marketingrdquo
Share Information (As of 22 March 2017)
Abico Holdings
Pcl268
KamolchatJuangroong
ruangkit
194Thai NVDR54
Others484
A leading manufacturer and distributor of
canned fruits fruit juices and beverages in Thailand
100
70
Shareholding Structure (As of 10 March 2017)
Agri Sol Co Ltd
(AGR)
ldquoDormantrdquo
Malee Harvest Co Ltd
(MHC)
ldquoAgro Businessrdquo
Monde Malee Beverage
Corp (MMBC)
ldquoBeverage Business in Philippinesrdquo
Mega Malee Co Ltd
(MMC)
ldquoNatural Health Drinksrdquo
Lanchang Farm Co
Ltd (LCF)
ldquoHydroponic Farmrdquo JV
Subsidiary
Malee Applied Sciences
Co Ltd (MAS)
ldquoInnovation Research amp Developmentrdquo
100
Milestones
4
20131978
1981
1992
On 26 September 1996 MALEE increased its
capital from 250MB to 500MB
1995
On 9 April 2013 MALEE decreased its
registered capital to 182MB with paid-up
capital of 140MB
2014
2016
On 2 February 1978 Malee Sampran Factory
Co Ltd was established with capital of 10MB
as a manufacturer and distributor of canned
food and canned fruits
On 3 March 1992 MALEE was listed on the
Stock Exchange of Thailand (SET)
1998
1996
MALEE decreased its registered capital to
140MB with paid-up capital of 140MB
The Company expanded its production
base on the land of 30 rais in Sampran
District Nakhon Pathom Province
In April 1995 Abico Holdings Pcl
acquired 40 or 10 million shares of
250MB from the existing shareholders
On 15 May 1998 the Companyrsquos name was
changed to Malee Sampran Pcl
On 9 Dec 1998 MALEE increased its capital to
99999MB with paid-up capital of 700MB
2017
On 12 January 2017 the Company set up a new subsidiary named
Malee Applied Sciences Co Ltd (MAS) to provide innovation
research and development for value added products and services
On 12 May 2016 the Companyrsquos name was changed
to Malee Group Pcl
In Q12016 MALEE together with Monde Nissin
Corporation (MNC) set up a joint venture company
in the Philippines named Monde Malee Beverage
Corporation (MMBC) and launched KRATOS RTD
Coffee as the first product
On 22 August 2016 the Company signed a joint
venture agreement with Mega Lifesciences Pcl to
develop natural health-focused RTD products
13021600 1682 1537
1931 21402357
2615 27062822
2964
2797 2405 2021
1546 898
15101737
16032065
2567
35782062
869
25 (93) (295)131 106 228
646283 307 331 530
-1000
0
1000
2000
3000
4000
5000
6000
7000
2006 2007 2008 2009 2010 2011 2012 2013 2014 2015 2016
Unit Baht Million
CMG Brand Net Profit
10-Yr Historical Performance
5
FloodImpact
2016
Historical
Highest Sales
CMG Contract Manufacturing
bull Prior to 2009 major contribution of CMG was
from canned fruits
bull Discontinued the canned pineapple production
in 2009 and canned sweet corn in 2013
Malee Brand Portfolio
6
Daily Nutrition
Functionality Tactical
Malee 100Juice UHT
Malee 100
Juice Pasteurize
Malee Coco
Malee Nutrients
Malee i-Corn
Malee
HealtiPlus
Malee Food
Service
Malee
Tropical
Malee
Canned
Fruit
OTHERS
Canned Fruit
Dairy Product
Other Beverages
First Choice Farmer
Chokchai Farm
UHT Pasteurize
Canned
Sweetened
Condensed Non Dairy Creamer
TurBusta Maxx
Malee Light
Malee Probiotics
Agenda
7
bull Company Overview
bull Business Update
bull Results of Operations and Profitability
bull Forward Looking
Premium Market (100 RTD Fruit
Juice) 5195MB
37
Medium Market (40-99 RTD
Fruit Juice)1252MB
9(+2 YoY)
Economy Market (20-39 RTD
Fruit Juice)3097MB
22(-7 YoY)
Super Economy Market (lt19
RTD Fruit Juice) 2385MB
17(+13 YoY)
Others2055MB
15
(+7 YoY)
(-13 YoY)
Domestic RTD Fruit Juice
Market
8
Source Neilson
MAT Dec 2016 Market Value of 13982 MB Growth of 1 YoY
Premium Juice UHT Market Share
9
MAT Dec 2016 Market Value of 4802 MB Growth of 9 YoY
Tipco28
Malee 21
Unif13
Doikham20
UFC1 Cocomax
9
Others8
Tipco33
Malee 22
Unif15
Doikham18
UFC1
Cocomax5 Others
6
MAT Dec 2015 MAT Dec 2016
Note Including Coconut Water
Source Neilson
5255 56
48 4746 42
4748 45 44
52 53 5458
53
25
30
35
40
45
50
55
60
Q115 Q215 Q315 Q415 Q116 Q216 Q316 Q416
Brand CMG
Sales Structure
10
CMG Contract Manufacturing
Domestic International Business Brand Contract Manufacturing
2016 Domestic sales growth was 3 YoY
2016 Export sales growth was 67 YoY
2016 Brand sales growth was 5 YoY
2016 CMG sales growth was 39 YoY
7971 69 68 66 63
57 58
2129 31 32 34 37 43 42
0
10
20
30
40
50
60
70
80
90
Q115 Q215 Q315 Q415 Q116 Q216 Q316 Q416
Domestic Export
Malee Applied Sciences
ndash New Subsidiary
11
Malee Applied Sciences Co Ltd
(MAS) wholly owned by MALEE was
set up on 12 January 2017
Initial capital investment is Baht 10
million
MAS will enhance the Companyrsquos
capability in innovation research and
development for value added products
and services
MAS also hopes to support farmersrsquo
income with its value added by-
products
Agenda
12
bull Company Overview
bull Business Update
bull Results of Operations and Profitability
bull Forward Looking
Q42016 Net profit growth was attained by the
Companyrsquos strategy and internal management
for efficiency enhancement and cost reduction
2016 Net profit growth was marked by
improved sales revenue while costs were well
managed including production cost selling
expenses and finance costs
2016 Net profit achieved the second highest
profit since 2012 the year in which the
Company benefited from the great flood in
2011
Loss recognized of 40MB from MMBC in
Q42016 was foreseen and according to plan
of the Company that there was high spending
at the beginning as we launched more new products into the market
1542 1507
53896541
0
1000
2000
3000
4000
5000
6000
7000
Q415 Q416 2015 2016
-2
YoY
+21
YoY
Financial Highlights
13
Q42016 Sales growth dropped YoY due to
slower domestic consumption
2016 Sales growth was supported by sales
increase both in Brand and CMG both of
which rose domestically and internationally
In 2016 the Company achieved its highest
record of annual sales since establishment in
1978
1276 1252 1319 1542 1533 1741 17601507
0
500
1000
1500
2000
2500
3000
3500
4000
Q115 Q215 Q315 Q415 Q116 Q216 Q316 Q416
Sales Revenue
Unit Million Baht
85 8258
105 110143
161
117
0
50
100
150
200
250
300
Q115Q215Q315Q415Q116Q216Q316Q416
Net Profit
Unit Million Baht
105 117
331
530
0
100
200
300
400
500
600
Q415 Q416 2015 2016
+11
YoY
+60
YoY
Remark Sales reclassified from net sales of trade rebates
Profitability Margin
14
Q42016 GPM improved YoY due
to enhanced production efficiency
2016 GPM increased as a result of
reduced cost of production per unit in
relation to higher utilization rate as
well as improved cost management
Improved selling expenses to sales
was supported by the grouprsquos cost
control policy and increased sales
ratio of CMG
Q42016 NPM improved YoY due to
efficiency enhancement and cost
reduction despite sales drop YoY
2016 NPM increased from
improved sales revenue while costs
were well managed including
production cost selling expenses
and finance costs
309 323 331 297 299 322 340 322
00
50
100
150
200
250
300
350
400
450
500
Q115 Q215 Q315 Q415 Q116 Q216 Q316 Q416
Gross Profit Margin
297 322 314 322
00
50
100
150
200
250
300
350
400
450
500
Q415 Q416 2015 2016
171 171 203154 146 138 162 129
0050
100150200250300350400450500
Q115 Q215 Q315 Q415 Q116 Q216 Q316 Q416
Selling Expenses Sales
154 129174 144
0050
100150200250300350400450500
Q415 Q416 2015 2016
65 6544
68 7181 91
78
00
20
40
60
80
100
120
140
160
180
200
Q115 Q215 Q315 Q415 Q116 Q216 Q316 Q416
Net Profit Margin
68 7861
81
0020406080
100120140160180200
Q415 Q416 2015 2016
Remark Trade rebates reclassified from selling expenses to net sales
Remark Shut down expense and damaged goods reclassified from administrative expenses to cost of sales
2944 2843 2977 3042 3070 3213 3406 3640
00500000
1000000150000020000002500000300000035000004000000
Q115 Q215 Q315 Q415 Q116 Q216 Q316 Q416
Total Assets
Statement of Financial Position
15
Increased assets from the end of last
year were mainly resulted from
additional investment in machinery as
well as higher inventories
Increased liabilities from the end of last
year were due to higher short-term loans
for investment in machinery and
liabilities under financial lease
Increased equity of parent Companys
shareholders was contributed by
operating profit during the year
Unit Million Baht
1814 1685 1831 1788 1705 1804 1944 2061
00
500000
1000000
1500000
2000000
2500000
Q115 Q215 Q315 Q415 Q116 Q216 Q316 Q416
Total Liabilities
Unit Million Baht
1126 1156 1144 1250 1359 1403 1458 1575
00200000400000600000800000
10000001200000140000016000001800000
Q115 Q215 Q315 Q415 Q116 Q216 Q316 Q416
Equity
Unit Million Baht
Liquidity
16
Reduced current ratio YoY was mainly due to
lower trade receivables higher short-term
loans and higher liabilities under financial
lease while higher inventories resulted in
decreased quick ratio
Improved cash cycle days YoY was due to
shortened collection days and inventory days
in spite of reduced payment days
Higher IBDE from the end of 2015 was due
to higher short-tem loans from financial
institutions and increased liabilities under
financial lease agreements
Lower DE ratio was resulted from reduced
trade payables while the Companyrsquos retained
earnings increased following incurring profits
106 107 106 113 119 119 111095
058 055 053066 070 067 059 050
300400500600700800900
1000110012001300
Q115 Q215 Q315 Q415 Q116 Q216 Q316 Q416
Current Ratio (x) Quick Ratio (x)
083 074 087 068051 050 059 075
161 146160
143125 129 133 131
00
500
1000
1500
2000
2500
3000
Q115 Q215 Q315 Q415 Q116 Q216 Q316 Q416
IBDE (x) DE (x)
80 84 95 90 78 74 78 77
00
20000
40000
60000
80000
100000
120000
Q115 Q215 Q315 Q415 Q116 Q216 Q316 Q416
Cash Cycle Days
150 151 137 148 157192
218 204
00
50
100
150
200
250
Q115 Q215 Q315 Q415 Q116 Q216 Q316 Q416
ROA
Return to Shareholders
17
Improved ROA and ROE YoY was supported by a
substantial increase of net profit
The Company has continuously paid dividend to its
shareholders twice a year since 2012 operation
period
The Company has a policy to pay dividend not less
than 50 of the net profit from normal operation
according to consolidated financial statement after
deduction of tax revenue and legal reserve (with
additional conditions)
Remark Annualized
280 278 273 293 286 325399 375
0050
100150200250300350400450
Q115 Q215 Q315 Q415 Q116 Q216 Q316 Q416
ROE
Remark Annualized
150105 111 120
190
00200400600800
100012001400160018002000
2012 2013 2014 2015 2016
Dividend per Share
Remark Adjusted at par value of 100 Baht
Unit Baht
Agenda
18
bull Company Overview
bull Business Update
bull Results of Operations and Profitability
bull Forward Looking
2017 Looking Ahead
19
Domestic Brand
Renovations Portfolio
Management
CMG
Diversification
International Business
Strategic Expansion
Added to MSCI Global Small Cap IndexesEffective as of the close of 30 November 2016
Share Endorsements
20
Partner
ldquoVery Goodrdquo Level of CG Scoring
For more information please visit our website httpwwwmaleecothor contact irmaleecoth Tel +66 64 301 7978
Agenda
7
bull Company Overview
bull Business Update
bull Results of Operations and Profitability
bull Forward Looking
Premium Market (100 RTD Fruit
Juice) 5195MB
37
Medium Market (40-99 RTD
Fruit Juice)1252MB
9(+2 YoY)
Economy Market (20-39 RTD
Fruit Juice)3097MB
22(-7 YoY)
Super Economy Market (lt19
RTD Fruit Juice) 2385MB
17(+13 YoY)
Others2055MB
15
(+7 YoY)
(-13 YoY)
Domestic RTD Fruit Juice
Market
8
Source Neilson
MAT Dec 2016 Market Value of 13982 MB Growth of 1 YoY
Premium Juice UHT Market Share
9
MAT Dec 2016 Market Value of 4802 MB Growth of 9 YoY
Tipco28
Malee 21
Unif13
Doikham20
UFC1 Cocomax
9
Others8
Tipco33
Malee 22
Unif15
Doikham18
UFC1
Cocomax5 Others
6
MAT Dec 2015 MAT Dec 2016
Note Including Coconut Water
Source Neilson
5255 56
48 4746 42
4748 45 44
52 53 5458
53
25
30
35
40
45
50
55
60
Q115 Q215 Q315 Q415 Q116 Q216 Q316 Q416
Brand CMG
Sales Structure
10
CMG Contract Manufacturing
Domestic International Business Brand Contract Manufacturing
2016 Domestic sales growth was 3 YoY
2016 Export sales growth was 67 YoY
2016 Brand sales growth was 5 YoY
2016 CMG sales growth was 39 YoY
7971 69 68 66 63
57 58
2129 31 32 34 37 43 42
0
10
20
30
40
50
60
70
80
90
Q115 Q215 Q315 Q415 Q116 Q216 Q316 Q416
Domestic Export
Malee Applied Sciences
ndash New Subsidiary
11
Malee Applied Sciences Co Ltd
(MAS) wholly owned by MALEE was
set up on 12 January 2017
Initial capital investment is Baht 10
million
MAS will enhance the Companyrsquos
capability in innovation research and
development for value added products
and services
MAS also hopes to support farmersrsquo
income with its value added by-
products
Agenda
12
bull Company Overview
bull Business Update
bull Results of Operations and Profitability
bull Forward Looking
Q42016 Net profit growth was attained by the
Companyrsquos strategy and internal management
for efficiency enhancement and cost reduction
2016 Net profit growth was marked by
improved sales revenue while costs were well
managed including production cost selling
expenses and finance costs
2016 Net profit achieved the second highest
profit since 2012 the year in which the
Company benefited from the great flood in
2011
Loss recognized of 40MB from MMBC in
Q42016 was foreseen and according to plan
of the Company that there was high spending
at the beginning as we launched more new products into the market
1542 1507
53896541
0
1000
2000
3000
4000
5000
6000
7000
Q415 Q416 2015 2016
-2
YoY
+21
YoY
Financial Highlights
13
Q42016 Sales growth dropped YoY due to
slower domestic consumption
2016 Sales growth was supported by sales
increase both in Brand and CMG both of
which rose domestically and internationally
In 2016 the Company achieved its highest
record of annual sales since establishment in
1978
1276 1252 1319 1542 1533 1741 17601507
0
500
1000
1500
2000
2500
3000
3500
4000
Q115 Q215 Q315 Q415 Q116 Q216 Q316 Q416
Sales Revenue
Unit Million Baht
85 8258
105 110143
161
117
0
50
100
150
200
250
300
Q115Q215Q315Q415Q116Q216Q316Q416
Net Profit
Unit Million Baht
105 117
331
530
0
100
200
300
400
500
600
Q415 Q416 2015 2016
+11
YoY
+60
YoY
Remark Sales reclassified from net sales of trade rebates
Profitability Margin
14
Q42016 GPM improved YoY due
to enhanced production efficiency
2016 GPM increased as a result of
reduced cost of production per unit in
relation to higher utilization rate as
well as improved cost management
Improved selling expenses to sales
was supported by the grouprsquos cost
control policy and increased sales
ratio of CMG
Q42016 NPM improved YoY due to
efficiency enhancement and cost
reduction despite sales drop YoY
2016 NPM increased from
improved sales revenue while costs
were well managed including
production cost selling expenses
and finance costs
309 323 331 297 299 322 340 322
00
50
100
150
200
250
300
350
400
450
500
Q115 Q215 Q315 Q415 Q116 Q216 Q316 Q416
Gross Profit Margin
297 322 314 322
00
50
100
150
200
250
300
350
400
450
500
Q415 Q416 2015 2016
171 171 203154 146 138 162 129
0050
100150200250300350400450500
Q115 Q215 Q315 Q415 Q116 Q216 Q316 Q416
Selling Expenses Sales
154 129174 144
0050
100150200250300350400450500
Q415 Q416 2015 2016
65 6544
68 7181 91
78
00
20
40
60
80
100
120
140
160
180
200
Q115 Q215 Q315 Q415 Q116 Q216 Q316 Q416
Net Profit Margin
68 7861
81
0020406080
100120140160180200
Q415 Q416 2015 2016
Remark Trade rebates reclassified from selling expenses to net sales
Remark Shut down expense and damaged goods reclassified from administrative expenses to cost of sales
2944 2843 2977 3042 3070 3213 3406 3640
00500000
1000000150000020000002500000300000035000004000000
Q115 Q215 Q315 Q415 Q116 Q216 Q316 Q416
Total Assets
Statement of Financial Position
15
Increased assets from the end of last
year were mainly resulted from
additional investment in machinery as
well as higher inventories
Increased liabilities from the end of last
year were due to higher short-term loans
for investment in machinery and
liabilities under financial lease
Increased equity of parent Companys
shareholders was contributed by
operating profit during the year
Unit Million Baht
1814 1685 1831 1788 1705 1804 1944 2061
00
500000
1000000
1500000
2000000
2500000
Q115 Q215 Q315 Q415 Q116 Q216 Q316 Q416
Total Liabilities
Unit Million Baht
1126 1156 1144 1250 1359 1403 1458 1575
00200000400000600000800000
10000001200000140000016000001800000
Q115 Q215 Q315 Q415 Q116 Q216 Q316 Q416
Equity
Unit Million Baht
Liquidity
16
Reduced current ratio YoY was mainly due to
lower trade receivables higher short-term
loans and higher liabilities under financial
lease while higher inventories resulted in
decreased quick ratio
Improved cash cycle days YoY was due to
shortened collection days and inventory days
in spite of reduced payment days
Higher IBDE from the end of 2015 was due
to higher short-tem loans from financial
institutions and increased liabilities under
financial lease agreements
Lower DE ratio was resulted from reduced
trade payables while the Companyrsquos retained
earnings increased following incurring profits
106 107 106 113 119 119 111095
058 055 053066 070 067 059 050
300400500600700800900
1000110012001300
Q115 Q215 Q315 Q415 Q116 Q216 Q316 Q416
Current Ratio (x) Quick Ratio (x)
083 074 087 068051 050 059 075
161 146160
143125 129 133 131
00
500
1000
1500
2000
2500
3000
Q115 Q215 Q315 Q415 Q116 Q216 Q316 Q416
IBDE (x) DE (x)
80 84 95 90 78 74 78 77
00
20000
40000
60000
80000
100000
120000
Q115 Q215 Q315 Q415 Q116 Q216 Q316 Q416
Cash Cycle Days
150 151 137 148 157192
218 204
00
50
100
150
200
250
Q115 Q215 Q315 Q415 Q116 Q216 Q316 Q416
ROA
Return to Shareholders
17
Improved ROA and ROE YoY was supported by a
substantial increase of net profit
The Company has continuously paid dividend to its
shareholders twice a year since 2012 operation
period
The Company has a policy to pay dividend not less
than 50 of the net profit from normal operation
according to consolidated financial statement after
deduction of tax revenue and legal reserve (with
additional conditions)
Remark Annualized
280 278 273 293 286 325399 375
0050
100150200250300350400450
Q115 Q215 Q315 Q415 Q116 Q216 Q316 Q416
ROE
Remark Annualized
150105 111 120
190
00200400600800
100012001400160018002000
2012 2013 2014 2015 2016
Dividend per Share
Remark Adjusted at par value of 100 Baht
Unit Baht
Agenda
18
bull Company Overview
bull Business Update
bull Results of Operations and Profitability
bull Forward Looking
2017 Looking Ahead
19
Domestic Brand
Renovations Portfolio
Management
CMG
Diversification
International Business
Strategic Expansion
Added to MSCI Global Small Cap IndexesEffective as of the close of 30 November 2016
Share Endorsements
20
Partner
ldquoVery Goodrdquo Level of CG Scoring
For more information please visit our website httpwwwmaleecothor contact irmaleecoth Tel +66 64 301 7978
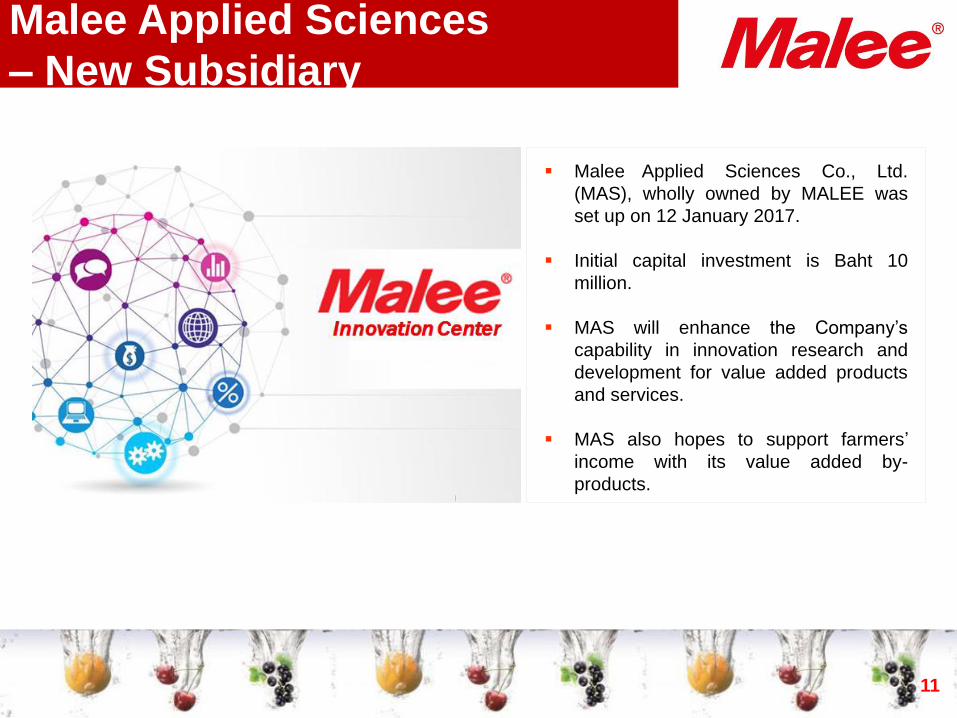

Agenda
12
bull Company Overview
bull Business Update
bull Results of Operations and Profitability
bull Forward Looking
Q42016 Net profit growth was attained by the
Companyrsquos strategy and internal management
for efficiency enhancement and cost reduction
2016 Net profit growth was marked by
improved sales revenue while costs were well
managed including production cost selling
expenses and finance costs
2016 Net profit achieved the second highest
profit since 2012 the year in which the
Company benefited from the great flood in
2011
Loss recognized of 40MB from MMBC in
Q42016 was foreseen and according to plan
of the Company that there was high spending
at the beginning as we launched more new products into the market
1542 1507
53896541
0
1000
2000
3000
4000
5000
6000
7000
Q415 Q416 2015 2016
-2
YoY
+21
YoY
Financial Highlights
13
Q42016 Sales growth dropped YoY due to
slower domestic consumption
2016 Sales growth was supported by sales
increase both in Brand and CMG both of
which rose domestically and internationally
In 2016 the Company achieved its highest
record of annual sales since establishment in
1978
1276 1252 1319 1542 1533 1741 17601507
0
500
1000
1500
2000
2500
3000
3500
4000
Q115 Q215 Q315 Q415 Q116 Q216 Q316 Q416
Sales Revenue
Unit Million Baht
85 8258
105 110143
161
117
0
50
100
150
200
250
300
Q115Q215Q315Q415Q116Q216Q316Q416
Net Profit
Unit Million Baht
105 117
331
530
0
100
200
300
400
500
600
Q415 Q416 2015 2016
+11
YoY
+60
YoY
Remark Sales reclassified from net sales of trade rebates
Profitability Margin
14
Q42016 GPM improved YoY due
to enhanced production efficiency
2016 GPM increased as a result of
reduced cost of production per unit in
relation to higher utilization rate as
well as improved cost management
Improved selling expenses to sales
was supported by the grouprsquos cost
control policy and increased sales
ratio of CMG
Q42016 NPM improved YoY due to
efficiency enhancement and cost
reduction despite sales drop YoY
2016 NPM increased from
improved sales revenue while costs
were well managed including
production cost selling expenses
and finance costs
309 323 331 297 299 322 340 322
00
50
100
150
200
250
300
350
400
450
500
Q115 Q215 Q315 Q415 Q116 Q216 Q316 Q416
Gross Profit Margin
297 322 314 322
00
50
100
150
200
250
300
350
400
450
500
Q415 Q416 2015 2016
171 171 203154 146 138 162 129
0050
100150200250300350400450500
Q115 Q215 Q315 Q415 Q116 Q216 Q316 Q416
Selling Expenses Sales
154 129174 144
0050
100150200250300350400450500
Q415 Q416 2015 2016
65 6544
68 7181 91
78
00
20
40
60
80
100
120
140
160
180
200
Q115 Q215 Q315 Q415 Q116 Q216 Q316 Q416
Net Profit Margin
68 7861
81
0020406080
100120140160180200
Q415 Q416 2015 2016
Remark Trade rebates reclassified from selling expenses to net sales
Remark Shut down expense and damaged goods reclassified from administrative expenses to cost of sales
2944 2843 2977 3042 3070 3213 3406 3640
00500000
1000000150000020000002500000300000035000004000000
Q115 Q215 Q315 Q415 Q116 Q216 Q316 Q416
Total Assets
Statement of Financial Position
15
Increased assets from the end of last
year were mainly resulted from
additional investment in machinery as
well as higher inventories
Increased liabilities from the end of last
year were due to higher short-term loans
for investment in machinery and
liabilities under financial lease
Increased equity of parent Companys
shareholders was contributed by
operating profit during the year
Unit Million Baht
1814 1685 1831 1788 1705 1804 1944 2061
00
500000
1000000
1500000
2000000
2500000
Q115 Q215 Q315 Q415 Q116 Q216 Q316 Q416
Total Liabilities
Unit Million Baht
1126 1156 1144 1250 1359 1403 1458 1575
00200000400000600000800000
10000001200000140000016000001800000
Q115 Q215 Q315 Q415 Q116 Q216 Q316 Q416
Equity
Unit Million Baht
Liquidity
16
Reduced current ratio YoY was mainly due to
lower trade receivables higher short-term
loans and higher liabilities under financial
lease while higher inventories resulted in
decreased quick ratio
Improved cash cycle days YoY was due to
shortened collection days and inventory days
in spite of reduced payment days
Higher IBDE from the end of 2015 was due
to higher short-tem loans from financial
institutions and increased liabilities under
financial lease agreements
Lower DE ratio was resulted from reduced
trade payables while the Companyrsquos retained
earnings increased following incurring profits
106 107 106 113 119 119 111095
058 055 053066 070 067 059 050
300400500600700800900
1000110012001300
Q115 Q215 Q315 Q415 Q116 Q216 Q316 Q416
Current Ratio (x) Quick Ratio (x)
083 074 087 068051 050 059 075
161 146160
143125 129 133 131
00
500
1000
1500
2000
2500
3000
Q115 Q215 Q315 Q415 Q116 Q216 Q316 Q416
IBDE (x) DE (x)
80 84 95 90 78 74 78 77
00
20000
40000
60000
80000
100000
120000
Q115 Q215 Q315 Q415 Q116 Q216 Q316 Q416
Cash Cycle Days
150 151 137 148 157192
218 204
00
50
100
150
200
250
Q115 Q215 Q315 Q415 Q116 Q216 Q316 Q416
ROA
Return to Shareholders
17
Improved ROA and ROE YoY was supported by a
substantial increase of net profit
The Company has continuously paid dividend to its
shareholders twice a year since 2012 operation
period
The Company has a policy to pay dividend not less
than 50 of the net profit from normal operation
according to consolidated financial statement after
deduction of tax revenue and legal reserve (with
additional conditions)
Remark Annualized
280 278 273 293 286 325399 375
0050
100150200250300350400450
Q115 Q215 Q315 Q415 Q116 Q216 Q316 Q416
ROE
Remark Annualized
150105 111 120
190
00200400600800
100012001400160018002000
2012 2013 2014 2015 2016
Dividend per Share
Remark Adjusted at par value of 100 Baht
Unit Baht
Agenda
18
bull Company Overview
bull Business Update
bull Results of Operations and Profitability
bull Forward Looking
2017 Looking Ahead
19
Domestic Brand
Renovations Portfolio
Management
CMG
Diversification
International Business
Strategic Expansion
Added to MSCI Global Small Cap IndexesEffective as of the close of 30 November 2016
Share Endorsements
20
Partner
ldquoVery Goodrdquo Level of CG Scoring
For more information please visit our website httpwwwmaleecothor contact irmaleecoth Tel +66 64 301 7978
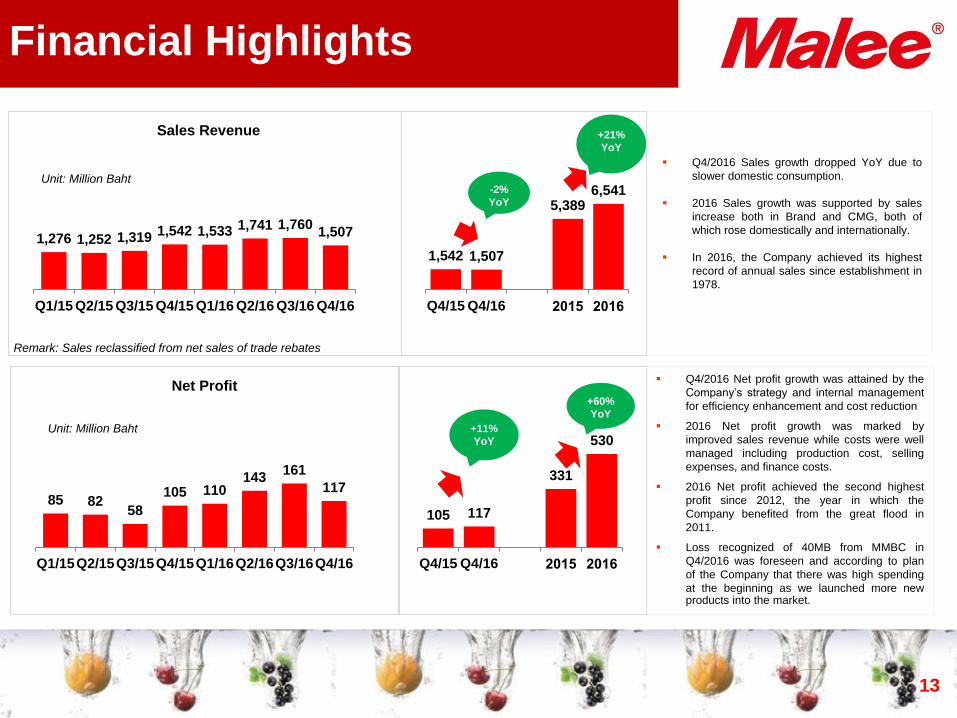
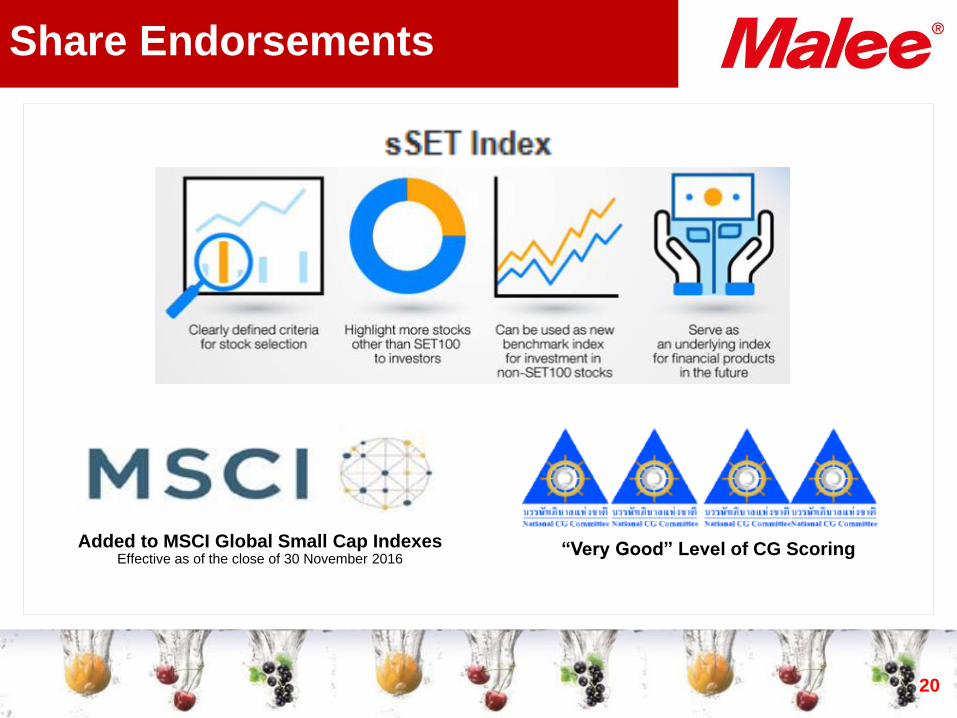
Added to MSCI Global Small Cap IndexesEffective as of the close of 30 November 2016
Share Endorsements
20
Partner
ldquoVery Goodrdquo Level of CG Scoring
For more information please visit our website httpwwwmaleecothor contact irmaleecoth Tel +66 64 301 7978

For more information please visit our website httpwwwmaleecothor contact irmaleecoth Tel +66 64 301 7978