company announcement q2 netcompany continues to grow and
TRANSCRIPT

Netcompany Group A/SGrønningen 17, 1270 Copenhagen
Company Registration no. 39 48 89 14Company Announcement No. 14/2021
18 August 2021
netcompany Company AnnouncementSix months ended 30 June 2021
Netcompany continues to grow and lifts expectations to full year reve-nue growthQ2|21
Netcompany continues to grow and lifts expectations to full year revenue growth Netcompany Group A/SGrønningen 17, 1270 Copenhagen
Company Registration no. 39 48 89 14Company Announcement No. 14/2021
18 August 2021
1
50
In Q2 2021, revenue grew organically by 21.2% in constant currencies to DKK 818.6m compared to the same period last year. In reported currencies revenue grew 22.4%.
Adjusted EBITA grew 3.3% to DKK 166.7m corresponding to an adjusted EBITA margin of 20.2% compared to 23.9% in Q2 2020.
Average number of full-time employees grew by 575, equal to an increase of 21.6% to 3,238 compared to 2,663 in Q2 2020. Free cash flow was negative DKK 10.2m, impacted by a voluntary one-off payment to the Danish Vacation Fund of DKK 96.9m due to the new Danish Holiday Act. Normalised for the payment to the Danish Vacation Fund and on account income tax payments free cash flow was DKK 47.7m.
By the start of July 2021, revenue visibility for the full year increased by 23.4% to DKK 3,064.5m compared to DKK 2,483.6m at the beginning of July 2020 of which DKK 1,681.8m reflects realised revenue in the first half of 2021.
For 2021, Netcompany lifts expectations to organic revenue growth in constant currencies to be around 18%-20%. Netcompany still expects adjusted EBITA margin in constant currencies to be around 23-25%.
Summary
Netcompany continues to grow and lifts expectations to full year revenue growth Netcompany Group A/SGrønningen 17, 1270 Copenhagen
Company Registration no. 39 48 89 14Company Announcement No. 14/2021
18 August 2021
2
50
André RogaczewskiNETCOMPANY CEO AND CO-FOUNDER
“In Q2 2021, we grew 21% and continued the strong momentum from the first quarter of 2021.
With the growth achieved in both the UK and Norway we see that the increased usage of resources across the Group was the right investment made to support long term sustainable growth.
Our continued growth is dependent on our ability to maintain and attract talent and I am pleased to have welcomed more than 350 new Netcompany employees to our large and growing family during the quarter.
As COVID-19 restrictions ease, we have increased our activities with our employees, and I am delighted to see more and more of our talented employees and meet our customers in face-to-face engagements again.
I am excited about the outlook for Netcompany and look forward to continue to expand our presence in Northern Europe together with our employees, customers and other key stakeholders.”

Netcompany continues to grow and lifts expectations to full year revenue growth Netcompany Group A/SGrønningen 17, 1270 Copenhagen
Company Registration no. 39 48 89 14Company Announcement No. 14/2021
18 August 2021
3
50
• Revenue increased by 22.4% to DKK
826.7 in reported currencies and by
21.2% in constant currencies.
• Gross profit margin was 35.5% against
38.4% in Q2 2020.
• Adjusted EBITA margin was 20.2%
against 23.9% in Q2 2020.
• Free cash flow was DKK -10.2m and
was negatively impacted by a one-off
payment to the Danish Vacation Fund
of DKK 96.9m. Adjusted for this, free
cash flow was DKK 86.8m.
• Cash conversion rate was -8.5%.
Adjusted for the payment to the
Danish Vacation Fund and on account
income tax payments conversion rate
was 39.9%.
• Debt leverage to 12 months rolling
adjusted EBITA was 0.8.
Financial overview
Q2 2021 Q2 2021 % change % changeDKK million (reported) (constant)* Q2 2020 (reported) (constant)*
Revenue 826.7 818.6 675.5 22.4% 21.2%
Gross profit 293.4 290.3 259.7 13.0% 11.8%
Adjusted EBITA 166.7 164.5 161.3 3.3% 1.9%
Adjusted EBITA margin 20.2% 20.1% 23.9% -3.7pp -3.8pp
EBITA 166.7 164.5 161.3 3.3% 1.9%
EBITA margin 20.2% 20.1% 23.9% -3.7pp -3.8pp
Operating profit 157.7 155.5 136.0 15.9% 14.3%
Operating profit margin 19.1% 19.0% 20.1% -1.1pp -1.1pp
Net profit / loss 112.4 110.3 96.0 17.1% 14.9%
Free cash flow -10.2 N/A 103.1 -109.9% N/A
Cash conversion rate -8.5% N/A 89.1% -97.7pp N/A
*Constant currencies measured using average exchange rates for Q2 2020
Performance highlights Q2
Netcompany continues to grow and lifts expectations to full year revenue growth Netcompany Group A/SGrønningen 17, 1270 Copenhagen
Company Registration no. 39 48 89 14Company Announcement No. 14/2021
18 August 2021
4
50
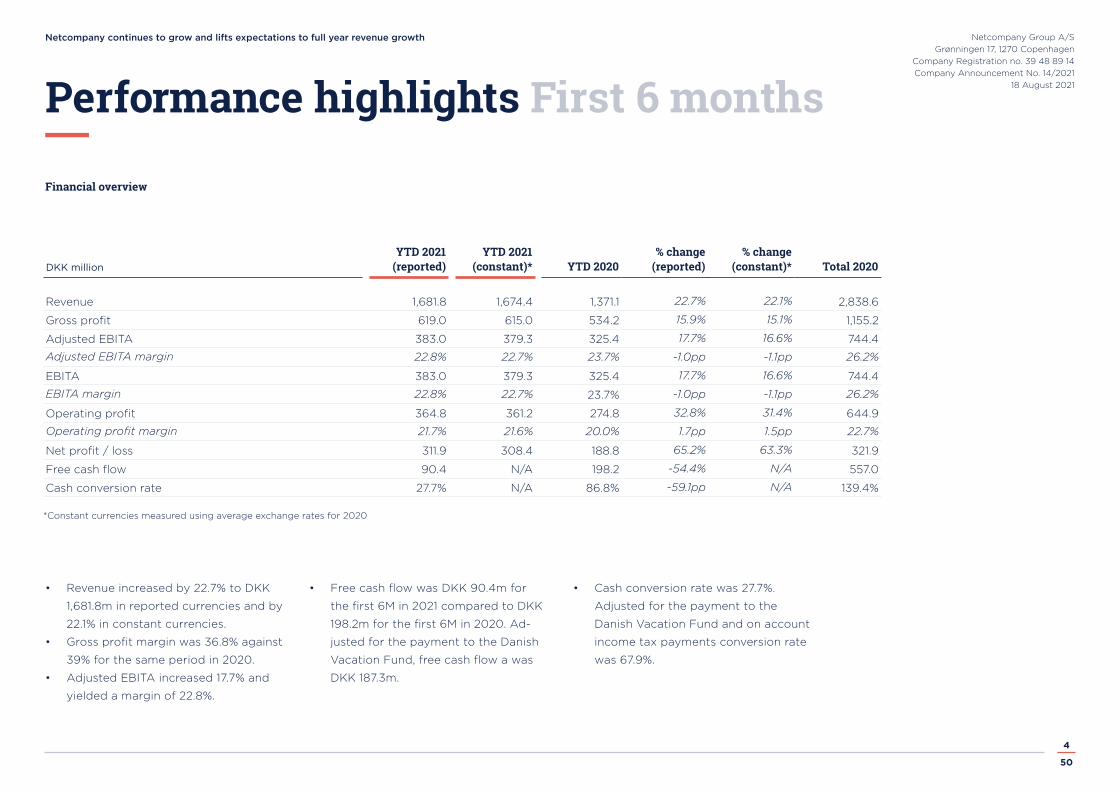
• Revenue increased by 22.7% to DKK
1,681.8m in reported currencies and by
22.1% in constant currencies.
• Gross profit margin was 36.8% against
39% for the same period in 2020.
• Adjusted EBITA increased 17.7% and
yielded a margin of 22.8%.
• Free cash flow was DKK 90.4m for
the first 6M in 2021 compared to DKK
198.2m for the first 6M in 2020. Ad-
justed for the payment to the Danish
Vacation Fund, free cash flow a was
DKK 187.3m.
• Cash conversion rate was 27.7%.
Adjusted for the payment to the
Danish Vacation Fund and on account
income tax payments conversion rate
was 67.9%.
Financial overview
YTD 2021 YTD 2021 % change % changeDKK million (reported) (constant)* YTD 2020 (reported) (constant)* Total 2020
Revenue 1,681.8 1,674.4 1,371.1 22.7% 22.1% 2,838.6
Gross profit 619.0 615.0 534.2 15.9% 15.1% 1,155.2
Adjusted EBITA 383.0 379.3 325.4 17.7% 16.6% 744.4
Adjusted EBITA margin 22.8% 22.7% 23.7% -1.0pp -1.1pp 26.2%
EBITA 383.0 379.3 325.4 17.7% 16.6% 744.4
EBITA margin 22.8% 22.7% 23.7% -1.0pp -1.1pp 26.2%
Operating profit 364.8 361.2 274.8 32.8% 31.4% 644.9
Operating profit margin 21.7% 21.6% 20.0% 1.7pp 1.5pp 22.7%
Net profit / loss 311.9 308.4 188.8 65.2% 63.3% 321.9
Free cash flow 90.4 N/A 198.2 -54.4% N/A 557.0
Cash conversion rate 27.7% N/A 86.8% -59.1pp N/A 139.4%
*Constant currencies measured using average exchange rates for 2020
Performance highlights First 6 months

Netcompany continues to grow and lifts expectations to full year revenue growth Netcompany Group A/SGrønningen 17, 1270 Copenhagen
Company Registration no. 39 48 89 14Company Announcement No. 14/2021
18 August 2021
5
50
In connection with the publication of the
results for Q2 2021, Netcompany will host
a conference call on 18 August 2021 at
11.00 CEST.
The conference call will be held in English
and can be followed live via the compa-
ny’s website; www.netcompany.com.
Dial-in details for investors and analysts
DK +45 78 15 01 09
UK +44 333 300 9262
US +1 631 913 1422
Webcast Player URLhttps://streams.eventcdn.net/netcompany
/2021q2
Additional information
André Rogaczewski, CEO+45 70 13 14 40
Thomas Johansen, CFO+45 51 19 32 24
Conference call details

Netcompany continues to grow and lifts expectations to full year revenue growth Netcompany Group A/SGrønningen 17, 1270 Copenhagen
Company Registration no. 39 48 89 14Company Announcement No. 14/2021
18 August 2021
6
50
Financial highlights and key figures
% change % changeDKK million Q2 2021 Q2 2020 Q2 YTD 2021 YTD 2020 YTD
Income statement
Revenue
Public 488.0 442.2 10.4% 990.3 875.5 13.1%
Private 338.7 233.4 45.1% 691.5 495.6 39.5%
Revenue by segments, total 826.7 675.5 22.4% 1,681.8 1,371.1 22.7%
Development 513.2 347.4 47.7% 1,030.7 703.2 46.6%
Maintenance 313.5 328.1 -4.5% 651.2 668.0 -2.5%
Revenue by types, total 826.7 675.5 22.4% 1,681.8 1,371.1 22.7%
Organic 826.7 667.1 23.9% 1,681.8 1,345.0 25.0%
Acquisition 0.0 8.5 -100.0% 0.0 26.2 -100.0%
Revenue by growth, total 826.7 675.5 22.4% 1,681.8 1,371.1 22.7%
Special items 0.0 0.0 N/A 0.0 -0.0 -100.0%
Adjusted EBITA 166.7 161.3 3.3% 383.0 325.4 17.7%
EBITA 166.7 161.3 3.3% 383.0 325.4 17.7%
Operating profit (EBIT) 157.7 136.0 15.9% 364.8 274.8 32.8%
Net financials -6.7 -16.2 -58.3% -13.4 -35.3 -62.1%
Net profit / loss 112.4 96.0 17.1% 311.9 188.8 65.2%
Financial position
Capex -5.0 -3.3 50.3% -23.2 -14.9 55.7%
Total assets 4,090.0 3,916.8 4.4% 4,090.0 3,916.8 4.4%
Equity 2,666.4 2,281.1 16.9% 2,666.4 2,281.1 16.9%
Dividends Paid 0.0 0.0 N/A -49.1 0.0 N/A
Net increase in cash and cash equivalents -134.6 92.1 -246.2% -184.2 175.9 -204.8%
Free cash flow -10.2 103.1 -109.9% 90.4 198.2 -54.4%
Free cash flow (tax normalised) -49.2 75.7 -165.0% 124.6 211.8 -41.2%
Netcompany continues to grow and lifts expectations to full year revenue growth Netcompany Group A/SGrønningen 17, 1270 Copenhagen
Company Registration no. 39 48 89 14Company Announcement No. 14/2021
18 August 2021
7
50
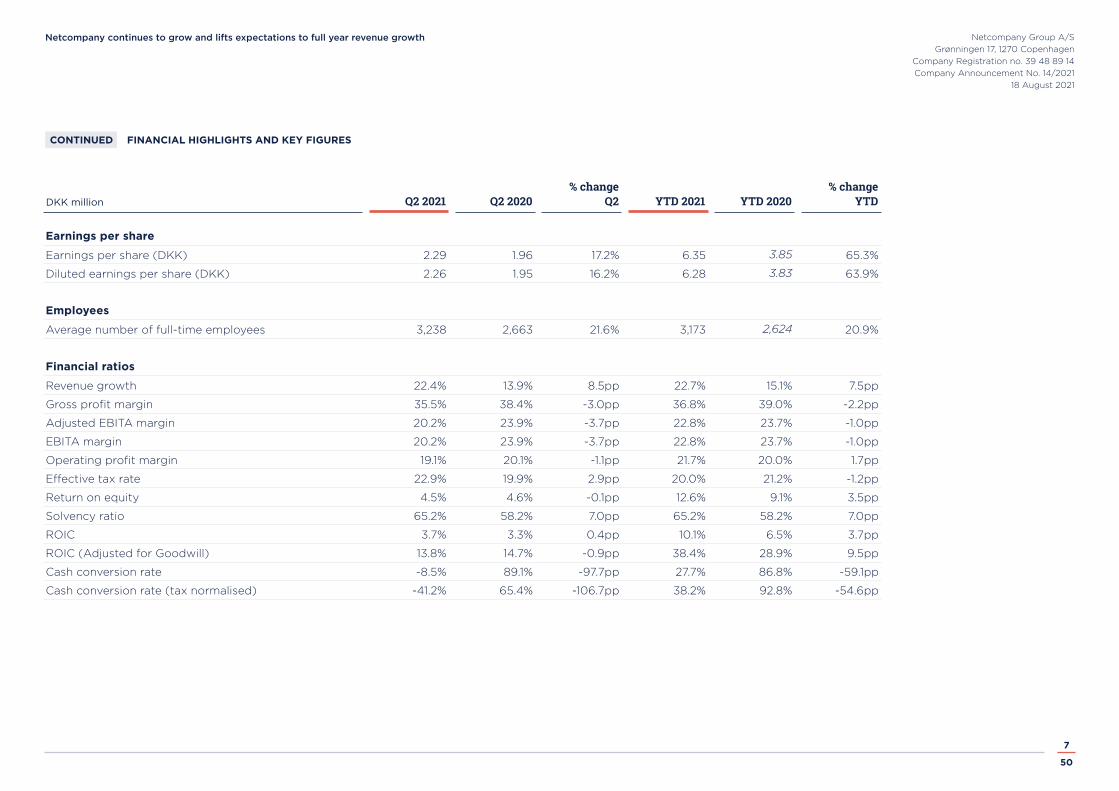
FINANCIAL HIGHLIGHTS AND KEY FIGURESCONTINUED
Earnings per share
Earnings per share (DKK) 2.29 1.96 17.2% 6.35 3.85 65.3%
Diluted earnings per share (DKK) 2.26 1.95 16.2% 6.28 3.83 63.9%
Employees
Average number of full-time employees 3,238 2,663 21.6% 3,173 2,624 20.9%
Financial ratios
Revenue growth 22.4% 13.9% 8.5pp 22.7% 15.1% 7.5pp
Gross profit margin 35.5% 38.4% -3.0pp 36.8% 39.0% -2.2pp
Adjusted EBITA margin 20.2% 23.9% -3.7pp 22.8% 23.7% -1.0pp
EBITA margin 20.2% 23.9% -3.7pp 22.8% 23.7% -1.0pp
Operating profit margin 19.1% 20.1% -1.1pp 21.7% 20.0% 1.7pp
Effective tax rate 22.9% 19.9% 2.9pp 20.0% 21.2% -1.2pp
Return on equity 4.5% 4.6% -0.1pp 12.6% 9.1% 3.5pp
Solvency ratio 65.2% 58.2% 7.0pp 65.2% 58.2% 7.0pp
ROIC 3.7% 3.3% 0.4pp 10.1% 6.5% 3.7pp
ROIC (Adjusted for Goodwill) 13.8% 14.7% -0.9pp 38.4% 28.9% 9.5pp
Cash conversion rate -8.5% 89.1% -97.7pp 27.7% 86.8% -59.1pp
Cash conversion rate (tax normalised) -41.2% 65.4% -106.7pp 38.2% 92.8% -54.6pp
% change % changeDKK million Q2 2021 Q2 2020 Q2 YTD 2021 YTD 2020 YTD
Netcompany continues to grow and lifts expectations to full year revenue growth Netcompany Group A/SGrønningen 17, 1270 Copenhagen
Company Registration no. 39 48 89 14Company Announcement No. 14/2021
18 August 2021
8
50
Performance overview Q2
Q2 2021 Q2 2021 % change % changeDKK million (reported) (constant)* Q2 2020 (reported) (constant)*
Revenue 826.7 818.6 675.5 22.4% 21.2%
Cost of services -533.3 -528.3 -415.8 28.2% 27.0%
Gross profit 293.4 290.3 259.7 13.0% 11.8%
Gross profit margin 35.5% 35.5% 38.4% -3.0pp -3.0pp
Sales and marketing costs -6.1 -6.1 -3.8 60.6% 59.3%
Administrative costs -120.6 -119.8 -94.6 27.5% 26.7%
Adjusted EBITA 166.7 164.5 161.3 3.3% 1.9%
Adjusted EBITA margin 20.2% 20.1% 23.9% -3.7pp -3.8pp
Special items 0.0 0.0 0.0 0.0% 0.0%
EBITA 166.7 164.5 161.3 3.3% 1.9%
EBITA margin 20.2% 20.1% 23.9% -3.7pp -3.8pp
Amortisation -9.0 -9.0 -25.3 -64.4% -64.4%
Operating profit (EBIT) 157.7 155.5 136.0 15.9% 14.3%
Operating profit margin 19.1% 19.0% 20.1% -1.1pp -1.1pp
Net financials -6.7 -6.7 -16.2 -58.3% -58.5%
Income / loss from investment in joint venture -5.2 -5.2 0.0 N/A N/A
Profit / loss before tax 145.7 143.6 119.9 21.6% 19.7%
Tax -33.3 -33.3 -23.9 39.4% 39.3%
Effective tax rate 22.9% 23.2% 19.9% 2.9pp 3.3pp
Net profit / loss 112.4 110.3 96.0 17.1% 14.9%
*Constant currencies measured using average exchange rates for Q2 2020
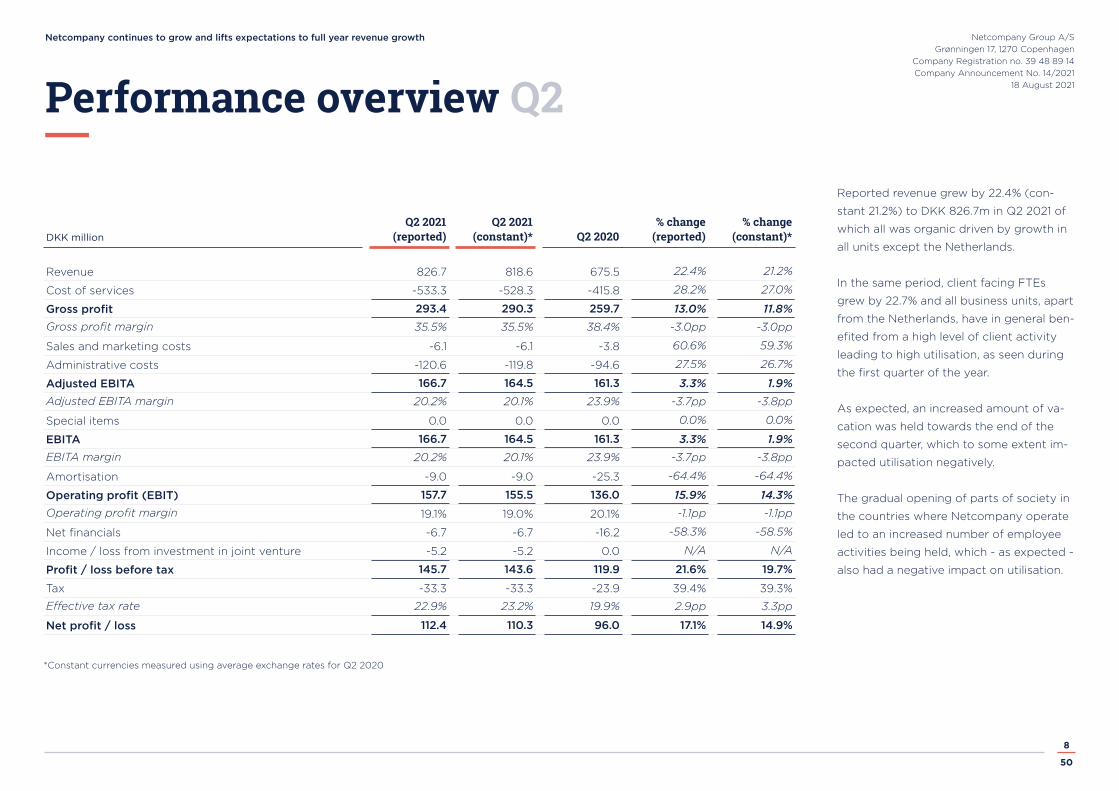
Reported revenue grew by 22.4% (con-
stant 21.2%) to DKK 826.7m in Q2 2021 of
which all was organic driven by growth in
all units except the Netherlands.
In the same period, client facing FTEs
grew by 22.7% and all business units, apart
from the Netherlands, have in general ben-
efited from a high level of client activity
leading to high utilisation, as seen during
the first quarter of the year.
As expected, an increased amount of va-
cation was held towards the end of the
second quarter, which to some extent im-
pacted utilisation negatively.
The gradual opening of parts of society in
the countries where Netcompany operate
led to an increased number of employee
activities being held, which - as expected -
also had a negative impact on utilisation.
Netcompany continues to grow and lifts expectations to full year revenue growth Netcompany Group A/SGrønningen 17, 1270 Copenhagen
Company Registration no. 39 48 89 14Company Announcement No. 14/2021
18 August 2021
9
50
Netcompany and the increase in costs re-
lated hereto was expected.
Adjusted EBITA increased slightly to DKK
166.7m in Q2 2021 yielding an adjusted
EBITA margin of 20.2% compared to
23.9% in the same quarter last year. The
greater part of the lower adjusted EBITA
margin was explained by the lower gross
profit margin. In addition hereto, the
non-recurring severance payment made in
the UK during Q2 had a negative impact
on adjusted EBITA margin by around 0.8
percentage point in the quarter.
Amortisation were DKK 9m in the second
quarter, which was 64.4% lower than the
same period last year following the same
trend as in Q1 2021 as a number of assets
related to FSN acquiring 52% of the shares
of Netcompany on 1 February 2016 were
fully amortised during Q1 2021.
Net financials were negative with DKK
6.7m of which the majority was related to
exchange rate adjustments. Compared to
Q2 2020, the level of net exchange rate
adjustments were significantly reduced
from DKK 10.1m to DKK 1.6m, mainly as an
Sales and marketing costs increased by
60.6% to DKK 6.1m as a result of increased
marketing campaigns, in particular the
units outside of Denmark.
Administrative costs increased by 27.5% to
DKK 120.6m in Q2 2021, mainly impacted
by the non-recurring severance payment
of around DKK 7m in the UK unit. In ad-
dition, a number of previously deferred
employee activities were held during the
quarter as more and more COVID-19 relat-
ed restrictions were lifted allowing for in-
creased in-person presence and meetings.
These activities are essential in maintain-
ing and building the culture for
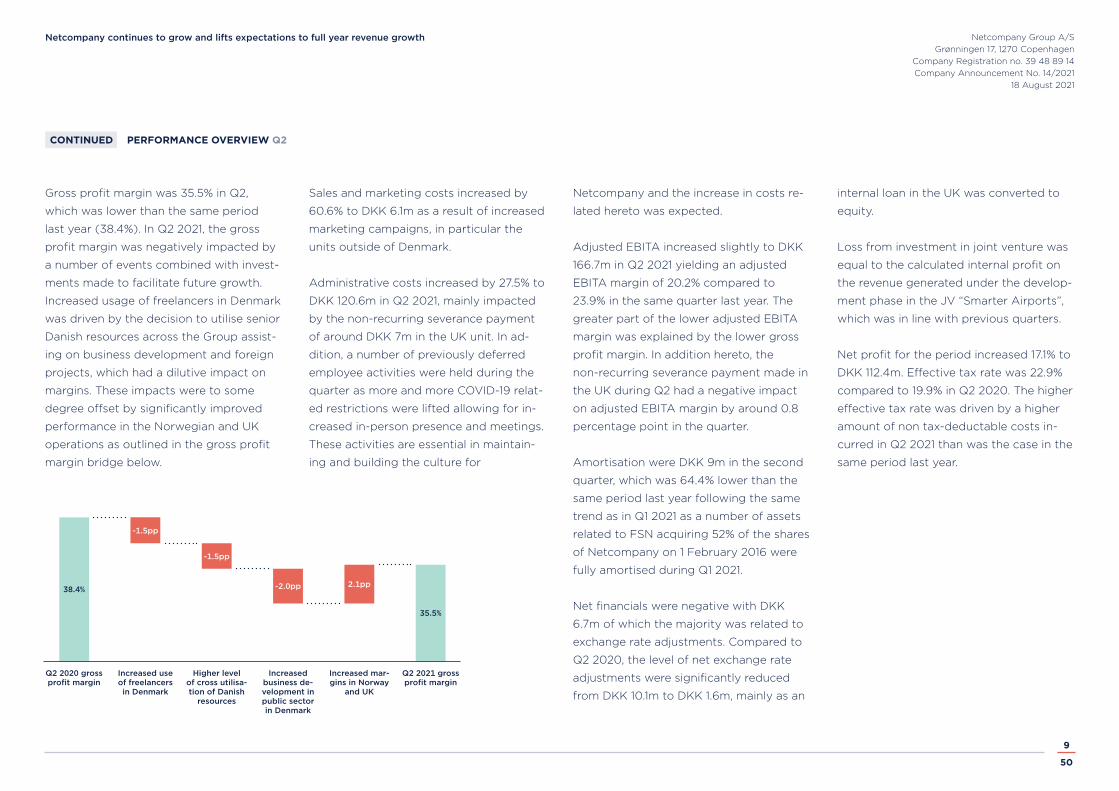
Gross profit margin was 35.5% in Q2,
which was lower than the same period
last year (38.4%). In Q2 2021, the gross
profit margin was negatively impacted by
a number of events combined with invest-
ments made to facilitate future growth.
Increased usage of freelancers in Denmark
was driven by the decision to utilise senior
Danish resources across the Group assist-
ing on business development and foreign
projects, which had a dilutive impact on
margins. These impacts were to some
degree offset by significantly improved
performance in the Norwegian and UK
operations as outlined in the gross profit
margin bridge below.
PERFORMANCE OVERVIEW Q2CONTINUED
internal loan in the UK was converted to
equity.
Loss from investment in joint venture was
equal to the calculated internal profit on
the revenue generated under the develop-
ment phase in the JV “Smarter Airports”,
which was in line with previous quarters.
Net profit for the period increased 17.1% to
DKK 112.4m. Effective tax rate was 22.9%
compared to 19.9% in Q2 2020. The higher
effective tax rate was driven by a higher
amount of non tax-deductable costs in-
curred in Q2 2021 than was the case in the
same period last year.
38.4% -2.0pp 2.1pp
-1.5pp
-1.5pp
35.5%
Q2 2020 gross profit margin
Increased use of freelancers in Denmark
Higher level of cross utilisa-tion of Danish
resources
Increased business de-velopment in public sector in Denmark
Increased mar-gins in Norway
and UK
Q2 2021 gross profit margin
Netcompany continues to grow and lifts expectations to full year revenue growth Netcompany Group A/SGrønningen 17, 1270 Copenhagen
Company Registration no. 39 48 89 14Company Announcement No. 14/2021
18 August 2021
10
50
Performance overview First 6 months
YTD 2021 YTD 2021 % change % changeDKK million (reported) (constant)* YTD 2020 (reported) (constant)* Total 2020
Revenue 1,681.8 1,674.4 1,371.1 22.7% 22.1% 2,838.6
Cost of services -1,062.8 -1,059.4 -836.9 27.0% 26.6% -1,683.4
Gross profit 619.0 615.0 534.2 15.9% 15.1% 1,155.2Gross profit margin 36.8% 36.7% 39.0% -2.2pp -2.2pp 40.7%
Sales and marketing costs -12.2 -12.2 -8.2 48.8% 48.4% -17.1
Administrative costs -223.8 -223.5 -200.6 11.6% 11.4% -393.7
Adjusted EBITA 383.0 379.3 325.4 17.7% 16.6% 744.4Adjusted EBITA margin 22.8% 22.7% 23.7% -1.0pp -1.1pp 26.2%
Special items 0.0 0.0 -0.0 -100.0% -100.0% -0.0
EBITA 383.0 379.3 325.4 17.7% 16.6% 744.4EBITA margin 22.8% 22.7% 23.7% -1.0pp -1.1pp 26.2%
Amortisation -18.2 -18.2 -50.6 -64.1% -64.1% -99.4
Operating profit (EBIT) 364.8 361.2 274.8 32.8% 31.4% 644.9Operating profit margin 21.7% 21.6% 20.0% 1.7pp 1.5pp 22.7%
Net financials -13.4 -13.4 -35.3 -62.1% -62.2% -47.0
Fair value adjustment of contingent con-sideration
49.5 49.5 0.0 N/A N/A -141.3
Income / loss from investment in joint venture
-11.2 -11.2 0.0 N/A N/A -5.0
Profit / loss before tax 389.7 386.1 239.5 62.7% 61.2% 451.7
Tax -77.8 -77.7 -50.7 53.4% 53.3% -129.8
Effective tax rate 20.0% 20.1% 21.2% -1.2pp -1.0pp 28.7%
Net profit / loss 311.9 308.4 188.8 65.2% 63.3% 321.9
*Constant currencies measured using average exchange rates for 2020
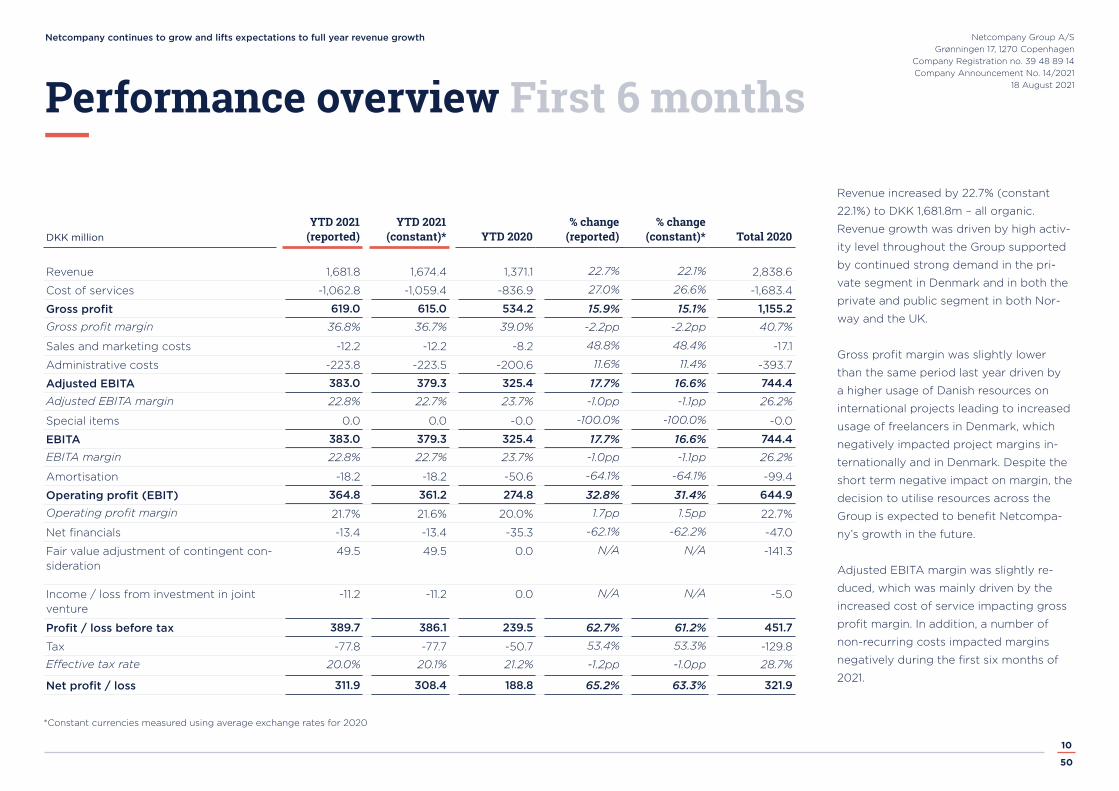
Revenue increased by 22.7% (constant
22.1%) to DKK 1,681.8m – all organic.
Revenue growth was driven by high activ-
ity level throughout the Group supported
by continued strong demand in the pri-
vate segment in Denmark and in both the
private and public segment in both Nor-
way and the UK.
Gross profit margin was slightly lower
than the same period last year driven by
a higher usage of Danish resources on
international projects leading to increased
usage of freelancers in Denmark, which
negatively impacted project margins in-
ternationally and in Denmark. Despite the
short term negative impact on margin, the
decision to utilise resources across the
Group is expected to benefit Netcompa-
ny’s growth in the future.
Adjusted EBITA margin was slightly re-
duced, which was mainly driven by the
increased cost of service impacting gross
profit margin. In addition, a number of
non-recurring costs impacted margins
negatively during the first six months of
2021.

Netcompany continues to grow and lifts expectations to full year revenue growth Netcompany Group A/SGrønningen 17, 1270 Copenhagen
Company Registration no. 39 48 89 14Company Announcement No. 14/2021
18 August 2021
11
50
Business Segments Q2Segment information related to operating entities
DKK million Q2 2021Constant (2020 rate) Group Denmark Norway UK Netherlands
Revenue from external customers 818.6 637.1 62.9 98.1 20.5
Gross profit 290.3 246.8 15.2 23.6 6.2Gross profit margin 35.5% 38.7% 24.2% 24.1% 30.3%
Local admin costs -115.8 -80.6 -10.5 -18.0 -8.1
Adjusted EBITA before allocated cost from HQ 174.6 166.2 4.7 5.6 -1.9
Adjusted EBITA margin before allocated cost from HQ 21.3% 26.1% 7.4% 5.7% -9.3%
Allocated costs from HQ -10.1 -7.5 -0.9 -1.4 -0.4
EBITA 164.5 158.7 3.8 4.2 -2.3
Client facing FTEs 3,045 2,250 260 400 135
DKK million Q2 2020Reported Group Denmark Norway UK Netherlands
Revenue from external customers 675.5 531.5 42.8 80.2 21.1
Gross profit 259.7 236.1 5.3 10.7 7.6Gross profit margin 38.4% 44.4% 12.4% 13.3% 36.1%
Local admin costs -88.2 -66.6 -5.5 -10.9 -5.3
Adjusted EBITA before allocated cost from HQ 171.5 169.5 -0.1 -0.2 2.3
Adjusted EBITA margin before allocated cost from HQ 25.4% 31.9% -0.3% -0.2% 10.9%
Allocated costs from HQ -10.2 -7.5 -0.6 -1.6 -0.5
EBITA 161.3 162.0 -0.8 -1.7 1.9
Client facing FTEs 2,482 1,774 223 381 103
Revenue, %
Revenue, %
7.7%
6.3%
12%
77.8%
78.7%
2.5%
11.9%
NO
DK
UK
NL
Q2 2021
Q2 2020
3.1%
*Constant currencies measured using average exchange rates for 2020
Netcompany continues to grow and lifts expectations to full year revenue growth Netcompany Group A/SGrønningen 17, 1270 Copenhagen
Company Registration no. 39 48 89 14Company Announcement No. 14/2021
18 August 2021
12
50
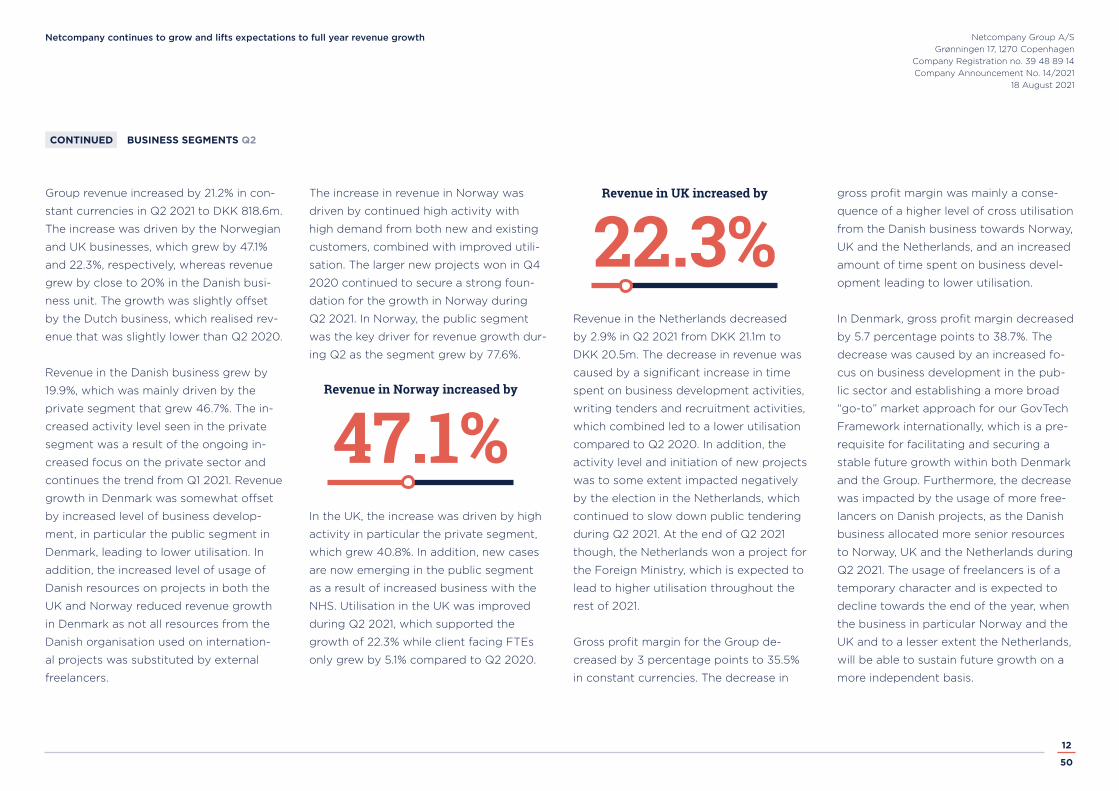
Group revenue increased by 21.2% in con-
stant currencies in Q2 2021 to DKK 818.6m.
The increase was driven by the Norwegian
and UK businesses, which grew by 47.1%
and 22.3%, respectively, whereas revenue
grew by close to 20% in the Danish busi-
ness unit. The growth was slightly offset
by the Dutch business, which realised rev-
enue that was slightly lower than Q2 2020.
Revenue in the Danish business grew by
19.9%, which was mainly driven by the
private segment that grew 46.7%. The in-
creased activity level seen in the private
segment was a result of the ongoing in-
creased focus on the private sector and
continues the trend from Q1 2021. Revenue
growth in Denmark was somewhat offset
by increased level of business develop-
ment, in particular the public segment in
Denmark, leading to lower utilisation. In
addition, the increased level of usage of
Danish resources on projects in both the
UK and Norway reduced revenue growth
in Denmark as not all resources from the
Danish organisation used on internation-
al projects was substituted by external
freelancers.
The increase in revenue in Norway was
driven by continued high activity with
high demand from both new and existing
customers, combined with improved utili-
sation. The larger new projects won in Q4
2020 continued to secure a strong foun-
dation for the growth in Norway during
Q2 2021. In Norway, the public segment
was the key driver for revenue growth dur-
ing Q2 as the segment grew by 77.6%.
In the UK, the increase was driven by high
activity in particular the private segment,
which grew 40.8%. In addition, new cases
are now emerging in the public segment
as a result of increased business with the
NHS. Utilisation in the UK was improved
during Q2 2021, which supported the
growth of 22.3% while client facing FTEs
only grew by 5.1% compared to Q2 2020.
Revenue in the Netherlands decreased
by 2.9% in Q2 2021 from DKK 21.1m to
DKK 20.5m. The decrease in revenue was
caused by a significant increase in time
spent on business development activities,
writing tenders and recruitment activities,
which combined led to a lower utilisation
compared to Q2 2020. In addition, the
activity level and initiation of new projects
was to some extent impacted negatively
by the election in the Netherlands, which
continued to slow down public tendering
during Q2 2021. At the end of Q2 2021
though, the Netherlands won a project for
the Foreign Ministry, which is expected to
lead to higher utilisation throughout the
rest of 2021.
Gross profit margin for the Group de-
creased by 3 percentage points to 35.5%
in constant currencies. The decrease in
gross profit margin was mainly a conse-
quence of a higher level of cross utilisation
from the Danish business towards Norway,
UK and the Netherlands, and an increased
amount of time spent on business devel-
opment leading to lower utilisation.
In Denmark, gross profit margin decreased
by 5.7 percentage points to 38.7%. The
decrease was caused by an increased fo-
cus on business development in the pub-
lic sector and establishing a more broad
“go-to” market approach for our GovTech
Framework internationally, which is a pre-
requisite for facilitating and securing a
stable future growth within both Denmark
and the Group. Furthermore, the decrease
was impacted by the usage of more free-
lancers on Danish projects, as the Danish
business allocated more senior resources
to Norway, UK and the Netherlands during
Q2 2021. The usage of freelancers is of a
temporary character and is expected to
decline towards the end of the year, when
the business in particular Norway and the
UK and to a lesser extent the Netherlands,
will be able to sustain future growth on a
more independent basis.
BUSINESS SEGMENTS Q2CONTINUED
47.1%Revenue in Norway increased by
22.3%Revenue in UK increased by

Netcompany continues to grow and lifts expectations to full year revenue growth Netcompany Group A/SGrønningen 17, 1270 Copenhagen
Company Registration no. 39 48 89 14Company Announcement No. 14/2021
18 August 2021
13
50
The increase in administrative costs was
mainly driven by the non-recurring sev-
erance payment of around DKK 6.7m to
the former UK management, which was
expensed fully in Q2 2021.
Adjusted EBITA in the Netherlands de-
creased by 20.2 percentage points. The
decrease was a consequence of the de-
crease in gross profit, which decreased by
5.8 percentage points, and the conscious
decision to allocate Danish senior employ-
ees to help prepare the Dutch business for
further growth by investing extra in busi-
ness development.
which will increase administrative costs
further as employee based activities, edu-
cation and travel to customers and other
units within the Group are expected to
increase.
Adjusted EBITA in Norway increased by
7.8 percentage points to 7.4%. The in-
crease was positively impacted by the
development in gross profit, but some-
what offset by an increase of more than
DKK 5m in local administration costs. The
increase in local administration cost was
mainly driven by costs relating to external
recruitment fees, fees to external advisors
related to the move to a new headquarter
in Oslo and a new office in Trondheim and
increased costs for local employee events
in Norway.
Adjusted EBITA in the UK business was
5.7%, an increase of 5.9 percentage points
compared to Q2 2020. The increase in
adjusted EBITA was a direct consequence
of the increase in gross profit margin of
10.7 percentage points, somewhat offset
by an increase in local administrative
costs of 66% in UK compared to Q2 2020.
in a lower utilisation compared to Q2
2020.
Adjusted EBITA margin decreased by 4.1
percentage points, of which 3 percentage
points was related to the negative impact
on gross profit margins. The remaining re-
duction in EBITA margin was driven by an
increase in administrative costs, which was
partly due to COVID-19 restrictions being
lifted throughout Q2 2021, allowing for in-
creased employee activities. Furthermore,
severance payment to the members of the
previous UK management was expensed
during Q2 2021, impacting adjusted EBITA
for the Group negatively by around 0.8
percentage point.
Adjusted EBITA in Denmark decreased by
5.8 percentage points, which was mainly
driven by the gross profit margin. In addi-
tion, administrative costs increased after
many of the COVID-19 restrictions were
lifted, making it possible again to socialise
with colleagues and to participate in-per-
son in education activities. It is expected
that more restrictions in Denmark will be
lifted throughout the following months,
Gross profit margins in Norway increased
by 11.7 percentage points, which was a
result of a continued improved utilisation
and releasing employees from the bench.
Furthermore, the increase was somewhat
impacted by a low comparable base in Q2
2020.
In UK, gross profit margin increased by
10.7 percentage points from 13.3% to
24.1%, as activity level picked up leading
to increased utilisation as also seen in
Norway. In Q2 2020, the UK business was
negatively impacted from COVID-19 relat-
ed loss of business, yielding a lower com-
parable base to Q2 2021.
Gross profit margin in the Netherlands de-
creased by 5.8 percentage points, mainly
as result of increased business develop-
ment and writing tenders, which resulted
121%Gross profit in UK increased by
BUSINESS SEGMENTS Q2CONTINUED
Netcompany continues to grow and lifts expectations to full year revenue growth Netcompany Group A/SGrønningen 17, 1270 Copenhagen
Company Registration no. 39 48 89 14Company Announcement No. 14/2021
18 August 2021
14
50
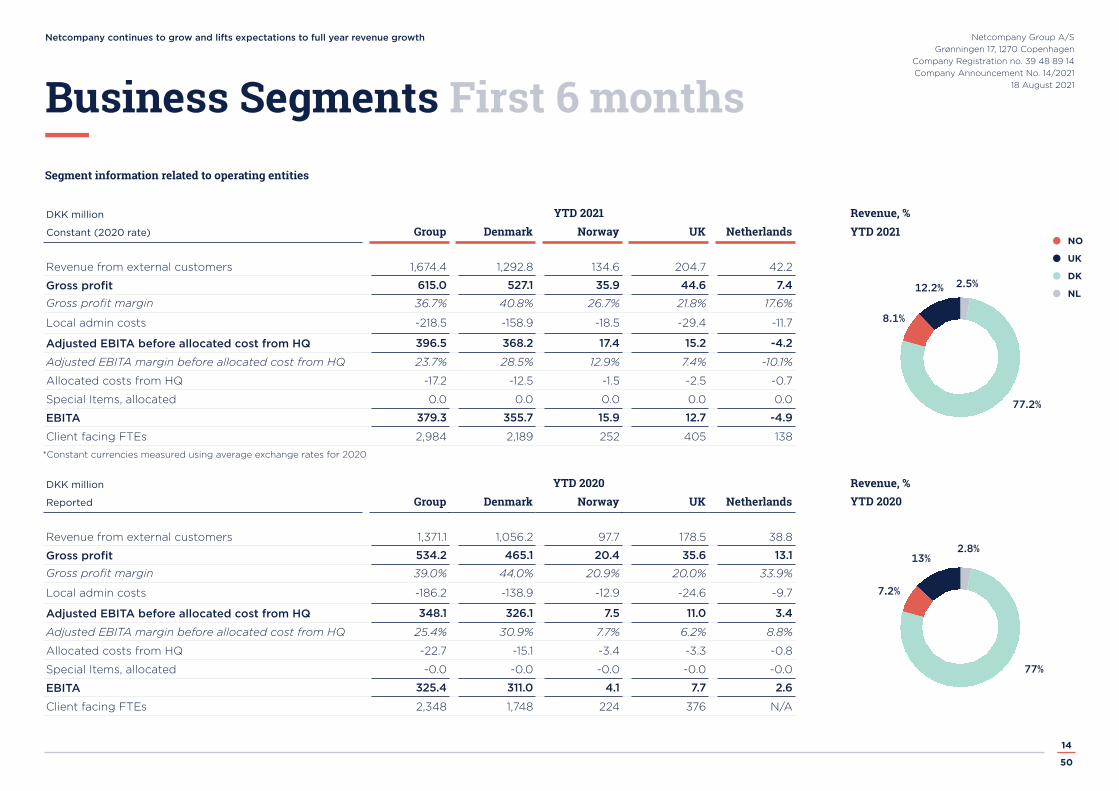
Business Segments First 6 monthsSegment information related to operating entities
DKK million YTD 2021Constant (2020 rate) Group Denmark Norway UK Netherlands
Revenue from external customers 1,674.4 1,292.8 134.6 204.7 42.2
Gross profit 615.0 527.1 35.9 44.6 7.4Gross profit margin 36.7% 40.8% 26.7% 21.8% 17.6%
Local admin costs -218.5 -158.9 -18.5 -29.4 -11.7
Adjusted EBITA before allocated cost from HQ 396.5 368.2 17.4 15.2 -4.2
Adjusted EBITA margin before allocated cost from HQ 23.7% 28.5% 12.9% 7.4% -10.1%
Allocated costs from HQ -17.2 -12.5 -1.5 -2.5 -0.7
Special Items, allocated 0.0 0.0 0.0 0.0 0.0
EBITA 379.3 355.7 15.9 12.7 -4.9
Client facing FTEs 2,984 2,189 252 405 138
DKK million YTD 2020Reported Group Denmark Norway UK Netherlands
Revenue from external customers 1,371.1 1,056.2 97.7 178.5 38.8
Gross profit 534.2 465.1 20.4 35.6 13.1Gross profit margin 39.0% 44.0% 20.9% 20.0% 33.9%
Local admin costs -186.2 -138.9 -12.9 -24.6 -9.7
Adjusted EBITA before allocated cost from HQ 348.1 326.1 7.5 11.0 3.4
Adjusted EBITA margin before allocated cost from HQ 25.4% 30.9% 7.7% 6.2% 8.8%
Allocated costs from HQ -22.7 -15.1 -3.4 -3.3 -0.8
Special Items, allocated -0.0 -0.0 -0.0 -0.0 -0.0
EBITA 325.4 311.0 4.1 7.7 2.6
Client facing FTEs 2,348 1,748 224 376 N/A
Revenue, %
Revenue, %
8.1%
7.2%
12.2%
77.2%
77%
2.5%
13%
NO
DK
UK
NL
YTD 2021
YTD 2020
2.8%
*Constant currencies measured using average exchange rates for 2020
Netcompany continues to grow and lifts expectations to full year revenue growth Netcompany Group A/SGrønningen 17, 1270 Copenhagen
Company Registration no. 39 48 89 14Company Announcement No. 14/2021
18 August 2021
15
50
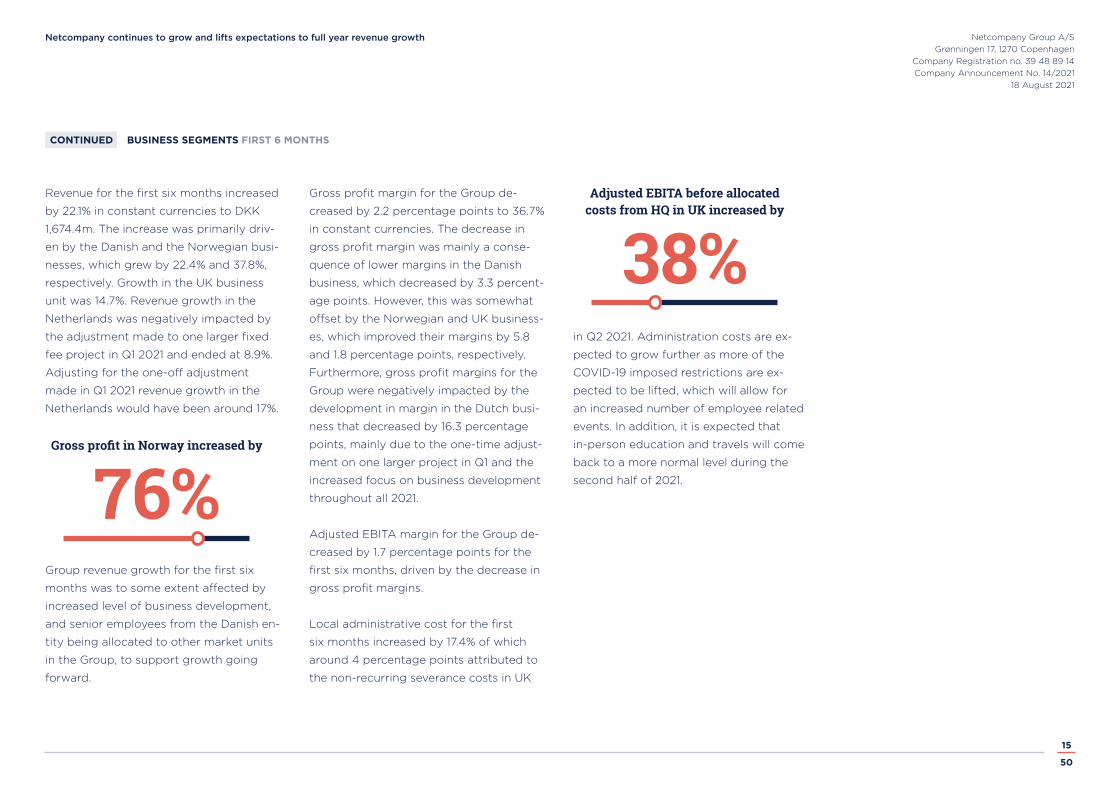
Revenue for the first six months increased
by 22.1% in constant currencies to DKK
1,674.4m. The increase was primarily driv-
en by the Danish and the Norwegian busi-
nesses, which grew by 22.4% and 37.8%,
respectively. Growth in the UK business
unit was 14.7%. Revenue growth in the
Netherlands was negatively impacted by
the adjustment made to one larger fixed
fee project in Q1 2021 and ended at 8.9%.
Adjusting for the one-off adjustment
made in Q1 2021 revenue growth in the
Netherlands would have been around 17%.
Group revenue growth for the first six
months was to some extent affected by
increased level of business development,
and senior employees from the Danish en-
tity being allocated to other market units
in the Group, to support growth going
forward.
Gross profit margin for the Group de-
creased by 2.2 percentage points to 36.7%
in constant currencies. The decrease in
gross profit margin was mainly a conse-
quence of lower margins in the Danish
business, which decreased by 3.3 percent-
age points. However, this was somewhat
offset by the Norwegian and UK business-
es, which improved their margins by 5.8
and 1.8 percentage points, respectively.
Furthermore, gross profit margins for the
Group were negatively impacted by the
development in margin in the Dutch busi-
ness that decreased by 16.3 percentage
points, mainly due to the one-time adjust-
ment on one larger project in Q1 and the
increased focus on business development
throughout all 2021.
Adjusted EBITA margin for the Group de-
creased by 1.7 percentage points for the
first six months, driven by the decrease in
gross profit margins.
Local administrative cost for the first
six months increased by 17.4% of which
around 4 percentage points attributed to
the non-recurring severance costs in UK
in Q2 2021. Administration costs are ex-
pected to grow further as more of the
COVID-19 imposed restrictions are ex-
pected to be lifted, which will allow for
an increased number of employee related
events. In addition, it is expected that
in-person education and travels will come
back to a more normal level during the
second half of 2021.
BUSINESS SEGMENTS FIRST 6 MONTHSCONTINUED
76%Gross profit in Norway increased by
38%Adjusted EBITA before allocated
costs from HQ in UK increased by

Netcompany continues to grow and lifts expectations to full year revenue growth Netcompany Group A/SGrønningen 17, 1270 Copenhagen
Company Registration no. 39 48 89 14Company Announcement No. 14/2021
18 August 2021
16
50
Public Q2
Group Denmark Norway UK NetherlandsDKK million Q2 2021 Q2 2020 % change Q2 2021 Q2 2020 Q2 2021 Q2 2020 Q2 2021 Q2 2020 Q2 2021 Q2 2020
Revenue 488.0 442.2 10.4% 377.4 354.4 40.3 22.7 50.5 44.5 19.8 20.6
Cost of service -331.0 -274.8 20.4% -249.6 -204.7 -32.1 -20.3 -33.9 -36.6 -15.4 -13.2
Gross profit 157.0 167.4 -6.2% 127.8 149.7 8.2 2.4 16.6 7.9 4.4 7.4Gross profit margin 32.2% 37.9% -5.7pp 33.9% 42.2% 20.2% 10.5% 32.9% 17.7% 22.2% 35.9%
Allocated costs -71.8 -60.2 19.2% -50.4 -46.7 -6.7 -2.9 -8.2 -5.4 -6.5 -5.2
Adjusted EBITA before allocated cost from HQ 85.2 107.1 -20.5% 77.5 103.1 1.4 -0.5 8.4 2.4 -2.1 2.2Adjusted EBITA margin before allocated cost from HQ 17.5% 24.2% -6.8pp 20.5% 29.1% 3.5% -2.3% 16.6% 5.5% -10.5% 10.5%
Allocated costs from HQ -6.2 -6.8 -9.3% -4.7 -5.2 -0.5 -0.3 -0.6 -0.8 -0.4 -0.4
EBITA 79.0 100.3 -21.2% 72.8 97.8 0.9 -0.9 7.7 1.6 -2.4 1.7EBITA margin 16.2% 22.7% -6.5pp 19.3% 27.6% 2.2% -3.8% 15.3% 3.7% -12.3% 8.3%
Amortisation -5.5 -17.0 -67.6% -4.2 -13.1 -0.5 -0.9 -0.6 -2.0 -0.3 -1.1
Operating profit 73.5 83.3 -11.8% 68.6 84.7 0.4 -1.7 7.2 -0.3 -2.7 0.6Operating profit margin 15.1% 18.8% -3.8pp 18.2% 23.9% 1.0% -7.6% 14.2% -0.7% -13.9% 3.0%

Netcompany continues to grow and lifts expectations to full year revenue growth Netcompany Group A/SGrønningen 17, 1270 Copenhagen
Company Registration no. 39 48 89 14Company Announcement No. 14/2021
18 August 2021
17
50
Revenue in the public segment increased
by 10.4% in Q2 2021 to DKK 488m. The
growth was mainly driven by Norway and
UK, which grew by 77.6% and 13.6%, re-
spectively.
Revenue grew by 6.5% in Denmark, which
was in line with expectations and the de-
cision to be focusing more on the private
market. In addition, Danish resources from
the public sector was allocated to both
Norway and UK, to assist in both business
development and on project deliveries.
In Norway, revenue grew by 77.6% com-
pared to Q2 2020. The growth was mainly
due to the work performed on projects
won in the end of 2020, and the start up
on new big projects as Statens legemid-
delverk, Oslo kommune and DigiBarnev-
ern.
Revenue in UK grew by 13.6% in the pub-
lic segment compared to Q2 2020. The
growth in UK was mainly due to the con-
tinued work on large projects won during
the end of 2020 and Q1 2021 - with NHS
and Department for Health and Social
Care as key projects with full effect in Q2.
In the Netherlands, revenue decreased by
3.9% in the public segment in Q2 2021. The
decrease was in line with expectations and
the result of prioritising business develop-
ment in order to sustain future growth on
a more independent basis.
Gross profit margin in the public segment
was 32.2% compared to 37.9% in Q2 2020.
The decrease in gross profit margin was
impacted by a higher level of cross utili-
sation from the Danish business towards
UK, the Netherlands and Norway, whereby
Danish resources to a larger extent than
the same period last year, worked on inter-
national projects and spent more time on
business development.
Increase in cost of services in Denmark
was 21.9% compared to Q2 2020, yielding
a decrease in gross profit margin of 8.4
percentage points. The decrease in gross
profit margin in Denmark was mainly due
to the Danish business allocating senior
employees to UK, Norway and the Neth-
erlands, which meant that the demand for
freelancers increased in order to deliver
against already agreed deadlines on pro-
jects.
Gross profit margin in the public segment
in Norway increased by 9.7 percentage
points, mainly due to high activity and
high utilisation of employees in the Nor-
wegian business. The growth in margins
was slightly offset by the continued usage
of resources from Denmark on newly won
projects in the public market, however,
ensuring stabile and established start-up
processes as in Netcompany Denmark.
In the UK, gross profit margins increased
by 15.2 percentage points, which was a
result of the overall high activity and high
utilisation in the UK business. The high
increase in gross profit margin compared
to Q2 2020 was also affected by a low
comparable base, as the UK government
began to defer some projects following
COVID-19 restrictions during Q2 2020.
In the Netherlands, gross profit margin
decreased by 13.6 percentage points. The
decrease was due to lower utilisation as
more time was spent on business devel-
opment. Furthermore, the usage of senior
employees from the Danish business also
effected the gross profit margin negative-
ly.
Allocated costs for the Group increased
by 19.2%, which was mainly a result of in-
creased Group costs related to employee
activities as some COVID-19 restrictions
were lifted throughout Q2 2021.
Adjusted EBITA in the public segment was
17.5%, which was lower compared to Q2
2020. The main reason for the decrease
in adjusted EBITA was driven by actions
taken related to top line growth and thus
related to gross profit margins and in-
creased time being spend on business
development in all market units within the
Group. These activities are expected to
strengthen the Group’s capability to deliv-
er and sustain future growth.
PUBLIC Q2CONTINUED

Netcompany continues to grow and lifts expectations to full year revenue growth Netcompany Group A/SGrønningen 17, 1270 Copenhagen
Company Registration no. 39 48 89 14Company Announcement No. 14/2021
18 August 2021
18
50
Private Q2
Group Denmark Norway UK NetherlandsDKK million Q2 2021 Q2 2020 % change Q2 2021 Q2 2020 Q2 2021 Q2 2020 Q2 2021 Q2 2020 Q2 2021 Q2 2020
Revenue 338.7 233.4 45.1% 259.7 177.1 28.0 20.1 50.3 35.7 0.6 0.5
Cost of service -202.3 -141.1 43.4% -140.8 -90.7 -19.3 -17.2 -41.9 -32.9 -0.3 -0.2
Gross profit 136.4 92.3 47.7% 119.0 86.3 8.7 2.9 8.4 2.8 0.3 0.2Gross profit margin 40.3% 39.6% 0.7pp 45.8% 48.8% 30.9% 14.6% 16.7% 7.9% 49.2% 48.5%
Allocated costs -44.8 -28.0 60.2% -30.2 -19.9 -4.5 -2.5 -9.9 -5.4 -0.1 -0.1
Adjusted EBITA before allocated cost from HQ 91.6 64.4 42.2% 88.7 66.4 4.2 0.4 -1.5 -2.6 0.2 0.1Adjusted EBITA margin before allocated cost from HQ 27.0% 27.6% -0.5pp 34.2% 37.5% 14.8% 1.9% -2.9% -7.3% 26.3% 29.8%
Allocated costs from HQ -3.9 -3.3 17.1% -2.8 -2.2 -0.4 -0.3 -0.7 -0.8 -0.0 -0.0
EBITA 87.7 61.0 43.6% 85.9 64.2 3.8 0.1 -2.2 -3.4 0.2 0.1EBITA margin 25.9% 26.2% -0.3pp 33.1% 36.3% 13.5% 0.4% -4.4% -9.4% 25.0% 28.1%
Amortisation -3.5 -8.3 -57.9% -2.5 -5.6 -0.3 -0.8 -0.7 -1.9 -0.0 -0.0
Operating profit 84.2 52.8 59.5% 83.4 58.6 3.5 -0.7 -2.9 -5.3 0.1 0.1Operating profit margin 24.9% 22.6% 2.2pp 32.1% 33.1% 12.4% -3.4% -5.7% -14.8% 23.9% 24.1%
Netcompany continues to grow and lifts expectations to full year revenue growth Netcompany Group A/SGrønningen 17, 1270 Copenhagen
Company Registration no. 39 48 89 14Company Announcement No. 14/2021
18 August 2021
19
50
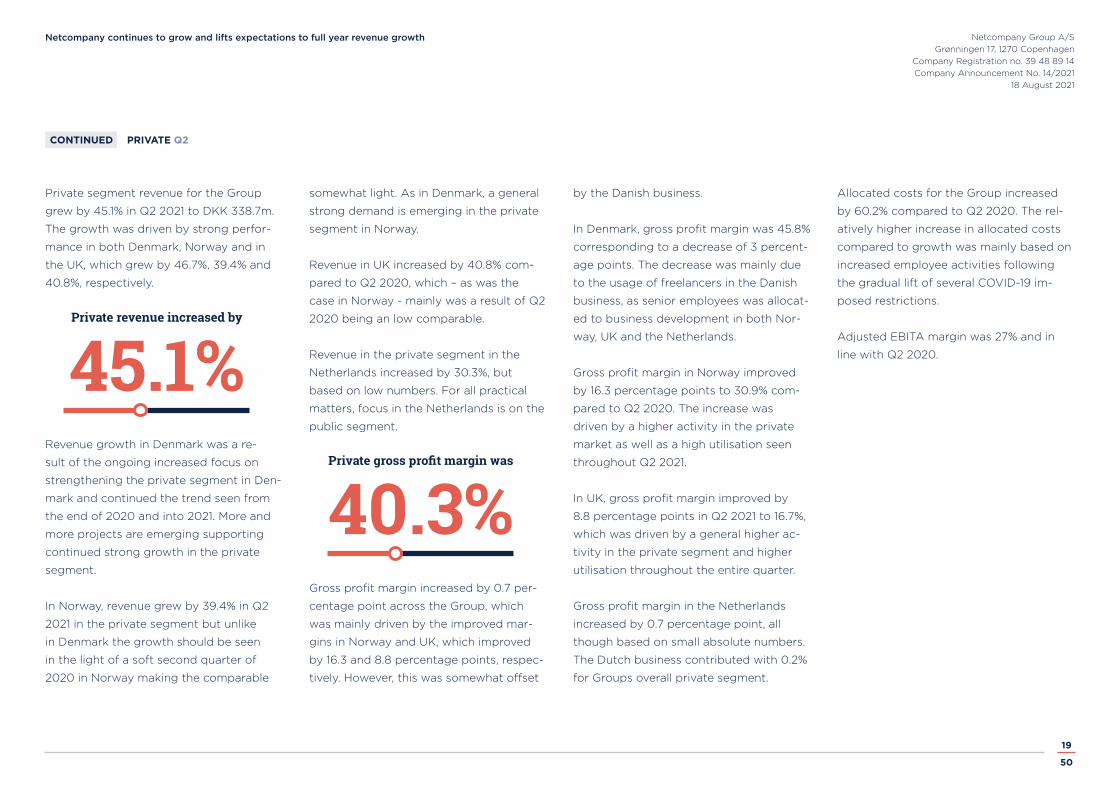
Private segment revenue for the Group
grew by 45.1% in Q2 2021 to DKK 338.7m.
The growth was driven by strong perfor-
mance in both Denmark, Norway and in
the UK, which grew by 46.7%, 39.4% and
40.8%, respectively.
Revenue growth in Denmark was a re-
sult of the ongoing increased focus on
strengthening the private segment in Den-
mark and continued the trend seen from
the end of 2020 and into 2021. More and
more projects are emerging supporting
continued strong growth in the private
segment.
In Norway, revenue grew by 39.4% in Q2
2021 in the private segment but unlike
in Denmark the growth should be seen
in the light of a soft second quarter of
2020 in Norway making the comparable
somewhat light. As in Denmark, a general
strong demand is emerging in the private
segment in Norway.
Revenue in UK increased by 40.8% com-
pared to Q2 2020, which – as was the
case in Norway - mainly was a result of Q2
2020 being an low comparable.
Revenue in the private segment in the
Netherlands increased by 30.3%, but
based on low numbers. For all practical
matters, focus in the Netherlands is on the
public segment.
Gross profit margin increased by 0.7 per-
centage point across the Group, which
was mainly driven by the improved mar-
gins in Norway and UK, which improved
by 16.3 and 8.8 percentage points, respec-
tively. However, this was somewhat offset
by the Danish business.
In Denmark, gross profit margin was 45.8%
corresponding to a decrease of 3 percent-
age points. The decrease was mainly due
to the usage of freelancers in the Danish
business, as senior employees was allocat-
ed to business development in both Nor-
way, UK and the Netherlands.
Gross profit margin in Norway improved
by 16.3 percentage points to 30.9% com-
pared to Q2 2020. The increase was
driven by a higher activity in the private
market as well as a high utilisation seen
throughout Q2 2021.
In UK, gross profit margin improved by
8.8 percentage points in Q2 2021 to 16.7%,
which was driven by a general higher ac-
tivity in the private segment and higher
utilisation throughout the entire quarter.
Gross profit margin in the Netherlands
increased by 0.7 percentage point, all
though based on small absolute numbers.
The Dutch business contributed with 0.2%
for Groups overall private segment.
Allocated costs for the Group increased
by 60.2% compared to Q2 2020. The rel-
atively higher increase in allocated costs
compared to growth was mainly based on
increased employee activities following
the gradual lift of several COVID-19 im-
posed restrictions.
Adjusted EBITA margin was 27% and in
line with Q2 2020.
PRIVATE Q2CONTINUED
45.1%Private revenue increased by
40.3%Private gross profit margin was

Netcompany continues to grow and lifts expectations to full year revenue growth Netcompany Group A/SGrønningen 17, 1270 Copenhagen
Company Registration no. 39 48 89 14Company Announcement No. 14/2021
18 August 2021
20
50
Public First 6 months
Group Denmark Norway UK NetherlandsDKK million YTD 2021 YTD 2020 % change YTD 2021 YTD 2020 YTD 2021 YTD 2020 YTD 2021 YTD 2020 YTD 2021 YTD 2020
Revenue 990.3 875.5 13.1% 756.9 696.2 79.6 48.3 112.8 93.1 41.0 37.8
Cost of service -667.3 -547.3 21.9% -486.4 -409.4 -62.7 -39.6 -84.2 -73.2 -34.0 -25.1
Gross profit 322.9 328.2 -1.6% 270.5 286.8 16.8 8.7 28.6 19.9 7.0 12.7Gross profit margin 32.6% 37.5% -4.9pp 35.7% 41.2% 21.2% 18.0% 25.4% 21.4% 17.1% 33.5%
Allocated costs -136.4 -124.1 9.9% -99.0 -96.9 -11.4 -6.4 -14.6 -11.3 -11.4 -9.6
Adjusted EBITA before allocated cost from HQ 186.5 204.1 -8.6% 171.5 190.0 5.4 2.3 14.0 8.7 -4.4 3.1Adjusted EBITA margin before allocated cost from HQ 18.8% 23.3% -4.5pp 22.7% 27.3% 6.8% 4.8% 12.4% 9.3% -10.8% 8.3%
Allocated costs from HQ -10.7 -14.5 -26.6% -7.8 -10.6 -0.9 -1.6 -1.3 -1.5 -0.7 -0.8
Special items 0.0 -0.0 -100.0% 0.0 -0.0 0.0 -0.0 0.0 -0.0 0.0 -0.0
EBITA 175.9 189.5 -7.2% 163.7 179.4 4.5 0.7 12.7 7.1 -5.1 2.3EBITA margin 17.8% 21.7% -3.9pp 21.6% 25.8% 5.7% 1.4% 11.3% 7.7% -12.4% 6.1%
Amortisation -11.3 -33.3 -66.2% -8.2 -25.8 -0.9 -1.7 -1.4 -3.7 -0.7 -2.0
Operating profit 164.6 156.2 5.3% 155.5 153.6 3.6 -1.1 11.3 3.4 -5.8 0.3Operating profit margin 16.6% 17.8% -1.2pp 20.5% 22.1% 4.5% -2.2% 10.1% 3.7% -14.2% 0.8%
Revenue for the first six months in the
public segment increased by 13.1% to DKK
990.3m. The increase was primarily driven
by the Norwegian and the UK business,
which grew by 64.7% and 21.1%, respec-
tively.
The Danish business grew by 8.7% where-
as the Netherlands grew by 8.4% in the
public segment. Besides an overall in-
creased level of business development
throughout all 2021, which entails lower
utilisation, the public segment was addi-
tionally negatively impacted by the adjust-
ment of estimated time to complete on
one large fixed fee project in the Nether-
lands in Q1 2021.
Gross profit margin decreased by 1.6
percentage points in the first six month,
which was mainly due to the short term
usage of freelancers, while senior employ-
ees from the Danish entity was allocated
to other market units within the Group.
Allocated cost increased by 9.9%, yielding
a decrease in adjusted EBITA before allo-
cated costs from HQ for the Group by 4.5
percentage points.
Netcompany continues to grow and lifts expectations to full year revenue growth Netcompany Group A/SGrønningen 17, 1270 Copenhagen
Company Registration no. 39 48 89 14Company Announcement No. 14/2021
18 August 2021
21
50
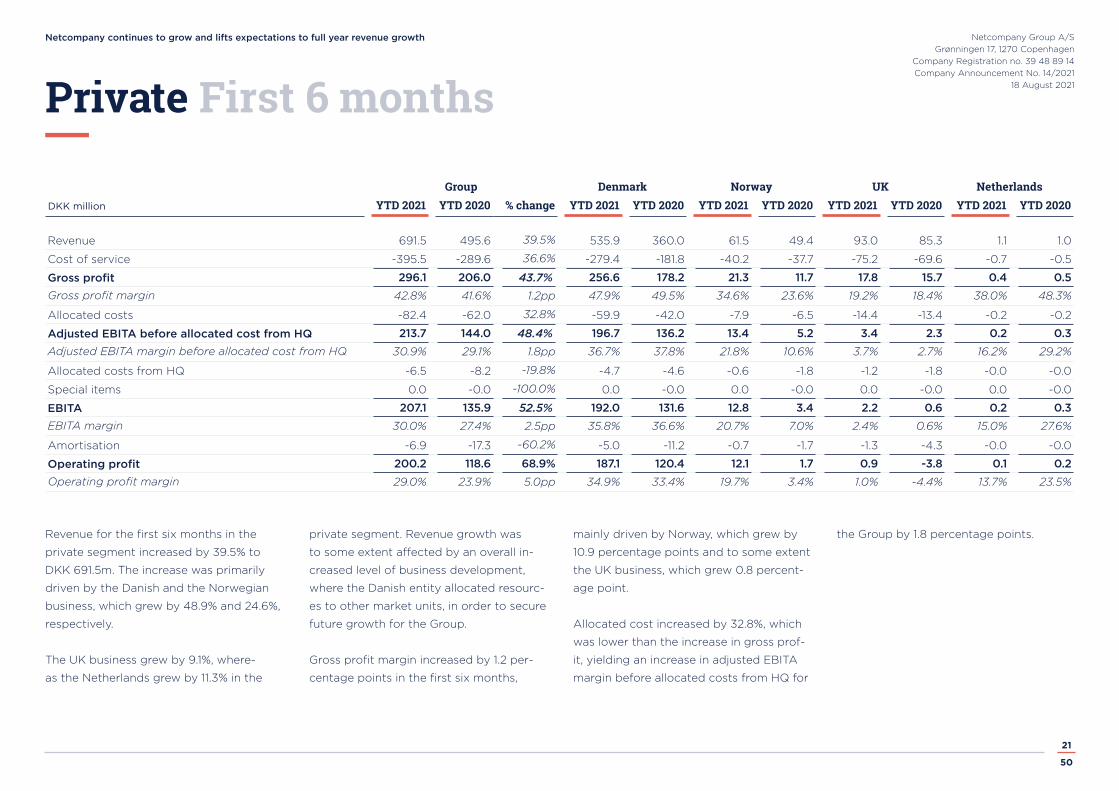
Private First 6 months
Group Denmark Norway UK NetherlandsDKK million YTD 2021 YTD 2020 % change YTD 2021 YTD 2020 YTD 2021 YTD 2020 YTD 2021 YTD 2020 YTD 2021 YTD 2020
Revenue 691.5 495.6 39.5% 535.9 360.0 61.5 49.4 93.0 85.3 1.1 1.0
Cost of service -395.5 -289.6 36.6% -279.4 -181.8 -40.2 -37.7 -75.2 -69.6 -0.7 -0.5
Gross profit 296.1 206.0 43.7% 256.6 178.2 21.3 11.7 17.8 15.7 0.4 0.5Gross profit margin 42.8% 41.6% 1.2pp 47.9% 49.5% 34.6% 23.6% 19.2% 18.4% 38.0% 48.3%
Allocated costs -82.4 -62.0 32.8% -59.9 -42.0 -7.9 -6.5 -14.4 -13.4 -0.2 -0.2
Adjusted EBITA before allocated cost from HQ 213.7 144.0 48.4% 196.7 136.2 13.4 5.2 3.4 2.3 0.2 0.3Adjusted EBITA margin before allocated cost from HQ 30.9% 29.1% 1.8pp 36.7% 37.8% 21.8% 10.6% 3.7% 2.7% 16.2% 29.2%
Allocated costs from HQ -6.5 -8.2 -19.8% -4.7 -4.6 -0.6 -1.8 -1.2 -1.8 -0.0 -0.0
Special items 0.0 -0.0 -100.0% 0.0 -0.0 0.0 -0.0 0.0 -0.0 0.0 -0.0
EBITA 207.1 135.9 52.5% 192.0 131.6 12.8 3.4 2.2 0.6 0.2 0.3EBITA margin 30.0% 27.4% 2.5pp 35.8% 36.6% 20.7% 7.0% 2.4% 0.6% 15.0% 27.6%
Amortisation -6.9 -17.3 -60.2% -5.0 -11.2 -0.7 -1.7 -1.3 -4.3 -0.0 -0.0
Operating profit 200.2 118.6 68.9% 187.1 120.4 12.1 1.7 0.9 -3.8 0.1 0.2Operating profit margin 29.0% 23.9% 5.0pp 34.9% 33.4% 19.7% 3.4% 1.0% -4.4% 13.7% 23.5%
Revenue for the first six months in the
private segment increased by 39.5% to
DKK 691.5m. The increase was primarily
driven by the Danish and the Norwegian
business, which grew by 48.9% and 24.6%,
respectively.
The UK business grew by 9.1%, where-
as the Netherlands grew by 11.3% in the
private segment. Revenue growth was
to some extent affected by an overall in-
creased level of business development,
where the Danish entity allocated resourc-
es to other market units, in order to secure
future growth for the Group.
Gross profit margin increased by 1.2 per-
centage points in the first six months,
mainly driven by Norway, which grew by
10.9 percentage points and to some extent
the UK business, which grew 0.8 percent-
age point.
Allocated cost increased by 32.8%, which
was lower than the increase in gross prof-
it, yielding an increase in adjusted EBITA
margin before allocated costs from HQ for
the Group by 1.8 percentage points.
Netcompany continues to grow and lifts expectations to full year revenue growth Netcompany Group A/SGrønningen 17, 1270 Copenhagen
Company Registration no. 39 48 89 14Company Announcement No. 14/2021
18 August 2021
22
50
Currency exposures
Q2 2021Local currency million DKK NOK GBP EUR VND PLN
Revenue 637.1 92.7 11.7 2.7 0.0 0.0
EBIT 149.3 1.9 0.1 -0.0 3,261.8 3.0
Net result 106.7 1.1 0.0 -0.2 2,739.7 2.3
YTD 2021Local currency million DKK NOK GBP EUR VND PLN
Revenue 1,292.8 193.1 24.0 5.7 0.0 0.0
EBIT 339.7 15.1 0.4 -0.5 6,761.7 5.3
Net result 292.7 11.8 0.3 -0.5 5,624.3 3.9
Q2 2020Local currency million DKK NOK GBP EUR VND PLN
Revenue 531.5 63.0 9.5 2.8 0.0 0.0
EBIT 135.2 3.9 -0.7 0.1 2,538.5 1.9
Net result 95.7 3.2 -0.6 0.1 1,924.4 1.4
YTD 2020Local currency million DKK NOK GBP EUR VND PLN
Revenue 1,056.2 139.6 20.9 5.2 0.0 0.0
EBIT 260.3 11.9 -0.2 0.1 4,941.3 3.4
Net result 178.9 9.1 -0.2 0.1 3,361.3 2.4
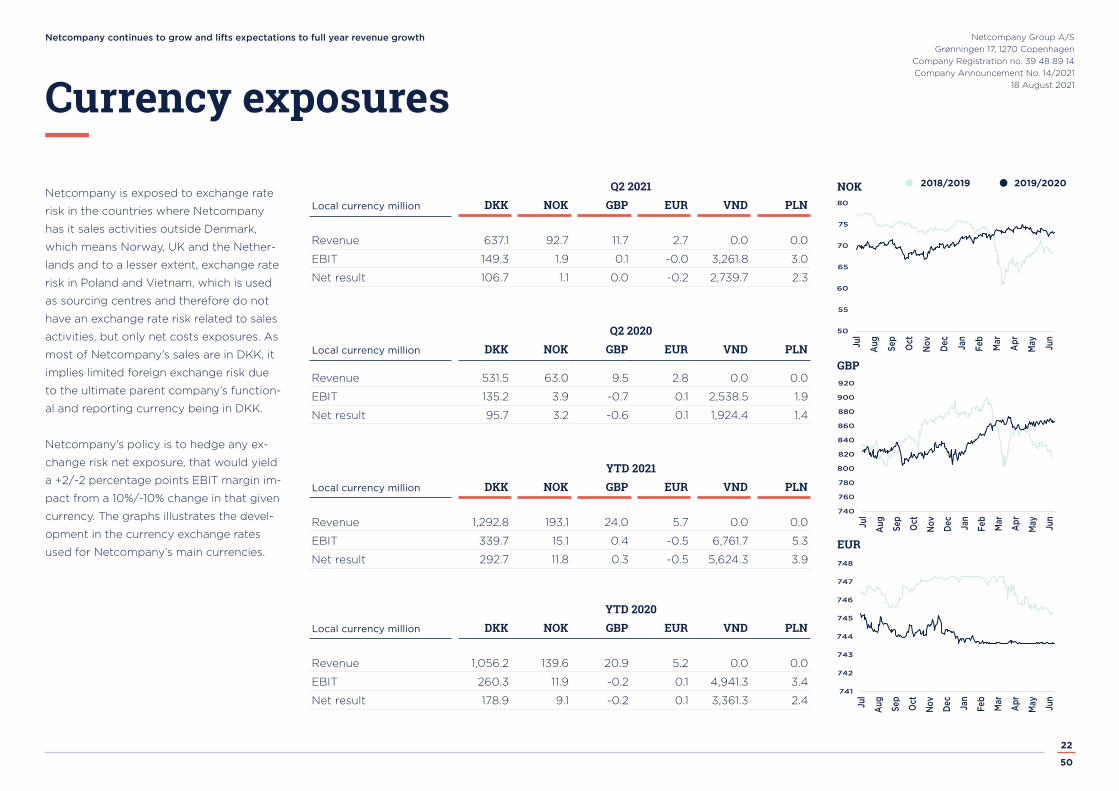
Netcompany is exposed to exchange rate
risk in the countries where Netcompany
has it sales activities outside Denmark,
which means Norway, UK and the Nether-
lands and to a lesser extent, exchange rate
risk in Poland and Vietnam, which is used
as sourcing centres and therefore do not
have an exchange rate risk related to sales
activities, but only net costs exposures. As
most of Netcompany’s sales are in DKK, it
implies limited foreign exchange risk due
to the ultimate parent company’s function-
al and reporting currency being in DKK.
Netcompany’s policy is to hedge any ex-
change risk net exposure, that would yield
a +2/-2 percentage points EBIT margin im-
pact from a 10%/-10% change in that given
currency. The graphs illustrates the devel-
opment in the currency exchange rates
used for Netcompany’s main currencies.EUR
GBP
NOK 2018/2019 2019/2020
50
55
60
65
70
75
80
Jul
Aug
Sep
Oct
Nov
Dec
Jan
Feb
Mar
Apr
May Jun
741
742
743
744
745
746
747
748
Jul
Aug
Sep
Oct
Nov
Dec
Jan
Feb
Mar
Apr
May Jun
740
760
780
800
820
840
860
880
900
920
Jul
Aug
Sep
Oct
Nov
Dec
Jan
Feb
Mar
Apr
May Jun
Netcompany continues to grow and lifts expectations to full year revenue growth Netcompany Group A/SGrønningen 17, 1270 Copenhagen
Company Registration no. 39 48 89 14Company Announcement No. 14/2021
18 August 2021
23
50
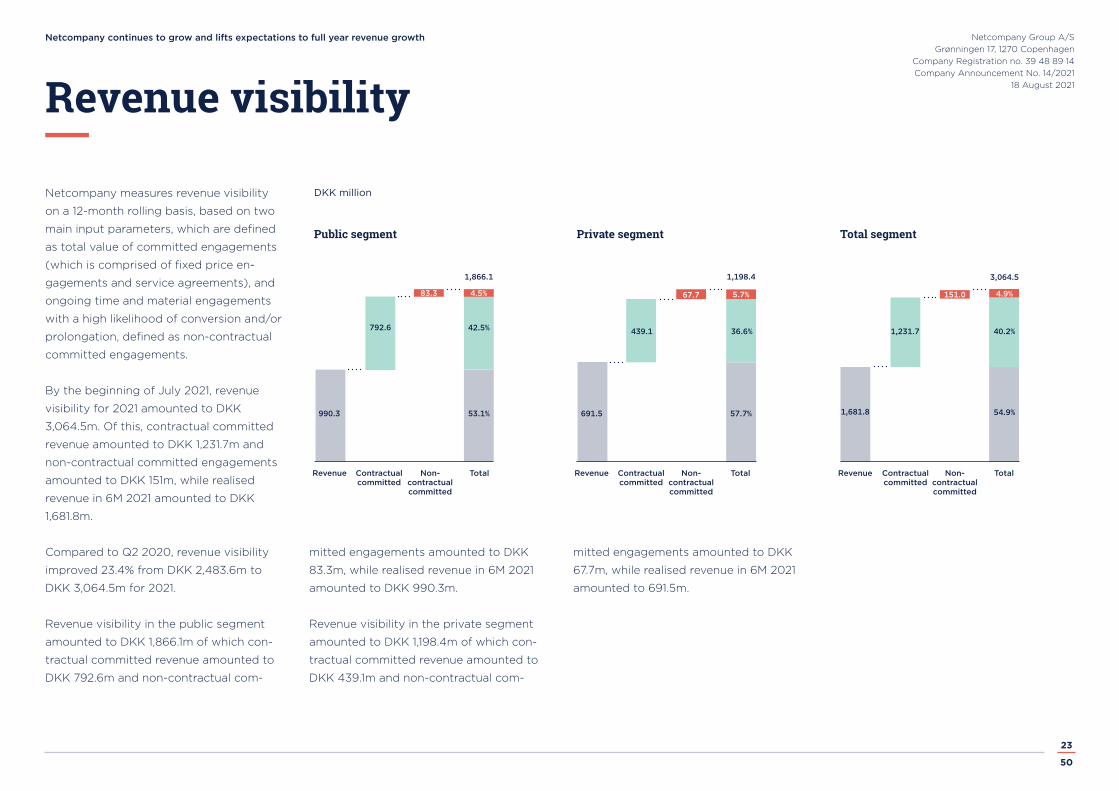
Netcompany measures revenue visibility
on a 12-month rolling basis, based on two
main input parameters, which are defined
as total value of committed engagements
(which is comprised of fixed price en-
gagements and service agreements), and
ongoing time and material engagements
with a high likelihood of conversion and/or
prolongation, defined as non-contractual
committed engagements.
By the beginning of July 2021, revenue
visibility for 2021 amounted to DKK
3,064.5m. Of this, contractual committed
revenue amounted to DKK 1,231.7m and
non-contractual committed engagements
amounted to DKK 151m, while realised
revenue in 6M 2021 amounted to DKK
1,681.8m.
Compared to Q2 2020, revenue visibility
improved 23.4% from DKK 2,483.6m to
DKK 3,064.5m for 2021.
Revenue visibility in the public segment
amounted to DKK 1,866.1m of which con-
tractual committed revenue amounted to
DKK 792.6m and non-contractual com-
Revenue visibility
mitted engagements amounted to DKK
83.3m, while realised revenue in 6M 2021
amounted to DKK 990.3m.
Revenue visibility in the private segment
amounted to DKK 1,198.4m of which con-
tractual committed revenue amounted to
DKK 439.1m and non-contractual com-
mitted engagements amounted to DKK
67.7m, while realised revenue in 6M 2021
amounted to 691.5m.
691.5 57.7%990.3
792.6 439.1 1,231.7
83.3 67.7 5.7% 151.0
53.1%
42.5%
4.5%
36.6%
54.9%
40.2%
4.9%
1,866.1 1,198.4 3,064.5
Revenue Revenue RevenueContractualcommitted
Contractualcommitted
Contractualcommitted
Non- contractualcommitted
Non- contractualcommitted
Non- contractualcommitted
Total Total Total
Public segment Private segment Total segment
DKK million
1,681.8

Netcompany continues to grow and lifts expectations to full year revenue growth Netcompany Group A/SGrønningen 17, 1270 Copenhagen
Company Registration no. 39 48 89 14Company Announcement No. 14/2021
18 August 2021
24
50
Employees
37.9%
Netcompany employed an average of
3,238 FTEs in Q2 2021, which was an in-
crease of 575 FTEs compared to Q2 2020
(2,663 FTEs). The increase in FTEs was
driven by the intake of new employees in
all countries.
The number of client facing employees for
the Group increased by 563 from 2,482
in Q2 2020 to 3,045 in Q2 2021, while the
level of non-client facing employees was
5.9% in Q2 2021 compared to 6.8% in Q2
2020.
The transition away from independent
contractors towards own employees in
the UK continued in Q2 2021. As of June
2021, the independent contractors in the
UK operation were 16, which was 4% of
the client facing FTEs (22% in June 2020).
The attrition rate for the last twelve
months was 18.3%, which was an increase
of 2.4 percentage points compared to
the same period last year. Attrition rates
in Denmark, UK and the Netherlands In-
creased by 2.9, 5.6 and 12.5 percentage
points, respectively, and was due to a
higher number of voluntary leavers in a
more labour tight market post COVID-19,
compared to the same period last year.
Avg. FTEs increased to 3,238 during Q2 2021 Avg. FTEs increased to 3,173 during 2021
Attrition rate LTM
ADMINISTRATION
JUNE 2020
FREELANCERS
UK
PL
DK
UK CONTRACTORS
JUNE 2021
VN
NL
NO1,4001.676 1.638
236 236
381 366
123 127
361 351
193 18977 30
177 167
+287 +273
0
1,600
1,000
1,800
1,200
2,000
2,200
+23 +23
+78 +67
+101 +125
-63 -76+12 +11
+40 +32+71 +61
1468
+25 +33
Q2 2020 YTD 2020Q2 2021 YTD 2021Change Change
2,400
2,600
3,000
3,200
2,800
14.4%17.1%
14.9%16.8% 15.5%17.3% 16.4%
20.5%20%
0%
5%
25%
10%
30%
15%
35%
DK NO UK NL PL
22.4%
15.2%
VN
1.389
213
303
98
260
18177106
37
1.365
213
300
94226
178107106
36
25.4%
3,400
Netcompany continues to grow and lifts expectations to full year revenue growth Netcompany Group A/SGrønningen 17, 1270 Copenhagen
Company Registration no. 39 48 89 14Company Announcement No. 14/2021
18 August 2021
25
50
Free cash flow and cash conversion rate1
The Group generated a free cash flow of
negative DKK 10.2m in Q2 2021, compared
to DKK 103.1m in Q2 2020. The negative
free cash flow was affected by a voluntary
one-off payment to the Danish Vacation
Fund of DKK 96.9m, following the new
Danish Holiday Act. Adjusted for this and
taxes paid on account, the Group gener-
ated a free cash flow of DKK 47.7m com-
pared to DKK 75.7m in Q2 2020, which
corresponds to a decrease in normalised
free cash flow of 37.1%.
The decrease in free cash flow was mainly
driven by the negative development in
working capital changes compared to the
same period last year. However, this was
somehow offset by the increased oper-
ating result. The development in working
capital changes in Q2 2021 was driven by
an increase of DKK 154.2m in trade receiv-
ables from DKK 448.6m by the end of Q1
2021 to DKK 602.8m, which was slightly
offset by a decrease in work in progress of
DKK 43.8m from DKK 498.4m by the end
of Q1 2021 to DKK 454.6m. In addition, the
one-off payment to the Danish Vacation
Fund also had a negative effect on work-
ing capital changes.
Cash conversion rate decreased from
89.1% in Q2 2020 to -8.5% in Q2 2021.
Adjusted for the payment to the Danish
Vacation Fund and taxes paid on account,
cash conversion rate decreased from
65.4% in Q2 2020 to 39.9% in Q2 2021.
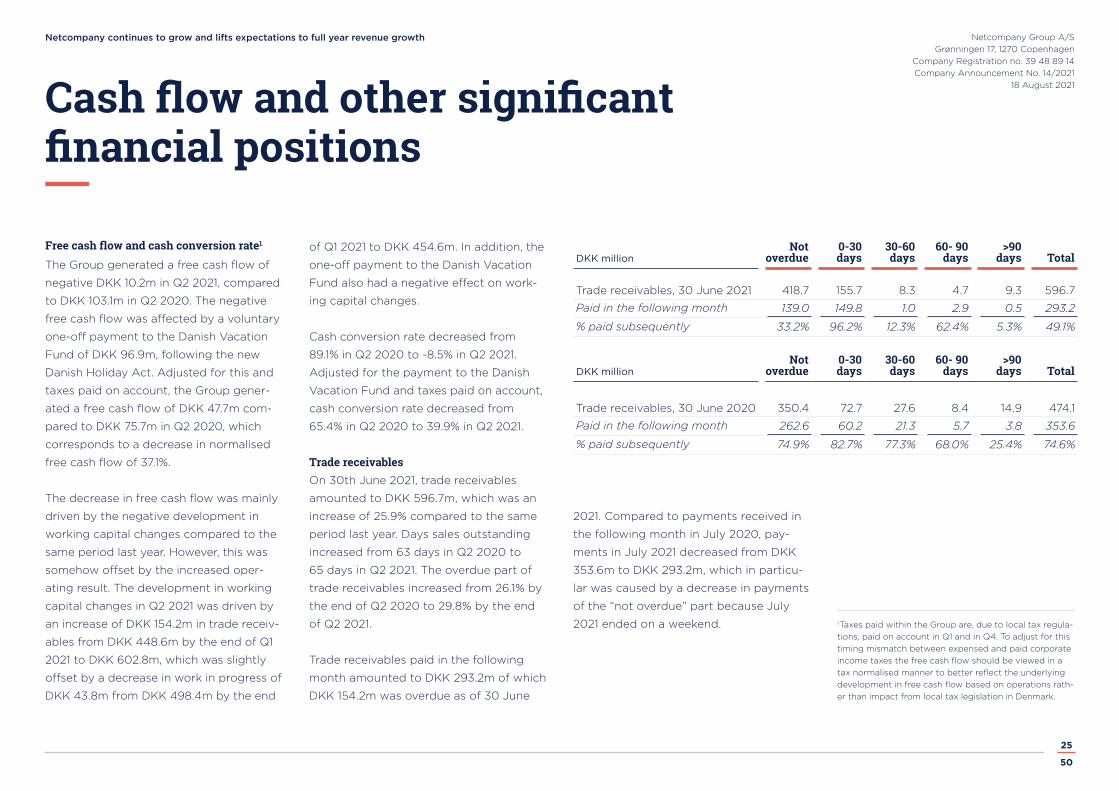
Trade receivablesOn 30th June 2021, trade receivables
amounted to DKK 596.7m, which was an
increase of 25.9% compared to the same
period last year. Days sales outstanding
increased from 63 days in Q2 2020 to
65 days in Q2 2021. The overdue part of
trade receivables increased from 26.1% by
the end of Q2 2020 to 29.8% by the end
of Q2 2021.
Trade receivables paid in the following
month amounted to DKK 293.2m of which
DKK 154.2m was overdue as of 30 June
2021. Compared to payments received in
the following month in July 2020, pay-
ments in July 2021 decreased from DKK
353.6m to DKK 293.2m, which in particu-
lar was caused by a decrease in payments
of the “not overdue” part because July
2021 ended on a weekend.
Cash flow and other significant financial positions
1Taxes paid within the Group are, due to local tax regula-tions, paid on account in Q1 and in Q4. To adjust for this timing mismatch between expensed and paid corporate income taxes the free cash flow should be viewed in a tax normalised manner to better reflect the underlying development in free cash flow based on operations rath-er than impact from local tax legislation in Denmark.
DKK millionNot
overdue0-30 days
30-60 days
60- 90 days
>90 days Total
Trade receivables, 30 June 2021 418.7 155.7 8.3 4.7 9.3 596.7
Paid in the following month 139.0 149.8 1.0 2.9 0.5 293.2
% paid subsequently 33.2% 96.2% 12.3% 62.4% 5.3% 49.1%
Trade receivables, 30 June 2020 350.4 72.7 27.6 8.4 14.9 474.1
Paid in the following month 262.6 60.2 21.3 5.7 3.8 353.6
% paid subsequently 74.9% 82.7% 77.3% 68.0% 25.4% 74.6%
DKK millionNot
overdue0-30 days
30-60 days
60- 90 days
>90 days Total
Netcompany continues to grow and lifts expectations to full year revenue growth Netcompany Group A/SGrønningen 17, 1270 Copenhagen
Company Registration no. 39 48 89 14Company Announcement No. 14/2021
18 August 2021
26
50
Work in progress overview WIP REVENUE
DKK million
CASH FLOW AND OTHER SIGNIFICANTFINANCIAL POSITIONS
CONTINUED
As a total, trade receivables and work in
progress increased by 23.1% from DKK
858.7m end of Q2 2020 to DKK 1,057.4m
end of Q2 2021.
Funding and liquidityNetcompany’s bank agreement consists
of committed facilities constituting a
total amount of DKK 1,500m and an addi-
tional facility of DKK 400m, available
only for new acquisitions. At 30 June
2021, DKK 730m of the committed
lines were utilised on borrowings and
DKK 118.1m on guarantees, leaving a total
of DKK 1,051.9m available in unutilised
funding of which DKK 651.9m can be
utilised for normal operations if needed
with no additional costs or covenants.
Including the net cash balance as of 30
June 2021 of DKK 179m available funding
was DKK 1,230.9m.
In June 2021, Netcompany paid DKK 25m
to Smarter Airports A/S, whereby capital
contribution to the Joint Venture was fi-
nalised.
Risk managementPlease refer to the overview of risk factors
provided by the Group in the Annual Re-
port for 2020.
Capital structureNetcompany considers a debt ratio of be-
tween 0.5 to 1.0 as desirable. End of Q2
2021, the debt ratio was 0.8.
During Q2 2021, Netcompany executed a
share buyback programme of DKK 50m.
Events after the balance sheet dateTo this date, no events have occurred after
the balance sheet date, which would influ-
ence the evaluation of this report.
390.9
+16.3%
+22.4%
+19.6%
675.5826.7
800
0
400
1,200
Jun. 30 2020
Jun. 30 2021
Q2 2020 Q2 2021 Q2 2020LTM
Q2 2021LTM
3,200
2,634.23,149.3
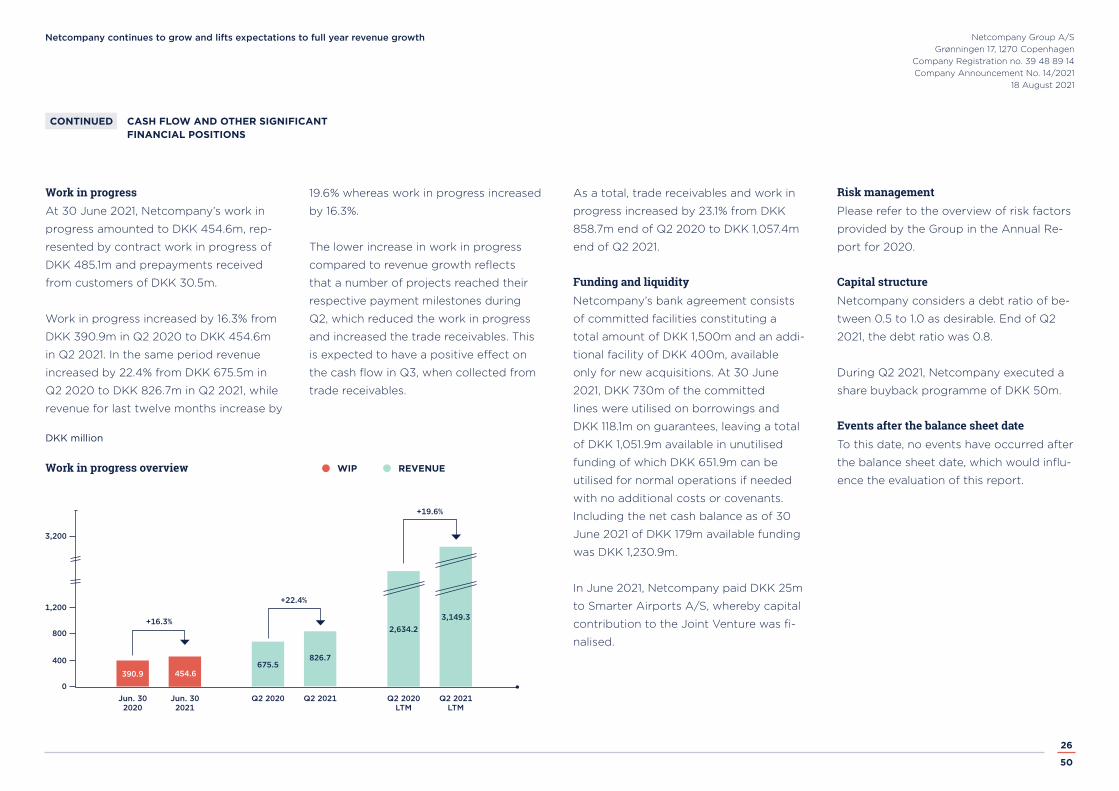
Work in progress At 30 June 2021, Netcompany’s work in
progress amounted to DKK 454.6m, rep-
resented by contract work in progress of
DKK 485.1m and prepayments received
from customers of DKK 30.5m.
Work in progress increased by 16.3% from
DKK 390.9m in Q2 2020 to DKK 454.6m
in Q2 2021. In the same period revenue
increased by 22.4% from DKK 675.5m in
Q2 2020 to DKK 826.7m in Q2 2021, while
revenue for last twelve months increase by
19.6% whereas work in progress increased
by 16.3%.
The lower increase in work in progress
compared to revenue growth reflects
that a number of projects reached their
respective payment milestones during
Q2, which reduced the work in progress
and increased the trade receivables. This
is expected to have a positive effect on
the cash flow in Q3, when collected from
trade receivables.
454.62
454.6
Netcompany continues to grow and lifts expectations to full year revenue growth Netcompany Group A/SGrønningen 17, 1270 Copenhagen
Company Registration no. 39 48 89 14Company Announcement No. 14/2021
18 August 2021
27
50
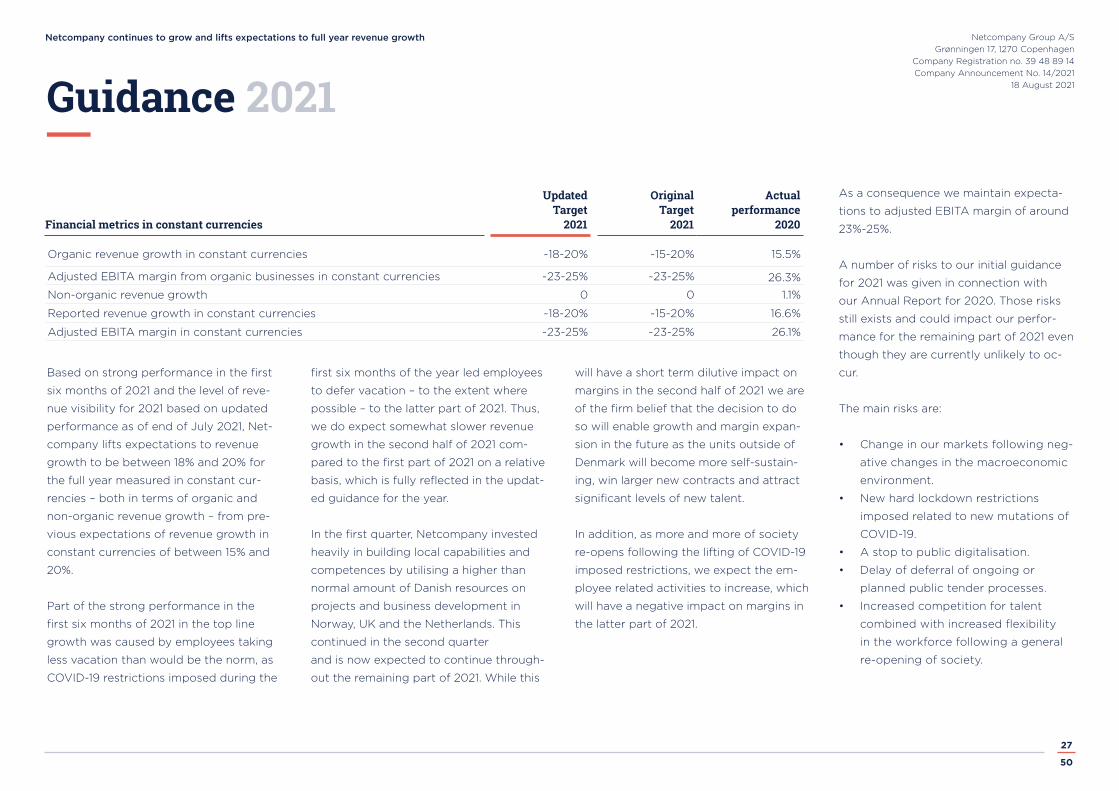
Based on strong performance in the first
six months of 2021 and the level of reve-
nue visibility for 2021 based on updated
performance as of end of July 2021, Net-
company lifts expectations to revenue
growth to be between 18% and 20% for
the full year measured in constant cur-
rencies – both in terms of organic and
non-organic revenue growth – from pre-
vious expectations of revenue growth in
constant currencies of between 15% and
20%.
Part of the strong performance in the
first six months of 2021 in the top line
growth was caused by employees taking
less vacation than would be the norm, as
COVID-19 restrictions imposed during the
first six months of the year led employees
to defer vacation – to the extent where
possible – to the latter part of 2021. Thus,
we do expect somewhat slower revenue
growth in the second half of 2021 com-
pared to the first part of 2021 on a relative
basis, which is fully reflected in the updat-
ed guidance for the year.
In the first quarter, Netcompany invested
heavily in building local capabilities and
competences by utilising a higher than
normal amount of Danish resources on
projects and business development in
Norway, UK and the Netherlands. This
continued in the second quarter
and is now expected to continue through-
out the remaining part of 2021. While this
will have a short term dilutive impact on
margins in the second half of 2021 we are
of the firm belief that the decision to do
so will enable growth and margin expan-
sion in the future as the units outside of
Denmark will become more self-sustain-
ing, win larger new contracts and attract
significant levels of new talent.
In addition, as more and more of society
re-opens following the lifting of COVID-19
imposed restrictions, we expect the em-
ployee related activities to increase, which
will have a negative impact on margins in
the latter part of 2021.
As a consequence we maintain expecta-
tions to adjusted EBITA margin of around
23%-25%.
A number of risks to our initial guidance
for 2021 was given in connection with
our Annual Report for 2020. Those risks
still exists and could impact our perfor-
mance for the remaining part of 2021 even
though they are currently unlikely to oc-
cur.
The main risks are:
• Change in our markets following neg-
ative changes in the macroeconomic
environment.
• New hard lockdown restrictions
imposed related to new mutations of
COVID-19.
• A stop to public digitalisation.
• Delay of deferral of ongoing or
planned public tender processes.
• Increased competition for talent
combined with increased flexibility
in the workforce following a general
re-opening of society.
Guidance 2021
Updated Original ActualTarget Target performance
Financial metrics in constant currencies 2021 2021 2020
Organic revenue growth in constant currencies ~18-20% ~15-20% 15.5%
Adjusted EBITA margin from organic businesses in constant currencies ~23-25% ~23-25% 26.3%
Non-organic revenue growth 0 0 1.1%
Reported revenue growth in constant currencies ~18-20% ~15-20% 16.6%
Adjusted EBITA margin in constant currencies ~23-25% ~23-25% 26.1%
Netcompany continues to grow and lifts expectations to full year revenue growth Netcompany Group A/SGrønningen 17, 1270 Copenhagen
Company Registration no. 39 48 89 14Company Announcement No. 14/2021
18 August 2021
28
50
Financial Calendar
4 November 2021 Interim report for the first 9 months of
2021.
Capital
Netcompany’s share capital is DKK 50m
divided into 50m shares. During Q2 2021,
Netcompany initiated a share buyback
whereby additional 74,700 shares was
acquired. Netcompany now holds 974,513
treasury shares equivalent to 1.9% of the
share capital, which will be used to honour
the Group’s commitments under its RSU
and LTIP programs.
Share-based incentive schemes/restricted stock units
In total, 387,227 RSUs were granted at 30
June 2021 of which 116,121 were granted to
Executive Management and 271,106 were
granted to other Key Management Per-
sonnel and other employees. The fair value
of the RSUs at grant was DKK 109.1m. The
cost related hereto is expensed over the
vesting period.
A total amount of DKK 9.3m was recog-
nised as personnel costs in the income
statement in Q2 2021 and DKK 17.9m in 6M
2021. Additional information on the hold-
ings of Netcompany shares and restricted
stock units by members of the Board of
Directors and Executive Management
Board is disclosed in the remuneration
policy.
Contingent purchase price / restricted stock units
In connection with the acquisition of 100%
of the shares of QDelft B.V. (now Net-
company Netherlands) in 2019, a total of
305,068 RSUs have been granted, which
will vest in February 2023. Further 285,262
RSUs will be granted and vest in February
2023 depending performance in the peri-
od 2020-2022.
Shareholder information

Netcompany continues to grow and lifts expectations to full year revenue growth Netcompany Group A/SGrønningen 17, 1270 Copenhagen
Company Registration no. 39 48 89 14Company Announcement No. 14/2021
18 August 2021
29
50
Today, the Board of Directors and Ex-
ecutive Management considered and
approved the interim consolidated finan-
cial statements for Netcompany Group
A/S (“Netcompany” or “the company”
and together with all its subsidiaries “the
Group”) for the period 1 January 2021 to
30 June 2021. The Q2 2021 report has not
been audited or reviewed by the compa-
ny’s independent auditors.
The interim consolidated financial state-
ments have been prepared in accordance
with IAS 34 as adopted by the EU and
additional Danish regulations for the pres-
entation of interim reports by listed com-
panies. Furthermore, the interim report
has been prepared in accordance with the
accounting policies set out in the Group’s
Annual Report for 2020.
In our opinion, the accounting policies
used are appropriate, and the overall pres-
entation of the interim consolidated finan-
cial statements gives a true and fair view
of the Group’s assets, liabilities and finan-
cial position as at 30 June 2021 and of the
results of the Group’s operations and cash
flows for the period 1 January 2021 to 30
June 2021.
We further consider that the Manage-
ment’s Review in the preceding pages
includes a true and fair account of the
development and performance of the
Group, the results for the period and the
financial position, as well as a description
of the principal risks and uncertainties
that the Group faces in accordance with
Danish disclosure requirements for listed
companies.
COPENHAGEN, 18 AUGUST 2021
Executive Management
André RogaczewskiCEO
Bo RygaardChairman of the Board
Scanes Bentley
Claus JørgensenCOO
Juha ChristensenVice Chairman of the Board
Hege Skryseth
Thomas JohansenCFO
Board of Directors
Statement of the Board of Directors and Executive Management
Åsa Riisberg
Netcompany continues to grow and lifts expectations to full year revenue growth Netcompany Group A/SGrønningen 17, 1270 Copenhagen
Company Registration no. 39 48 89 14Company Announcement No. 14/2021
18 August 2021
30
50
CONSOLIDATED INTERIM FINANCIAL STATEMENTS
Netcompany continues to grow and lifts expectations to full year revenue growth Netcompany Group A/SGrønningen 17, 1270 Copenhagen
Company Registration no. 39 48 89 14Company Announcement No. 14/2021
18 August 2021
31
50
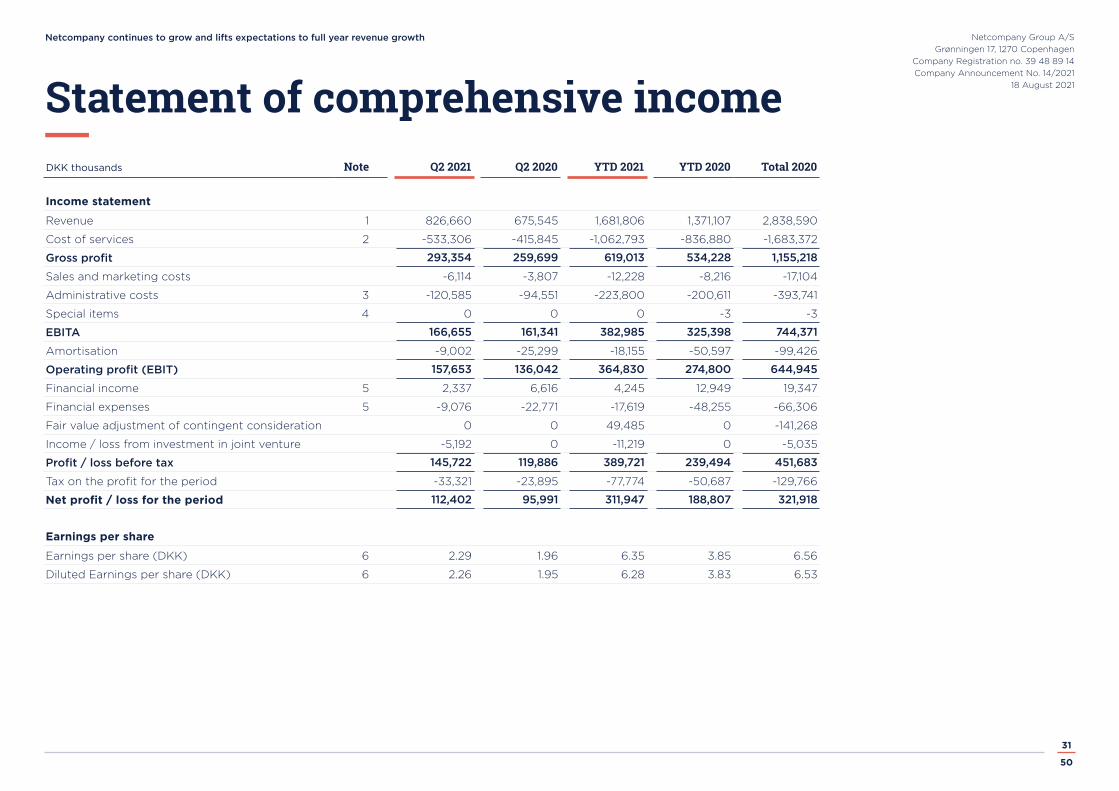
Statement of comprehensive incomeDKK thousands Note Q2 2021 Q2 2020 YTD 2021 YTD 2020 Total 2020
Income statement
Revenue 1 826,660 675,545 1,681,806 1,371,107 2,838,590
Cost of services 2 -533,306 -415,845 -1,062,793 -836,880 -1,683,372
Gross profit 293,354 259,699 619,013 534,228 1,155,218
Sales and marketing costs -6,114 -3,807 -12,228 -8,216 -17,104
Administrative costs 3 -120,585 -94,551 -223,800 -200,611 -393,741
Special items 4 0 0 0 -3 -3
EBITA 166,655 161,341 382,985 325,398 744,371
Amortisation -9,002 -25,299 -18,155 -50,597 -99,426
Operating profit (EBIT) 157,653 136,042 364,830 274,800 644,945
Financial income 5 2,337 6,616 4,245 12,949 19,347
Financial expenses 5 -9,076 -22,771 -17,619 -48,255 -66,306
Fair value adjustment of contingent consideration 0 0 49,485 0 -141,268
Income / loss from investment in joint venture -5,192 0 -11,219 0 -5,035
Profit / loss before tax 145,722 119,886 389,721 239,494 451,683
Tax on the profit for the period -33,321 -23,895 -77,774 -50,687 -129,766
Net profit / loss for the period 112,402 95,991 311,947 188,807 321,918
Earnings per share
Earnings per share (DKK) 6 2.29 1.96 6.35 3.85 6.56
Diluted Earnings per share (DKK) 6 2.26 1.95 6.28 3.83 6.53
Netcompany continues to grow and lifts expectations to full year revenue growth Netcompany Group A/SGrønningen 17, 1270 Copenhagen
Company Registration no. 39 48 89 14Company Announcement No. 14/2021
18 August 2021
32
50
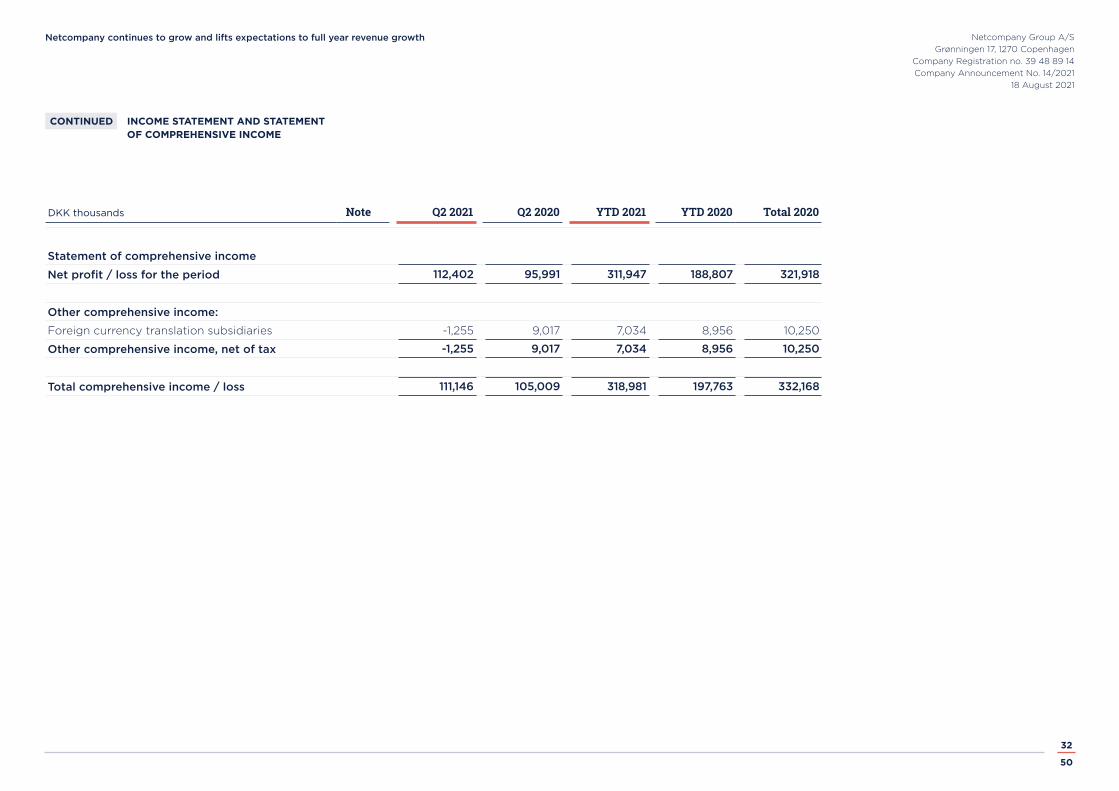
Statement of comprehensive income
Net profit / loss for the period 112,402 95,991 311,947 188,807 321,918
Other comprehensive income:
Foreign currency translation subsidiaries -1,255 9,017 7,034 8,956 10,250
Other comprehensive income, net of tax -1,255 9,017 7,034 8,956 10,250
Total comprehensive income / loss 111,146 105,009 318,981 197,763 332,168
DKK thousands Note Q2 2021 Q2 2020 YTD 2021 YTD 2020 Total 2020
INCOME STATEMENT AND STATEMENT OF COMPREHENSIVE INCOME
CONTINUED
Netcompany continues to grow and lifts expectations to full year revenue growth Netcompany Group A/SGrønningen 17, 1270 Copenhagen
Company Registration no. 39 48 89 14Company Announcement No. 14/2021
18 August 2021
33
50
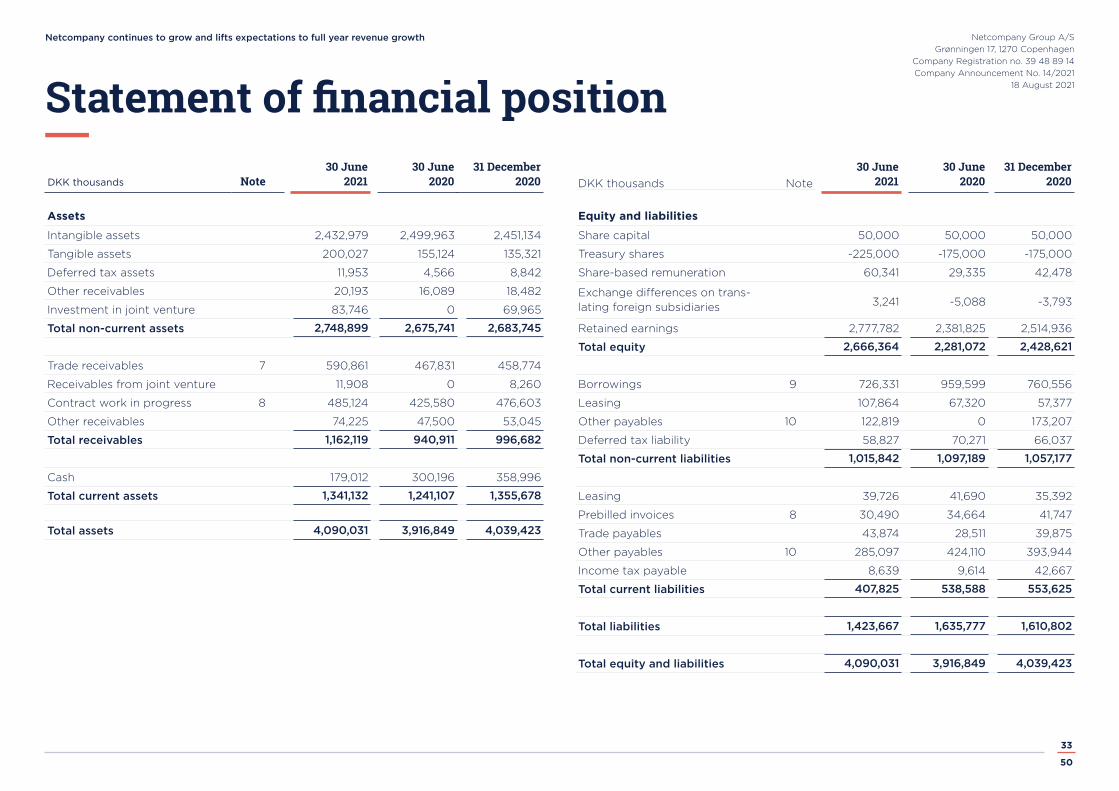
Statement of financial position
Equity and liabilities
Share capital 50,000 50,000 50,000
Treasury shares -225,000 -175,000 -175,000
Share-based remuneration 60,341 29,335 42,478
Exchange differences on trans-lating foreign subsidiaries 3,241 -5,088 -3,793
Retained earnings 2,777,782 2,381,825 2,514,936
Total equity 2,666,364 2,281,072 2,428,621
Borrowings 9 726,331 959,599 760,556
Leasing 107,864 67,320 57,377
Other payables 10 122,819 0 173,207
Deferred tax liability 58,827 70,271 66,037
Total non-current liabilities 1,015,842 1,097,189 1,057,177
Leasing 39,726 41,690 35,392
Prebilled invoices 8 30,490 34,664 41,747
Trade payables 43,874 28,511 39,875
Other payables 10 285,097 424,110 393,944
Income tax payable 8,639 9,614 42,667
Total current liabilities 407,825 538,588 553,625
Total liabilities 1,423,667 1,635,777 1,610,802
Total equity and liabilities 4,090,031 3,916,849 4,039,423
30 June 30 June 31 DecemberDKK thousands Note 2021 2020 2020
Assets
Intangible assets 2,432,979 2,499,963 2,451,134
Tangible assets 200,027 155,124 135,321
Deferred tax assets 11,953 4,566 8,842
Other receivables 20,193 16,089 18,482
Investment in joint venture 83,746 0 69,965
Total non-current assets 2,748,899 2,675,741 2,683,745
Trade receivables 7 590,861 467,831 458,774
Receivables from joint venture 11,908 0 8,260
Contract work in progress 8 485,124 425,580 476,603
Other receivables 74,225 47,500 53,045
Total receivables 1,162,119 940,911 996,682
Cash 179,012 300,196 358,996
Total current assets 1,341,132 1,241,107 1,355,678
Total assets 4,090,031 3,916,849 4,039,423
30 June 30 June 31 DecemberDKK thousands Note 2021 2020 2020

Netcompany continues to grow and lifts expectations to full year revenue growth Netcompany Group A/SGrønningen 17, 1270 Copenhagen
Company Registration no. 39 48 89 14Company Announcement No. 14/2021
18 August 2021
34
50
Cash Flow statementDKK thousands Q2 2021 Q2 2020 YTD 2021 YTD 2020 Total 2020
Operating profit (EBIT) 157,653 136,042 364,830 274,800 644,945
Depreciation and amortisation 28,979 41,434 56,620 82,474 164,431
Non-cash items 9,565 6,137 26,854 2,422 17,596
Working capital changes -188,984 -68,680 -193,041 -67,698 -103,248
Total 7,213 114,933 255,264 291,998 723,724
Income taxes paid -4,382 -3,509 -121,949 -71,517 -126,163
Financial income received 235 664 774 1,527 2,533
Financial expenses paid -8,237 -5,613 -20,486 -8,942 -19,220
Cash flow from operating activities -5,171 106,475 113,603 213,066 580,873
Net cash outflow on acquisition of subsidiaries 0 0 -89,405 0 0
Other investments -25,000 0 -25,000 0 -75,000
Acquisition of property, plant and equipment -5,005 -3,330 -23,215 -14,907 -23,869
Other receivables (deposits) -1,062 265 -1,469 -61 -2,779
Cash flow from investment activities -31,067 -3,064 -139,089 -14,968 -101,649
Dividends paid 0 0 -49,100 0 0
Payment of treasury shares -49,999 0 -49,999 0 0
Repayment of borrowings -35,182 0 -35,182 0 -200,000
Repayment of right of use assets -13,190 -11,313 -24,471 -22,232 -45,652
Cash flow from financing activities -98,371 -11,313 -158,752 -22,232 -245,652
Net increase in cash and cash equivalents -134,609 92,098 -184,238 175,865 233,573
Cash and cash equivalents at the beginning 314,834 208,538 358,996 132,350 132,350
Effect of exchange rate changes on the balance cash held in foreign currencies -1,213 -440 4,254 -8,020 -6,927
Cash and cash equivalents at the end 179,012 300,196 179,012 300,196 358,996

Netcompany continues to grow and lifts expectations to full year revenue growth Netcompany Group A/SGrønningen 17, 1270 Copenhagen
Company Registration no. 39 48 89 14Company Announcement No. 14/2021
18 August 2021
35
50
Statement of changes in Equity
Foreigncurrency
Share Treasury Share-based translation RetainedDKK thousands capital shares remuneration subsidiaries earnings Total
Equity at 1 April 2021 50,000 -175,000 50,993 4,496 2,665,381 2,595,870
Treasury Shares for the period 0 -50,000 0 0 0 -50,000
Share-based remuneration for the period 0 0 9,348 0 0 9,348
Profit for the period 0 0 0 0 112,402 112,402
Other comprehensive income 0 0 0 -1,255 0 -1,255
Equity at 30 June 2021 50,000 -225,000 60,341 3,241 2,777,782 2,666,364
Equity at 1 January 2021 50,000 -175,000 42,478 -3,793 2,514,936 2,428,621
Treasury Shares for the period 0 -50,000 0 0 0 -50,000
Share-based remuneration for the period 0 0 17,862 0 0 17,862
Dividend paid 0 0 0 0 -49,100 -49,100
Profit for the period 0 0 0 0 311,947 311,947
Other comprehensive income 0 0 0 7,034 0 7,034Equity at 30 June 2021 50,000 -225,000 60,341 3,241 2,777,782 2,666,364
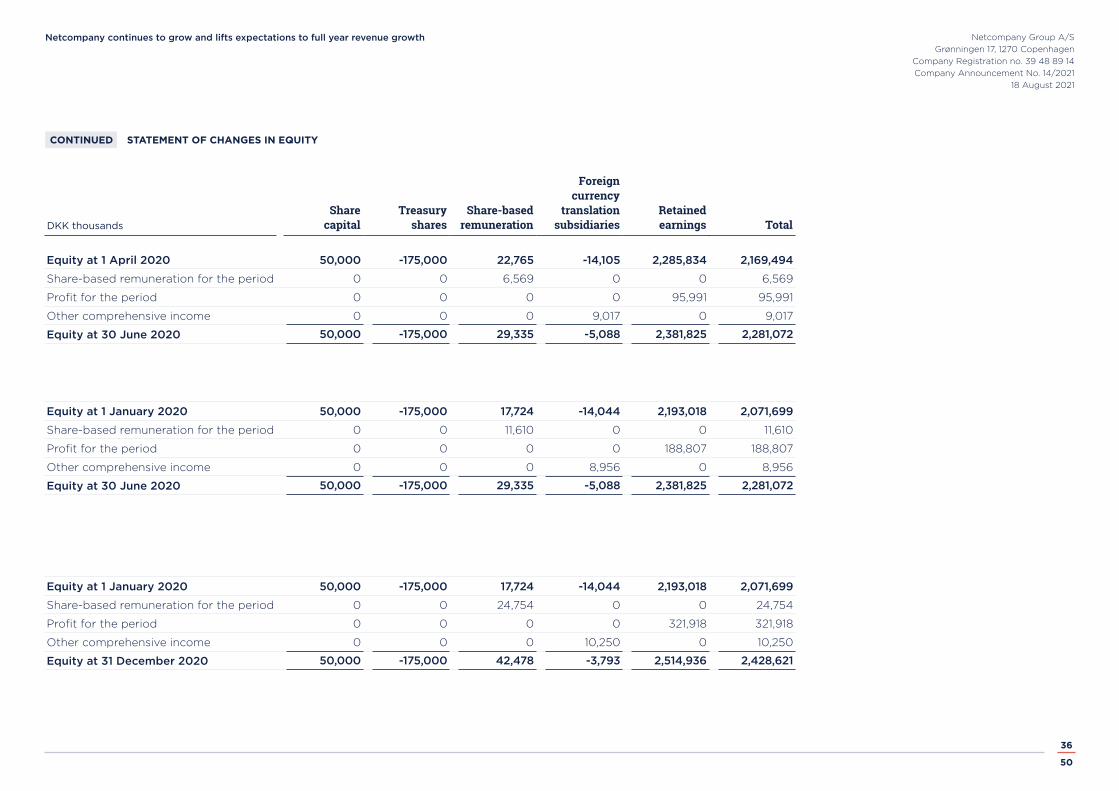
Netcompany continues to grow and lifts expectations to full year revenue growth Netcompany Group A/SGrønningen 17, 1270 Copenhagen
Company Registration no. 39 48 89 14Company Announcement No. 14/2021
18 August 2021
36
50
Foreigncurrency
Share Treasury Share-based translation RetainedDKK thousands capital shares remuneration subsidiaries earnings Total
Equity at 1 April 2020 50,000 -175,000 22,765 -14,105 2,285,834 2,169,494
Share-based remuneration for the period 0 0 6,569 0 0 6,569
Profit for the period 0 0 0 0 95,991 95,991
Other comprehensive income 0 0 0 9,017 0 9,017
Equity at 30 June 2020 50,000 -175,000 29,335 -5,088 2,381,825 2,281,072
STATEMENT OF CHANGES IN EQUITYCONTINUED
Equity at 1 January 2020 50,000 -175,000 17,724 -14,044 2,193,018 2,071,699
Share-based remuneration for the period 0 0 11,610 0 0 11,610
Profit for the period 0 0 0 0 188,807 188,807
Other comprehensive income 0 0 0 8,956 0 8,956
Equity at 30 June 2020 50,000 -175,000 29,335 -5,088 2,381,825 2,281,072
Equity at 1 January 2020 50,000 -175,000 17,724 -14,044 2,193,018 2,071,699
Share-based remuneration for the period 0 0 24,754 0 0 24,754
Profit for the period 0 0 0 0 321,918 321,918
Other comprehensive income 0 0 0 10,250 0 10,250
Equity at 31 December 2020 50,000 -175,000 42,478 -3,793 2,514,936 2,428,621
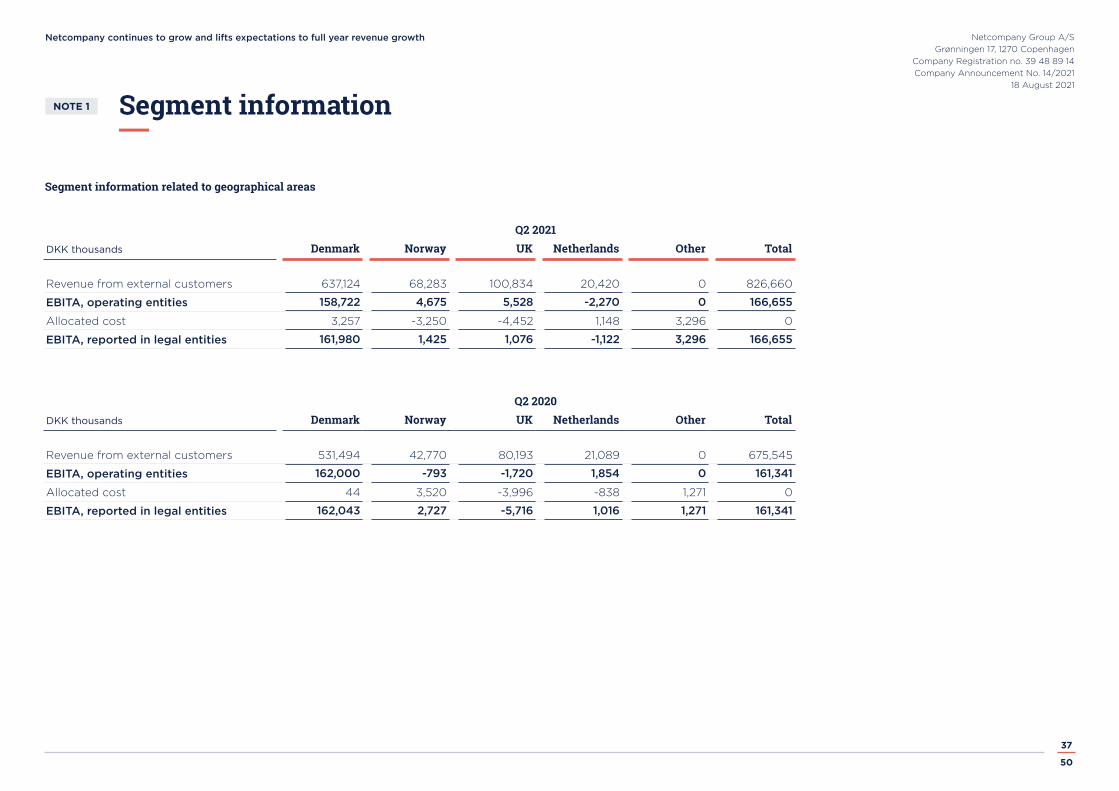
Netcompany continues to grow and lifts expectations to full year revenue growth Netcompany Group A/SGrønningen 17, 1270 Copenhagen
Company Registration no. 39 48 89 14Company Announcement No. 14/2021
18 August 2021
37
50
Segment information related to geographical areas
Segment informationNOTE 1
Q2 2021DKK thousands Denmark Norway UK Netherlands Other Total
Revenue from external customers 637,124 68,283 100,834 20,420 0 826,660
EBITA, operating entities 158,722 4,675 5,528 -2,270 0 166,655
Allocated cost 3,257 -3,250 -4,452 1,148 3,296 0
EBITA, reported in legal entities 161,980 1,425 1,076 -1,122 3,296 166,655
Q2 2020DKK thousands Denmark Norway UK Netherlands Other Total
Revenue from external customers 531,494 42,770 80,193 21,089 0 675,545
EBITA, operating entities 162,000 -793 -1,720 1,854 0 161,341
Allocated cost 44 3,520 -3,996 -838 1,271 0
EBITA, reported in legal entities 162,043 2,727 -5,716 1,016 1,271 161,341
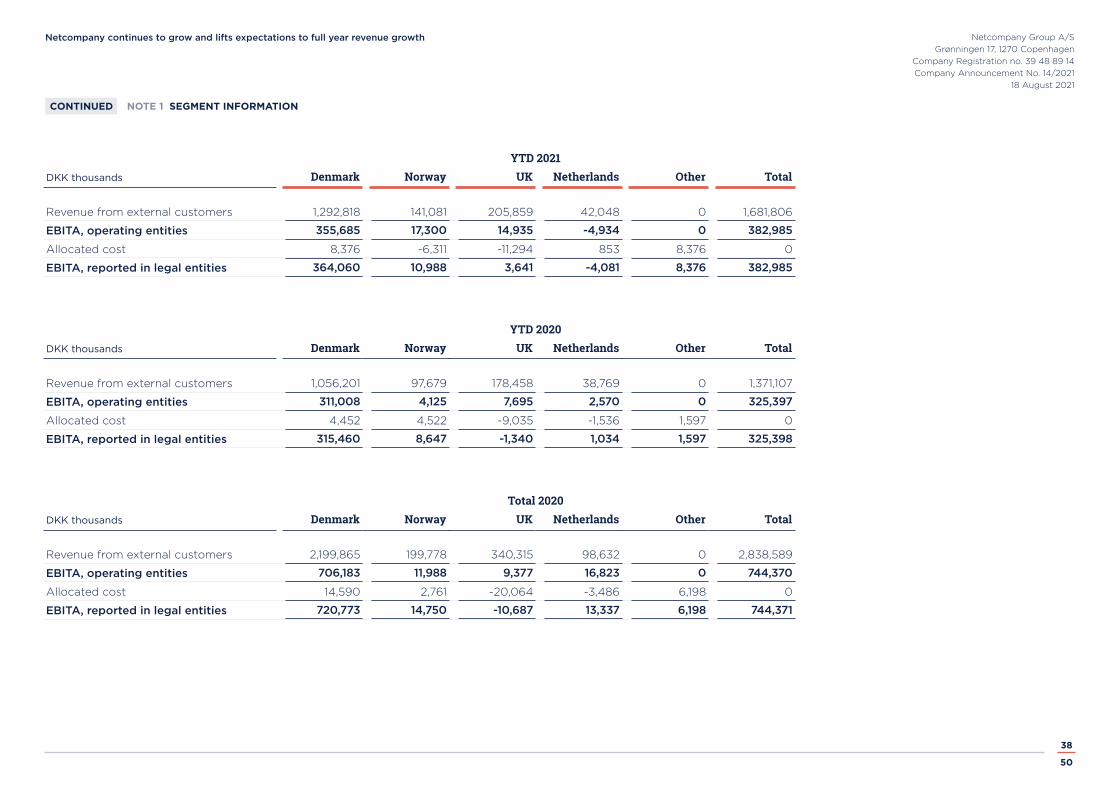
Netcompany continues to grow and lifts expectations to full year revenue growth Netcompany Group A/SGrønningen 17, 1270 Copenhagen
Company Registration no. 39 48 89 14Company Announcement No. 14/2021
18 August 2021
38
50
YTD 2021DKK thousands Denmark Norway UK Netherlands Other Total
Revenue from external customers 1,292,818 141,081 205,859 42,048 0 1,681,806
EBITA, operating entities 355,685 17,300 14,935 -4,934 0 382,985
Allocated cost 8,376 -6,311 -11,294 853 8,376 0
EBITA, reported in legal entities 364,060 10,988 3,641 -4,081 8,376 382,985
YTD 2020DKK thousands Denmark Norway UK Netherlands Other Total
Revenue from external customers 1,056,201 97,679 178,458 38,769 0 1,371,107
EBITA, operating entities 311,008 4,125 7,695 2,570 0 325,397
Allocated cost 4,452 4,522 -9,035 -1,536 1,597 0
EBITA, reported in legal entities 315,460 8,647 -1,340 1,034 1,597 325,398
Total 2020DKK thousands Denmark Norway UK Netherlands Other Total
Revenue from external customers 2,199,865 199,778 340,315 98,632 0 2,838,589
EBITA, operating entities 706,183 11,988 9,377 16,823 0 744,370
Allocated cost 14,590 2,761 -20,064 -3,486 6,198 0
EBITA, reported in legal entities 720,773 14,750 -10,687 13,337 6,198 744,371
NOTE 1 SEGMENT INFORMATIONCONTINUED

Netcompany continues to grow and lifts expectations to full year revenue growth Netcompany Group A/SGrønningen 17, 1270 Copenhagen
Company Registration no. 39 48 89 14Company Announcement No. 14/2021
18 August 2021
39
50
Administrative costs
Cost of servicesNOTE 2
NOTE 3
DKK thousands Q2 2021 Q2 2020 YTD 2021 YTD 2020 Total 2020
Cost of services -60,771 -52,380 -124,854 -129,940 -255,491
Salaries -466,507 -359,432 -925,935 -699,468 -1,412,104
Depreciation -6,028 -4,033 -12,005 -7,472 -15,777
Cost of services total -533,306 -415,845 -1,062,793 -836,880 -1,683,372
DKK thousands Q2 2021 Q2 2020 YTD 2021 YTD 2020 Total 2020
Administrative costs -52,911 -39,486 -97,041 -90,623 -179,992
Salaries -53,724 -42,963 -100,298 -85,584 -164,520
Depreciation -13,949 -12,102 -26,461 -24,405 -49,228
Administrative costs total -120,585 -94,551 -223,800 -200,611 -393,741

Netcompany continues to grow and lifts expectations to full year revenue growth Netcompany Group A/SGrønningen 17, 1270 Copenhagen
Company Registration no. 39 48 89 14Company Announcement No. 14/2021
18 August 2021
40
50
Financial income and expenses
Special itemsNOTE 4
NOTE 5
DKK thousands Q2 2021 Q2 2020 YTD 2021 YTD 2020 Total 2020
Costs related to M&A 0 0 0 -3 -3
Total special items 0 0 0 -3 -3
DKK thousands Q2 2021 Q2 2020 YTD 2021 YTD 2020 Total 2020
Financial Income
Exchange rate adjustments 2,296 6,590 4,185 12,907 19,266
Other financial income 41 26 59 42 81
Financial income total 2,337 6,616 4,245 12,949 19,347
Financial expenses
Interest expense, bank loan -2,499 -3,622 -5,089 -7,549 -13,661
Interest expense, leasing -908 -1,083 -1,721 -2,068 -3,986
Exchange rate adjustments -3,885 -16,694 -5,295 -36,166 -43,177
Other financial expenses -1,784 -1,373 -5,514 -2,471 -5,481
Financial expenses total -9,076 -22,771 -17,619 -48,255 -66,306
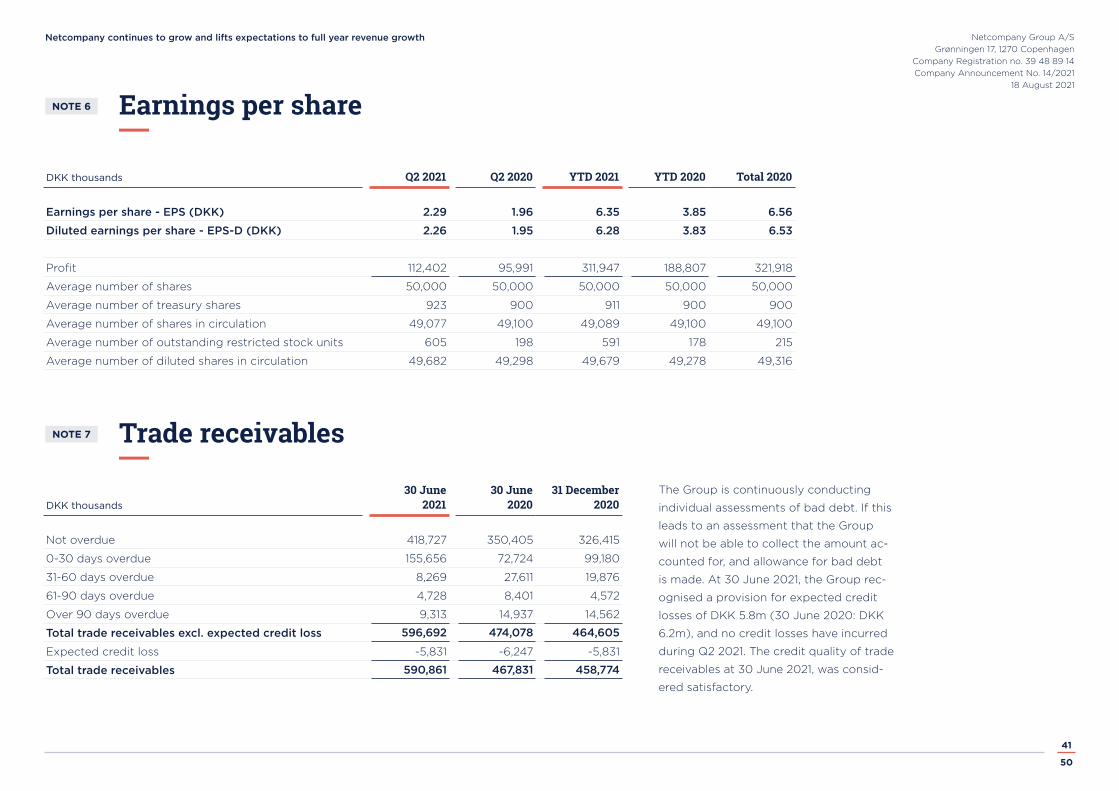
Netcompany continues to grow and lifts expectations to full year revenue growth Netcompany Group A/SGrønningen 17, 1270 Copenhagen
Company Registration no. 39 48 89 14Company Announcement No. 14/2021
18 August 2021
41
50
The Group is continuously conducting
individual assessments of bad debt. If this
leads to an assessment that the Group
will not be able to collect the amount ac-
counted for, and allowance for bad debt
is made. At 30 June 2021, the Group rec-
ognised a provision for expected credit
losses of DKK 5.8m (30 June 2020: DKK
6.2m), and no credit losses have incurred
during Q2 2021. The credit quality of trade
receivables at 30 June 2021, was consid-
ered satisfactory.
Trade receivables
Earnings per shareNOTE 6
NOTE 7
30 June 30 June 31 DecemberDKK thousands 2021 2020 2020
Not overdue 418,727 350,405 326,415
0-30 days overdue 155,656 72,724 99,180
31-60 days overdue 8,269 27,611 19,876
61-90 days overdue 4,728 8,401 4,572
Over 90 days overdue 9,313 14,937 14,562
Total trade receivables excl. expected credit loss 596,692 474,078 464,605
Expected credit loss -5,831 -6,247 -5,831
Total trade receivables 590,861 467,831 458,774
DKK thousands Q2 2021 Q2 2020 YTD 2021 YTD 2020 Total 2020
Earnings per share - EPS (DKK) 2.29 1.96 6.35 3.85 6.56
Diluted earnings per share - EPS-D (DKK) 2.26 1.95 6.28 3.83 6.53
Profit 112,402 95,991 311,947 188,807 321,918
Average number of shares 50,000 50,000 50,000 50,000 50,000
Average number of treasury shares 923 900 911 900 900
Average number of shares in circulation 49,077 49,100 49,089 49,100 49,100
Average number of outstanding restricted stock units 605 198 591 178 215
Average number of diluted shares in circulation 49,682 49,298 49,679 49,278 49,316
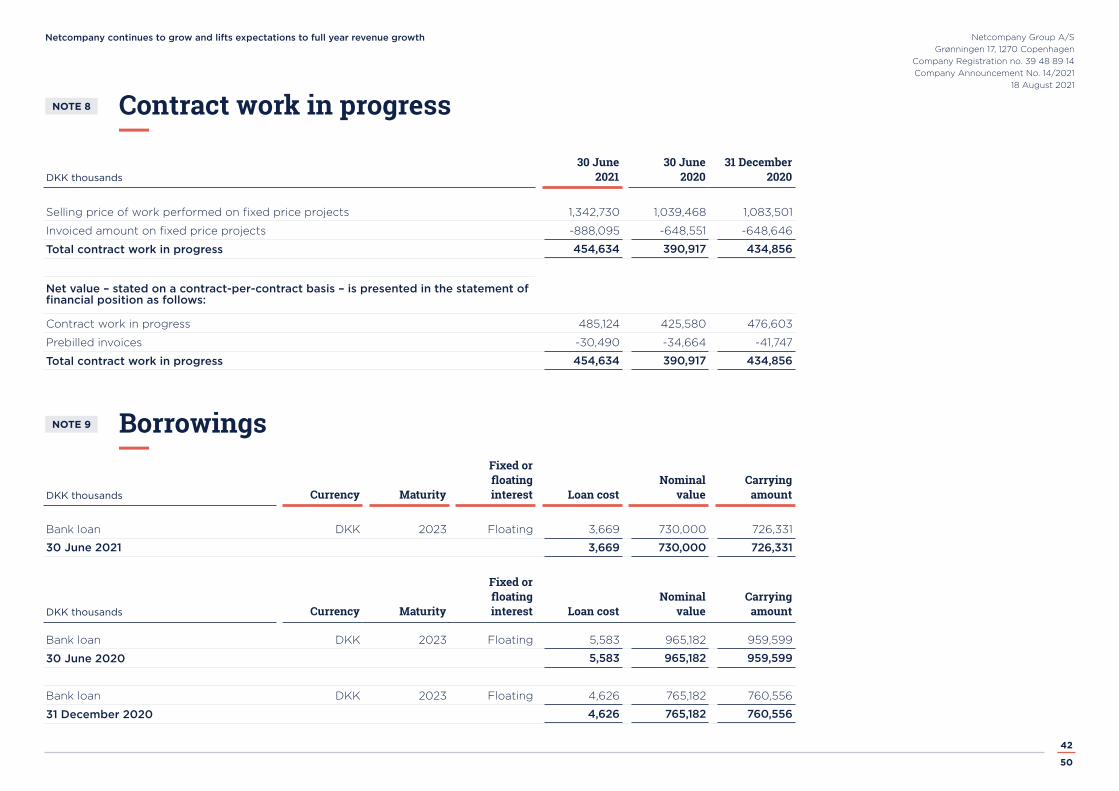
Netcompany continues to grow and lifts expectations to full year revenue growth Netcompany Group A/SGrønningen 17, 1270 Copenhagen
Company Registration no. 39 48 89 14Company Announcement No. 14/2021
18 August 2021
42
50
Borrowings
Contract work in progressNOTE 8
NOTE 9
30 June 30 June 31 DecemberDKK thousands 2021 2020 2020
Selling price of work performed on fixed price projects 1,342,730 1,039,468 1,083,501
Invoiced amount on fixed price projects -888,095 -648,551 -648,646
Total contract work in progress 454,634 390,917 434,856
Net value – stated on a contract-per-contract basis – is presented in the statement of financial position as follows:
Contract work in progress 485,124 425,580 476,603
Prebilled invoices -30,490 -34,664 -41,747
Total contract work in progress 454,634 390,917 434,856
Fixed orfloating Nominal Carrying
DKK thousands Currency Maturity interest Loan cost value amount
Bank loan DKK 2023 Floating 3,669 730,000 726,331
30 June 2021 3,669 730,000 726,331
Fixed orfloating Nominal Carrying
DKK thousands Currency Maturity interest Loan cost value amount
Bank loan DKK 2023 Floating 5,583 965,182 959,599
30 June 2020 5,583 965,182 959,599
Bank loan DKK 2023 Floating 4,626 765,182 760,556
31 December 2020 4,626 765,182 760,556

Netcompany continues to grow and lifts expectations to full year revenue growth Netcompany Group A/SGrønningen 17, 1270 Copenhagen
Company Registration no. 39 48 89 14Company Announcement No. 14/2021
18 August 2021
43
50
For further details on contingent purchase
price and earn out, please refer to Annual
Report 2020 note 14.
Other costs include accruals for fee, ad-
ministration, sales and other items. Other
accruals liabilities have a remaining term
of up to one year.
Provision
Other payablesNOTE 10
NOTE 11
30 June 30 June 31 DecemberDKK thousands 2021 2020 2020
Wages and salaries, payroll taxes, social security costs, etc. payable 47,871 37,289 53,235
Holiday pay obligation 134,799 168,988 144,836
VAT and duties 79,909 59,361 58,889
Contingent purchase price & earn out 122,819 120,441 261,709
Other costs payable 22,517 38,030 48,482
Total other payables 407,916 424,110 567,151
DKK thousands Q2 2021 Q2 2020 YTD 2021 YTD 2020 Total 2020
Onerous contracts and warranty obligations beginning of period 0 3,525 0 3,525 3,525
Decrease in the period 0 -3,525 0 -3,525 -3,525
Onerous contracts and warranty obligations end of period 0 0 0 0 0

Netcompany continues to grow and lifts expectations to full year revenue growth Netcompany Group A/SGrønningen 17, 1270 Copenhagen
Company Registration no. 39 48 89 14Company Announcement No. 14/2021
18 August 2021
44
50
Income Statement classified by function
DKK thousands Q2 2021 Q2 2020 YTD 2021 YTD 2020 Total 2020
Income statement
Revenue 826,660 675,545 1,681,806 1,371,107 2,838,590
Cost of services, incl. depreciation and amortisation -533,306 -415,845 -1,062,793 -836,880 -1,683,372
Gross profit 293,354 259,699 619,013 534,228 1,155,218
Sales and marketing costs, incl. depreciation and amortisation -6,114 -3,807 -12,228 -8,216 -17,104
Administrative costs, incl. depreciation and amortisation -129,587 -119,850 -241,955 -251,211 -493,170
Operating profit (EBIT) 157,653 136,042 364,830 274,800 644,945
Financial income 2,337 6,616 4,245 12,949 19,347
Financial expenses -9,076 -22,771 -17,619 -48,255 -66,306
Fair value adjustment of contingent consideration 0 0 49,485 0 -141,268
Income / loss from investment in joint venture -5,192 0 -11,219 0 -5,035
Profit / loss before tax 145,722 119,886 389,721 239,494 451,683
Tax on the profit for the period -33,321 -23,895 -77,774 -50,687 -129,766
Net profit / loss for the period112,402 95,991 311,947 188,807 321,918
Depreciation and Amortisation have been presented as follows in the income statement:
Cost of services -6,028 -4,033 -12,005 -7,472 -15,777
Administrative costs -22,951 -37,401 -44,616 -75,002 -148,654
Depreciation and amortisation -28,979 -41,434 -56,620 -82,474 -164,431
NOTE 12

Netcompany continues to grow and lifts expectations to full year revenue growth Netcompany Group A/SGrønningen 17, 1270 Copenhagen
Company Registration no. 39 48 89 14Company Announcement No. 14/2021
18 August 2021
45
50
As part of its contract commitments with
customers, the Group has through its
banks provided performance guarantees
of DKK 118.1m (nil).
There are no collaterals provided for
the Group’s bank loan.
In Q2 2021, Netcompany recognised
revenue from Smarter Airports A/S of
DKK 24.4m.
Related party transactions
Collateral provided and contingent liabilitiesNOTE 13
NOTE 14
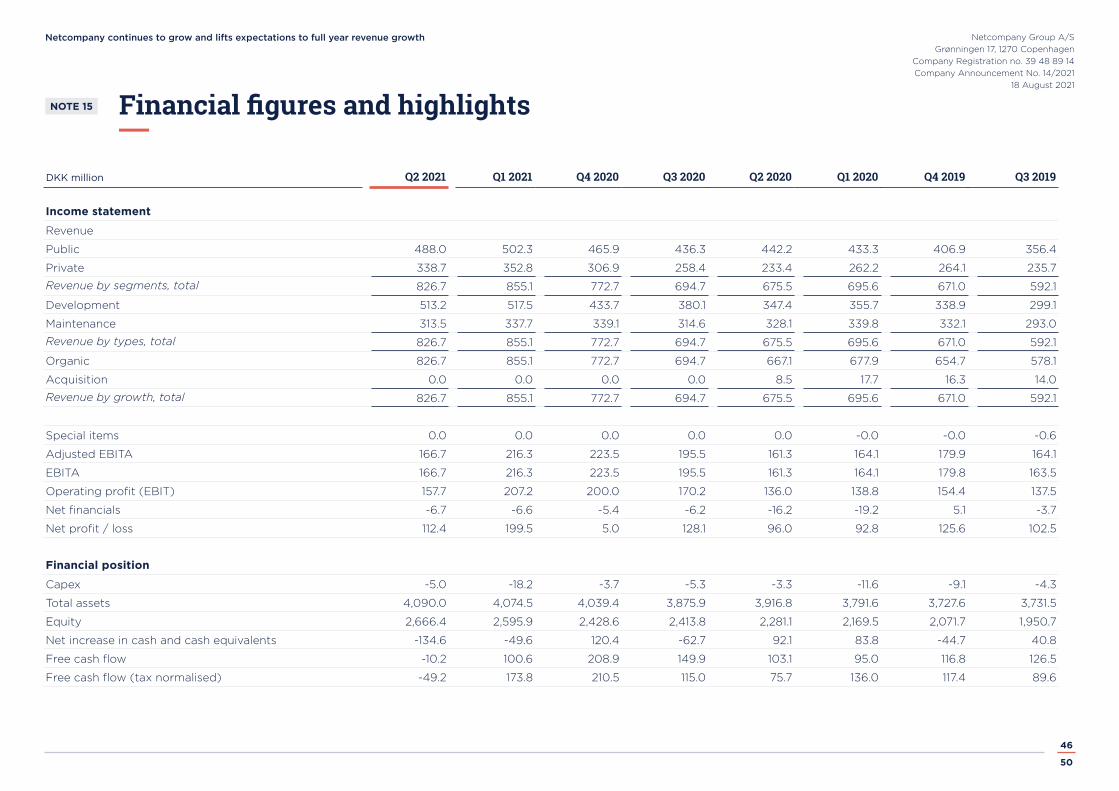
Netcompany continues to grow and lifts expectations to full year revenue growth Netcompany Group A/SGrønningen 17, 1270 Copenhagen
Company Registration no. 39 48 89 14Company Announcement No. 14/2021
18 August 2021
46
50
Financial figures and highlightsNOTE 15
DKK million Q2 2021 Q1 2021 Q4 2020 Q3 2020 Q2 2020 Q1 2020 Q4 2019 Q3 2019
Income statement
Revenue
Public 488.0 502.3 465.9 436.3 442.2 433.3 406.9 356.4
Private 338.7 352.8 306.9 258.4 233.4 262.2 264.1 235.7
Revenue by segments, total 826.7 855.1 772.7 694.7 675.5 695.6 671.0 592.1
Development 513.2 517.5 433.7 380.1 347.4 355.7 338.9 299.1
Maintenance 313.5 337.7 339.1 314.6 328.1 339.8 332.1 293.0
Revenue by types, total 826.7 855.1 772.7 694.7 675.5 695.6 671.0 592.1
Organic 826.7 855.1 772.7 694.7 667.1 677.9 654.7 578.1
Acquisition 0.0 0.0 0.0 0.0 8.5 17.7 16.3 14.0
Revenue by growth, total 826.7 855.1 772.7 694.7 675.5 695.6 671.0 592.1
Special items 0.0 0.0 0.0 0.0 0.0 -0.0 -0.0 -0.6
Adjusted EBITA 166.7 216.3 223.5 195.5 161.3 164.1 179.9 164.1
EBITA 166.7 216.3 223.5 195.5 161.3 164.1 179.8 163.5
Operating profit (EBIT) 157.7 207.2 200.0 170.2 136.0 138.8 154.4 137.5
Net financials -6.7 -6.6 -5.4 -6.2 -16.2 -19.2 5.1 -3.7
Net profit / loss 112.4 199.5 5.0 128.1 96.0 92.8 125.6 102.5
Financial position
Capex -5.0 -18.2 -3.7 -5.3 -3.3 -11.6 -9.1 -4.3
Total assets 4,090.0 4,074.5 4,039.4 3,875.9 3,916.8 3,791.6 3,727.6 3,731.5
Equity 2,666.4 2,595.9 2,428.6 2,413.8 2,281.1 2,169.5 2,071.7 1,950.7
Net increase in cash and cash equivalents -134.6 -49.6 120.4 -62.7 92.1 83.8 -44.7 40.8
Free cash flow -10.2 100.6 208.9 149.9 103.1 95.0 116.8 126.5
Free cash flow (tax normalised) -49.2 173.8 210.5 115.0 75.7 136.0 117.4 89.6

Netcompany continues to grow and lifts expectations to full year revenue growth Netcompany Group A/SGrønningen 17, 1270 Copenhagen
Company Registration no. 39 48 89 14Company Announcement No. 14/2021
18 August 2021
47
50
NOTE 15 FINANCIAL FIGURES AND HIGHLIGHTS
Earnings per share
Earnings per share (DKK) 2.29 4.06 0.10 2.61 1.96 1.89 2.56 2.09
Diluted Earnings per share (DKK) 2.26 4.02 0.10 2.60 1.95 1.88 2.55 2.08
Employees
Average number of full-time employees 3,238 3,109 2,996 2,827 2,663 2,585 2,468 2,345
Financial ratios
Revenue growth 22.4% 22.9% 15.2% 17.3% 13.9% 16.4% 23.5% 20.8%
Gross profit margin 35.5% 38.1% 42.4% 42.2% 38.4% 39.5% 42.3% 43.2%
Adjusted EBITA margin 20.2% 25.3% 28.9% 28.1% 23.9% 23.6% 26.8% 27.7%
EBITA margin 20.2% 25.3% 28.9% 28.1% 23.9% 23.6% 26.8% 27.6%
Operating profit margin 19.1% 24.2% 25.9% 24.5% 20.1% 19.9% 23.0% 23.2%
Effective tax rate 22.9% 18.2% 89.6% 21.9% 19.9% 22.4% 21.2% 23.4%
Return on equity 4.5% 8.4% 0.2% 5.9% 4.6% 4.7% 6.5% 5.6%
Solvency ratio 65.2% 63.7% 60.1% 62.3% 58.2% 57.2% 55.6% 52.3%
ROIC 3.7% 6.7% 0.2% 4.4% 3.3% 3.3% 4.4% 3.6%
ROIC (Adjusted for Goodwill) 13.8% 27.8% 0.8% 19.8% 14.7% 14.8% 18.9% 16.3%
Cash conversion rate -8.5% 48.7% 893.4% 101.4% 89.1% 84.4% 80.3% 103.1%
Cash conversion rate (tax normalised) -41.2% 84.1% 900.4% 77.8% 65.4% 120.9% 80.7% 73.0%
DKK million Q2 2021 Q1 2021 Q4 2020 Q3 2020 Q2 2020 Q1 2020 Q4 2019 Q3 2019
CONTINUED
Netcompany continues to grow and lifts expectations to full year revenue growth Netcompany Group A/SGrønningen 17, 1270 Copenhagen
Company Registration no. 39 48 89 14Company Announcement No. 14/2021
18 August 2021
48
50
The annual consolidated financial state-
ments of the Group are prepared in ac-
cordance with IFRS as adopted by the
European Union. The interim consolidated
financial statements included in this Q2
2021 financial report has been prepared
in accordance with IAS 34 “Interim Finan-
cial Reporting” as adopted by the Europe-
an Union. The accounting policies applied
are consistent with those applied in the
consolidated Annual Report for the year
ended 31 December 2020 for Netcompany
Group A/S.
Accounting policiesNOTE 16
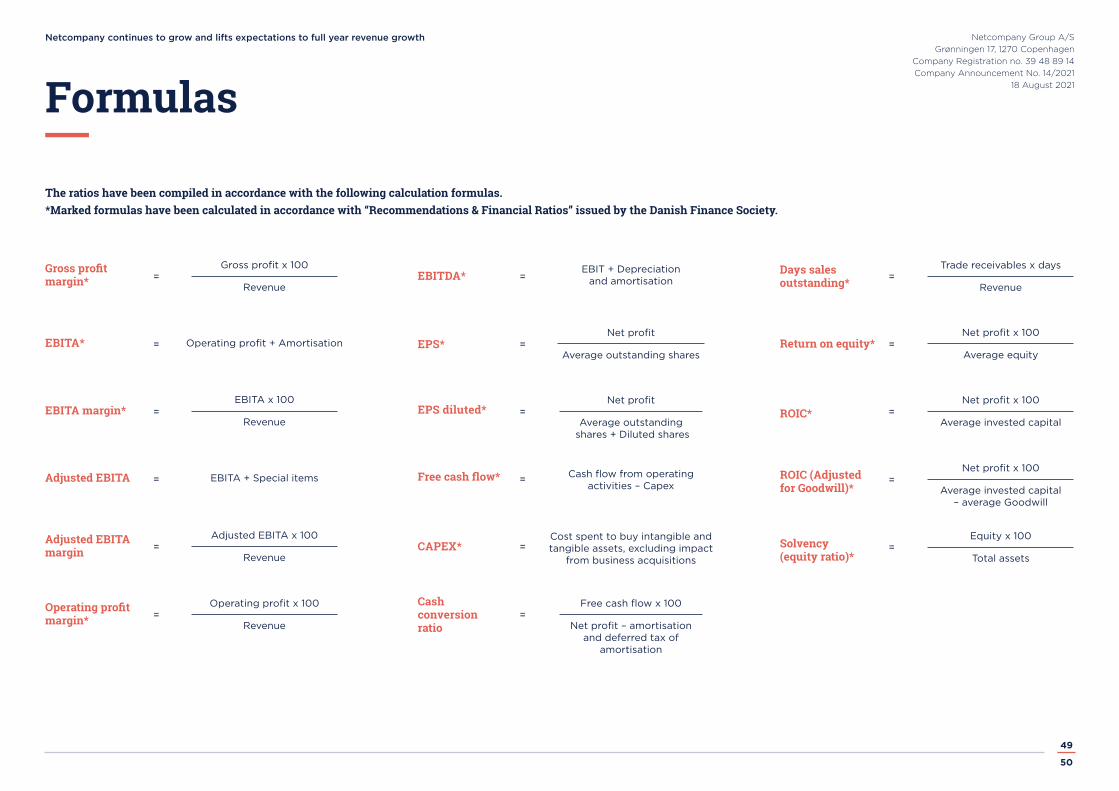
Netcompany continues to grow and lifts expectations to full year revenue growth Netcompany Group A/SGrønningen 17, 1270 Copenhagen
Company Registration no. 39 48 89 14Company Announcement No. 14/2021
18 August 2021
49
50
Formulas
= = =
= = =
= =
= =
= =
= = =
Gross profit x 100
EBITA x 100
Adjusted EBITA x 100
Operating profit x 100
EBIT + Depreciation and amortisation
Operating profit + Amortisation
EBITA + Special items
Revenue
Revenue
Revenue
Revenue
Gross profit margin*
Return on equity*
EBITA margin*
Adjusted EBITA
Adjusted EBITA margin
Operating profit margin*
EBITA*
ROIC*
Net profit x 100
Net profit x 100
Average equity
Average invested capital
Free cash flow x 100
Trade receivables x days
Net profit
Net profit
Net profit – amortisation and deferred tax of
amortisation
Revenue
Average outstanding shares
Average outstanding shares + Diluted shares
Cash flow from operating activities – Capex
Cost spent to buy intangible and tangible assets, excluding impact
from business acquisitions
Free cash flow*
EPS diluted*
Cash conversion ratio
Days sales outstanding*
EPS*
EBITDA*
CAPEX*
The ratios have been compiled in accordance with the following calculation formulas.*Marked formulas have been calculated in accordance with “Recommendations & Financial Ratios” issued by the Danish Finance Society.
=
=Solvency(equity ratio)*
ROIC (Adjusted for Goodwill)*
Net profit x 100
Equity x 100
Average invested capital – average Goodwill
Total assets

Netcompany continues to grow and lifts expectations to full year revenue growth Netcompany Group A/SGrønningen 17, 1270 Copenhagen
Company Registration no. 39 48 89 14Company Announcement No. 14/2021
18 August 2021
50
50
This report contains forward-looking
statements including, but not limited
to, the statements and expectations
contained in the outlook section. For-
ward-looking statements are statements
(other than statements of historical fact)
relating to future events and Netcompa-
ny’s anticipated or planned financial and
operational performance.
The words ‘may’, ‘will’, ‘will continue’,
‘should’, ‘expect’, ‘foresee’, ‘anticipate’,
‘believe’, ‘estimate’, ‘plan’, ‘predict’, ‘intend’
or variations of these words, including
negatives thereof, as well as other state-
ments regarding matters that are not
historical fact or regarding future events
or prospects, constitute forward-looking
statements.
Netcompany has based these for-
ward-looking statements on its current
views with respect to future events and
financial performance. These views in-
volve a number of risks and uncertainties,
which could cause actual results to differ
materially from those predicted in the
forward-looking statements and from
the past performance of Netcompany.
Although Netcompany believes that the
estimates and projections reflected in the
forward-looking statements are reasona-
ble, they may prove materially incorrect,
and actual results may materially differ,
e.g. as the result of risks related to the
industry in general or Netcompany in par-
ticular, including those described in Net-
company Group A/S’ Annual Report 2020
and other information made available by
Netcompany.
Factors that may affect future results
include, but are not limited to, global
and economic conditions, including cur-
rency exchange rate and interest rate
fluctuations, delay or failure of projects
related to research and/or development,
unexpected contract breaches or ter-
minations, unplanned loss of patents,
government-mandated or market-driven
price decreases for Netcompany’s prod-
ucts, introduction of competing products,
reliance on information technology, Net-
company’s ability to successfully market
current and new products, exposure to
product liability, litigation and investiga-
tions, regulatory developments, actual or
perceived failure to adhere to ethical mar-
keting practices, unexpected growth in
costs and expenses, failure to recruit and
retain the right employees, and failure to
maintain a culture of compliance.
As a result, forward-looking statements
should not be relied on as a prediction
of actual results. Netcompany undertakes
no obligation to update or revise any for-
ward-looking statements, whether as a
result of new information, future events
or otherwise, except to the extent re-
quired by law.
The Annual Report 2020 of Netcompany
Group A/S is available at our website
www.netcompany.com
About NetcompanyNetcompany delivers business critical IT
solutions and consultancy that help our
customers to achieve significant business
benefits in a digitised world. Netcompany
also helps our customers to manage and
operate IT solutions both on location and
in the cloud.
Disclaimer