compal electronics, inc. financial statements …
TRANSCRIPT

1
Stock Code:2324
COMPAL ELECTRONICS, INC.
FINANCIAL STATEMENTS
December 31, 2016 and 2015(With Independent Auditor’s Report Thereon)
Address:No.581 & 581-1, Ruiguang Rd., Neihu District, Taipei, Taiwan
Telephone:(02)8797-8588

2
Table of contents
Contents Page
1. Cover Page 1
2. Table of Contents 2
3. Independent Auditors' Report 3
4. Balance Sheets 4
5. Statements of Comprehensive Income 5
6. Statements of Changes in Equity 6
7. Statements of Cash Flows 7
8. Notes to Financial Statements
(1) Company history 8
(2) Approval date and procedures of the financial statements 8
(3) New standards, amendments and interpretations adopted 8~11
(4) Summary of significant accounting policies 12~29
(5) Significant accounting assumptions and judgments, and major sourcesof estimation uncertainty
29
(6) Explanation of significant accounts 30~65
(7) Related-party transactions 66~72
(8) Pledged assets 73
(9) Commitments and contingencies 73
(10) Losses due to major disasters 73
(11) Subsequent events 73
(12) Other 73
(13) Other disclosures
(a) Information on significant transactions 74~81
(b) Information on investees 86
(c) Information on investment in Mainland China 86~89
(14) Segment information 89
9. List of major account titles 90~101

3
Independent Auditor’s Report
To COMPAL ELECTRONICS, INC.:
Opinion
We have audited the financial statements of COMPAL ELECTRONICS, INC. (“ the Company” ), whichcomprise the statements of financial position as of December 31, 2016 and 2015, and the statements ofcomprehensive income, statements of changes in equity and cash flows for the years ended December 31, 2016and 2015, and notes to the financial statements, including a summary of significant accounting policies.
In our opinion, the accompanying financial statements present fairly, in all material respects, the financialposition of the Company as of December 31, 2016 and 2015, and its financial performance and its cash flowsfor the years ended December 31, 2016 and 2015 in accordance with the Regulations Governing the Preparationof Financial Reports by Securities Issuers.
Basis for Opinion
We conducted our audit in accordance with the “Regulations Governing Auditing and Attestation of FinancialStatements by Certified Public Accountants” and the auditing standards generally accepted in the Republic ofChina. Our responsibilities under those standards are further described in the section of the Auditor’ sResponsibilities for the Audit of the Financial Statements . We are independent of the Company in accordancewith the Certified Public Accountants Code of Professional Ethics in Republic of China (“the Code”), and otherethical responsibilities in accordance with the Code have been fulfilled. We believe that the audit evidence wehave obtained is sufficient and appropriate to provide a basis of our opinion.
Key Audit Matters
Key audit matters are those matters that, in our professional judgment, were of most significance in our audit ofthe financial statements of the current period. These matters were addressed in the context of our audit of the financial statements as a whole, and in forming our opinion thereon, and we do not provide a separate opinionon these matters.
1. Account receivable valuation
Please refer to Note (4)(f) and Note (5) for the accounting policy of accounts receivable, as well as theestimation and assumption uncertainty of the valuation of accounts receivable, respectively. Information ofaccount receivable valuation are disclosed in Note (6)(e) of the parent-company-only financial reports.
Description of key audit matters:
The Company devotes to develop new product lines and customers in emerging countries, and the credit risksof these customers are higher than other world leading enterprises. Therefore, valuation of accountsreceivable has been identified as a key audit matter.

3-1
Our key audit procedures performed in respect of the above area included the following:
In order to evaluate the reasonableness of the Company’s estimations for bad debts, our key audit proceduresincluded analyzing the aging of accounts receivable, examining the historical recovery records, and thecurrent credit status of customers, as well as inspecting the amount collected in the subsequent period.
2. Provision of sales returns and allowances
Please refer to Note (4)(o) and Note (5) for the policy of the estimation of sales returns and allowanceprovisions, as well as the estimation and assumption uncertainty of sales returns and allowances provisions,respectively. Information on sales returns and allowances provisions are disclosed in Note (6)(m) of theparent-company-only financial reports.
Description of key audit matters:
Part of the sales need to provide allowance and return to the customers, and the estimation of the above itemsaffects the net sales. Since the said matter is subject to management’s judgment, the rationality of the basisis one of the key audit matters.
Our key audit procedures performed in respect of the above area included the following:
Our key audit procedures included reviewing the appropriateness of accounting policy and disclosure ofprovision for sales return and allowance, and evaluating the historical accuracy of the estimation of salesreturn and allowance, as well as evaluating the appropriateness of estimation in the following year. Inaddition, to evaluate if there is a significant misstatement, we analyzed the trend of sales by main customersand by products, to compare with the changes of provision of sales returns and allowances.
3. Inventory valuation
Please refer to Note (4)(g) and Note (5) for the accounting policy of inventory valuation, as well as theestimation and assumption uncertainty of the valuation of inventory, respectively. Information of estimationof the valuation of inventory are disclosed in Note (6)(f) of the parent-company-only financial reports.
Description of key audit matters:
The inventory is measured at the lower of cost or net realizable value. The short life cycle of electronicproducts may cause significant changes in customers’ demand and sales of related products. Consequently,the book value of inventory may be lower than the net realizable value of inventory. Therefore, the valuationof inventory is one of the key audit matters.
Our key audit procedures performed in respect of the above area included the following:
In order to verify the rationality of assessment of inventory valuation estimated by the Company, our keyaudit procedures included reviewing the consistency of accounting policy, inspecting the Company’ sinventory aging reports, analyzing the change of inventory aging, as well as verifying the inventory agingreports and the calculation of lower of cost or net realizable value.
Responsibilities of Management and Those Charged with Governance for the Financial Statements
Management is responsible for the preparation and fair presentation of the financial statements in accordancewith the Regulations Governing the Preparation of Financial Reports by Securities Issuers, and for such internalcontrol as management determines is necessary to enable the preparation of financial statements that are freefrom material misstatement, whether due to fraud or error.

3-2
In preparing the financial statements, management is responsible for assessing the Company’ s ability tocontinue as a going concern, disclosing, as applicable, matters related to going concern and using the goingconcern basis of accounting unless management either intends to liquidate the Company or to cease operations,or has no realistic alternative but to do so.
Those charged with governance are responsible for overseeing the Company’s financial reporting process.
Auditor’s Responsibilities for the Audit of the Financial Statements
Our objectives are to obtain reasonable assurance about whether the financial statements as a whole are freefrom material misstatement, whether due to fraud or error, and to issue an auditor’ s report that includes ouropinion. Reasonable assurance is a high level of assurance, but is not a guarantee that an audit conducted inaccordance with the auditing standards generally accepted in the Republic of China will always detect a materialmisstatement when it exists. Misstatements can arise from fraud or error and are considered material if,individually or in the aggregate, they could reasonably be expected to influence the economic decisions of userstaken on the basis of these financial statements.
As part of an audit in accordance with auditing standards generally accepted in the Republic of China, weexercise professional judgment and maintain professional skepticism throughout the audit. We also:
1. Identify and assess the risks of material misstatement of the parent-company-only financial reports, whetherdue to fraud or error, design and perform audit procedures responsive to those risks, and obtain auditevidence that is sufficient and appropriate to provide a basis for our opinion. The risk of not detecting amaterial misstatement resulting from fraud is higher than for one resulting from error, as fraud may involvecollusion, forgery, intentional omissions, misrepresentations, or the override of internal control.
2. Obtain an understanding of internal control relevant to the audit in order to design audit procedures that areappropriate in the circumstances, but not for the purpose of expressing an opinion on the effectiveness of theCompany’s internal control.
3. Evaluate the appropriateness of accounting policies used and the reasonableness of accounting estimates andrelated disclosures made by management.
4. Conclude on the appropriateness of management’s use of the going concern basis of accounting and, basedon the audit evidence obtained, whether a material uncertainty exists related to events or conditions that maycast significant doubt on the Company’s ability to continue as a going concern. If we conclude that a materialuncertainty exists, we are required to draw attention in our auditor’s report to the related disclosures in the financial statements or, if such disclosures are inadequate, to modify our opinion. Our conclusions are basedon the audit evidence obtained up to the date of our auditor’s report. However, future events or conditionsmay cause the Company to cease to continue as a going concern.
5. Evaluate the overall presentation, structure and content of the financial reports, including the disclosures, andwhether the financial reports represent the underlying transactions and events in a manner that achieves fairpresentation.
6. Obtain sufficient and appropriate audit evidence regarding the financial information of the investment inother entities accounted for using the equity method to express an opinion on the financial reports. We areresponsible for the direction, supervision and performance of the audit. We remain solely responsible for ouraudit opinion.
We communicate with those charged with governance regarding, among other matters, the planned scope andtiming of the audit and significant audit findings, including any significant deficiencies in internal control thatwe identify during our audit.

3-3
We also provide those charged with governance with a statement that we have complied with relevant ethicalrequirements regarding independence, and to communicate with them all relationships and other matters thatmay reasonably be considered to bear on our independence, and where applicable, related safeguards.
From the matters communicated with those charged with governance, we determine those matters that were ofmost significance in the audit of the parent-company-only financial reports of the current period and aretherefore the key audit matters. We describe these matters in our auditor’ s report unless law or regulationprecludes public disclosure about the matter or when, in extremely rare circumstances, we determine that amatter should not be communicated in our report because the adverse consequences of doing so wouldreasonably be expected to outweigh the public interest benefits of such communication.
The engagement partners on the audit resulting in this independent auditor’s report are Kuan-Ying Kuo and Yiu-Kwan Au.
KPMG
Taipei, Taiwan (Republic of China)March 28, 2017
Notes to Readers
The accompanying financial statements are intended only to present the statement of financial position, financial performance and its cashflows in accordance with the accounting principles and practices generally accepted in the Republic of China and not those of any otherjurisdictions. The standards, procedures and practices to audit such financial statements are those generally accepted and applied in theRepublic of China.

4
COMPAL ELECTRONICS, INC.
Balance Sheets
December 31, 2016 and 2015
(Expressed in Thousands of New Taiwan Dollars)
December 31, 2016 December 31, 2015 Assets Amount % Amount %Current assets:
1100 Cash and cash equivalents (note (6)(a)) $ 43,392,135 13.2 30,797,312 10.4
1125 Current available-for-sale financial assets (note (6)(b)) 48,631 - 29,738 -
1147 Current bond investments without active market (note (6)(d)) 350,000 0.1 350,000 0.1
1170 Notes and accounts receivable, net (note (6)(e)) 162,701,780 49.5 148,844,537 50.2
1180 Notes and accounts receivable due from related parties, net (notes (6)(e) and (7)) 2,177,705 0.7 973,946 0.3
1200 Other receivables (notes (6)(e) and (7)) 314,439 0.1 553,185 0.3
1310 Inventories (note (6)(f)) 27,969,011 8.5 25,344,975 8.6
1470 Other current assets 458,714 0.1 603,115 0.2
237,412,415 72.2 207,496,808 70.1
Non-current assets:
1550 Investments accounted for using equity method (note (6)(g)) 80,626,717 24.5 78,006,762 26.3
1523 Non-current available-for-sale financial assets (note (6)(b)) 6,349,202 1.9 5,970,903 2.0
1543 Non-current financial assets at cost (note (6)(c)) 2,333 - 6,588 -
1546 Non-current bond investment without active market (note (6)(d)) 700,000 0.2 1,050,000 0.4
1600 Property, plant and equipment (note (6)(j)) 2,132,114 0.8 2,181,737 0.7
1780 Intangible assets 268,316 0.1 378,454 0.1
1840 Deferred tax assets (note (6)(p)) 1,012,590 0.3 1,042,365 0.4
1990 Other non-current assets 117,233 - 105,422 -
91,208,505 27.8 88,742,231 29.9
Total assets $ 328,620,920 100.0 296,239,039 100.0
December 31, 2016 December 31, 2015 Liabilities and Equity Amount % Amount %Current liabilities:
2100 Short-term borrowings (note (6)(k)) $ 30,443,750 9.3 22,087,200 7.5
2170 Notes and accounts payable 72,535,568 22.0 63,996,915 21.6
2180 Notes and accounts payable to related parties (note (7)) 73,903,066 22.5 62,361,931 21.1
2200 Other payables (note (7)) 7,725,946 2.4 8,957,625 3.0
2230 Current tax liabilities 1,024,690 0.3 2,200,353 0.7
2250 Current provisions (note (6)(m)) 1,532,250 0.5 2,034,677 0.7
2300 Other current liabilities 926,734 0.3 428,602 0.1
2313 Unearned revenue 1,774,158 0.5 1,747,574 0.6
2320 Long-term liabilities, current portion (note (6)(l)) 7,700,000 2.3 13,850,000 4.7
197,566,162 60.1 177,664,877 60.0
Non-Current liabilities:
2540 Long-term borrowings (note (6)(l)) 23,635,000 7.2 13,740,000 4.6
2570 Deferred tax liabilities (note (6)(p)) 699,875 0.2 448,762 0.2
2640 Non-current net defined benefit liabilities (note (6)(o)) 541,693 0.2 469,846 0.2
2670 Other non-current liabilities (note (6)(g)) 373,801 0.1 139,759 -
25,250,369 7.7 14,798,367 5.0
Total liabilities 222,816,531 67.8 192,463,244 65.0
Equity attributable to owners of parent:
3110 Ordinary share (note (6)(q)) 44,241,606 13.5 44,711,266 15.1
3200 Capital surplus (note (6)(q)) 11,779,274 3.6 12,838,638 4.3
3300 Retained earnings (note (6)(q)) 55,289,409 16.8 51,877,511 17.5
3400 Other equity interest (notes (6)(q) and 6(r)) (4,624,653) (1.4) (3,926,881) (1.3)
3500 Treasury shares (note (6)(q)) (881,247) (0.3) (1,724,739) (0.6)
Total equity 105,804,389 32.2 103,775,795 35.0
Total liabilities and equity $ 328,620,920 100.0 296,239,039 100.0
See accompanying notes to the parent-company-only financial reports.

5
COMPAL ELECTRONICS, INC.
Statements of Comprehensive Income
For the years ended December 31, 2016 and 2015
(Expressed in Thousands of New Taiwan Dollars, Except for Earnings Per Share)
2016 2015
Amount % Amount %
4000 Net sale revenue (notes (6)(t) and (7)) $725,653,095 100.0 802,994,930 100.0
5000 Cost of sales (notes (6)(f), (6)(o), (7) and (12)): 704,371,443 97.1 780,260,207 97.2
Gross profit 21,281,652 2.9 22,734,723 2.8
5910 Less: Unrealized profit from sales 481 - (2,867) -
Gross profit 21,281,171 2.9 22,737,590 2.8
Operating expenses (notes (6)(n), (6)(o), (7) and (12)):
6100 Selling expenses 4,060,832 0.6 3,798,280 0.5
6200 Administrative expenses 2,395,657 0.3 2,581,758 0.3
6300 Research and development expenses 8,851,828 1.2 9,052,274 1.1
15,308,317 2.1 15,432,312 1.9
Net operating income 5,972,854 0.8 7,305,278 0.9
Non-operating income and expenses:
7020 Other gains and losses, net (note 6(v)) (581,031) - 261,589 -
7050 Finance costs (719,294) (0.1) (604,735) -
7190 Other income (notes (6)(n), (6)(v) and (7)) 933,004 0.1 786,958 0.1
7370 Share of profit of subsidiaries, associates and joint ventures accounted for using equity method(note (6)(g))
3,766,213 0.5 2,413,800 0.3
Total non-operating income and expenses 3,398,892 0.5 2,857,612 0.4
7900 Profit before tax 9,371,746 1.3 10,162,890 1.3
7950
Less: tax expense (note 6(p)) 1,240,856 0.2 1,478,280 0.2
Profit 8,130,890 1.1 8,684,610 1.1
8300 Other comprehensive income:
8310 Items that will not be reclassified subsequently to profit or loss
8311 Other comprehensive income, before tax, remeasurement of defined benefit obligation (82,021) - (79,571) -
8330 Share of other comprehensive income of subsidiaries, associates and joint ventures accounted forusing equity method that will not be reclassified subsequently to profit or loss
(6,375) - (4,988) -
8349 Income tax relating to items that will not be reclassified to profit or loss 13,944 - 13,527 -
Items that will not be reclassified subsequently to profit or loss (74,452) - (71,032) -
8360 Items that may be reclassified subsequently to profit or loss
8361 Other comprehensive income, before tax, exchange differences on translation of foreign financialstatements (1,004,076) (0.1) 2,011,139 0.2
8362 Other comprehensive income, before tax, available-for-sale financial assets 362,179 - (1,695,723) (0.2)
8380 Share of other comprehensive income of subsidiaries, associates and joint ventures accounted forusing equity method that may be reclassified subsequently to profit or loss
(521,847) - (357,582) -
8399 Income tax relating to items that may reclassified to profit or loss 23,868 - (18,486) -
Items that may reclassified subsequently to profit or loss (1,139,876) (0.1) (60,652) -
8300 Other comprehensive income, net of tax (1,214,328) (0.1) (131,684) -
8500 Total comprehensive income $ 6,916,562 1.0 8,552,926 1.1
Earnings per share (note (6)(s)):
9750 Basic earnings per share $ 1.88 2.01
9850 Diluted earnings per share $ 1.84 1.97
See accompanying notes to the parent-company-only financial reports.

6
COMPAL ELECTRONICS, INC.
Statements of Changes in Equity
For the years ended December 31, 2016 and 2015
(Expressed in Thousands of New Taiwan Dollars)
Retained earnings Other equity interest
Ordinaryshares
Capitalsurplus Legal reserve
Specialreserve
Unappropriatedretained earnings
Total retainedearnings
Exchangedifferences ontranslation of
foreignfinancial
statements
Unrealizedgains (losses)on available-
for-salefinancial
assets Others
Total otherequity
interestTreasury
shares Total equityBalance on January 1, 2015 $ 44,232,366 14,296,445 15,867,903 7,707,518 24,146,451 47,721,872 1,178,307 (4,317,328) - (3,139,021) (1,724,739) 101,386,923Profit for the year ended December 31, 2015 - - - - 8,684,610 8,684,610 - - - - - 8,684,610Other comprehensive income - - - - (71,032) (71,032) 1,624,754 (1,693,104) 7,698 (60,652) - (131,684)Total comprehensive income - - - - 8,613,578 8,613,578 1,624,754 (1,693,104) 7,698 (60,652) - 8,552,926Appropriation and distribution of retained earnings:
Legal reserve appropriated - - 703,408 - (703,408) - - - - - - -Reversal of special reserve - - - (4,568,497) 4,568,497 - - - - - - -Cash dividends of ordinary share - - - - (4,428,781) (4,428,781) - - - - - (4,428,781)
Cash dividends from capital surplus - (2,214,390) - - - - - - - - - (2,214,390)Difference between consideration and carrying amount arising from acquisition or
disposal of subsidiaries - 258 - - - - - - - - - 258
Changes in ownership interests in subsidiaries - 28,275 - - (14,572) (14,572) - - - - - 13,703Changes in equity of associates and joint ventures accounted for using equity method - 5,824 - - (15,956) (15,956) - - - - - (10,132)Share-based payments transaction 478,900 647,200 - - 1,370 1,370 - - (727,208) (727,208) - 400,262Adjustments of capital surplus for the Company’s cash dividends received by
subsidiaries - 75,026 - - - - - - - - - 75,026Balance on December 31, 2015 44,711,266 12,838,638 16,571,311 3,139,021 32,167,179 51,877,511 2,803,061 (6,010,432) (719,510) (3,926,881) (1,724,739) 103,775,795Profit for the year ended December 31, 2016 - - - - 8,130,890 8,130,890 - - - - - 8,130,890Other comprehensive income - - - - (74,452) (74,452) (1,478,779) 346,602 (7,699) (1,139,876) - (1,214,328)Total comprehensive income - - - - 8,056,438 8,056,438 (1,478,779) 346,602 (7,699) (1,139,876) - 6,916,562Appropriation and distribution of retained earnings:
Legal reserve appropriated - - 868,461 - (868,461) - - - - - - -Special reserve appropriated - - - 60,653 (60,653) - - - - - - -Cash dividends of ordinary share - - - - (4,426,671) (4,426,671) - - - - - (4,426,671)
Cash dividends from capital surplus - (885,334) - - - - - - - - - (885,334)Changes in ownership interests in subsidiaries - 22 - - (658) (658) - - - - - (636)Changes in equity of associates and joint ventures accounted for using equity method - 1,723 - - (10,527) (10,527) - - - - - (8,804)Share-based payments transaction (31,500) (40,846) - - 3,671 3,671 - - 442,104 442,104 - 373,429Adjustments of capital surplus for the Company's cash dividends received by
subsidiaries - 60,048 - - - - - - - - - 60,048Retirement of treasury share (438,160) (194,977) - - (210,355) (210,355) - - - - 843,492 -Balance on December 31, 2016 $ 44,241,606 11,779,274 17,439,772 3,199,674 34,649,963 55,289,409 1,324,282 (5,663,830) (285,105) (4,624,653) (881,247) 105,804,389
Note:Employees’ compensation amounting to $876,028 and $949,980 and directors’ compensation amounting to $46,323 and $50,234, were recognized in the statements of comprehensive income for the years ended December 31, 2016 and 2015, respectively.
See accompanying notes to the parent-company-only financial reports.

7
COMPAL ELECTRONICS, INC.
Statements of Cash Flows
For the years ended December 31, 2016 and 2015
(Expressed in Thousands of New Taiwan Dollars)
2016 2015
Cash flows from (used in) operating activities:Profit before tax $ 9,371,746 10,162,890Adjustments:
Depreciation and amortization 609,655 698,496Increase in allowances for uncollectible accounts 714,682 27,627Finance costs 719,294 604,735Interest income (119,754) (153,268)Dividend income (133,485) (170,537)Compensation cost arising from share-based payment transaction 373,429 400,262Share of profit of subsidiaries, associates and joint ventures accounted for using equity method (3,766,213) (2,413,800)Gain on disposal of investments - (405,885)Impairment loss on financial assets 13,403 32,000
Adjustments to reconcile profit (1,588,989) (1,380,370)Changes in operating assets and liabilities:
Changes in operating assets:Changes in financial assets at fair value through profit or loss - 114,111Decrease (increase) in notes and accounts receivable (15,775,684) 19,681,148Decrease (increase) in other receivable 175,486 (150,363)Decrease (increase) in inventories (2,624,036) 16,183,878Decrease (increase) in other current assets 144,401 (80,932)
Total changes in operating assets (18,079,833) 35,747,842Changes in operating liabilities:
Increase (decrease) in notes and accounts payable 20,079,788 (49,432,576)Increase (decrease) in other payables (1,220,679) 807,475Increase (decrease) in provisions (502,427) 358,492Increase (decrease) in unearned revenue 26,584 (546,111)Increase (decrease) in other current liabilities 498,132 (216,920)Others (9,738) (26,483)
Total changes in operating liabilities 18,871,660 (49,056,123)Total changes in operating assets and liabilities 791,827 (13,308,281)
Total adjustments (797,162) (14,688,651)Cash flows from (used in) operations 8,574,584 (4,525,761)Interest received 110,209 160,900Dividends received 359,324 900,359Interest paid (730,294) (588,159)Income taxes paid (2,097,820) (240,077)Net cash flows from (used in) operating activities 6,216,003 (4,292,738)
Cash flows from (used in) investing activities:Redemption from bond investment without active market 350,000 350,000Acquisition of investments accounted for using equity method and available-for-sale financial assets (303,702) (1,023,451)Proceeds from disposal of investments accounted for using equity method and available-for sale
financing assets - 1,489,852Proceeds from capital reduction and liquidation of investments 25,630 51,520Acquisition of property, plant and equipment (159,703) (153,958)Decrease (Increase) in other receivables due from related parties (20,939) 27,733Acquisition of intangible assets (290,200) (470,768)Others (11,811) 17,144Net cash flows from (used in) investing activities (410,725) 288,072
Cash flows from (used in) financing activities:Increase (decrease) in short-term borrowings 8,356,550 (6,580,500)Proceeds from long-term borrowings 23,515,000 12,770,000Repayments of long-term borrowings (19,770,000) (7,840,000)Cash dividends paid (5,312,005) (6,643,171)Others - 152Net cash flows from (used in) financing activities 6,789,545 (8,293,519)
Net increase (decrease) in cash and cash equivalents 12,594,823 (12,298,185)Cash and cash equivalents at beginning of period 30,797,312 43,095,497Cash and cash equivalents at end of period $ 43,392,135 30,797,312
See accompanying notes to the parent-company-only financial reports.

8
COMPAL ELECTRONICS, INC.
Notes to Financial Statements
For the years ended December 31, 2016 and 2015
(Expressed in Thousands of New Taiwan Dollars, Unless Otherwise Specified)
(1) Company history
Compal Electronics, Inc. (the “Company”) was incorporated in June 1984 as a company limited by sharesand registered under the Ministry of Economic Affairs, R.O.C. The address of the Company’s registeredoffice is No.581 and No. 581-1, Ruiguang Rd., Neihu Dist., Taipei City, Taiwan. In accordance withArticle 19 of the Business Mergers and Acquisitions Act, the Company merged its subsidiary, CompalCommunications, Inc. (“CCI”) (the “Merger”), pursuant to the resolutions of the Board of Directors inNovember, 2013. The Company was the surviving company and CCI was the dissolved company. The
effective date of the Merger was February 27, 2014. The Company primarily is involved in themanufacture and sale of notebook personal computers (“ notebook PCs” ), monitors, LCD TVs, mobilephones, and various components and peripherals.
(2) Approval date and procedures of the financial statements:
The accompanying parent-company-only financial reports were authorized for issuance by the Board ofDirectors and issued on March 28, 2017.
(3) New standards, amendments and interpretations adopted:
(a) Impact of the International Financial Reporting Standards ("IFRSs") endorsed by the FinancialSupervisory Commission, R.O.C. ("FSC") but not yet in effect
According to Ruling No. 1050026834 issued on July 18, 2016, by the FSC, public entities arerequired to conform to the IFRSs which were issued by the International Accounting StandardsBoard (IASB) before January 1, 2016, and were endorsed by the FSC on January 1, 2017 inpreparing their financial statements. The related new standards, interpretations and amendments areas follows:
New, Revised or Amended Standards and InterpretationsEffective date per
IASBAmendments to IFRS 10, IFRS 12 and IAS 28 "Investment Entities: Applyingthe Consolidation Exception"
January 1, 2016
Amendments to IFRS 11 "Accounting for Acquisitions of Interests in JointOperations"
January 1, 2016
IFRS 14 "Regulatory Deferral Accounts" January 1, 2016
Amendment to IAS 1 "Disclosure Initiative" January 1, 2016
Amendments to IAS 16 and IAS 38 "Clarification of Acceptable Methods ofDepreciation and Amortization"
January 1, 2016
Amendments to IAS 16 and IAS 41 "Agriculture: Bearer Plants" January 1, 2016
Amendments to IAS 19 "Defined Benefit Plans: Employee Contributions" July 1, 2014
(Continued)

9
COMPAL ELECTRONICS, INC.
Notes to Financial Statements
New, Revised or Amended Standards and InterpretationsEffective date per
IASBAmendment to IAS 27 "Equity Method in Separate Financial Statements" January 1, 2016
Amendments to IAS 36 "Recoverable Amount Disclosures for Non-FinancialAssets"
January 1, 2014
Amendments to IAS 39 "Novation of Derivatives and Continuation of HedgeAccounting"
January 1, 2014
Annual improvements cycles 2010-2012 and 2011-2013 July 1, 2014
Annual improvements cycle 2012-2014 January 1, 2016
IFRIC 21 "Levies" January 1, 2014
Except for the following items, the Company believes that the adoption of the above IFRSs wouldnot have a material impact on the parent-company-only financial statements:
1. Amendments to IAS 36 "Recoverable Amount Disclosures for Non Financial Assets"
Under the amendments, the recoverable amount is required to be disclosed only when animpairment loss has been recognized or reversed. In such cases, the amendments also requirethat the following be disclosed if the recoverable amount is based on fair value less costs ofdisposal:
1) the level of the fair value hierarchy within which the fair value measurement iscategorized; and
2) the valuation technique(s) used for fair value measurements categorized within Levels 2and 3 of the fair value hierarchy, and the key valuation assumptions made.
The Company expects the aforementioned amendments will result in a broader disclosure ofthe recoverable amount for non-financial assets.
(b) Newly released or amended standards and interpretations not yet endorsed by the FSC
The following is a summary of the new standards and amendments issued by the IASB but not yetendorsed by the FSC. The FSC announced that the Company should apply IFRS 9 and IFRS 15starting January 1, 2018. As of the date the Company’s financial statements were issued, the FSChas yet to announce the effective dates of the other IFRSs.
New, Revised or Amended Standards and InterpretationsEffective date
per IASBIFRS 9 "Financial Instruments" January 1, 2018
Amendments to IFRS 10 and IAS 28 "Sale or Contribution of Assets Between anInvestor and Its Associate or Joint Venture"
Effective date tobe determined byIASB
IFRS 15 "Revenue from Contracts with Customers" January 1, 2018
IFRS 16 "Leases" January 1, 2019
(Continued)

10
COMPAL ELECTRONICS, INC.
Notes to Financial Statements
New, Revised or Amended Standards and InterpretationsEffective date
per IASBAmendment to IFRS 2 "Clarifications of Classification and Measurement ofShare-based Payment Transactions"
January 1, 2018
Amendment to IFRS 15 "Clarifications of IFRS 15" January 1, 2018
Amendment to IAS 7 "Disclosure Initiative" January 1, 2017
Amendment to IAS 12 "Recognition of Deferred Tax Assets for UnrealizedLosses"
January 1, 2017
Amendments to IFRS 4 "Insurance Contracts" (Applicable for IFRS 9 "FinancialInstruments" and IFRS 4 "Insurance Contracts")
January 1, 2018
Annual Improvements to IFRS Standards 2014-2016 Cycle:
IFRS 12 "Disclosure of Interests in Other Entities" January 1, 2017
IFRS 1 "First-time Adoption of International Financial Reporting Standards"and IAS 28 "Investments in Associates and Joint Ventures"
January 1, 2018
IFRIC 22 "Foreign Currency Transactions and Advance Consideration" January 1, 2018
Amendments to IAS 40 "Investment Property" January 1, 2018
The Company is still currently determining the potential impact of the standards listed below:
Issuance / ReleaseDates Standards or Interpretations Content of amendment
May 28, 2014April 12, 2016
IFRS 15 "Revenue fromContracts with Customers"
IFRS 15 establishes a five-step model forrecognizing revenue that applies to allcontracts with customers, and will supersedeIAS 18 "Revenue," IAS 11 "ConstructionContracts," and a number of revenue-relatedinterpretations.
Final amendments issued on April 12, 2016,clarify how to (i) identify performanceobligations in a contract; (ii) determinewhether a company is a principal or an agent;(iii) account for a license for intellectualproperty (IP); and (iv) apply transitionrequirements.
(Continued)

11
COMPAL ELECTRONICS, INC.
Notes to Financial Statements
Issuance / ReleaseDates Standards or Interpretations Content of amendment
November 19, 2013July 24, 2014
IFRS 9 "Financial Instruments" The standard will replace IAS 39 "FinancialInstruments: Recognition and Measurement",and the main amendments are as follows:
‧ Classification and measurement: Financialassets are measured at amortized cost, fairvalue through profit or loss, or fair valuethrough other comprehensive income,based on both the entity’s business modelfor managing the financial assets and thefinancial assets’ contractual cash flowcharacteristics. Financial liabilities aremeasured at amortized cost or fair valuethrough profit or loss. Furthermore, there isa requirement that "own credit risk"adjustments be measured at fair valuethrough other comprehensive income.
‧Impairment: The expected credit loss modelis used to evaluate impairment.
‧Hedge accounting: Hedge accounting is moreclosely aligned with risk managementactivities, and hedge effectiveness ismeasured based on the hedge ratio.
January 13, 2016 IFRS 16 "Leases" The new standard of accounting for lease isamended as follows:
‧For a contract that is, or contains, a lease, thelessee shall recognize a right-of-use assetand a lease liability in the balance sheet. Inthe statement of profit or loss and othercomprehensive income, a lessee shallpresent interest expense on the leaseliability separately from the depreciationcharge for the right-of use asset during thelease term.
‧A lessor classifies a lease as either a financelease or an operating lease, and therefore,the accounting remains similar to IAS 17.
The Company is evaluating the impact on its financial position and financial performance of theinitial adoption of the above-mentioned standards or interpretations. The results thereof will bedisclosed when the Company completes its evaluation.
(Continued)

12
COMPAL ELECTRONICS, INC.
Notes to Financial Statements
(4) Summary of significant accounting policies:
The significant accounting policies presented in the parent-company-only financial statements aresummarized as follows. Except for those specifically mentioned, the following accounting policies wereapplied consistently throughout the presented periods in the financial statements.
(a) Statement of compliance
These parent-company-only financial statements have been prepared in accordance with theRegulations Governing the Preparation of Financial Reports by Securities Issuers.
(b) Basis of preparation
(i) Basis of measurement
Except for the following significant accounts in the statement of financial position, the parent-company-only financial statements have been prepared on the historical cost basis:
1) Financial instruments (including derivative financial instruments) measured at fair valuethrough profit or loss are measured at fair value;
2) Available-for-sale financial assets are measured at fair value;
3) The defined benefit asset (or liability) is recognized as plan assets less the present valueof the defined benefit obligation and the effect of the asset ceiling mentioned in note(4)(r).
(ii) Functional and presentation currency
The functional currency of the Company is determined based on the primary economicenvironment in which the Company operates. The parent-company-only financial statementsare presented in New Taiwan Dollar, which is the Company’ s functional currency. Allfinancial information presented in New Taiwan Dollar has been rounded to the nearestthousand.
(c) Foreign currency
(i) Foreign currency transaction
Transactions in foreign currencies are translated to the respective functional currencies of theCompany at exchange rates at the dates of the transactions. Monetary assets and liabilitiesdenominated in foreign currencies at the reporting date are retranslated to the functionalcurrency at the exchange rate at that date. The foreign currency gain or loss on monetary itemsis the difference between the amortized cost in the functional currency at the beginning of theyear adjusted for the effective interest and payments during the period, and the amortized costin foreign currency translated at the exchange rate at the reporting date.
Non-monetary assets and liabilities denominated in foreign currencies that are measured at fairvalue are retranslated to the functional currency at the exchange rate at the date that the fairvalue was determined. Non-monetary items in a foreign currency that are measured based onhistorical cost are translated using the exchange rate at the date of translation.
(Continued)

13
COMPAL ELECTRONICS, INC.
Notes to Financial Statements
Foreign currency differences arising on retranslation are recognized in profit or loss, except forthe following differences which are recognized in other comprehensive income arising on theretranslation:
1) available-for-sale financial assets;
2) a financial liability designated as a hedge of the net investment in a foreign operation tothe extent that the hedge is effective; or
3) qualifying cash flow hedges to the extent the hedge is effective
(ii) Foreign operations
The assets and liabilities of foreign operations, including goodwill and fair value adjustmentsarising on acquisition, are translated to the Company’s functional currency at exchange rates ofthe reporting date. The income and expenses of foreign operations, excluding foreignoperations in hyperinflationary economies, are translated to the Company’ s functionalcurrency at average rate. Foreign currency differences are recognized in other comprehensiveincome, and presented in the foreign currency translation differences in equity.
When a foreign operation is disposed of such that control, significant influence or joint controlis lost, the cumulative amount in the translation reserve related to that foreign operation isreclassified to profit or loss as part of the gain or loss on disposal. When the Companydisposes of any part of its interest in a subsidiary that includes a foreign operation whileretaining control, the relevant proportion of the cumulative amount is reattributed to non-controlling interest. When the Company disposes of only part of investment in an associate ofjoint venture that includes a foreign operation while retaining significant or joint control, therelevant proportion of the cumulative amount is reclassified to profit or loss.
When the settlement of a monetary item receivable from or payable to a foreign operation isneither planed nor likely in the foreseeable future, foreign currency gains and losses arisingfrom such items are considered to form part of a net investment in the foreign operation andare recognized in other comprehensive income, and presented in the translation reserve inequity.
(d) Classification of current and non-current assets and liabilities
An entity shall classify an asset as current when:
(i) It expects to realize the asset, or intends to sell or consume it, in its normal operating cycle;
(ii) It holds the asset primarily for the purpose of trading;
(iii) It expects to realize the asset within twelve months after the reporting period; or
(iv) The asset is cash and cash equivalent unless the asset is restricted from being exchanged orused to settle a liability for at least twelve months after the reporting period.
An entity shall classify all other assets as non-current.
(Continued)

14
COMPAL ELECTRONICS, INC.
Notes to Financial Statements
An entity shall classify a liability as current when:
(i) It expects to settle the liability in its normal operating cycle;
(ii) It holds the liability primarily for the purpose of trading;
(iii) The liability is due to be settled within twelve months after the reporting period; or
(iv) It does not have an unconditional right to defer settlement of the liability for at least twelvemonths after the reporting period. Terms of a liability that could, at the option of thecounterparty, result in its settlement by the issue of equity instruments do not impact itsclassification.
An entity shall classify all other liabilities as non-current.
(e) Cash and cash equivalents
Cash comprise cash on hand and demand deposits. Cash equivalents are subject to an insignificantrisk of changes in their fair value, and are used by the Company in the management of its short-termcommitments.
The time deposits which meet the above definition and are held for the purpose of meeting short-term cash commitments rather than for investment or other purposes are reclassified as cashequivalents.
(f) Financial instruments
Financial assets and financial liabilities are initially recognized when the Company becomes a partyto the contractual provisions of the instruments.
(i) Financial assets
The Company classifies financial assets into the following categories: financial assets at fairvalue through profit or loss, loans and receivables, and available-for-sale financial assets.
1) Financial assets at fair value through profit or loss
A financial asset is classified in this category if it is classified as held-for-trading or isdesignated as such on initial recognition. Financial assets are classified as held-for-trading if they are acquired principally for the purpose of selling in the short term. TheCompany designates financial assets, other than ones classified as held-for-trading, as atfair value through profit or loss at initial recognition under one of the followingsituations:
a) Designation eliminates or significantly reduces a measurement or recognitioninconsistency that would otherwise arise;
b) Performance of the financial asset is evaluated on a fair value basis
c) A hybrid instrument contains one or more embedded derivatives.
(Continued)

15
COMPAL ELECTRONICS, INC.
Notes to Financial Statements
Financial assets in this category are measured at fair value at initial recognition.Attributable transaction costs are recognized in profit or loss as incurred. Financialassets at fair value through profit or loss are measured at fair value, and changes therein,which take into account any dividend and interest income, are recognized in profit orloss, and are included in non-operating income and expenses. Under a regular way,purchase or sale of financial assets shall be recognized and derecognized as applicableusing trade-date accounting.
2) Available-for sale financial assets
Available-for-sale financial assets are non-derivative financial assets that are designatedas available-for-sale or are not classified in any of the other categories of financial assets.Available-for-sale financial assets are recognized initially at fair value, plus, any directlyattributable transaction cost. Subsequent to initial recognition, they are measured at fairvalue, and changes therein, other than impairment losses, interest income calculatedusing the effective interest method, dividend income, and foreign currency differences onavailable-for-sale debt instruments, are recognized in other comprehensive income andpresented in the fair value reserve in equity. When an investment is derecognized, thegain or loss accumulated in equity is reclassified to profit or loss, and is included in non-operating income and expenses. A regular way purchase or sale of financial assets shallbe recognized and derecognized as applicable using trade-date accounting.
Investments in equity instruments that do not have a quoted market price in an activemarket, and whose fair value cannot be reliably measured, are measured at cost lessimpairment losses, and are included in financial assets measured at cost.
Dividend income is recognized in profit or loss on the date that the Company’s right toreceive payment is established, which in the case of quoted securities is normally on thedate the shareholders’ meeting approved the earning distribution. Such dividend incomeis included in non-operating income and expenses.
3) Loans and receivables
Loans and receivables are financial assets with fixed or determinable payments that arenot quoted in an active market. Loans and receivables comprise trade receivables, otherreceivables, and investment in debt security with no active market. Such assets arerecognized initially at fair value, plus, any directly attributable transaction costs.Subsequent to initial recognition, loans and receivables are measured at amortized costusing the effective interest method, less, any impairment losses other than insignificantinterest on short-term receivables. Under a regular way, purchase or sale of financialassets shall be recognized and derecognized as applicable using trade-date accounting.
Interest income is recognized in profit or loss, and it is included in non-operating incomeand expenses.
(Continued)

16
COMPAL ELECTRONICS, INC.
Notes to Financial Statements
4) Impairment of financial assets
A financial asset is impaired if, and only if, there is an objective evidence of impairmentas a result of one or more events that occurred after the initial recognition of the asset (a“loss event”) and that loss event (or events) has an impact on the estimated future cashflows of the financial asset that can be estimated reliably.
The objective evidence that financial assets are impaired includes default or delinquencyby a debtor, restructuring of an amount due to the Company on terms that the Companywould not consider otherwise, indications that a debtor or issuer will enter bankruptcy,adverse changes in the payment status of borrowers or issuers, economic conditions thatcorrelate with defaults, or the disappearance of an active market for a security. Inaddition, for an investment in an equity security, a significant or prolonged decline in itsfair value below its cost is accounted for as objective evidence of impairment.
All individually significant receivables are assessed for specific impairment. Receivablesthat are not individually significant are collectively assessed for impairment by groupingtogether assets with similar risk characteristics. In assessing collective impairment, theCompany uses historical trends of the probability of default, the timing of recoveries, andthe amount of loss incurred, adjusted for management’s judgment as to whether currenteconomic and credit conditions are such that the actual losses are likely to be greater orlesser than those suggested by historical trends.
An impairment loss in respect of a financial asset measured at amortized cost iscalculated as the difference between its carrying amount and the present value of theestimated future cash flows discounted at the asset’s original effective interest rate.
An impairment loss in respect of a financial asset measured at cost is calculated as thedifference between its carrying amount and the present value of the estimated future cashflows discounted at the current market rate of return for a similar financial asset. Suchimpairment loss is not reversible in subsequent periods.
An impairment loss in respect of a financial asset is deducted from the carrying amount,except for trade receivables, for which an impairment loss is reflected in an allowanceaccount against the receivables. When it is determined a receivable is uncollectible, it iswritten off from the allowance account. Any subsequent recovery of receivable writtenoff is recorded in the allowance account. Changes in the amount of the allowanceaccount are recognized in profit or loss.
Impairment losses on available-for-sale financial assets are recognized by reclassifyingthe losses accumulated in the fair value reserve in equity to profit or loss.
If, in a subsequent period, the amount of the impairment loss of a financial assetmeasured at amortized cost decreases and the decrease can be related objectively to anevent occurring after the impairment was recognized, the decrease in impairment loss isreversed through profit or loss to the extent that the carrying value of the asset does notexceed its amortized cost before impairment was recognized at the reversal date.
(Continued)

17
COMPAL ELECTRONICS, INC.
Notes to Financial Statements
Impairment losses recognized on an available-for-sale equity security are not reversedthrough profit or loss. Any subsequent recovery in the fair value of an impairedavailable-for-sale equity security is recognized in other comprehensive income andaccumulated in other equity.
Impairment losses and recoveries are recognized in profit or loss. Recovery and loss ondoubtful debts of account receivables is included in operating expense, others areincluded in non-operating income and expense.
5) Derecognition of financial assets
The Company derecognizes financial assets when the contractual rights of the cashinflow from the asset are terminated, or when the Company transfers substantially all therisks and rewards of ownership of the financial assets.
On derecognition of a financial asset in its entirety, the difference between the carryingamount and the sum of the consideration received or receivable and any cumulative gainor loss that had been recognized in other comprehensive income and presented in otherequity – unrealized gains or losses from available-for-sale financial assets is recognizedin profit or loss, and included in non-operating income or expenses.
The Company separates the part that continues to be recognized and the part that isderecognized based on the relative fair values of those parts on the date of the transfer.The difference between the carrying amount allocated to the part derecognized and thesum of the consideration received for the part derecognized and any cumulative gain orloss allocated to it that had been recognized in other comprehensive income shall berecognized in profit or loss, and is included in non-operating income or expenses. Acumulative gain or loss that had been recognized in other comprehensive income isallocated between the part that continues to be recognized and the part that isderecognized based on the relative fair values of those parts.
(ii) Financial liabilities and equity instruments
1) Classification of debt or equity
Debt or equity instruments issued by the Company are classified as financial liabilities orequity in accordance with the substance of the contractual agreement.
Equity instruments refer to surplus equities of the assets after the deduction of all thedebts for any contracts. Equity instruments issued are recognized as the amount ofconsideration received, less, the direct cost of issuing.
Interest and loss or gain related to financial liabilities are recognized as profit or loss andare reported under non-operating income and expenses. Financial liabilities arereclassified as equity when converted, and conversions do not generate profit or loss.
(Continued)

18
COMPAL ELECTRONICS, INC.
Notes to Financial Statements
2) Financial liabilities at fair value through profit or loss
A financial liability is classified in this category if acquired principally for the purpose ofselling in the short term. This type of financial liability is measured at fair value at thetime of initial recognition, and attributable transaction costs are recognized in profit orloss as incurred. Financial liabilities at fair value through profit or loss are measured atfair value, and changes therein, which take into account any interest expense, arerecognized in profit or loss, and are included in non-operating income or expenses.
3) Other financial liabilities
Financial liabilities not classified as held-for-trading or designated as at fair valuethrough profit or loss, which comprise loans and borrowings, and trade and otherpayable, are measured at fair value, plus, any directly attributable transaction cost at thetime of initial recognition. Subsequent to initial recognition, they are measured atamortized cost calculated using the effective interest method other than significantinterest on short-term loans and payables. Interest expense not capitalized as capital costis recognized in profit or loss, and is included in non-operating income or expenses.
4) Derecognition of financial liabilities
The Company derecognizes a financial liability when its contractual obligation has beendischarged, cancelled or expired. The difference between the carrying amount of afinancial liability removed and the consideration paid (including any non-cash assetstransferred or liabilities assumed) is recognized in profit or loss, and is included in non-operating income or expenses.
5) Offsetting of financial assets and liabilities
The Company presents financial assets and liabilities on a net basis when the Companyhas the legally enforceable right to offset and intends to settle such financial assets andliabilities on a net basis or to realize the assets and settle the liabilities simultaneously.
(iii) Derivative financial instruments, including hedge accounting
The Company holds derivative financial instruments to hedge its foreign currency and interestrate exposures. Derivatives are recognized initially at fair value and attributable transactioncosts are recognized in profit or loss as incurred. Subsequent to initial recognition, derivativesare measured at fair value, and changes therein are recognized in profit or loss, and areincluded in non-operating income and expenses.
When a derivative is designated as a hedging instrument, its timing of recognition in profit orloss is determined based on the nature of the hedging relationship. When the fair value of aderivative instrument is positive, it is classified as a financial asset, and when the fair value isnegative, it is classified as a financial liability.
(Continued)
19
COMPAL ELECTRONICS, INC.
Notes to Financial Statements
For derivatives that are linked to investments in equity instruments that do not have a quotedmarket price in an active market and must be settled by delivery of such unquoted equityinstruments, such derivatives that are classified as financial assets are measured at amortizedcost, and are included in financial assets measured at cost; and such derivatives that areclassified as financial liabilities are measured at cost, and are included in financial liabilitiesmeasured at cost.
Embedded derivatives are separated from the host contract and accounted for separately whenthe economic characteristics and risk of the host contract and the embedded derivatives are notclosely related, and the host contract is measured as at fair value through profit or loss.
(g) Inventories
Inventories are measured at the lower of cost and net realizable value. The cost of inventories isbased on the weighted-average-cost principle and includes expenditure incurred in acquiring theinventories, production or transition costs, and other costs incurred in bringing them to their existinglocation and condition. In the case of manufactured inventories and work in progress, cost includesan appropriate share of production overheads based on normal operating capacity.
Net realizable value is the estimated selling price in the ordinary course of business, less, theestimated costs of completion and selling expenses.
(h) Non-current assets held for sale
When non-current assets are expected to be recovered primarily through sale rather than throughcontinuing use are reclassified as held for sale. And it is available for immediate sale in its presentcondition subject only to terms that are usual and customary for the sale. The sale is highly probableand shall take place within one year. Those classified as non-current assets held for sale aremeasured at the lower of their carrying value or fair value less costs to sell. An entity shallrecognize an impairment loss for write-downs of non-current assets held for sale to fair value lesscosts to sell in the statements of income. If the fair value less costs to sell increases later on, a gainfrom such subsequent increase shall be recognized in the statements of income, but not in excess ofthe cumulative impairment loss that has been recognized. When the assets classified as held for sale,those assets are no longer amortized or depreciated, and any equity-accounted investee is no longerequity accounted.
(i) Investment in associates
Associates are those entities in which the Company has significant influence, but not control, overthe financial and operating policies.
Investments in associates are accounted for using the equity method and are recognized initially atcost. The cost of the investment includes transaction costs. The carrying amount of the investmentin associates includes goodwill arising from the acquisition, less, any accumulated impairmentlosses.
(Continued)

20
COMPAL ELECTRONICS, INC.
Notes to Financial Statements
The parent-company-only financial statements include the Company’s share of the profit or loss andother comprehensive income of equity-accounted investees after adjustments to align the accountingpolicies with those of the Company from the date that significant influence commences until the datethat significant influence ceases. When changes in an associate’s equity are not recognized in profitor loss or other comprehensive income of the associate and such changes do not affect the Company’s ownership percentage of the associate, the Company recognizes the changes in ownership interestsof its associate in capital surplus in proportion to its ownership.
Unrealized profits resulting from the transactions between the Company and an associate areeliminated to the extent of the Company’s interest in the associate. Unrealized losses on transactionswith associates are eliminated in the same way, except to the extent that the underlying asset isimpaired.
When the Company’s share of losses exceeds its interest in associates, the carrying amount of theinvestment, including any long-term interests that form part thereof, is reduced to zero, and therecognition of further losses is discontinued except to the extent that the Company has an obligationor has made payments on behalf of the investee.
When the Company subscribes to additional shares in an associate at a percentage different from itsexisting ownership percentage, the resulting carrying amount of the investment differs from theamount of the Company’ s proportionate interest in the net assets of the associate. The Companyrecords such a difference as an adjustment to investments with the corresponding amount charged orcredited to capital surplus, however, when the balance of the capital surplus arising from theinvestment was insufficient, the difference charged or credited to retained earnings. If the Company’s ownership interest is reduced due to the additional subscription to the shares of associate by otherinvestors, the proportionate amount of the gains or losses previously recognized in othercomprehensive income in relation to that associate shall be reclassified to profit or loss on the samebasis as would be required if the associate had directly disposed of the related assets or liabilities.
(j) Investment in subsidiaries
When preparing the parent-company-only financial statements, investment in subsidiaries which arecontrolled by the Company is accounted for using the equity method. Under the equity method, theamounts of net income, other comprehensive income and equity attributable to shareholders of theCompany in the parent-company-only financial statement are equal to those in the consolidatedfinancial statements.
Changes in the Company’s ownership interest in a subsidiary that do not result in a loss of controlare accounted for as equity transactions
(k) Property, plant and equipment
(i) Recognition and measurement
Items of property, plant and equipment are measured at cost less accumulated depreciation andaccumulated impairment losses. Cost includes expenditure that is directly attributed to theacquisition of the asset. The cost of the software is capitalized as part of the property, plantand equipment if the purchase of the software is necessary for the property, plant andequipment to be capable of operating.
(Continued)

21
COMPAL ELECTRONICS, INC.
Notes to Financial Statements
Each part of an item of property, plant and equipment with a cost that is significant in relationto the total cost of the item shall be depreciated separately, unless the useful life and thedepreciation method of a significant part of an item of property, plant and equipment are thesame as the useful life and depreciation method of another significant part of that same item.
The gain or loss arising from the derecognition of an item of property, plant and equipmentshall be determined as the difference between the net disposal proceeds, if any, and thecarrying amount of the item, and it shall be recognized under non-operating income andexpenses.
(ii) Subsequent cost
Subsequent expenditure is capitalized only when it is probable that the future economicbenefits associated with the expenditure will flow to the Company. The carrying amount ofthose parts that are replaced is derecognized. Ongoing repairs and maintenance are expensed asincurred.
(iii) Depreciation
The depreciable amount of an asset is determined after deducting its residual amount, and itshall be allocated on a systematic basis over its useful life. Items of property, plant andequipment with the same useful life may be grouped in determining the depreciation charge.The remainder of the items may be depreciated separately. The depreciation charge for eachperiod shall be recognized in profit or loss.
The depreciable amount of a leased asset is allocated to each accounting period during theperiod of expected use on a systematic basis consistent with the depreciation policy the lesseeadopts for depreciable assets that are owned. If there is reasonably certainty that the lesseewill obtain ownership by the end of the lease term, the period of expected use is the useful lifeof the asset; otherwise, the asset is depreciated over the shorter of the lease term and its usefullife.
Land has an unlimited useful life and therefore is not depreciated.
The estimated useful lives for the current and comparative years of significant items ofproperty, plant and equipment are as follows:
1) Buildings: 35~50 years
2) Building improvement: 8~15 years
3) Research equipment: 3 years
4) Other equipment: 0.5~5 years
Depreciation methods, useful lives, and residual values are reviewed at each reporting date. Ifexpectations differ from the previous estimates, the change is accounted for as a change in anaccounting estimate.
(Continued)

22
COMPAL ELECTRONICS, INC.
Notes to Financial Statements
(l) Leases
(i) The Company as lessor
Lease income from operating lease is recognized in income on a straight-line basis over thelease term. Initial direct costs incurred in negotiating and arranging an operating lease areadded to the carrying amount of the leased asset and recognized as an expense over the leaseterm on the same basis as the lease income. Incentives granted to the lessee to enter into theoperating lease are spread over the lease term on a straight-line basis so that the lease incomereceived is reduced accordingly.
(ii) The Company as lessee
Operating leases are not recognized in the Company’s balance sheets.
Payments made under operating lease (excluding insurance and maintenance expenses) arerecognized in profit or loss on a straight-line basis over the term of the lease. Lease incentivesreceived are recognized as an integral part of the total lease expense, over the term of the lease.
(m) Intangible assets
(i) Goodwill
1) Initial recognition
Goodwill arising from acquisition of subsidiaries is included in intangible assets. Themeasurement of initial recognition of goodwill, please refer to note (4)(u).
2) Subsequent measurement
Goodwill is measured at cost less accumulated impairment losses.
Goodwill related to an investment accounted for using equity method is included in thecarrying amount of the investment, and not allocated to any asset, including goodwill,forms part of the carrying amount of the investment accounted for using the equitymethod.
(ii) Research & Development
During the research phase, activities are carried out to obtain and understand new scientific ortechnical knowledge. Expenditures during this phase are recognized in profit or loss asincurred.
Expenditures arising from the development phase shall be recognized as an intangible asset ifall the conditions described below can be demonstrated; otherwise, they will be recognized inprofit or loss as incurred.
(Continued)

23
COMPAL ELECTRONICS, INC.
Notes to Financial Statements
1) The technical feasibility of completing the intangible asset so that it will be available foruse or sale.
2) Its intention to complete the intangible asset and use or sell it.
3) Its ability to use or sell the intangible asset.
4) How the intangible asset will generate probable future economic benefits.
5) The availability of adequate technical, financial and other resources to complete thedevelopment and to use or sell the intangible asset.
6) Its ability to measure reliably the expenditure attributable to the intangible asset duringits development.
Capitalized expenditure arising from the development phase is measured at cost lessaccumulated amortization and accumulated impairment losses.
(iii) Other intangible assets
Other intangible assets that are acquired by the Company are measured at cost, lessaccumulated amortization and any accumulated impairment losses.
(iv) Subsequent expenditure
Subsequent expenditure is capitalized only when it increases the future economic benefitsembodied in the specific asset to which it relates. All other expenditure, including expenditureon internally generated goodwill and brands, is recognized in profit or loss as incurred.
(v) Amortization
The amortizable amount is the cost of an asset, or other amount substituted for cost, less itsresidual value.
Amortization is recognized in profit or loss on a straight-line basis over the estimated usefullives of intangible assets, other than goodwill and intangible assets with all indefinite usefullife, from the date that they are available for use. The estimated useful lives for the current andcomparative periods are as follows:
1) Patents: the shorter of contract period and estimated useful lives
2) Computer software: 1~3 years
The residual value, the amortization period, and the amortization method for an intangibleasset with a finite useful life shall be reviewed at least annually at each fiscal year-end. Anychange shall be accounted for as changes in accounting estimates.
(Continued)

24
COMPAL ELECTRONICS, INC.
Notes to Financial Statements
(n) Impairment – non-derivative financial assets
Non-derivative financial assets except for inventories, deferred tax assets, assets arising fromemployee benefits and non-current assets classified as held for sale are assessed at the end of eachreporting period whether there is any indication that an asset may be impaired. If any such indicationexists, the Company shall estimate the recoverable amount of the asset. If it is not possible todetermine the recoverable amount (fair value less cost to sell and value in use) for the individualasset, then the Company will have to determine the recoverable amount for the asset’ s cash-generating unit.
The Company assesses goodwill and intangible assets, which have indefinite useful lives and are notavailable for use, on an annual basis and recognizes an impairment loss on excess of carrying valueover the recoverable amount.
The recoverable amount for an individual asset or a cash-generating unit is the higher of its fairvalue, less costs to sell and its value in use. If, and only if, the recoverable amount of an asset is lessthan its carrying amount, the carrying amount of the asset shall be reduced to its recoverable amount.That reduction is an impairment loss. An impairment loss shall be recognized immediately in profitor loss.
For the purpose of impairment testing, goodwill acquired in a business combination shall, from theacquisition date, be allocated to each of the acquirer’ s cash-generating units, or groups of cash-generating units that are expected to benefit from the synergies of the combination, irrespective ofwhether other assets or liabilities of the acquire are assigned to those units or group of units. If thecarrying amount of the cash-generating units exceeds the recoverable amount of the unit, the entityshall recognize the impairment loss and the impairment loss shall be allocated to reduce the carryingamount of each asset in the unit. Reversal of an impairment loss for goodwill is prohibited.
The Company assesses at the end of each reporting period whether there is any indication that animpairment loss recognized in prior periods for an asset other than goodwill may no longer exist ormay have decreased. An impairment loss recognized in prior periods for an asset other thangoodwill shall be reversed if, and only if, there has been a change in the estimates used to determinethe asset’s recoverable amount since the last impairment loss was recognized. If this is the case, thecarrying amount of the asset shall be increased to its recoverable amount. That increase is a reversalof an impairment loss.
(o) Provisions
A provision is recognized if, as a result of a past event, the Company has a present legal orconstructive obligation that can be estimated reliably, and it is probably that an outflow of economicbenefits will be required to settle the obligation. Provisions are determined by discounting theexpected future cash flows at a pre-tax rate that reflects the current market assessments of the timevalue of money and the risks specific to the liability. The unwinding of the discount is recognized asfinance cost.
(Continued)

25
COMPAL ELECTRONICS, INC.
Notes to Financial Statements
(p) Treasury stock
Repurchased shares are recognized under treasury shares (a contra-equity account) based on itsrepurchase price (including all directly accountable costs), and net of tax. Gains on disposal oftreasury shares should be recognized under Capital Reserve – Treasury Shares Transactions; losseson disposal of treasury shares should be offset against existing capital reserves arising from similartypes of treasury shares. If there are insufficient capital reserves to be offset against, then such lossesshould be accounted for under retained earnings. The carrying amount of treasury shares should becalculated using the weighted average different types of repurchase.
During the cancellation of treasury shares, Capital Reserve – Share Premiums and Share Capitalshould be debited proportionately. Gains on cancellation of treasury shares should be recognizedunder existing capital reserves arising from similar types of treasury shares; losses on cancellation oftreasury shares should be offset against existing capital reserves arising from similar types oftreasury shares. If there are insufficient capital reserves to be offset against, then such losses shouldbe accounted for under retained earnings.
(q) Revenue
Revenue from the sale of goods in the course of ordinary activities is measured at the fair value ofthe consideration received or receivable, net of returns, trade discounts and volume rebates.Revenue is recognized when persuasive evidence exists, usually in the form of an executed salesagreement, that the significant risks and rewards of ownership have been transferred to the customer,recovery of the consideration is probable, the associated costs and possible return of goods can beestimated reliably, there is no continuing management involvement with the goods, and the amountof revenue can be measured reliably. If it is probable that discounts will be granted and the amountcan be measured reliably, then the discount is recognized as a reduction of revenue as the sales arerecognized.
The timing of the transfers of risks and rewards varies depending on the individual terms of the salesagreement.
(r) Employee benefits
(i) Defined contribution plans
Obligations for contributions to defined contribution pension plans are recognized as anemployee benefit expense in profit or loss in the periods during which services are rendered byemployees.
(ii) Defined benefit plans
A defined benefit plan is a post-employment benefit plan other than a defined contributionplan. The Company’s net obligation in respect of defined benefit pension plans is calculatedseparately for each plan by estimating the amount of future benefit that employees have earnedin return for their service in the current and prior periods; that benefit is discounted todetermine its present value. The fair value of any plan assets is deducted. The discount rate isthe yield at the reporting date on government bonds that have maturity dates approximating theterms of the Company’s obligations and that are denominated in the same currency in whichthe benefits are expected to be paid.
(Continued)

26
COMPAL ELECTRONICS, INC.
Notes to Financial Statements
The calculation of defined benefit obligation is performed annually by a qualified actuaryusing the projected unit credit method. When the calculation results in a benefit to theCompany, the recognized asset is limited to the total of the present value of economic benefitsavailable in the form of any future refunds from the plan or reductions in future contributionsto the plan. In order to calculate the present value of economic benefits, consideration is givento any minimum funding requirements that apply to any plan in the Company. An economicbenefit is available to the Company if it is realizable during the life of the plan, or onsettlement of the plan liabilities.
When the benefits of a plan are improved, the portion of the increased benefit relating to pastservice by employees is recognized in profit or loss on a straight-line basis over the averageperiod until the benefits become vested. To the extent that the benefits vest immediately, theexpense is recognized immediately in profit or loss.
Re-measurement of net defined benefit liability (asset) (including actuarial gains, losses andthe return on plan asset and changes in the effect of the asset ceiling, excluding any amountsincluded in net interest) is recognized in other comprehensive income (loss). The effect of re-measurement of the defined benefit plan is charged to retained earnings.
The Company recognizes gains or losses on the curtailment or settlement of a defined benefitplan when the curtailment or settlement occurs. The gain or loss on curtailment comprises anyresulting change in the fair value of plan assets, change in the present value of defined benefitobligation and any related actuarial gains or losses and past service cost that had not previouslybeen recognized.
(iii) Short term employee benefits
Short-term employee benefit obligations are measured on an undiscounted basis and areexpensed as the related service is provided.
A liability is recognized for the amount expected to be paid under short-term cash bonus orprofit-sharing plans if the Company has a present legal or constructive obligation to pay thisamount as a result of past service provided by the employee, and the obligation can beestimated reliably.
(s) Share-based payment
The grant-date fair value of share-based payment awards granted to employee is recognized asemployee expenses, with a corresponding increase in equity, over the period that the employeesbecome unconditionally entitled to the awards. The amount recognized as an expense is adjusted toreflect the number of awards which the related service and non-market performance conditions areexpected to be met, such that the amount ultimately recognized as an expense is based on the numberof award that meet the related service and non-market performance conditions at the vesting date.
For share-based payment awards with non-vesting conditions, the grant-date fair value of the share-based payment is measured to reflect such conditions, and there is no true-up for differencesbetween expected and actual outcomes.
(Continued)

27
COMPAL ELECTRONICS, INC.
Notes to Financial Statements
(t) Income taxes
Income tax expenses include both current taxes and deferred taxes. Except for expenses related tobusiness combinations or recognized directly in equity or other comprehensive income, all currentand deferred taxes shall be recognized in profit or loss.
Current taxes include tax payables and tax deduction receivables on taxable gains (losses) for theyear calculated using the statutory tax rate on the reporting date or the actual legislative tax rate, aswell as tax adjustments related to prior years.
Deferred taxes arise due to temporary differences between the carrying amounts of assets andliabilities for financial reporting purposes and their respective tax bases. Deferred taxes shall not berecognized for the following exceptions:
(i) Assets and liabilities that are initially recognized but are not related to the businesscombination and have no effect on net income or taxable gains (losses) during the transaction.
(ii) Temporary differences arising from equity investments in subsidiaries or joint ventures wherethere is a high probability that such temporary differences will not reverse.
(iii) Initial recognition of goodwill.
Deferred tax assets and liabilities shall be measured at the tax rates that are expected to apply to theperiod when the asset is realized or the liability is settled based on tax rates that have been enactedor substantively enacted by the end of the reporting period.
Deferred tax assets and liabilities may be offset against each other if the following criteria are met:
(i) The entity has the legal right to settle tax assets and liabilities on a net basis; and
(ii) the taxing of deferred tax assets and liabilities fulfill one of the below scenarios:
1) levied by the same taxing authority; or
2) levied by different taxing authorities, but where each such authority intends to settle taxassets and liabilities (where such amounts are significant) on a net basis every year of theperiod of expected asset realization or debt liquidation, or where the timing of assetrealization and debt liquidation is matched.
A deferred tax asset should be recognized for the carry-forward of unused tax losses, unused taxcredits, and deductible temporary differences to the extent that it is probable that future taxableprofit will be available against which the unused tax losses, unused tax credits, and deductibletemporary differences can be utilized. Such unused tax losses, unused tax credits, and deductibletemporary differences shall also be re-evaluated every year on the financial reporting date, and theyshall be adjusted based on the probability that future taxable profit that will be available againstwhich the unused tax losses, unused tax credits, and deductible temporary differences can beutilized.
The 10% surtax on unappropriated earnings is recoded as current tax expense in the following yearafter the resolution to appropriate retained earnings is approved in a stockholders’ meeting.
(Continued)

28
COMPAL ELECTRONICS, INC.
Notes to Financial Statements
(u) Business combination
Goodwill is measured as an aggregation of the consideration transferred (which generally ismeasured at fair value at the acquisition date) and as an amount of any non-controlling interest in theacquiree, net of the acquisition-date amounts of the identifiable assets acquired and liabilitiesassumed (generally at fair value). If the residual balance is negative, the Company shall re-assesswhether it has correctly identified all of the assets acquired and liabilities assumed, and recognize again on the bargain purchase thereafter.
All the transaction costs incurred for the business combination are recognized immediately as theCompany’s expenses when incurred, except for the issuance of debt or equity instruments.
If the business combination is achieved in stages, the Company shall measure any non-controllingequity interest in the acquire, either at fair value or at the non-controlling interest’ s proportionateshare of the acquiree’s identifiable net assets. Other non-controlling interest is measured (1) at fairvalue at the acquisition date or (2) by using other valuation techniques acceptable under the IFRS asendorsed by the FSC.
In a business combination achieved in stages, the Company shall re-measure its previously heldequity interest in the acquiree at its acquisition-date fair value and recognize the resulting gain orloss, if any, in profit or loss. In prior reporting periods, the Company may have recognized changesin the value of its equity interest in the acquiree in other comprehensive income. If so, the amountthat was recognized in other comprehensive income shall be recognized on the same basis as wouldbe required if the Company had disposed directly of the previously held equity interest. If thedisposal of the equity interest required a reclassification to profit or loss, such an amount shall bereclassified to profit or loss.
If the initial accounting for a business combination is incomplete by the end of the reporting periodin which the combination occurs, the Company shall report in its financial statements provisionalamounts for the items for which the accounting is incomplete. During the measurement period, theCompany shall retrospectively adjust the provisional amounts recognized at the acquisition date, orrecognize additional assets or liabilities to reflect new information obtained about facts andcircumstances that existed as of the acquisition date. The measurement period shall not exceed oneyear from the acquisition date.
(v) Earnings per share
The Company discloses the basic and diluted earnings per share attributable to ordinary equityholders of the Company. The calculation of basic earnings per share is based on the profitattributable to the ordinary shareholder of the Company divided by weighted average number ofordinary shares outstanding. The calculation of diluted earnings per share is based on the profitattributable to ordinary shareholders of the Company divided by weighted average number ofordinary shares outstanding after adjustment for the effects of all dilutive potential ordinary shares.Dilutive potential ordinary shares comprise restricted employee stock and employee compensationnot yet approved by the Board of Directors.
(Continued)

29
COMPAL ELECTRONICS, INC.
Notes to Financial Statements
(w) Operating segments
The operating segment information is disclosed within the consolidated financial statements but notdisclosed in the parent-company-only financial statements.
(5) Significant accounting assumptions and judgments, and major sources of estimation uncertainty:
The preparation of the parent-company-only financial statements in conformity with IFRSs endorsed bythe FSC requires management to make judgments, estimates and assumptions that affect the application ofthe accounting policies and the reported amount of assets, liabilities, income and expenses. Actual resultsmay differ from these estimates.
The management continues to monitor the accounting estimates and assumptions. The managementrecognizes any changes in accounting estimates during the period and the impact of those changes inaccounting estimates in the next period.
There are no critical judgments in applying the accounting policies that have significant effect on theamounts recognized in the parent-company-only financial statements. In addition, information aboutassumptions and estimation uncertainties that have a significant risk of resulting in a material adjustmentwithin the next financial year is as follows:
(a) Impairment of account receivable
When there is objective evidence of impairment loss, the Company takes into consideration theestimation of future cash flows. The future cash flows is determined by reference to the customer’spast recovery records, analysis of its current financial position and analysis of the aging of accountreceivable. The amount of the impairment loss is measured as the difference between the asset’ scarrying amount and the present value of estimated future cash flows (excluding possible futurecredit losses) discounted at the financial asset’ s original effective interest rate. Where the actualfuture cash flows are less than expected, a material impairment loss may arise. Refer to note (6)(e)for further description of the impairment of account receivable.
(b) Recognition and measurement of provisions
Because of the sales returns and allowances, the Company records a provision for estimated returnsand other allowances in the same period the related revenue is recorded. The estimate is made basedon historical experience and it could be different from actual sales returns and allowances, therefore,the management periodically reviews the adequacy of the estimation used. Refer to note 6(m) forfurther description of the recognition of provisions.
(c) Valuation of inventories
As inventories are stated at the lower of cost or net realizable value, the net realizable value of theinventory is mainly determined based on assumptions as to future demand within a specific timehorizon. Due to the rapid industrial changes, there may be significant differences in the net realizablevalue of inventories. Refer to note (6)(f) for further description of the valuation of inventories.
(Continued)

30
COMPAL ELECTRONICS, INC.
Notes to Financial Statements
(6) Explanation of significant accounts:
(a) Cash and cash equivalents
December 31,2016
December 31,2015
Cash on hand $ 1,308 1,659
Checking accounts and demand deposits 6,664,502 21,925,414
Time deposits 33,383,621 8,209,439
Bonds purchased under resale agreements 3,342,704 660,800
$ 43,392,135 30,797,312
Please refer to note (6)(x) for the disclosure of the exchange rate risk, the interest rate risk and thefair value sensitivity analysis of the financial assets and liabilities of the Company.
(b) Available-for-sale financial assets
December 31,2016
December 31,2015
Stocks listed in domestic markets (including stocks acquiredvia private placement) $ 4,524,669 4,021,762
Stocks listed in foreign markets 582,303 738,063
Stocks unlisted in domestic markets 1,221,817 1,171,944
Stocks unlisted in foreign markets 69,044 68,872
$ 6,397,833 6,000,641
Current $ 48,631 29,738
Non-current 6,349,202 5,970,903
$ 6,397,833 6,000,641
(i) The Company and its subsidiaries, Zhaopal Investment Co., Ltd. (“ Zhaopal” ), YongpalInvestment Co., Ltd. (“Yongpal”) and Kaipal Investment Co., Ltd. (“Kaipal”) (“the Companyand its subsidiaries” ), purchased newly issued shares of Chunghwa Picture Tubes, Ltd.
(“CPT”) via private placement in 2009. The cost was 2.5 New Taiwan dollars per share, totally
amounting to $7,000,000. The Company signed an agreement with Tatung Company(“Tatung”, the parent company of CPT) on such matter. In accordance with the agreement, theCompany and its subsidiaries have the right to request Tatung to purchase all the CPT sharesobtained via the private placement within certain agreed periods, at the price the Company andits subsidiaries originally paid for the CPT shares plus interest. Accordingly, since the fairvalue of CPT shares obtained via the private placement were below the original costs, theCompany measured the book value of the shares at its original cost.
(Continued)

31
COMPAL ELECTRONICS, INC.
Notes to Financial Statements
The Company filed an arbitration based on the agreement on March 29, 2013, requestingTatung to perform its obligations. The Company received the verdict on May 12, 2014.
According to the verdict, Tatung should pay $2,118,607 to the Company and its subsidiariesfor purchasing all the CPT shares held by the Company and its subsidiaries. Additionally,Tatung should pay the interest which is calculated by the annual rate of 5% in the period fromApril 3, 2013 to the actual payment date. Therefore, the Company recognized both the
impairment loss of $1,689,000 and the related share of loss of associates and joint ventures
accounted for using equity method of $3,041,000 in the first quarter of 2014 accordingly. OnJune 13, 2014, the Company filed a civil complaint with the Taiwan Taipei District Court torevoke the arbitration award. At the end, the Taiwan Supreme Court dismissed the appeal onJanuary 11, 2017. The Company and its subsidiaries sold total shares of CPT to Tatung onFebruary 9, 2017 in accordance with the arbitration. The selling prices of the Company and its
subsidiaries amounted to $811,466 (including the interest) and $1,460,638 (including the
interest), respectively, totaling $2,272,104 (including the interest). The loss of sale was $1,804
and $2,448, respectively, and the total loss was $4,252. The total price has been fullyrecovered.
(ii) Except for the stocks acquired via private placement mentioned above, which are measured atthe arbitration award, if there is an increase (decrease) in the market price of the equitysecurities by 5% on the reporting date, the increase (decrease) in other comprehensive income
(pre-tax) for the years ended December 31, 2016 and 2015, will be $279,342 and $259,482,respectively. These analyses are performed on the same basis for both periods and assume thatall other variables remain the same.
(iii) Parts of the value of the Company’s available-for-sale financial assets declined materially and
permanently; therefore, the Company recognized the impairment losses amounting to $4,604
and $32,000 for the years ended December 31, 2016 and 2015, respectively.
(iv) For the year ended 2015, the Company disposed parts of its available-for-sale financial assets
for $1,489,852, and the gain on disposal amounting to $405,885, was recognized as other gainsand losses.
(v) As of December 31, 2016 and 2015, the Company did not provide any available-for-salefinancial assets as collaterals for its loans.
(c) Financial assets at cost
December 31,2016
December 31,2015
Common stock unlisted in domestic markets $ 2,333 6,588
(i) The aforementioned stock unlisted on domestic markets held by the Company are measured atcost less accumulated impairment losses on the reporting date. The fair values of theseinvestments cannot be measured reliably because the range of reasonable fair value estimates islarge and the probabilities for each estimate cannot be reasonably determined.
(Continued)

32
COMPAL ELECTRONICS, INC.
Notes to Financial Statements
(ii) The value of the financial assets at cost held by the Company has declined, and the impairment
loss recognized in 2016 was $4,255, which was recognized as other gains and losses.
(iii) As of December 31, 2016 and 2015, the Company did not provide any financial assets at costas collaterals for its loans.
(d) Bond investment without active market
December 31,2016
December 31,2015
Common bonds – Taiwan Star Telecom Corporation Limited(“Taiwan Star”) $ 1,050,000 1,400,000
Current $ 350,000 350,000
Non-current 700,000 1,050,000
$ 1,050,000 1,400,000
The Company subscribed a five-year common bond issued by Taiwan Star via private placement for$1,750,000 in June 2014 with an interest rate of 2%. Taiwan star will repay the amount of $350,000per annum from the date of issuance till the maturity of the bond in June 2019.
As of December 31, 2016 and 2015, the Company did not provide the aforementioned financialassets as collaterals for its loans.
(e) Notes and accounts receivable and other receivables
December 31,2016
December 31,2015
Notes receivable $ 133 7,035
Accounts receivable 165,668,300 149,885,714
Other receivables 314,439 553,185
165,982,872 150,445,934
Less: allowance for uncollectible accounts (788,948) (74,266)
$ 165,193,924 150,371,668
Notes and accounts receivable $ 162,701,780 148,844,537
Notes and accounts receivable – related parties $ 2,177,705 973,946
Other receivables – current $ 314,439 553,185
(Continued)

33
COMPAL ELECTRONICS, INC.
Notes to Financial Statements
The aging analysis of accounts receivable and other receivables which were past due but notimpaired was as follows:
December 31,2016
December 31,2015
Overdue 1 to 180 days $ 5,839,244 880,673
Overdue 181 to 365 days - 12,088
$ 5,839,244 892,761
The change of allowance for accounts receivable and other receivables for the years endedDecember 31, 2016 and 2015, were as follows:
Collectively assessed impairment2016 2015
Balance on January 1 74,266 46,639
Impairment loss recognized 714,682 27,627
Balance on December 31 $ 788,948 74,266
Allowance for uncollectible account is the balance of accounts receivable which are uncollectable.Except for evaluating the situation of the customers’ payment records and widely analyzing thecredit rating of customers, the Company also takes all the necessary procedures for collection.Therefore, the Company believes that there is no doubt for the recovery of the due accountsreceivable, therefore, no allowance recognized.
The Company entered into accounts receivable factoring agreements with banks. As of December31, 2016 and 2015, the factoring amount granted by the banks was USD 200,000 thousands and USD2,750,000 thousands, respectively. Based on the agreements, the Company is not responsible forguaranteeing the ability of the accounts receivable obligor to make payment when it is affected bycredit risk. Thus, this is non-recourse accounts receivable factoring. After the transfer of theaccounts receivable, the Company can request partial advanced amount, while the interest calculatedat an agreed rate is paid to the bank in the period during the time of receiving advance and theaccounts receivable is collected. The remaining amounts with no advance are received when theaccounts receivable are settled by the customers. As of December 31, 2016 and 2015, the factoredaccounts receivable with no advance amounting to $0 and $149,428, respectively, are accounted foras other receivables.
The Company, customers, and banks signed the three-party contracts in which the banks purchaseaccounts receivable from the Company. The total amount of the accounts receivable should notexceed the facility limit provided by the banks to the Company’s customers. Based on the contracts,the banks have no right to request the Company to repurchase the accounts receivable. Thus, this is anon-recourse accounts receivable transfer. As of December 31, 2016 and 2015, accounts receivablefactored were fully recovered and derecognized since the conditions of derecognition were met.
(Continued)

34
COMPAL ELECTRONICS, INC.
Notes to Financial Statements
As of December 31, 2016 and 2015, the details of the factored accounts receivable were as follows:
December 31, 2016
Accountsreceivablefactored(gross)
Advancedamount Collateral
Amountderecognized Interest rate
FinancialInstitution $ 27,835,398 27,835,398
-27,835,398
1.19%~1.79488%
December 31, 2015
Accountsreceivablefactored(gross)
Advancedamount Collateral
Amountderecognized Interest rate
FinancialInstitution $ 33,766,041 33,616,613
-33,616,613
0.9405%~1.9403%
(f) Inventories
December 31,2016
December 31,2015
Finished goods $ 2,636,338 3,344,837
Work in progress 32,001 11,304
Raw materials 24,204,321 21,732,807
Raw materials in transit 1,096,351 256,027
$ 27,969,011 25,344,975
(i) During the years ended December 31, 2016 and 2015, inventory cost recognized as cost ofsales amounting to $704,371,443 and $780,260,207, respectively.
(ii) In the year ended December 31, 2016, due to the write-down of inventories to net realizable
value, the Company recognized the inventory valuation loss amounting to $328,895. In theyear ended December 31, 2015, the Company reversed its allowance for inventory valuation
loss amounting to $40,753 due to the sale and disposal of its obsolete inventories.
(iii) As of December 31, 2016 and 2015, the Company did not provide any inventories ascollaterals for its loans.
(Continued)

35
COMPAL ELECTRONICS, INC.
Notes to Financial Statements
(g) Investments accounted for using equity method
A summary of the Company’s financial information for equity-accounted investees at the reportingdate is as follows:
December 31,2016
December 31,2015
Subsidiaries $ 77,812,904 75,513,652
Associates 2,353,659 2,360,316
80,166,563 77,873,968
Plus: Other receivables – related parties 93,954 209
Credit balance of investment in equity method (othernon-current liability) 373,433 139,389
Less: unrealized profits or losses (7,233) (6,804)
$ 80,626,717 78,006,762
(i) Subsidiaries
Please refer to the consolidated financial statement for the years ended December 31, 2016 and2015.
(ii) Associates
1) The fair value of investments in associates of the Company for which there are publicprice quotations were as follow:
December 31,2016
December 31,2015
Allied Circuit Co., Ltd. (“Allied Circuit”) $ 285,432 175,729
Avalue Technology Inc. (“Avalue”) 909,584 924,564
$ 1,195,016 1,100,293
2) For the years ended December 31, 2016 and 2015, the Company’s share of the net gain(loss) of associates was as follows:
2016 2015The Company’s share of the gain (loss) of
associates$ 279,811 169,206
3) The Company’s financial information for investments accounted for using equity methodthat are individually insignificant was as follows:
December 31,2016
December 31,2015
The carrying amount of individually immaterialassociates $ 2,353,659 2,360,316
(Continued)

36
COMPAL ELECTRONICS, INC.
Notes to Financial Statements
The Company’s share of the net income (loss) of associates:
2016 2015Profit from continuing operations $ 279,811 169,206
Other comprehensive income (195,183) 973
Total comprehensive income $ 84,628 170,179
(iii) As of December 31, 2016 and 2015, the Company did not provide any investments accountedfor using equity method as collaterals for its loans.
(h) Business combination
(i) Mactech Co., Ltd. (“Mactech”)
The Company and Mactech signed an agreement of purchasing 51% of Mactech’s equity for
cash amounted to $177,709 through cash injection. The effective date of the aforementionedcash injection was on January 5, 2015, in which the Company started to have control overMactech.
As of the acquisition date, the identifiable assets acquired and liabilities assumed ware asfollows:
Cash and cash equivalents $ 273,066
Financial assets at cost 2,940
Notes and accounts receivable, net 178,346
Inventories 184,310
Other receivables 1,021
Other current assets 21,187
Property, plant and equipment 164,833
Intangible assets 2,567
Deferred tax assets 21,478
Other non-current assets 17,624
Short-term borrowings (119,500)
Notes and accounts payable (87,190)
Long-term borrowings, current portion (15,000)
Provisions-current (8,668)
Other payables (52,711)
Current Tax liability (151)
Other current liabilities (190,630)
Long-term borrowings (45,000)
Other non-current liabilities (73)
Total net identifiable assets $ 348,449
(Continued)

37
COMPAL ELECTRONICS, INC.
Notes to Financial Statements
(ii) General Life Biotechnology Co., Ltd. ("GLB")
The Company purchased newly issued shares of GLB and acquired shares from its originalstockholders amounting to $246,860 in total in October 2015, which was accounted for 50%equity ownership of GLB. Starting October 2015, the Company has control over GLB.
As of the acquisition date, the identifiable assets acquired and liabilities assumed were asfollows:
Cash and cash equivalents $ 224,067
Notes and accounts receivable, net 25,843
Inventories 33,656
Other current assets 5,430
Property, plant and equipment 35,093
Other non-current assets 4,745
Notes and accounts payable (21,822)
Other current liabilities (34,068)
Total net identifiable assets $ 272,944
The difference between the consideration transferred of $246,860 and the fair value of GLB’s 50%
equity ownership was $110,388. The goodwill was generated from the diversity of the Group’ sbusiness.
(i) Changes in subsidiaries’ equity
(i) Changes in ownership interests while retaining control (increase in ownership interest)
The Company and its subsidiaries purchased newly issued shares of Compal BroadbandNetworks, Inc (“CBN”) amounting to $447,702 in the fourth quarter of 2016, and reduced theirownership of CBN by 2.65%, due to the investment was not purchased in accordance with theoriginal shareholding percentage. In addition, the Company’s subsidiaries purchased shares ofother subsidiaries from non-controlling interest amounting to $8,643 in 2016.
The Company and its subsidiaries purchased newly issued shares of Arcadyan amounting to
$315,158 in the first quarter of 2015, and increased its ownership of Arcadyan by 0.03%. TheCompany and its subsidiaries purchased shares of the subsidiaries from non-controlling
interest amounting to $13,518 in 2015.
Mactech merged with Synchro Seiki Co., Ltd. (“Synchro”) through issuing new shares in 2015.Mactech was the surviving company and Synchro was the dissolved company. The Company
increased its ownership in Mactech by 1.75%.
(Continued)

38
COMPAL ELECTRONICS, INC.
Notes to Financial Statements
The following summarizes the effect of changes in equity of the parent due to changes in theownership interest of the subsidiaries:
2016 2015Acquisition of non-controlling interest (carrying
amount)$ 455,358 381,918
Consideration paid for the non-controlling interest (456,345) (368,993)
Difference $ (987) 12,925
Capital surplus – difference between considerationand carrying amount of subsidiaries acquired ordisposed $ - 258
Capital surplus – changes in ownership interests insubsidiaries (329) 26,603
Retained earnings (658) (13,936)
$ (987) 12,925
(ii) Changes in subsidiaries’ equity did not result in the Company’s loss of control
1) Subsidiaries’ employee stock options exercised
CBN issued a total of 249 thousand shares and 308 thousand shares for the exercise ofthe common stock options in 2016 and 2015, respectively, which resulted in the reduceof the Company’s ownership of CBN by 0.74% and 0.82%, respectively.
2) Cancellation of subsidiaries’ restricted shares
Arcadyan cancelled 25 and 39 thousand restricted shares in the years ended December
31, 2016 and 2015, respectively, which resulted in the increase of 0.0047% and 0.0074%of the Company and its subsidiaries’ ownership interest of Arcadyan.
3) The following summarizes the effect of changes in equity of the parent due to changes inthe ownership interest of subsidiaries:
2016 2015Capital surplus – changes in ownership interest
in subsidiaries$ 351 1,672
Retained earnings - (636)
$ 351 1,036
(Continued)
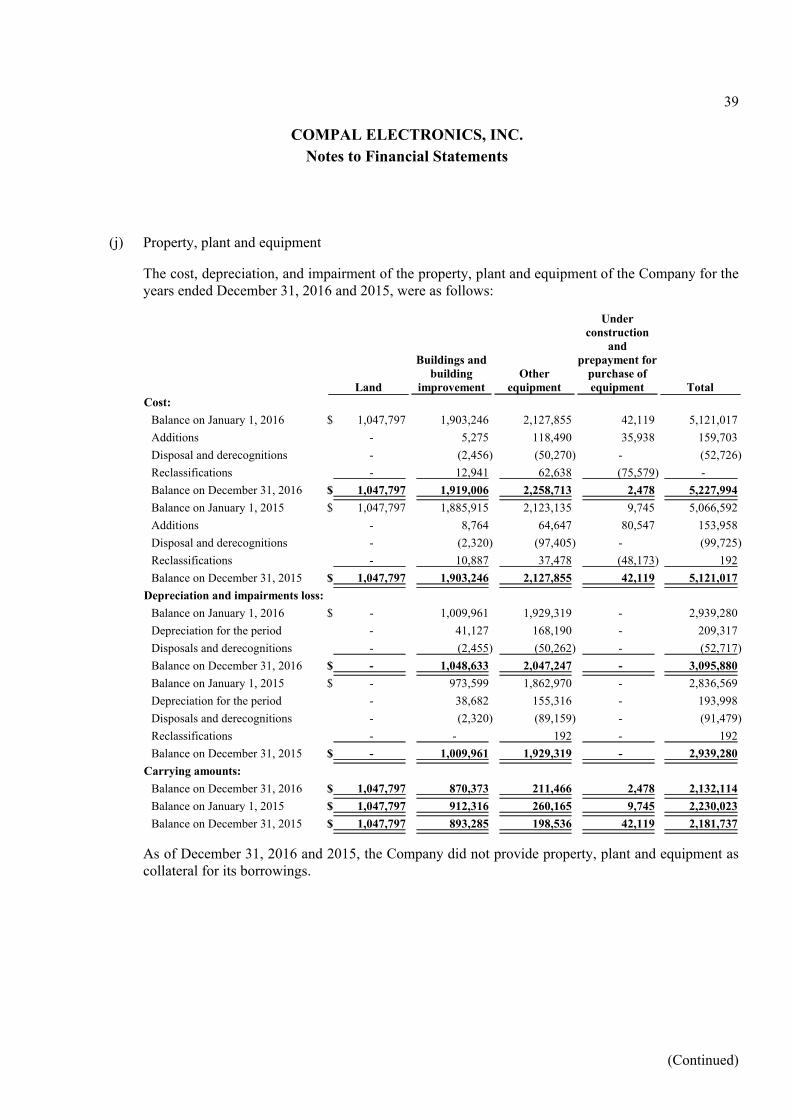
39
COMPAL ELECTRONICS, INC.
Notes to Financial Statements
(j) Property, plant and equipment
The cost, depreciation, and impairment of the property, plant and equipment of the Company for theyears ended December 31, 2016 and 2015, were as follows:
Land
Buildings andbuilding
improvementOther
equipment
Underconstruction
andprepayment for
purchase ofequipment Total
Cost:
Balance on January 1, 2016 $ 1,047,797 1,903,246 2,127,855 42,119 5,121,017
Additions - 5,275 118,490 35,938 159,703
Disposal and derecognitions - (2,456) (50,270) - (52,726)
Reclassifications - 12,941 62,638 (75,579) -
Balance on December 31, 2016 $ 1,047,797 1,919,006 2,258,713 2,478 5,227,994
Balance on January 1, 2015 $ 1,047,797 1,885,915 2,123,135 9,745 5,066,592
Additions - 8,764 64,647 80,547 153,958
Disposal and derecognitions - (2,320) (97,405) - (99,725)
Reclassifications - 10,887 37,478 (48,173) 192
Balance on December 31, 2015 $ 1,047,797 1,903,246 2,127,855 42,119 5,121,017
Depreciation and impairments loss:
Balance on January 1, 2016 $ - 1,009,961 1,929,319 - 2,939,280
Depreciation for the period - 41,127 168,190 - 209,317
Disposals and derecognitions - (2,455) (50,262) - (52,717)
Balance on December 31, 2016 $ - 1,048,633 2,047,247 - 3,095,880
Balance on January 1, 2015 $ - 973,599 1,862,970 - 2,836,569
Depreciation for the period - 38,682 155,316 - 193,998
Disposals and derecognitions - (2,320) (89,159) - (91,479)
Reclassifications - - 192 - 192
Balance on December 31, 2015 $ - 1,009,961 1,929,319 - 2,939,280
Carrying amounts:
Balance on December 31, 2016 $ 1,047,797 870,373 211,466 2,478 2,132,114
Balance on January 1, 2015 $ 1,047,797 912,316 260,165 9,745 2,230,023
Balance on December 31, 2015 $ 1,047,797 893,285 198,536 42,119 2,181,737
As of December 31, 2016 and 2015, the Company did not provide property, plant and equipment ascollateral for its borrowings.
(Continued)

40
COMPAL ELECTRONICS, INC.
Notes to Financial Statements
(k) Short-term borrowings
The details of short-term borrowings were as following:
December 31,2016
December 31,2015
Credit loans $ 30,443,750 22,087,200
Unused credit line for short-term borrowings $ 45,918,000 60,344,000
Annual range of interest rates 0.67%~1.40% 0.69%~1.2%
For information on the Company’s interest risk, foreign currency risk and liquidity risk, please referto note (6)(x).
(l) Long-term borrowings
The details of long-term borrowings were as follows:
December 31, 2016Currencies Annual interest rate Expiration year Amount
Unsecured bank loans TWD 1.08%~1.35% 2017~2020 $ 31,335,000
Less: current portion 7,700,000
$ 23,635,000
Unused credit line forlong-term borrowings $ 5,069,800
December 31, 2015Currencies Annual interest rate Expiration year Amount
Unsecured bank loans TWD 1.23%~1.50% 2016~2018 $ 27,590,000
Less: current portion 13,850,000
$ 13,740,000
Unused credit line forlong-term borrowings $ 1,407,600
For information on the Company’s interest risk and liquidity risk, please refer to note (6)(x).
(Continued)

41
COMPAL ELECTRONICS, INC.
Notes to Financial Statements
(m) Provisions
2016
Sales returnand allowances
2015Sales return
and allowances and others
Balance on January 1 $ 2,034,677 1,676,185
Provisions made during the period 1,551,439 1,004,715
Provisions used during the period (205,730) (385,855)
Provisions reversed during the period (1,848,136) (260,368)
Balance on December 31 $ 1,532,250 2,034,677
Provisions related to sales of products are assessed based on historical experience, management’sjudgement and other known reasons. Such allowances are recognized as a deduction of sales revenuein the same period in which sales are made. The aforementioned provisions are expected to settleover the next year.
(n) Operating lease
(i) The Company as lessee
The rental payables of the non-cancellable operating lease are as follows:
December 31,2016
December 31,2015
Less than one year $ 252,029 267,704
Between one and five years 252,849 426,419
$ 504,878 694,123
The Company leased several office areas and plants under operating leases with the leasingterms from 1 to 5 years and had an option to renew the leases when the leases expired.
For the years ended December 31, 2016 and 2015, expenses recognized in profit or loss underoperating leases amounted to $251,070 and $259,977, respectively.
(ii) The Company as lessor
The Company leased out a few offices buildings, plants and equipments to third parties underoperating lease with lease terms of 3 to 5 years. For the years ended December 31, 2016 and2015, rentals recognized in profit or loss amounted to $13,807 and $13,855, respectively. Thefuture minimum lease receivables under non-cancellable leases are as follows:
December 31,2016
December 31,2015
Less than one year $ 10,218 9,749
Between one and five years 2,357 11,688
$ 12,575 21,437
(Continued)

42
COMPAL ELECTRONICS, INC.
Notes to Financial Statements
(o) Employee benefits
(i) Defined benefit plans
The present value of the defined benefit obligations and fair value of plan assets of theCompany were as follows:
December 31,2016
December 31,2015
Present value of defined benefit obligations $ (1,172,961) (1,175,610)
Fair value of plan assets 631,268 705,764
Net defined benefit obligations $ (541,693) (469,846)
The Company makes defined benefit plan contributions to the pension fund account at theBank of Taiwan that provides pensions for employees upon retirement. The plans entitle aretired employee to receive an annual payment based on years of service and average salary forthe six months prior to retirement.
1) Composition of plan assets
The Company allocates pension funds in accordance with the Regulations for Revenues,Expenditures, Safeguard and Utilization of the Labor Retirement Fund, and such fundsare managed by the Labor Pension Fund Supervisory Committee. With regard to theutilization of the funds, minimum earnings in the annual distributions on the finalfinancial statements shall be no less than the earnings attainable from the amountsaccrued from two-year time deposits with interest rates offered by local banks.
The Company’ s labor pension reserve account in the Bank of Taiwan amounted to
$624,625 as of December 31, 2016. For information on the utilization of the laborpension fund assets including the asset allocation and yield of the fund, please refer tothe website of the Bureau of Labor Funds, Ministry of Labor.
2) Movements in the present value of the defined benefit obligations
The movements in the present value of defined benefit obligations for the Company wereas follows:
2016 2015Balance on January 1 $ (1,175,610) (1,095,931)
Current service costs and interest (25,838) (30,702)
Remeasurements of net benefit liabilities (75,573) (84,758)
Benefit paid by the plan 104,060 35,781
Balance on December 31 $ (1,172,961) (1,175,610)
(Continued)

43
COMPAL ELECTRONICS, INC.
Notes to Financial Statements
3) Movements of the fair value of defined benefit plan assets
The movements in the fair value of the defined benefit plan assets for the Company wereas follows:
2016 2015Fair value of plan assets on January 1 $ 705,764 696,801
Expected return on plan assets 11,066 13,656
Remeasurements of net benefit plan assets (6,448) 5,187
Contributions made 24,946 25,901
Benefits paid by the plan assets (104,060) (35,781)
Fair value of plan assets on December 31 $ 631,268 705,764
4) Expenses recognized in profit or loss
The expenses recognized in profit or loss for the years ended December 31, 2016 and2015, were as follows:
2016 2015Current service cost $ 7,466 9,306
Net interest on the net defined benefit liability(asset) 7,306 7,740
$ 14,772 17,046
Cost of sales $ 424 227
Selling expenses 834 1,033
Administrative expenses 3,967 4,704
Research and development expenses 9,547 11,082
$ 14,772 17,046
5) The remeasurements of the net defined benefit liability (asset) recognized in othercomprehensive income
The Company’s remeasurements of the net defined benefit liability (assets) recognized in
other comprehensive income for the years ended December 31, 2016 and 2015, were asfollows:
2016 2015Cumulative amount on January 1 $ 245,206 165,635
Recognized during the period 82,021 79,571
Cumulative amount on December 31 $ 327,227 245,206
(Continued)

44
COMPAL ELECTRONICS, INC.
Notes to Financial Statements
6) Actuarial assumptions
The following are the Company’s principal actuarial assumptions at the reporting date:
December 31,2016
December 31,2015
Discount rate on December 31 %1.60 %1.60
Future salary increases %2.50 %2.50
The expected allocation payment made by the Company to the defined benefit plans for
the one year period after the reporting date was $25,570.
The weighted-average duration of the defined benefit obligation is 11 years.
7) Sensitivity analysis
If the main actuarial assumptions had changed, the impact on the present value of thedefined benefit obligation shall be as follows:
Effects to the defined benefit obligation
Increased0.25%
Decreased0.25%
December 31, 2016
Discount rate (30,125) 31,309
Future salary increasing rate 30,962 (29,945)
December 31, 2015
Discount rate (31,908) 33,207
Future salary increasing rate 32,838 (31,718)
Reasonably possible changes at the reporting date to one of the relevant actuarialassumptions, holding other assumptions constant, would have affected the definedbenefit obligation by the amounts shown above. The method used in the sensitivityanalysis is consistent with the calculation on the net defined benefit liabilities in thebalance sheets.
The method and assumption used in the sensitivity analysis is consistent with priorperiod.
(Continued)

45
COMPAL ELECTRONICS, INC.
Notes to Financial Statements
(ii) Defined contribution plans
The Company allocates 6% of each employee’s monthly wages to the labor pension personalaccount at the Bureau of the Labor Insurance in accordance with the provisions of the LaborPension Act. Under this defined contribution plan, the Company allocates the labor pension ata specific percentage to the Bureau of the Labor Insurance without additional legal orconstructive obligations.
The Company recognized the pension costs under the defined contribution method amounting
to $277,348 and $264,002 for the years ended December 31, 2016 and 2015, respectively.Payment was made to the Bureau of Labor Insurance.
(p) Income taxes
(i) Income tax expenses
1) The amount of income tax for the years ended December 31, 2016 and 2015, was asfollows:
2016 2015Current tax expense
Recognized during the period $ 829,587 1,623,546
10% surtax on unappropriated earnings 325,779 643,950
Tax credit of investment (233,210) (410,510)
922,156 1,856,986
Deferred tax expense
Recognition and reversal of temporarydifferences 318,700 (378,706)
318,700 (378,706)
Income tax expense $ 1,240,856 1,478,280
2) The amount of income tax recognized in other comprehensive income for the years endedDecember 31, 2016 and 2015, was as follows:
2016 2015Items that will not be reclassified subsequently
to profit or loss:
Remeasurement of the defined benefitliability
$ (13,944) (13,527)
Items that will be reclassified subsequently toprofit or loss:
Unrealized gain (loss) of available-for-salefinancial assets
$ (23,868) 18,486
(Continued)
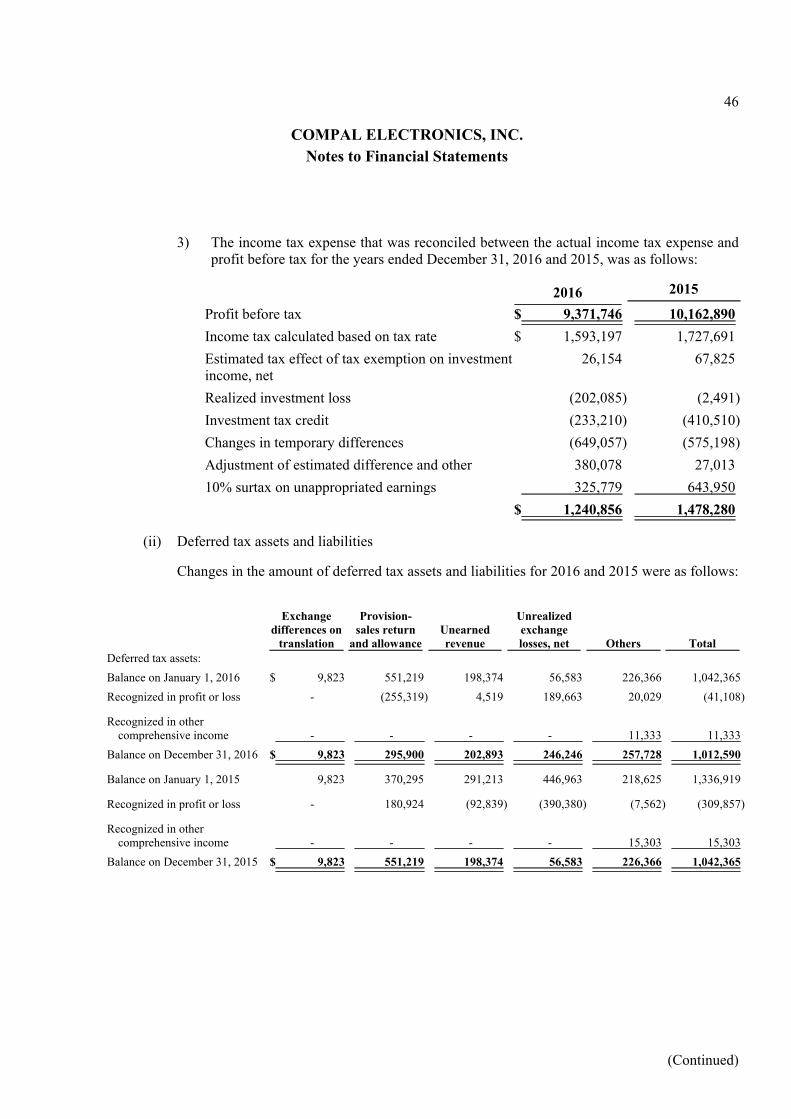
46
COMPAL ELECTRONICS, INC.
Notes to Financial Statements
3) The income tax expense that was reconciled between the actual income tax expense andprofit before tax for the years ended December 31, 2016 and 2015, was as follows:
2016 2015
Profit before tax $ 9,371,746 10,162,890
Income tax calculated based on tax rate $ 1,593,197 1,727,691
Estimated tax effect of tax exemption on investmentincome, net
26,154 67,825
Realized investment loss (202,085) (2,491)
Investment tax credit (233,210) (410,510)
Changes in temporary differences (649,057) (575,198)
Adjustment of estimated difference and other 380,078 27,013
10% surtax on unappropriated earnings 325,779 643,950
$ 1,240,856 1,478,280
(ii) Deferred tax assets and liabilities
Changes in the amount of deferred tax assets and liabilities for 2016 and 2015 were as follows:
Exchangedifferences on
translation
Provision-sales return
and allowanceUnearnedrevenue
Unrealizedexchangelosses, net Others Total
Deferred tax assets:
Balance on January 1, 2016 $ 9,823 551,219 198,374 56,583 226,366 1,042,365
Recognized in profit or loss - (255,319) 4,519 189,663 20,029 (41,108)
Recognized in othercomprehensive income - - - - 11,333 11,333
Balance on December 31, 2016 $ 9,823 295,900 202,893 246,246 257,728 1,012,590
Balance on January 1, 2015 9,823 370,295 291,213 446,963 218,625 1,336,919
Recognized in profit or loss - 180,924 (92,839) (390,380) (7,562) (309,857)
Recognized in othercomprehensive income - - - - 15,303 15,303
Balance on December 31, 2015 $ 9,823 551,219 198,374 56,583 226,366 1,042,365
(Continued)

47
COMPAL ELECTRONICS, INC.
Notes to Financial Statements
Unrealizedexchangegains, net Others Total
Deferred tax liabilities:
Balance on January 1, 2016 $ (62,751) (386,011) (448,762)
Recognized in profit or loss (277,592) - (277,592)
Recognized in other comprehensive income - 26,479 26,479
Balance on December 31, 2016 $ (340,343) (359,532) (699,875)
Balance on January 1, 2015 (752,149) (364,914) (1,117,063)
Recognized in profit or loss 689,398 (835) 688,563
Recognized in other comprehensive income - (20,262) (20,262)
Balance on December 31, 2015 $ (62,751) (386,011) (448,762)
(iii) Unrecognized deferred tax assets
Deferred tax assets have not been recognized in respect of the following items:
December 31,2016
December 31,2015
Tax effect of deductible temporary differences $ 383,552 347,934
(iv) Unrecognized deferred tax assets and liabilities related to investments in subsidiaries.
The temporary differences associated with investment in subsidiaries were not recognized asdeferred income tax assets and liabilities as the Company has the ability to control the reversalof these temporary differences which are not expected to reverse in the foreseeable future.
As of December 31, 2016 and 2015, the aggregate deductible temporary differences relating to
investments in subsidiaries not recognized as deferred tax assets amounted to $2,244,905 and
$2,838,492, respectively.
As of December 31, 2016 and 2015, the aggregate taxable temporary differences relating to
investments in subsidiaries not recognized as deferred tax liabilities amounted to $48,333,470
and $45,795,019, respectively.
(v) The ROC tax authorities have examined the Company’ s income tax returns through 2014except 2012.
(Continued)

48
COMPAL ELECTRONICS, INC.
Notes to Financial Statements
(vi) The Company’s information related to the integrated income tax system is summarized below:
December 31,2016
December 31,2015
Unappropriated earnings retained after January 1, 1998 $ 34,649,963 32,167,179
Balance of the imputation credit account $ 4,694,945 3,105,405
2016 2015Creditable ratio for earnings distribution to
R.O.C residents 12.15 %(expected) 12.60 %(actual)
The above stated information was prepared in accordance with the information letter No.10204562810 announced by the Ministry of Finance of R.O.C. on October 17, 2013.
(q) Capital and other equities
As of December 31, 2016 and 2015, the Company’ s authorized common stock consisting of
6,000,000 thousand shares with a par value of 10 New Taiwan dollar per share amounted to
$60,000,000 of which 4,424,161 thousand shares and $4,471,127 thousand shares, respectively, wereissued. All issued shares were paid up upon issuance.
(i) Ordinary shares
In 2015, the Company issued its employee restricted shares amounting to $493,600. In 2016and 2015, the Company issued its employee restricted shares amounting to wherein the amount
of $31,500 and $14,700 had been cancelled due to failure in meeting the vested requirements.
As of December 31, 2016, except $3,500, the registration procedure had been completed.
(ii) Capital surplus
The balances of capital surplus were as follows:
December 31,2016
December 31,2015
Additional paid-in capital $ 8,561,027 9,529,585
Treasury share transactions 2,301,816 2,351,157
Difference between consideration and carrying amountarising from acquisition or disposal of subsidiaries 3,750 3,750
Recognition of changes in ownership interests insubsidiaries
48,206 48,184
Employee restricted shares 603,990 647,200
Changes in equity of associates and joint venturesaccounted for using equity method 260,485 258,762
$ 11,779,274 12,838,638
(Continued)

49
COMPAL ELECTRONICS, INC.
Notes to Financial Statements
In accordance with the ROC Company Act, realized capital reserves can only be reclassified asshare capital or distributed as cash dividends after offsetting losses. The aforementionedcapital reserves include share premiums and donation gains. In accordance with the SecuritiesOffering and Issuance Guidelines, the amount of capital reserves to be reclassified under sharecapital shall not exceed 10 percent of the actual share capital amount.
The Company’s shareholders’ meeting held on June 24, 2016 and June 26, 2015, approved to
distribute the cash dividend of $885,334 and $2,214,390, respectively, representing 0.2 and 0.5New Taiwan dollars per share by using the additional paid-in capital, respectively.
(iii) Retained earnings
Based on the Company’s articles of incorporation amended on June 24, 2016, if there is anyprofit after closing of books in a given year, the Company shall first defray tax due, coveraccumulated losses and set aside ten percent of it as legal reserve and then set aside or reversea special reserve in accordance with laws and regulations. The balance of earnings availablefor distribution is composed of the remainder of the said profit and the unappropriated retainedearnings of previous years. The earnings appropriation proposal to distribute dividend andbonus shall be proposed by the Board of Directors and approved by the General ShareholdersMeeting. The rest of the unappropriated retained earnings shall be reserved.
The lifecycle of the industry of the Company is in the growing stage. To meet the need of theCompany for the future capital and the need of shareholders for cash flow, if there is any profitafter close of books, the cash dividend allocated by the Company each year shall not be lowerthan ten percent of the total dividend (including cash and share dividend) for such year.
According to the law, when there is a deduction from stockholders’ equity (excluding treasurystock and unearned employee benefit) during the year, an amount equal to the deduction itemis set aside as a special reserve before the earnings are appropriated. A special reserve is madeavailable for earning distribution only after the deduction of the related shareholders’ equityhas been reversed.
1) Legal reverse
In accordance with the Company Act, 10% of net income should be set aside as legalreserve until it is equal to the paid-in capital. When a company incurs no loss, it may, inpursuant to a resolution to be adopted by the shareholders’ meeting as required, distributeits legal reserve by issuing new shares and distributing stock dividends or distributingcash to shareholders. Only the portion of the legal reserve which exceeds 25% of thepaid-in capital may be distributed.
2) Special reverse
In accordance with Ruling No. 1010012865 issued by the FSC on April 6, 2012, aportion of current earnings and previous unappropriated earnings shall be set aside as aspecial reserve during earnings distribution. The amount to be set aside should equal thetotal amount of contra accounts that are accounted for as deductions to other equityinterests. A portion of previous unappropriated earnings shall be set aside as a specialreserve, which should not be distributed, to account for cumulative changes to otherequity interests pertaining to prior periods. The special reserve shall be made available
(Continued)

50
COMPAL ELECTRONICS, INC.
Notes to Financial Statements
for appropriation when the net deductions of other equity interests are reversed in thesubsequent periods.
3) Earnings distribution
Earnings distribution for 2015 and 2014 was approved by the shareholders during theirannual meeting held on June 24, 2016 and June 26, 2015, respectively. The relevantinformation was as follows:
2015 2014Amount
per shareTotal
amountAmount
per shareTotal
amountCash dividends distributed
to common shareholders $ 1.0 4,426,671 1.0 4,428,781
The earnings distribution for the year ended December 31, 2016 had not yet beenapproved by the Board of Directors nor decided by the shareholders. The relatedinformation can be accessed through the Market Observation Post System website afterthe shareholders’ meeting.
4) Treasury stock
The subsidiaries of the Company did not sell the ordinary share of the Company in the
years ended December 31, 2016 and 2015. As of December 31, 2016, Panpal and
Gempal, subsidiaries of the Company, held 50,017 thousand shares of ordinary shares of
the Company, recorded as the Company’s treasury stock, with a book value of 17.6 New
Taiwan dollars per share. The total cost was $881,247 as of December 31, 2016. The fair
value of the ordinary share of the Company was 18.45 and 18.50 New Taiwan dollars per
share as of December 31, 2016 and 2015, respectively.
Pursuant to Article 28-2 of the Securities and Exchange Act, in order to transfer its own
shares to employees, the Company purchased 58,516 thousand shares of treasury stock
amounting to $1,126,478 in the year ended December 31, 2013. At a meeting held on
August 13, 2014, the Company’s Board of Directors decided to transfer 14,700 thousandshares of treasury stock, which were purchased in 2013, to employees. The Company
cancelled the rest of the 43,816 thousand shares of treasury stock purchased in 2013 atthe directors’ meeting held on June 29, 2016 because the legal transfer period hadmatured. The registration procedure had been completed.
Pursuant to the Securities and Exchange Act, the number of treasury shares purchasedcannot exceed 10% of the number of shares issued. The total purchase cost cannotexceed the sum of retained earnings, paid-in capital in excess of par value and realizedcapital surplus. The shares purchased for the purpose of transferring to employees shallbe transferred within three years from the date of share repurchase. Those not transferredwithin the said limit shall be deemed as not issued by the Company and it should becancelled. Furthermore, treasury stock cannot be pledged for debts, and treasury stockdoes not carry any shareholder rights until it is transferred.
(Continued)

51
COMPAL ELECTRONICS, INC.
Notes to Financial Statements
5) Other equity interests (net-of-taxes)
Exchangedifferences ontransaction of
foreign operationfinancial
statements
Unrealized gain (loss) on
available-for-salefinancial assets
Unearnedcompensationfor restricted
employee sharesand others Total
Balance on January 1, 2016 2,803,061 (6,010,432) (719,510) (3,926,881)
The Company (1,004,076) 386,047 442,104 (175,925)
Subsidiaries 103,675 84,336 (7,699) 180,312
Associates (578,378) (123,781) - (702,159)
Balance on December 31, 2016 $ 1,324,282 (5,663,830) (285,105) (4,624,653)
Balance on January 1, 2015 $ 1,178,307 (4,317,328) - (3,139,021)
The Company 2,011,139 (1,714,209) (727,208) (430,278)
Subsidiaries (276,241) 57,900 7,698 (210,643)
Associates (110,144) (36,795) - (146,939)
Balance on December 31, 2015 $ 2,803,061 (6,010,432) (719,510) (3,926,881)
(r) Share-based payment
At the meeting held on June 20, 2014, the Company’s Shareholders’ Meeting adopted a resolution toissue 100,000 thousand new shares of employee restricted stock with no consideration to those full
time employees who meet certain requirements. The first issuance of 50,000 thousand shares hadbeen approved by the FSC on October 30, 2014. Moreover, the Company’ s Board of Directors
resolved to issue 49,980 thousand shares on January 22, 2015, and 49,360 thousand shares hadactually been issued, in which the effective date of the share issuance was on February 25, 2015.
40%, 30% and 30% of the aforementioned restricted shares are vested, respectively, when theemployees continue to provide service for at least 2 year, 3 years and 4 years from the registrationand effective date and in the meantime, meet the performance requirement. After the issuance, therestricted shares are kept by a trust, which is appointed by the Company, before they are vested.These restricted shares shall not be sold, pledged, transferred, gifted or by any other means ofdisposal to third parties during the custody period. The voting rights of these shares are executed bythe custodian, and the custodian shall act based on law and regulations. If the shares remainunvested after the vesting period, the Company will purchase all the unvested shares withoutconsideration and cancel the shares thereafter. Restricted shares could receive cash and stockdividends. The aforementioned new shares are not considered as restricted shares.
(Continued)

52
COMPAL ELECTRONICS, INC.
Notes to Financial Statements
The information of the Company’s restricted shares (in thousands) is as follows:
2016 2015Outstanding shares on January 1 47,890 -
Granted during the period - 49,360
Canceled during the period (3,150) (1,470)
Outstanding shares on December 31 44,740 47,890
The fair value of the restricted employee shares are evaluated by using the market price of $23.50 onthe grant date. As of December 31, 2016 and 2015, the unearned employee benefits were $285,104and $727,208, respectively. The compensation cost related to the restricted shares amounted to$373,429 and $400,262, respectively, for the years ended December 31, 2016 and 2015.
(s) Earnings per share
The Company’s basic and diluted earnings per share are calculated as follows:
2016 2015Basic earnings per share:
Profit attributable to ordinary shareholders of the Company $ 8,130,890 8,684,610
Weighted-average number of outstanding ordinary shares(in thousands)
4,329,404 4,329,404
Diluted earnings per share:
Profit attributable to ordinary shareholders of the Company(after adjustment of potential diluted ordinary shares) $ 8,130,890 8,684,610
Weighted-average number of outstanding ordinary shares ofpotential diluted ordinary shares (in thousands)
Weighted-average number of outstanding ordinary shares(in thousands)
4,329,404 4,329,404
Effect of dilutive ordinary shares
Employee bonuses (in thousands) - 19,335
Employee compensation (in thousands) 59,347 51,350
Employee restricted shares (in thousands) 29,826 14,504
Weighted-average number of ordinary shares (in thousands)(after adjustment of potential diluted ordinary shares) 4,418,577 4,414,593
(Continued)

53
COMPAL ELECTRONICS, INC.
Notes to Financial Statements
(t) Revenue
The revenue for the years ended December 31, 2016 and 2015, were as follows:
2016 2015Sale of goods $ 724,791,301 801,866,027
Rendering of services 861,794 1,128,903
$ 725,653,095 802,994,930
(u) Employees’ and directors’ compensations
Based on the Company’ s articles of incorporation, if there is any profit in a fiscal year, theCompany’s pre-tax profits in such fiscal year, prior to deduction of compensations to employees anddirectors, shall be distributed to employees as compensations in an amount of not less than twopercent (2%) thereof and to directors as compensations in an amount of not more than two percent(2%) of such profits. In the event that the Company has accumulated losses, the Company shallreserve an amount to offset accumulated losses. The compensations to employees as mentionedabove may be distributed in the form of stock or cash. Employees entitled to receive the said stockor cash may include the employees of the Company’ s subordinate companies pursuant to theCompany Act.
The Company accrued and recognized its employee compensation of $876,028 and $949,980, and
directors’ compensation of $46,323 and $50,234 for the years ended December 31, 2016 and 2015.The estimated amounts mentioned above are based on the net profit before tax without thecompensations to employees and directors of each respective ending period, multiplied by thepercentage of the compensation to employees and directors, which was approved by themanagement. The estimations are recorded under operating expenses and cost. The differencesbetween the amounts estimated and recognized in the financial statements, if any, are accounted foras changes in accounting estimates and recognized as profit or loss in the distribution year. If theBoard of Directors approve to distribute employee compensation in the form of stock, the number ofthe shares of the employee compensation is based on the closing price of the day before the Board ofDirectors meeting, the related information can be accessed through the Market Observation PostSystem website. There is no difference between the amount approved in the Board of Directorsmeeting and those recognized in the financial statements in 2016 and 2015.
There is no difference between the amount estimated and recognized in the financial statements in2015. The related information can be accessed through the Market Observation Post System website.
(Continued)

54
COMPAL ELECTRONICS, INC.
Notes to Financial Statements
(v) Non-operating income and expenses
(i) Other income
The other income for the years ended December 31, 2016 and 2015, were as follows:
2016 2015Interest income
Bond investment without an active market $ 23,992 30,992
Bank deposits 83,589 112,977
Others 12,173 9,299
Dividend revenue 133,485 170,537
Overdue payable reversed as other income 422,269 203,878
Sales of expensed assets 186,367 80,919
Other revenue 71,129 178,356
$ 933,004 786,958
(ii) Other gains and losses
The other gains and losses for the years ended December 31, 2016 and 2015, were as follows:
2016 2015Gains on disposal of investments $ - 405,885
Gains (losses) on financial assets and liabilities at fairvalue through profit or loss, net 92,999 (209,972)
Foreign currency exchange gains (losses), net (660,732) 97,464
Impairment loss (13,403) (32,000)
Other 105 212
$ (581,031) 261,589
(w) Reclassification of the components of other comprehensive income
The details of reclassification of the components of other comprehensive income for the years ended
December 31, 2016 and 2015, were as follows:
2016 2015Available-for-sale financial assets
Net change in fair value (net of tax) $ 381,443 (1,325,773)
Net change in fair value reclassified to profit or loss (net oftax) 4,604 (388,436)
Net change in fair value recognized in other comprehensiveincome (net of tax) $ 386,047 (1,714,209)
(Continued)

55
COMPAL ELECTRONICS, INC.
Notes to Financial Statements
(x) Financial instruments
(i) Credit risk
The carrying amount of financial assets represents the maximum amount exposed to credit risk.
The Company’ s customers are mainly from the high-tech industry. The Company does notconcentrate on a specific customer and the sales regions are widely spread, thus there shouldbe no concern on the significant concentrations of accounts receivable credit risk. And inorder to mitigate accounts receivable credit risk, the Company constantly assesses the financialstatus of the customers.
(ii) Liquidity risk
The following are the contractual maturities of financial liabilities, excluding estimatedinterest payments.
CarryingAmount
Contractualcash flows
Within 1 year 1 ~ 2 years
Over 2years
December 31, 2016
Non-derivative financialliabilities
Unsecured borrowings $ 61,778,750 (61,778,750) (38,143,750) (4,688,750) (18,946,250)
Accounts payable 146,438,634 (146,438,634) (146,438,634) - -
Other payables 4,606,674 (4,606,674) (4,606,674) - -
$ 212,824,058 (212,824,058) (189,189,058) (4,688,750) (18,946,250)
December 31, 2015
Non-derivative financialliabilities
Unsecured borrowings $ 49,677,200 (49,677,200) (35,937,200) (9,950,000) (3,790,000)
Accounts payable 126,358,846 (126,358,846) (126,358,846) - -
Other payables 5,907,402 (5,907,402) (5,907,402) - -
$ 181,943,448 (181,943,448) (168,203,448) (9,950,000) (3,790,000)
The Company is not expecting that the cash flows included in the maturity analysis couldoccur significantly earlier or at significantly different amounts.
(Continued)

56
COMPAL ELECTRONICS, INC.
Notes to Financial Statements
(iii) Currency risk
1) Exposure to foreign currency risk
The Company’s significant exposure to foreign currency risk was as follows:
December 31, 2016 December 31, 2015
ForeignCurrency
Exchangerate TWD
ForeignCurrency
Exchangerate TWD
Financial assets
Monetary items
USD to TWD $ 6,330,638 32.25 204,163,076 5,554,587 32.825 182,329,318
Non-monetaryitems THB to TWD 647,743 0.8990 582,303 806,098 0.9156 738,063
Financial liabilities
Monetary items
USD to TWD 5,348,135 32.25 172,477,354 4,137,126 32.825 135,801,161
2) Sensitivity analysis
The Company’ s exposure to foreign currency risk arises from the translation of theforeign currency exchange gains and losses on cash and cash equivalents, accountsreceivable, other receivables, loans and borrowings, accounts payable and other payablesthat are denominated in foreign currency. Assuming all other variable factors remainconstant, a strengthening (weakening) 5% of appreciation (depreciation) of the USD
against the TWD as of December 31, 2016 and 2015, would have increased (decreased)the net profit before tax as follows. The analysis is performed on the same basis for bothperiods.
December 31,2016
December 31,2015
USD (against the TWD)
Strengthening 5% $ 1,584,286 2,326,408
Weakening 5% (1,584,286) (2,326,408)
3) Exchange gains and losses of monetary items
As the Company deals with diverse foreign currencies, gains or losses on foreignexchange were summarized as a single amount. In 2016 and 2015, the foreign exchange
gain (loss), including both realized and unrealized, amounted to a loss of $660,732 and a
gain of $97,464, respectively.
(Continued)

57
COMPAL ELECTRONICS, INC.
Notes to Financial Statements
(iv) Interest rate analysis
The interest risk exposure from financial assets and liabilities has been disclosed in the note ofliquidity risk management.
The following sensitivity analysis is based on the risk exposure to interest rate on thederivative and non-derivative financial instruments on the reporting date. Regarding the assetsand liabilities with variable interest rates, the analysis is on the basis of the assumption that theamount of assets and liabilities outstanding at the reporting date were outstanding throughoutthe year. The rate of change is expressed as the interest rate increase or decrease by 0.25%,when reporting to management internally, which also represents the assessment of theCompany’s management for the reasonably possible interval of interest rate change.
Assuming all other variable factors remaining constant, if the interest rate had increased ordecreased by 0.25%, the impact to the net profit before tax would be as follows for the yearsended December 31, 2016 and 2015, which would be mainly resulted from the bank savingsand borrowings with variable interest rates.
2016 2015Interest increased by 0.25% $ (43,700) 18
Interest decreased by 0.25% 43,700 (18)
(v) Fair value information
1) Valuation procedures
The Company’ s accounting policies and disclosure include fair value method onfinancial assets, financial liabilities, non-financial assets and non-financial liabilities. TheCompany’s management is responsible in performing independent test on fair value byusing independent source of information to obtain the fair value which is close to themarket status. The management also confirms the independence, reliability and matchingof the information source, and regularly test the valuation model, update the input andother information, and make necessary adjustment to ensure the output of valuation isreasonable.
2) Fair value hierarchy
The Company uses observable market data to evaluate assets and liabilities when it ispossible. The different levels have been defined as follows:
● Level 1: quoted prices (unadjusted) in active markets for identical assets orliabilities.
● Level 2: inputs other than quoted prices included within Level 1 that are observablefor the asset or liability, either directly (i.e. as prices) or indirectly (i.e. derived fromprices).
● Level 3: inputs for the assets or liability that are not based on observable market data(unobservable inputs).
(Continued)

58
COMPAL ELECTRONICS, INC.
Notes to Financial Statements
3) The categories and fair value of financial instruments
The Company’s available- for-sale financial assets measured at fair value on a recurringbasis. The following table shows the carrying amounts and fair values of financial assetsand financial liabilities, including their levels in the fair value hierarchy. It shall notinclude fair value information of the financial assets and financial liabilities notmeasured at fair value if the carrying amount is a reasonable approximation of fair valueand investments in equity instruments which do not have any quoted price in an activemarket in which the fair value cannot be reasonably measured.
December 31, 2016Fair Value
Book value Level 1 Level 2 Level 3 TotalAvailable-for-sale financial assets
Stocks listed on domestic markets (includingstocks acquired via private placement) $ 4,524,669 3,713,669 - 811,000 4,524,669
Stocks listed on foreign markets 582,303 582,303 - - 582,303
Stocks unlisted on domestic markets 1,221,817 - - 1,221,817 1,221,817
Stocks unlisted on foreign markets 69,044 - - 69,044 69,044
6,397,833
Financial assets at cost (non-current) 2,333 - - - -
Loans and receivables
Cash and cash equivalents 43,392,135 - - - -
Bond investment without active market-including current and non-current 1,050,000 - - - -
Notes and accounts receivable, net 162,701,780 - - - -
Notes and accounts receivable due fromrelated parties, net
2,177,705 - - - -
Other receivables 314,439 - - - -
Guarantee deposits 117,233 - - - -
209,753,292
Total $ 216,153,458
Financial liabilities at amortized costthrough profit or loss
Short-term borrowings $ 30,443,750 - - - -
Notes and accounts payable 72,535,568 - - - -
Notes and accounts payable to related parties 73,903,066 - - - -
Other payable 4,606,674 - - - -
Long-term borrowings current portion 7,700,000 - - - -
Long-term borrowings 23,635,000 - - - -
Total $ 212,824,058
(Continued)

59
COMPAL ELECTRONICS, INC.
Notes to Financial Statements
December 31, 2015Fair Value
Book value Level 1 Level 2 Level 3 TotalAvailable-for-sale financial assets
Stocks listed on domestic markets (includingstocks acquired via private placement) $ 4,021,762 3,210,762 - 811,000 4,021,762
Stocks listed on foreign markets 738,063 738,063 - - 738,063
Stocks unlisted on domestic markets 1,171,944 - - 1,171,944 1,171,944
Stocks unlisted on foreign markets 68,872 - - 68,872 68,872
6,000,641
Financial assets at cost (non-current) 6,588 - - - -
Loans and receivables
Cash and cash equivalents 30,797,312 - - - -
Bond investment without active market-including current and non-current 1,400,000 - - - -
Notes and accounts receivable, net 148,844,537 - - - -
Notes and accounts receivable due fromrelated parties, net
973,946 - - - -
Other receivables 553,185 - - - -
Guarantee deposits 105,422 - - - -
182,674,402
Total $ 188,681,631
Financial liabilities at amortized costthrough profit or loss
Short-term borrowings $ 22,087,200 - - - -
Notes and accounts payable 63,996,915 - - - -
Notes and accounts payable to related parties 62,361,931 - - - -
Other payable 5,907,402 - - - -
Long-term borrowings current portion 13,850,000 - - - -
Long-term borrowings 13,740,000 - - - -
Total $ 181,943,448
4) Fair value valuation technique of financial instruments not measured at fair value
The Company estimates financial instruments that not measured at fair value by methodsand assumptions as follows:
a) Bond investment without active market and financial liabilities at amortized cost
Fair value measurement is based on the latest quoted price and agreed-upon price ifthese prices are available in an active market. When market value is unavailable,fair value of financial assets and liabilities are evaluated based on the discountedcash flow of the financial assets and liabilities.
(Continued)

60
COMPAL ELECTRONICS, INC.
Notes to Financial Statements
5) Fair value valuation technique of financial instruments measured at fair value
a) Non-derivative financial instruments
Financial instruments trade in active markets is based on quoted market prices. Thequoted price of a financial instrument obtained from main exchanges and on-the-run bonds from Taipei Exchange can be used as a base to determine the fair valueof the listed companies’ equity instrument and debt instrument of the quoted pricein an active market.
If a quoted price of a financial instrument can be obtained in time and often fromexchanges, brokers, underwriters, industrial union, pricing institute, or authoritiesand such price can reflect those actual trading and frequently happen in the market,then the financial instrument is considered to have a quoted price in an activemarket. If a financial instrument is not in accord with the definition mentionedabove, then it is considered to be without a quoted price in an active market. Ingeneral, market with low trading volume or high bid-ask spreads is an indication ofa non-active market.
The fair value of the listed company is determined by reference to the marketquotation.
The measurements on fair value of the financial instruments without an activemarket are determined using the valuation technique or the quoted market price ofits competitors. Fair value measured using the valuation technique can beextrapolated from similar financial instruments, discounted cash flow method, orother valuation techniques which include the model used in calculating theobservable market data at the balance sheet date.
The measurement of fair value of a non-active market financial instruments held bythe Company which do not have quoted market prices are based on the comparablemarket approach, with the use of key assumptions of price-book ratio multiple orearnings multiple of comparable listed companies as its basic measurement. Theseassumptions have been adjusted for the effect of discount without the marketabilityof the equity securities.
b) Derivative financial instruments
Measurement of the fair value of derivative instruments is based on the valuationtechniques that are generally accepted by the market participants. For instance,discount method or option pricing models. Fair value of forward currency exchangeis usually determined by using the forward currency rate.
(Continued)

61
COMPAL ELECTRONICS, INC.
Notes to Financial Statements
6) Transfer from one level to another
There was no transfer from one level to another in 2016.
The stocks of Uniflex Technology Inc. (“Uniflex”) were recorded as available-for-sale
financial assets. As of December 31, 2016 and 2015, the fair values were $2,084 and
$4,359, respectively. Uniflex started to be a listed company in December 2015, therefore,the Company transferred the equity investment of Uniflex from level 3 to level 1 becausethe quoted prices in an active market is available.
7) Changes in level 3
Available-for-salefinancial assets
Balance on January 1, 2016 $ 2,051,816
Total gains and losses recognized:
In profit or loss (4,604)
In other comprehensive income 15,032
Purchased 65,247
Proceeds of capital reduction of investments (25,630)
Balance on December 31, 2016 $ 2,101,861
Balance on January 1, 2015 $ 2,105,718
Total gains and losses recognized:
In profit or loss (17,449)
In other comprehensive income (49,375)
Purchased 69,234
Proceeds of capital reduction of investments (51,520)
Transfer from level 3 to level 1 (4,792)
Balance on December 31, 2015 $ 2,051,816
The aforementioned total gains and losses related to the assets held during the yearsended December 31, 2016 and 2015, were as follows:
2016 2015Total gains and losses recognized:
In profit or loss before tax (as “other gains andlosses” and “other income”) $ (4,604) (17,449)
In other comprehensive income, before tax (as “unrealized gains and losses on available-for-sale financial assets ”) $ 15,032 (49,375)
(Continued)
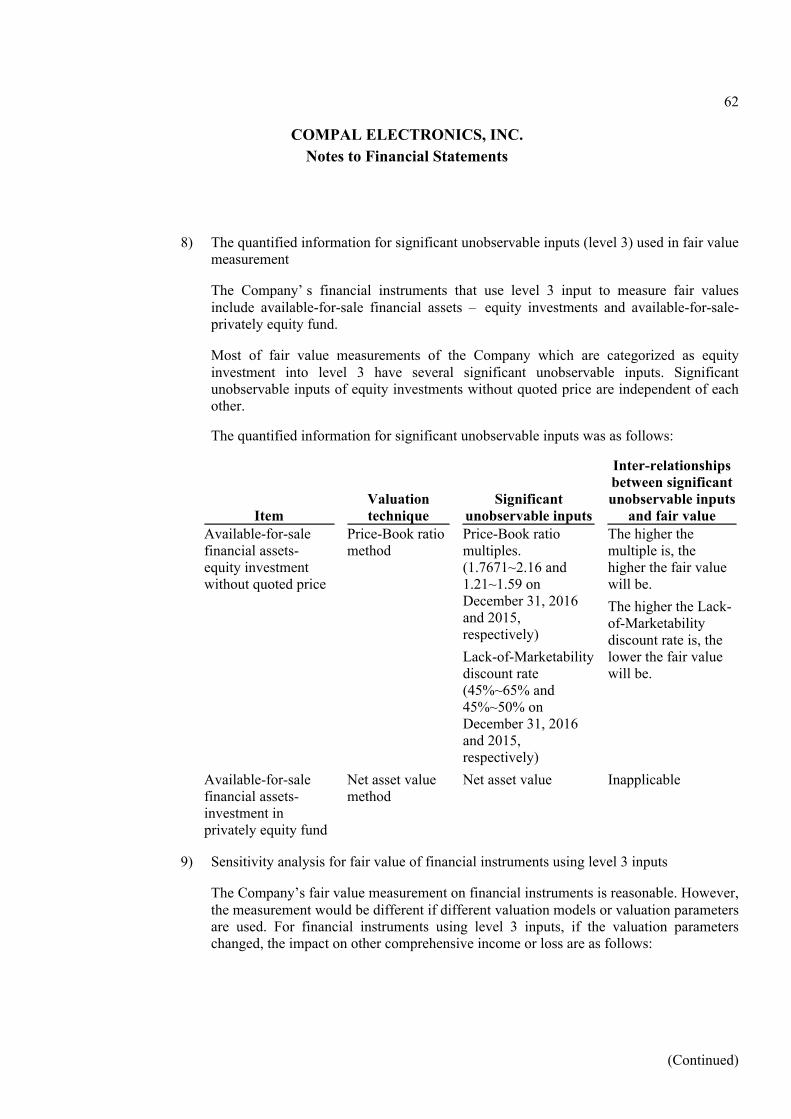
62
COMPAL ELECTRONICS, INC.
Notes to Financial Statements
8) The quantified information for significant unobservable inputs (level 3) used in fair valuemeasurement
The Company’ s financial instruments that use level 3 input to measure fair valuesinclude available-for-sale financial assets – equity investments and available-for-sale-privately equity fund.
Most of fair value measurements of the Company which are categorized as equityinvestment into level 3 have several significant unobservable inputs. Significantunobservable inputs of equity investments without quoted price are independent of eachother.
The quantified information for significant unobservable inputs was as follows:
ItemValuationtechnique
Significantunobservable inputs
Inter-relationshipsbetween significantunobservable inputs
and fair valueAvailable-for-salefinancial assets-equity investmentwithout quoted price
Price-Book ratiomethod
Price-Book ratiomultiples.(1.7671~2.16 and1.21~1.59 onDecember 31, 2016and 2015,respectively)
Lack-of-Marketabilitydiscount rate(45%~65% and45%~50% onDecember 31, 2016and 2015,respectively)
The higher themultiple is, thehigher the fair valuewill be.
The higher the Lack-of-Marketabilitydiscount rate is, thelower the fair valuewill be.
Available-for-salefinancial assets-investment inprivately equity fund
Net asset valuemethod
Net asset value Inapplicable
9) Sensitivity analysis for fair value of financial instruments using level 3 inputs
The Company’s fair value measurement on financial instruments is reasonable. However,the measurement would be different if different valuation models or valuation parametersare used. For financial instruments using level 3 inputs, if the valuation parameterschanged, the impact on other comprehensive income or loss are as follows:
(Continued)

63
COMPAL ELECTRONICS, INC.
Notes to Financial Statements
Other comprehensive income
InputMove upor down
Favorablechange
Unfavorablechange
December 31, 2016
Available-for-sale
financial assets
Price-Book ratiomultiples.
5% $ 2,276 2,294
Lack-of-Marketabilitydiscount rate
5% $ 4,084 4,066
December 31, 2015
Available-for-sale
financial assets
Price-Book ratiomultiples.
5% $ 3,499 3,399
Lack-of-Marketabilitydiscount rate
5% $ 2,969 2,870
The favorable and unfavorable impacts reflect the movement of the fair value, in whichthe fair value is calculated by using the different unobservable inputs in the valuationtechnique. The table above shows the effects of one unobservable input, withoutconsidering the inter-relationships with another unobservable input for financialinstrument, if there are one or more unobservable inputs.
(y) Financial risk management
(i) Briefings
The Company is exposed to the following risks arising from financial instruments:
1) Credit risk
2) Liquidity risk
3) Market risk
In this note expressed the information on risk exposure and objectives, policies and proceduresof risk measurement and management. For detailed information, please refer to the relatednotes of each risk.
(ii) Structure of risk management
The Company’ s finance management department provides business services for the overallinternal department. It sets the objectives, policies and processes for managing the risk and themethods used to measure the risk arising from both the domestic and international financialmarket operations.
The Company minimizes the risk exposure through derivative financial instruments. The Boardof Directors regulated the use of derivative financial instruments in accordance with theCompany’s policy about risks arising from financial instruments such as currency risk, interestrate risk, credit risk, the use of derivative and non-derivative financial instruments and theinvestments of excess liquidity. The internal auditors of the Company continue with the reviewof the amount of the risk exposure in accordance with the Company’ s policies and the risk
(Continued)

64
COMPAL ELECTRONICS, INC.
Notes to Financial Statements
management policies and procedures. The Company has no transactions in financialinstruments (including derivative financial instruments) for the purpose of speculation.
(iii) Credit risk
Credit risk is the risk of financial loss to the Company if a customer or counterparty to afinancial instrument fails to meet its contractual obligations, and arises principally from theCompany’s receivables from customers and investment securities.
1) Accounts receivable and other receivables
The Company has established a credit policy under which each new customer is analyzedindividually for creditworthiness before the Company’s standard payment and deliveryterms and conditions are offered. The Company’s review includes external ratings, whenavailable, and in some cases bank references. Purchase limits are established for eachcustomer, and these limits are reviewed periodically.
2) Investments
The credit risks exposure in the bank deposits, investments with fixed income and otherfinancial instruments are measured and monitored by the Company’s finance department.Since the Company’ s transaction counterparties and the contractually obligatedcounterparties are banks, financial institutes and corporate organizations with goodcredits, there are no compliance issues, and therefore, no significant credit risk.
3) Guarantees
Pursuant to the Company’s policies, it is only permissible to provide financial guaranteesto subsidiaries and companies that the Company has business with. As of December 31,
2016 and 2015, the guarantees provided to the subsidiaries amounted to $131,259 and
$6,849,639, respectively.
(iv) Liquidity risk
Liquidity risk is the risk that the Company will encounter difficulty in meeting the obligationsassociated with its financial liabilities which be settled by delivering cash or another financialasset.
The Company manages and maintains sufficient cash and cash equivalents so as to cope withits operations and mitigate the effects of fluctuations in cash flows. The Company’ smanagement supervises the banking facilities and ensures in compliance with the terms of theloan agreements. Please refer to notes (6)(k) and (6)(l) for unused credit lines of short-termand long-term borrowings as of December 31, 2016 and 2015.
(v) Market risk
Market risk is the risk that changes in market prices, such as foreign exchange rates, interestrates and equity prices which will affect the Company’s income or the value of its holdings offinancial instruments. The objective of market risk management is to manage and controlmarket risk exposures within acceptable parameters, while optimizing the return.
(Continued)
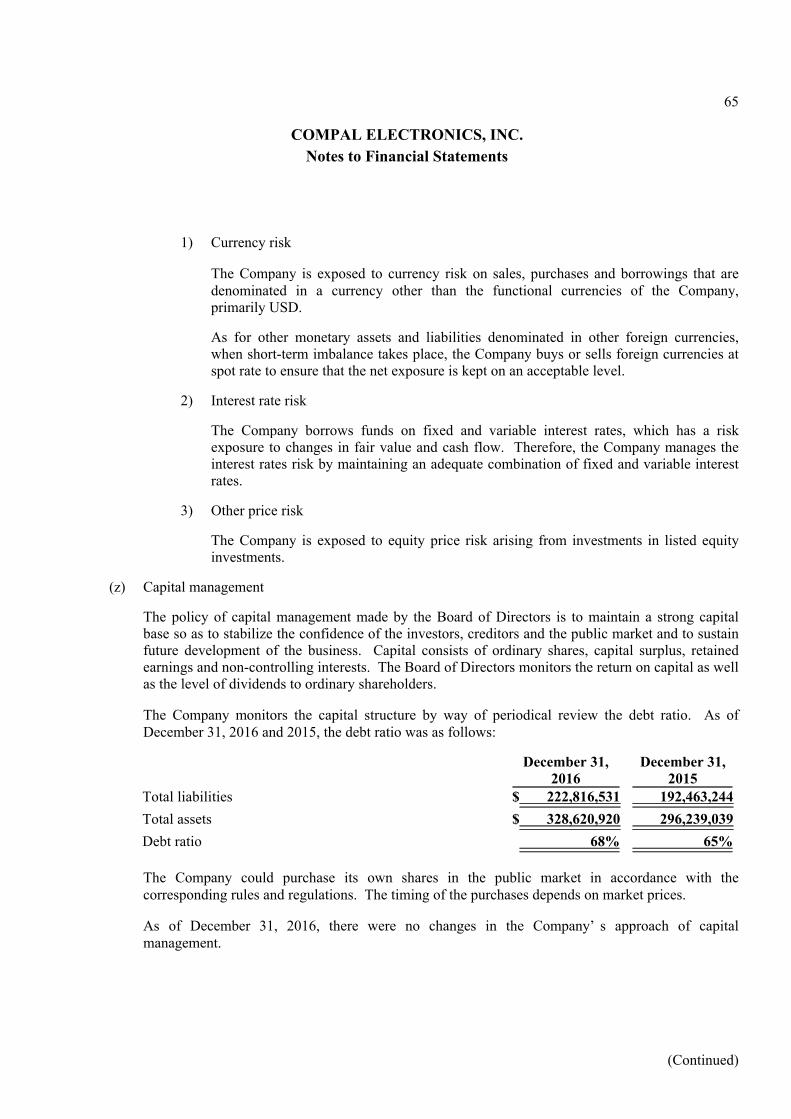
65
COMPAL ELECTRONICS, INC.
Notes to Financial Statements
1) Currency risk
The Company is exposed to currency risk on sales, purchases and borrowings that aredenominated in a currency other than the functional currencies of the Company,primarily USD.
As for other monetary assets and liabilities denominated in other foreign currencies,when short-term imbalance takes place, the Company buys or sells foreign currencies atspot rate to ensure that the net exposure is kept on an acceptable level.
2) Interest rate risk
The Company borrows funds on fixed and variable interest rates, which has a riskexposure to changes in fair value and cash flow. Therefore, the Company manages theinterest rates risk by maintaining an adequate combination of fixed and variable interestrates.
3) Other price risk
The Company is exposed to equity price risk arising from investments in listed equityinvestments.
(z) Capital management
The policy of capital management made by the Board of Directors is to maintain a strong capitalbase so as to stabilize the confidence of the investors, creditors and the public market and to sustainfuture development of the business. Capital consists of ordinary shares, capital surplus, retainedearnings and non-controlling interests. The Board of Directors monitors the return on capital as wellas the level of dividends to ordinary shareholders.
The Company monitors the capital structure by way of periodical review the debt ratio. As ofDecember 31, 2016 and 2015, the debt ratio was as follows:
December 31,2016
December 31,2015
Total liabilities $ 222,816,531 192,463,244
Total assets $ 328,620,920 296,239,039
Debt ratio 68% 65%
The Company could purchase its own shares in the public market in accordance with thecorresponding rules and regulations. The timing of the purchases depends on market prices.
As of December 31, 2016, there were no changes in the Company’ s approach of capitalmanagement.
(Continued)

66
COMPAL ELECTRONICS, INC.
Notes to Financial Statements
(7) Related-party transactions:
(a) Relationships between parent company and its subsidiaries
Ownership interestCountry of
incorporationDecember 31,
2016December 31,
2015
Panpal Technology Corp. (“Panpal”) Republic of China %100 %100
Gempal Technology Corp. (“Gempal”) Republic of China %100 %100
Hong Ji Capital Co., Ltd. (“Hong Ji”) Republic of China %100 %100
Hong Jin Investment Co., Ltd. (“Hong Jin”) Republic of China %100 %100
Zhaopal Republic of China %100 %100
Yongpal Republic of China %100 %100
Kaipal Republic of China %100 %100
Accesstek, Inc. (“ATK”) Republic of China %38 %38
Arcadyan Republic of China %36 %36
Rayonnant Technology Co., Ltd. (“RayonnantTechnology”)
Republic of China %100 %100
HengHao Technology Co., Ltd. (“HengHao”) Republic of China %97 %97
Ripal Optortronics Co., Ltd. (“Ripal”) Republic of China %100 %100
Auscom Engineering Inc. (“Auscom”) USA %100 %100
Just International Ltd. (“Just”) British Virgin Island %100 %100
Compal International Holding Co., Ltd. (“CIH”) British Virgin Island %100 %100
Compal Electronics (Holding) Ltd. (“CEH”) British Virgin Island %100 %100
Bizcom Electronics, Inc. (“Bizcom”) USA %100 %100
Flight Global Holding Inc. (“FGH”) British Virgin Island %100 %100
High Shine Industrial Corp. (“HSI”) British Virgin Island %100 %100
Compal Europe (Poland) Sp. z o.o. (“CEP”) Poland %100 %100
Big Chance International Co., Ltd. (“BCI”) British Virgin Island %100 %100
Compal Rayonnant Holdings Limited (“CRH”) British Virgin Island %100 %100
Core Profit Holdings Limited (“CORE”) British Virgin Island %100 %100
Compalead Electronics B.V. (“CPE”) Netherlands %100 %100
Compalead Eletronica do Brasil Industria e Comercio
Ltda. (“CEB”)
Brazil %100 %100
Compal Display Holding (HK) Limited (“CDH (HK)”) Hong Kong %100 %100
Compal Electronics International Ltd. (“CII”) British Virgin Island %100 %100
Compal International Ltd. (“CPI”) British Virgin Island %100 %100
(Continued)

67
COMPAL ELECTRONICS, INC.
Notes to Financial Statements
Ownership interestCountry of
incorporationDecember 31,
2016December 31,
2015
Compal Electronics (China) Co., Ltd. (“CPC”) People’s of Republicof China
%100 %100
Compal Optoelectronics (Kunshan) Co., Ltd. (“CPO”) People’s of Republicof China
%100 %100
Compal System Trading (Kunshan) Co., Ltd. (“CST”) People’s of Republicof China
%100 %100
Smart International Trading Ltd. (“Smart”) British Virgin Island %100 %100
Amexcom Electronics Inc. (“AEI”) USA %100 %100
Mexcom Electronics, LLC (“MEL”) USA %100 %100
Mexcom Technologies, LLC (“MTL”) USA %100 %100
CENA Electromex, S.A. de C.V. (“CMX”) Mexico %100 %100
Compal International Holding (HK) Limited (“CIH (HK)”)
Hong Kong %100 %100
Jenpal International Ltd. British Virgin Island %100 %100
Prospect Fortune Group Ltd. (“PFG”) British Virgin Island %100 %100
Compal Electronics Technology (Kunshan) Co., Ltd.
(“CET”)
People’s of Republic
of China
%100 %100
Compal Information (Kunshan) Co., Ltd. (“CIC”) People’s of Republic
of China
%100 %100
Compal Information Technology (Kunshan) Co., Ltd.
(“CIT”)
People’s of Republic
of China
%100 %100
Kunshan Botai Electronics Co., Ltd. (“BT”) People’s of Republic
of China
%100 %100
Compal Information Research and Development
(Nanjing) Co., Ltd. (“CIN”)
People’s of Republic
of China
%100 %100
Compal Digital Technology (Kunshan) Co., Ltd.
(“CDT”)
People’s of Republic
of China
%100 %100
Compower Global Service Co., Ltd. (“CGS”) People’s of Republic
of China
%100 %100
Compal Investment (Jiansu) Co., Ltd. (“CIJ”) People’s of Republic
of China
%100 %100
Compal Display Electronics (Kunshan) Co., ltd.
(“CDE”)
People’s of Republic
of China
%100 %100
Etrade Management Co., Ltd. (“Etrade”) British Virgin Island %100 %100
Webtek Technology Co., Ltd. (“Webtek”) British Virgin Island %100 %100
Forever Young Technology Inc. (“Forever”) British Virgin Island %100 %100
Unicom Global, Inc. (“UCGI”) Republic of China %100 %100
(Continued)

68
COMPAL ELECTRONICS, INC.
Notes to Financial Statements
Ownership interestCountry of
incorporationDecember 31,
2016December 31,
2015Palcom International Corporation (“Palcom”) Republic of China %100 %100
Compal Communication (Nanjing) Co., ltd. (“CCI
Nanjing”)
People’s of Republic
of China
%100 %100
Compal Digital Communication (Nanjing) Co., Ltd.
(“CDCN”)
People’s of Republic
of China
%100 %100
Compal Wireless Communication (Nanjing) Co., Ltd.
(“CWCN”)
People’s of Republic
of China
%100 %100
Hanhelt Communication (Nanjing) Co., Ltd. (“Hanhelt”) People’s of Republic
of China
%100 %100
Giant Rank Trading Ltd. (“GIA”) British Virgin Island %100 %100
OptoRite Inc. British Virgin Island %100 %100
MSI-ATK Otpics Holding Corporation (“MSI-ATK”) British Virgin Island %100 %100
Maitek (BVI) Corporation (“Maitek”) British Virgin Island %100 %100
Arcadyan Technology N.A. Corp. (“Arcadyan USA”) USA %100 %100
Arcadyan Germany Technology GmbH
(“Arcadyan Germany”)
Germany %100 %100
Arcadyan Technology Corporation Korea (“Arcadyan
Korea”)
Korea %100 %100
Arcadyan Holding (BVI) Corp. (“Arcadyan Holding”) British Virgin Island %100 %100
Arcadyan do Brasil Ltda. (“Arcadyan Brasil”) Brazil %99 %99
Arcadyan Technology Limited (“Arcadyan UK”) United Kingdom %100 -
Zhi-pal Technology Inc. (“Zhi-pal”) Republic of China %100 %100
Tatung Technology Inc. (“TTI”) Republic of China %60 %59
AcBel Telecom Inc. (“AcBel Telecom”) Republic of China %51 %51
CBN Republic of China %95 %99
Speedlink Tradings Limited (“Speedlink”) British Virgin Island %100 %100
Sinoprime Global Inc. (“Sinoprime”) British Virgin Island %100 %100
Arcadyan Technology (Shanghai) corp. (“SVA
Arcadyan”)
People’s of Republic
of China
%100 %100
Arch Holding (BVI) Corp. (“Arch”) British Virgin Island %100 %100
Compal Networking (Kunshan) Co., Ltd. (“CNC”) People’s of Republic
of China
%100 %100
Leading Images Ltd. (“Leading Images”) British Virgin Island %100 %100
(Continued)

69
COMPAL ELECTRONICS, INC.
Notes to Financial Statements
Ownership interestCountry of
incorporationDecember 31,
2016December 31,
2015Great Arch Group Ltd. (“Great Arch”) British Virgin Island %100 %100
Astoria Networks GmbH (“Astoria GmbH”) Germany %100 %100
Quest International Group Co., Ltd. (“Quest”) Samoa %100 %100
Exquisite Electronic Co., Ltd. (“Exquisite”) Samoa %100 %100
Tatung Home Appliances (Wujiang) Co., Ltd. (“THAC”) People’s of Republic
of China
%100 %100
Intelligent Universal Enterprise Ltd. (“IUE”) British Virgin Island %100 %100
Goal Reach Enterprises Ltd. (“Goal”) British Virgin Island %100 %100
Compal (Vietnam) Co., Ltd. (“CVC”) Vietnam %100 %100
Compal Development &Management (Vietnam) Co., Ltd.
(“CDM”)
Vietnam %100 %100
Allied Power Holding Corp. (“APH”) British Virgin Island %100 %100
Primetek Enterprises Limited (“PEL”) British Virgin Island %100 %100
Rayonnant Technology (HK) Co., Ltd. (“Rayonnant
Technology (HK)”)
Hong Kong %100 %100
Royonnant Technology (Taicang) Co., Ltd. (“Rayonnant
Technology (Taicang)”)
People’s of Republic
of China
%100 %100
HengHao Holdings A Co., Ltd. (“HHA”) British Virgin Island %100 %100
HengHao Holdings B Co., Ltd. (“HHB”) British Virgin Island %100 %100
HengHao Trading Co., Ltd. British Virgin Island %100 %100
HengHao Optoelectronics Technology (Kunshan) Co.,
Ltd.
People’s of Republic
of China
%100 %100
LUCOM Display Technology (Kunshan) Limited
(“Lucom”)
People’s of Republic
of China
%100 %100
Center Mind International Co., Ltd. (“CMI”) British Virgin Island %100 %100
Prisco International Co., Ltd. (“PRI”) British Virgin Island %100 %100
Compal Electronic (Sichuan) Co., Ltd. (“CIS”) People’s of Republic
of China
%100 %100
Compal Electronic (Chongqing) Co., Ltd. (“CEQ”) People’s of Republic
of China
%100 %100
Compal Electronic (Chengdu) Co., Ltd. (“CEC”) People’s of Republic
of China
%100 %100
Compal Management (Chengdu) Co., Ltd. (“CMC”) People’s of Republic
of China
%100 %100
(Continued)

70
COMPAL ELECTRONICS, INC.
Notes to Financial Statements
Ownership interestCountry of
incorporationDecember 31,
2016December 31,
2015Billion Sea Holdings Limited (“BSH”) British Virgin Island %100 %100
Compal Electronics Europe Sp. z. o.o. (“CEE”) Poland - %100
Fortune Way Technology Corp. (“FWT”) British Virgin Island %100 %100
GLB Republic of China %50 %50
Mactech Republic of China %53 %53
Rapha Bio Ltd. (“Rapha”) Republic of China %50 -
Compal Electronics India Private Limited (“CEIN”) India %100 -
(b) Parent company and ultimate controlling party
The Company is the ultimate controlling party of the Company and its subsidiaries.
(c) Transactions with key management personnel
Key management personnel compensation comprised:
2016 2015Short-term employee benefits $ 484,022 472,352
Post-employment benefits 6,163 5,510
Share-based payments 190,179 228,416
$ 680,364 706,278
There are no termination benefits and other long-term benefits. Please refer to notes (6)(r) for share-based payment.
(d) Significant related-party transactions
(i) Sale of goods to related parties
The amounts of significant sales transactions between the Company and related parties were asfollows:
2016 2015Subsidiaries $ 13,497,674 12,720,237
Associates 300 300
$ 13,497,974 12,720,537
Sales prices for related parties were similar to those of the third-party customers. Thecollection period was 45~180 days for related parties.
(Continued)

71
COMPAL ELECTRONICS, INC.
Notes to Financial Statements
(ii) Purchase of goods from related parties
The amounts of significant purchase transactions between the Company and related partieswere as follows:
2016 2015Subsidiaries $ 206,093,571 215,705,847
Associates 623 -
$ 206,094,194 215,705,847
Purchase prices for finished goods and raw materials from related parties were similar to thosefrom third-party suppliers. The payment period was 60~120 days for related parties.
(iii) Product warranty service expenses
The product warranty service expenses paid to related parties for the years ended December31, 2016 and 2015, amounted to $287,040 and $219,010, respectively. As of December 31,2016 and 2015, the unpaid warranty service expenses were record as other payables.
(iv) Technical service expense
The Company engaged its subsidiaries and associates to research and develop notebooks, andthe related technical service expenses for the years ended December 31, 2016 and 2015,amounted to $171,795 and $206,809, respectively. As of December 31, 2016 and 2015, theunpaid technical service expenses were recorded as other payables.
(v) Rental income
The Company entered into agreements with related parties to lease a portion of its office space,plant and equipments. The rental income is collected monthly. The related rental income forthe years ended December 31, 2016 and 2015, amounted to $137 and $411, respectively. As ofDecember 31, 2016 and 2015, the unreceived rental income receivables were recorded as otherreceivables.
(vi) Loan to related parties
The interest rate of unsecured loans to subsidiaries was 1.5%, and the Company did notrecognize the bad debt expenses. As of December 31, 2016 and 2015, the loans due to relatedparties were recorded as other receivables.
(Continued)

72
COMPAL ELECTRONICS, INC.
Notes to Financial Statements
(vii) Receivables due from relate parties
The receivables arising from the transactions mentioned above, the sale of machinery andequipment to related parties, and the purchasing of machinery, equipment and others on behalfof the related parties as of December 31, 2016 and 2015, were as follows:
AccountRelated party
categoriesDecember 31,
2016December 31,
2015Notes and accounts receivable Subsidiaries $ 2,177,705 973,946
Other receivables Subsidiaries 325,242 304,187
Other receivables Associates 223 339
2,503,170 1,278,472
Less: Credit balance of investmentsaccounted for using equitymethod (93,954) (209)
$ 2,409,216 1,278,263
As of December 31, 2016 and 2015, the Company’s investment accounted for using the equitymethod in subsidiaries was a credit balance, recorded as a deduction from other receivables –
related party (other financial assets – current). The credit balance of investment was $93,954
and $209, respectively. Please refer to note (6)(g).
(viii) Payables to related parties
The payables to related parties as of December 31, 2016 and 2015, were as follows:
AccountRelated party
categoriesDecember 31,
2016December 31,
2015Notes and accounts payable Subsidiaries $ 73,903,066 62,361,931
Other payables Subsidiaries 193,021 208,552
Other payables Associates 474 15,925
$ 74,096,561 62,586,408
(ix) Guarantees
As of December 31, 2016 and 2015, the guarantees provided to subsidiaries were $131,259 and
$6,849,639, respectively.
(Continued)

73
COMPAL ELECTRONICS, INC.
Notes to Financial Statements
(8) Pledged assets: None
(9) Commitments and contingencies:
The Company entered into various patent license agreements with third parties, and was required to makeroyalty payments of a predetermined amount periodically.
(10) Losses due to major disasters: None
(11) Subsequent events:
(a) The appeal between of the Company and Tatung in respect of the CPT shares obtained via theprivate placement was final dismissed on January 11, 2017. The Company and its subsidiaries havesold the entire shares of CPT to Tatung on February 9, 2017. Please refer to note (6)(b).
(b) The Company is optimistic about the future growth of IoT, Smart Cloud and the smart productsmarket, and to deepen customer relationship, the Board of Directors of CIT, a 100% subsidiary ofthe Company, decided to purchase the newly issued shares of Leshi Zhixin Electronic Technology(Tianijn) Limited. on March 28, 2017. The total amount of the investment is CNY 700,000thousands, and the expected ownership interest will be 2.1507%. The investment will be completedby June 21, 2017 (or other date with mutual consent).
(12) Other:
The employee benefits, depreciation and amortization expenses by categorized function are summarized asfollows:
By function 2016 2015
By itemCost of sales Operating
expenses TotalCost of sales Operating
expenses TotalEmployee benefits
Salary 292,568 7,879,161 8,171,729 159,642 7,931,699 8,091,341
Labor and health insurance 22,532 487,662 510,194 9,961 478,879 488,840
Pension 10,556 281,564 292,120 6,501 274,547 281,048
Others 100,553 383,597 484,150 9,649 358,310 367,959
Depreciation 11,563 197,754 209,317 2,392 191,606 193,998
Amortization 10,067 390,271 400,338 11,482 493,016 504,498
The Company had 6,474 and 6,101 employees as of December 31, 2016 and 2015, respectively.
(Continued)

74
COMPAL ELECTRONICS, INC.
Notes to Financial Statements
(13) Other disclosures:
(a) Information on significant transactions:
The following is the information on significant transactions required by the “Regulations Governingthe Preparation of Financial Reports by Securities Issuers” for the Company:
(i) Loans to other parties:
(In Thousands of New Taiwan Dollars)
Highest Collateral
NoName oflender
Name ofborrower
Accountname
Relatedparty
balance offinancing toother partiesduring the
periodEndingbalance
Actualusage
amountduring the
period
Range ofinterest rates
during theperiod
Purposes offund
financing forthe borrower
Transactionamount for
businessbetween two
parties
Reasonsfor
short-termfinancing
Allowancefor bad debt Item Value
Individual funding loan
limits
Maximumlimit of fund
financing
0 The
Company
HengHao Other
receivables
Y 426,987 209,594 209,594 1.50% Short-termfinancing
- Operatingdemand
- - - 1,718,585 42,321,755(Note 1)
1 CIH CEP 〃 Y 117,075 112,875 64,500 2.50% 〃 - 〃 - - - 31,760,261 31,760,261(Note 2)
2 CPI CEB 〃 Y 498,600 483,750 483,750 2.50% 〃 - 〃 - - - 945,164 945,164(Note 3)
3 Bizcom CEP 〃 Y 50,175 - - 2.00% 〃 - 〃 - - - 442,853 442,853(Note 4)
4 CPC CDE 〃 Y 915,120 - - 3.00% 〃 - 〃 - - - 2,713,573 2,713,573(Note 5)
5 CIC CWCN 〃 Y 2,491,160 - - 3.00% 〃 - 〃 - - - 6,576,827 6,576,827(Note 6)
6 CEC CCI Nanjing 〃 Y 4,599,000 2,257,500 - 2.50% 〃 - 〃 - - - 3,596,144 3,596,144(Note 7)
7 CIT CCI Nanjing 〃 Y 2,257,500 2,257,500 2,257,500 2.50% 〃 - 〃 - - - 18,478,884 18,478,884(Note 8)
8 Arcadyan
Holding
CNC 〃 Y 567,120 - - 1.00% 〃 - Cash flowdemand
- - - 873,126 873,126(Note 9)
9 Arcadyan Acradyan
Brasil
〃 Y 261,000 258,000 29,025 1.00% Transactionfor businessbetween twoparties
322,500 - - - - 258,000 3,480,511(Note 10)
10 Mactech WINTEK
Corporation
〃 Y 60,000 60,000 60,000 2.41% 〃 78,626 - 60,000 - - 62,900 227,828(Note 11)
Note 1: According to the Company’ s Procedures for Lending Funds to Other Parties, the total amount of loans to others shall not exceed 40% of the net worth of theCompany. When a short-term financing facility with the Company is necessary, the total amount for lending to any company shall not exceed 80% of the borrower’snet worth, nor shall it be more than 50% of the Company’s lendable amount limit, and shall be combined with the company’s endorsements/guarantees for calculation.In addition, the total amount lendable to 100% directly or indirectly owned subsidiaries by the Company is unrestricted by the aforesaid restriction of 80%, but themaximum amount shall not exceed 50% of the Company’s lendable limit, and shall be combined with the company’s amount of loans to others when calculating.
Note 2. According to CIH’s Procedures for Lending Funds to Other Parties, the total amount of loans to others shall not exceed 40% of the net worth of CIH. When a short-term financing facility with CIH is necessary, the total amount for lending the borrower shall not exceed 80% of the borrower’s net worth, nor shall it exceed 50% ofCIH’s total amount of lendable capital, and shall be combined with the company’s endorsements/guarantees for calculation. In addition, when lending to the ultimateparent company’s 100% directly or indirectly owned overseas subsidiaries, the total amount of loans is not limited by the two aforesaid restrictions, but the maximumamount shall not exceed the net worth of CIH, and shall be combined with the company’s endorsements/guarantees for the borrower when calculating.
Note 3. According to CPI’s Procedures for Lending Funds to Other Parties, the total amount of loans to others shall not exceed 40% of the net worth of CPI. When a short-term financing facility with CPI is necessary, the total amount for lending the borrower shall not exceed 80% of the borrower’s net worth, nor shall it exceed 50% ofCPI’s total amount of lendable capital, and shall be combined with the company’s endorsements/guarantees for calculation. In addition, when lending to the ultimateparent company’s 100% directly or indirectly owned overseas subsidiaries, the total amount of loans is not limited by the two aforesaid restrictions, but the maximumamount shall not exceed the net worth of CPI, and shall be combined with the company’s endorsements/guarantees for the borrower when calculating.
Note 4. According to Bizcom’s Procedures for Lending Funds to Other Parties, the total amount of loans to others shall not exceed 40% of the net worth of Bizcom. When ashort-term financing facility with Bizcom is necessary, the total amount for lending the borrower shall not exceed 80% of the borrower’s net worth, nor shall it exceed50% of Bizcom’s total amount of lendable capital, and shall be combined with the company’s endorsements/guarantees for calculation. In addition, when lending tothe ultimate parent company’s 100% directly or indirectly owned overseas subsidiaries, the total amount of loans is not limited by the two aforesaid restrictions, butthe maximum amount shall not exceed the net worth of Bizcom, and shall be combined with the company’ s endorsements/guarantees for the borrower whencalculating.
Note 5. According to CPC’s Procedures for Lending Funds to Other Parties, the total amount of loans to others shall not exceed 40% of the net worth of CPC. When a short-term financing facility with CPC is necessary, the total amount for lending the borrower shall not exceed 80% of the borrower’s net worth, nor shall it exceed 50% ofCPC’s total amount of lendable capital, and shall be combined with the company’s endorsements/guarantees for calculation. In addition, when lending to the ultimateparent company’s 100% directly or indirectly owned overseas subsidiaries, the total amount of loans is not limited by the two aforesaid restrictions, but the maximumamount shall not exceed the net worth of CPC, and shall be combined with the company’s endorsements/guarantees for the borrower when calculating.
(Continued)

75
COMPAL ELECTRONICS, INC.
Notes to Financial Statements
Note 6. According to CIC’s Procedures for Lending Funds to Other Parties, the total amount of loans to others shall not exceed 40% of the net worth of CIC. When a short-term financing facility with CIC is necessary, the total amount for lending the borrower shall not exceed 80% of the borrower’s net worth, nor shall it exceed 50% ofCIC’s total amount of capital lent, and shall be combined with the company’s endorsements/guarantees for calculation. In addition, when lending to the ultimateparent company’s 100% directly or indirectly owned overseas subsidiaries, the total amount of loans is not limited by the two aforesaid restrictions, but the maximumamount shall not exceed the net worth of CIC, and shall be combined with the company’s endorsements/guarantees for the borrower when calculating.
Note 7. According to CEC’s Procedures for Lending Funds to Other Parties, the total amount of loans to others shall not exceed 40% of the net worth of CEC. When a short-term financing facility with CEC is necessary, the total amount for lending the borrower shall not exceed 80% of the borrower’s net worth, nor shall it exceed 50% ofCEC’s total amount of capital lent, and shall be combined with the company’s endorsements/guarantees for calculation. In addition, when lending to the ultimateparent company’s 100% directly or indirectly owned overseas subsidiaries, the total amount of loans is not limited by the two aforesaid restrictions, but the maximumamount shall not exceed the net worth of CEC, and shall be combined with the company’s endorsements/guarantees for the borrower when calculating.
Note 8. According to CIT’s Procedures for Lending Funds to Other Parties, the total amount of loans to others shall not exceed 40% of the net worth of CIT. When a short-term financing facility with CIT is necessary, the total amount for lending the borrower shall not exceed 80% of the borrower’s net worth, nor shall it exceed 50% ofCIT’s total amount of capital lent, and shall be combined with the company’s endorsements/guarantees for calculation. In addition, when lending to the ultimate parentcompany’s 100% directly or indirectly owned overseas subsidiaries, the total amount of loans is not limited by the two aforesaid restrictions, but the maximum amountshall not exceed the net worth of CIT, and shall be combined with the company’s endorsements/guarantees for the borrower when calculating.
Note 9. According to Arcadyan Holding’s Procedures for Lending Funds to Other Parties, the total amount of loans to others shall not exceed 40% of the net worth ofArcadyan Holding. When a short-term financing facility with Arcadyan Holding is necessary, the borrower should be its investee. The total amount for lending theborrower shall not exceed the net worth of Arcadyan Holding, and shall be combined with the Arcadyan’ s endorsements/guarantees for the borrower whencalculating.
Note 10. According to Arcadyan’s Procedures for Lending Funds to Other Parties, the total amount of loans to others shall not exceed 40% of the net worth of Arcadyan. Toborrowers having business relationship with Arcadyan, the total amount for lending the borrower shall not exceed 80% of the transaction amount in the last fiscalyear or the expecting amount for the current year, nor shall it exceed 20% of the net worth of Arcadyan. Also, the amount shall be combined with the Arcadyan’sendorsements/guarantees for the borrower when calculating. When a short-term financing facility is necessary, the borrower should be Arcadyan’s investee. The totalamount for lending the borrower shall not exceed 80% of the net worth of the borrower, nor shall it exceed 20% of the net worth of Arcadyan, and shall be combinedwith the Arcadyan’s endorsements/guarantees for the borrower when calculating.
Note 11: According to Mactech’s Procedures for Lending Funds to Other Parties and Endorsements/Guarantees, the total amount of loans to others shall not exceed 10% ofthe net worth of Mactech as of the last fiscal year. To companies having business relationship with Mactech, the total amount for lending the borrower shall notexceed 80% of the transaction amount in the last fiscal year or the expecting amount for the current year, not shall it exceed 50% of the net worth of the borrower.Also, the amount shall be combined with the Mactech’s endorsements/guarantees for the borrower when calculating.
(ii) Guarantees and endorsements for other parties:
(In Thousands of New Taiwan Dollars)
Counter-party of guarantee and endorsement Limitation on Highest
Balance ofguarantees
Ratio ofaccumulatedamounts of
guarantees and
Parentcompany
endorsements/ Subsidiary
endorsements/Endorsements/guarantees to
No. Name ofguarantor Name
Relationshipwith the
Company
amount ofguarantees and endorsementsfor a specific
enterprise
balance forguarantees andendorsements
during the period
andendorsements
as ofreporting
date
Actualusage
amountduring the
period
Propertypledged for
guarantees andendorsements
(Amount)
endorsementsto net worth of
the latestfinancial
statements
Maximum amount forguarantees
andendorsements
guaranteesto third
parties onbehalf of
subsidiary
guaranteesto third
parties onbehalf of parent
company
third partieson behalf of
companies inMainland
China
0 The
Company
CEB (Note 3) 26,451,097 5,723,445 64,500 64,500 - %0.06 52,902,194(Note 1)
Y - -
0 〃 CEP (Note 2) 26,451,097 94,644 66,759 66,759 - %0.06 52,902,194(Note 1)
Y - -
1 Arcadyan Arcadyan
Brasil
(Note 2) 1,160,170 261,000 258,000 - - %2.97 3,480,511(Note 4)
Y - -
Note 1: According to the Company’s Procedures for Endorsement and Guarantee, the total amount of endorsements/ guarantees the Company or the Group is permitted tomake shall not exceed 50% of the Company’s net worth. Endorsements/ guarantees the Company and the Group is permitted to make for a single company shall notexceed 25% of the Company’s net worth. For entities having business relationship with the Company, the amount of endorsements/guarantees for a single company shallnot exceed 80% of the transaction amount in the last fiscal year or the expecting amount of the current year, and shall be combined with the amount lend to others whencalculating. The amount of endorsements/ guarantees permitted to make between subsidiaries whose over 90% of its voting shares are owned, directly or indirectly, bythe Company shall be no more than 10% of the net worth of the Company. The amount of endorsements/ guarantees permitted to make between directly or indirectlywholly owned subsidiaries is not limited by the aforementioned restriction, only the maximum amount shall be no more than 25 % of the net worth of the Company.
Note 2: Subsidiary whose over 50% common stock is directly owned.Note 3: Subsidiary whose over 50% common stock is indirectly owned.Note 4: According to Arcadyan’s Procedures for Endorsements and Guarantee, the total amount shall not exceed 40% of the net worth for latest financial statements audited or
reviewed by Certified Public Accountants, and the amount for a single company shall not exceed 1/3 of the total amount.
(Continued)

76
COMPAL ELECTRONICS, INC.
Notes to Financial Statements
(iii) Securities held as of December 31, 2016 (excluding investment in subsidiaries, associates andjoint ventures):
(In Thousands of New Taiwan Dollars)
Ending balance
Name ofholder
Category and name of security
Relationshipwith security
issuer
Accountname
Shares/Units(thousands)
Carryingvalue
Holdingpercentage
(%)
Fair value Note
The Company Common bond-Taiwan Star - Bond investment withoutan active market-currentand non-current
- 1,050,000 - -
Taiwan Star - Available- for-salefinancial assets-non-current
98,046 980,465 3% 980,465
CPT - ″ 394,086 811,000 6% 811,000
Kinpo Electronics, Inc. (“Kinpo”) The samechairman of theboard of theCompany
″ 124,044 1,476,121 9% 1,476,121
Cal-Comp Electronics (Thailand)Public Co., Ltd.
″ ″ 239,631 582,303 5% 582,303
Innolux Corporation (“Innolux”) - ″ 134,877 1,564,577 1% 1,564,577
Chipbond Technology Corp.(“Chipbond”)
- ″ 13,542 622,257 2% 622,257
HWA VI Venture Capital Corp. - ″ 290 28,330 10% 28,330
HWA Chi Venture Capital Corp. - ″ 1,053 29,916 11% 29,916
Global BioPharma, Inc. - ″ 2,000 40,000 3% 40,000
Chen Feng Optoelectronics - ″ 5,829 41,329 13% 41,329
PrimeSensor Technology Inc. - Financial assets at cost-non-current
233 2,333 1% - (Note 1)
Macroblock, Inc. - Available- for-salefinancial assets-current
682 48,631 2% 48,631
Others 172,904
Total 6,400,166
Panpal Compal Electronics, Inc. The parentcompany
Available- for-salefinancial assets-non-current
31,648 583,907 1% 583,907
Kinpo With the samechairman of theboard
″ 23,172 275,753 2% 275,753
CDIB Partners Investment HoldingCorp.
- ″ 54,000 711,180 5% 711,180
Innolux - ″ 11,836 137,296 - 137,296
AcBel Polytech Inc. (“AcBel”) With the samechairman of theboard
″ 5,677 136,524 1% 136,524
Chipbond - ″ 5,251 241,282 1% 241,282
Taiwan Biotech Co., Ltd. - ″ 4,897 46,537 3% 46,537
Others 112,263
Total 2,244,742
Gempal Compal Electronics, Inc. The parentcompany
Available- for-salefinancial assets-non-current
18,369 338,914 - 338,914
Lian Hong Art. Co., Ltd. - ″ 2,140 44,101 8% 44,101
Global BioPharma, Inc. - ″ 2,000 40,000 3% 40,000
Others 2,981
Total 425,996
Hong Ji SUYIN Optronics Co., Ltd. (“SuyinOptronics”)
- Available- for-salefinancial assets-non-current
380 182 1% 182
Hong Jin Suyin Optronics - Available- for-salefinancial assets-non-current
332 160 1% 160
(Continued)

77
COMPAL ELECTRONICS, INC.
Notes to Financial Statements
Ending balance
Name ofholder
Category and name of security
Relationshipwith security
issuer
Accountname
Shares/Units(thousands)
Carryingvalue
Holdingpercentage
(%)
Fair value Note
Zhaopal CPT - Available- for-salefinancial assets-non-current
315,269 648,000 5% 648,000
Yongpal CPT - Available- for-salefinancial assets-non-current
275,860 568,000 4% 568,000
Kaipal CPT - Available- for-salefinancial assets-non-current
118,226 243,000 2% 243,000
Arcadyan GeoThings Inc. - Financial assets carriedat cost-non-current
200 - 9% - (Note 1)
AirHop Communication Inc. - ″ 1,152 - 7% - ″
Adant Technologies Inc. - ″ 349 12,960 6% - ″
IOT EYE, Inc. - ″ 60 4,878 6% - ″
TIEF Fund, L.P - ″ - 48,709 - - ″
Total 66,547
Mactech Taichung International Golf CountryClub
- Financial assets carriedat cost-non-current
- 2,940 - - ″
CET Changchun Trarrii ElectronicTechnology Co., Ltd
- Financial assets carriedat cost-non-current
1,000 - 17% - ″
HHB HWALLAR OPTRONICS(FUZHOU) CO. LTD.
- Available- for-salefinancial assets-non-current
- - 19% -
Note 1: The carrying value is the balance after deducting accumulated impairment.
(iv) Individual securities acquired or disposed of with accumulated amount exceeding the lower ofNT$300 million or 20% of the capital stock:
(In Thousands of New Taiwan Dollars)
Beginning Balance Purchases Sales Others Ending Balance
Name ofcompany
Category andname ofsecurity
Accountname
Name of counter-party
Relationshipwith thecompany
Shares Amount Shares Amount Shares Price CostGain (loss)on disposal
(Note 2)Shares
Amount(Note 1) Shares Amount
Panpal Compliance
Certification
Services Inc.
Investments
accounted for
using equity
method
SGS Taiwan - 13,217 256,028 - - 13,217 345,026 221,385 71,882 - (34,643) - -
Note 1: Others are cash dividends, capital reserve, adjustments of foreign currency exchange, and investment income (loss) accounted for using equity method.Note 2: Excluding unrecognized gains on disposals amounting to $51,754 and others.
(v) Acquisition of individual real estate with amount exceeding the lower of NT$300 million or20% of the capital stock: None
(vi) Disposal of individual real estate with amount exceeding the lower of NT$300 million or 20%of the capital stock: None
(Continued)

78
COMPAL ELECTRONICS, INC.
Notes to Financial Statements
(vii) Related-party transactions for purchases and sales with amounts exceeding the lower ofNT$300 million or 20% of the capital stock:
(In Thousands of New Taiwan Dollars)
Transaction detailsTransactions with terms
different from othersNotes/Accounts
receivable (payable)
CompanyName
Counterparty
Nature ofrelationship
Purchase/(Sale) Amount
Percentageof total
purchases/(sales) Payment terms Unit price Payment Terms
EndingBalance
Percentageof totalnotes/
accountsreceivable(payable) Note
TheCompany
CIH and itssubsidiaries
Subsidiaries whollyowned by theCompany
Sale (6,531,355) (0.9)% 120 days Similar to non-related parties
There is nosignificantdifference, andadjustments willbe made based ondemand forfunding ifnecessary
161,599 0.1 %
UCGI ″ Sale (144,517) - ″ ″ ″ 118,056 0.1 %
CBN The Company’ssubsidiary
Sale (6,676,590) (0.9)% 90 days ″ There is nosignificantdifference
1,863,084 1.1 %
CIH and itssubsidiaries
Subsidiaries whollyowned by theCompany
Purchase 106,575,472 15.1 % 120 days Similar to non-related parties
There is nosignificantdifference, andadjustments willbe made based ondemand forfunding ifnecessary
(55,486,861) (37.9)%
Just and itssubsidiaries
″ Purchase 2,863,979 0.4 % ″ ″ ″ (545,751) (0.4)%
BCI and itssubsidiaries
″ Purchase 371,809 0.1 % ″ ″ ″ (165,944) (0.1)%
CEE The Company’ssubsidiary
Purchase 490,666 0.1 % 90 days ″ ″ - -
Webtek Subsidiary whollyowned by theCompany
Purchase 35,190,480 5.0 % Net 60 days frompurchase
Markup basedon Webtek’scost
″ (4,569,577) (3.1)%
Forever ″ Purchase 60,596,643 8.6 % ″ Markup basedon Forever’scost
″ (13,093,945) (8.9)%
Just and itssubsidiaries
CompalElectronic,Inc.
Parent company Sale (2,767,997) (13.1)% 120 days Similar to non-related parties
There is nosignificantdifference, andadjustments willbe made based ondemand forfunding ifnecessary
545,751 16.1 %
Forever With the sameultimate parentcompany
Sale (18,216,812) (86.4)% Net 60 days fromdelivery
″ Adjustments willbe made based ondemand forfunding
1,504,592 45.5 %
CIH and itssubsidiaries
CompalElectronic,Inc.
Parent Company Sale (106,842,119) (70.4)% 120 days ″ There is nosignificantdifference, andadjustments willbe made based ondemand forfunding ifnecessary
55,486,861 87.2 %
Forever With the sameultimate parentcompany
Sale (42,288,665) (28.0)% Net 60 days fromdelivery
According tomarkup pricing
Adjustments willbe made based ondemand forfunding
6,862,123 10.8 %
(Continued)

79
COMPAL ELECTRONICS, INC.
Notes to Financial Statements
CompanyName
Counterparty
Nature ofrelationship
Purchase/(Sale) Amount
Percentageof total
purchases/(sales) Payment terms Unit price Payment Terms
EndingBalance
Percentageof totalnotes/
accountsreceivable(payable) Note
CBN CompalElectronic,Inc.
Parent company Purchase 4,035,219 62.0 % 90 days Similar to non-related parties
There is nosignificantdifference
(1,871,773) (81.0)%
BCI and itssubsidiaries
CompalElectronic,Inc.
″ Sale (368,550) (5.0)% 120 days Similar to non-related parties
There is nosignificantdifference, andadjustments willbe made based ondemand forfunding ifnecessary
165,944 3.0 %
CIH and itssubsidiaries
With the sameultimate parentcompany
Sale (6,538,895) (87.9)% ″ ″ ″ 4,577,855 83.0 %
CEB ″ Sale (504,831) (7.1)% ″ ″ ″ 254,936 14.0 %
CEE CompalElectronic,Inc.
Parent company Sale (373,335) (23.5)% 90 days ″ ″ - - %
Webtek CompalElectronic,Inc.
″ Sale (35,190,480) (100.0)% Net 60 days fromdelivery
According tomarkup pricing
Adjustments willbe made based ondemand forfunding
4,569,567 100.0 %
CWCN With the sameultimate parentcompany
Purchase 35,190,480 100.0 % Net 60 days fromdelivery
″ ″ (3,938,080) (100.0)%
CEB BCI and itssubsidiaries
Parent company Purchase 507,200 9.9 % 120 days Similar to non-related parties
There is nosignificantdifference
(243,656) (42.7)%
CIH and itssubsidiaries
CompalElectronic,Inc.
″ Purchase 6,567,047 4.9 % ″ ″ ″ (159,998) (0.4)%
BCI and itssubsidiaries
With the sameultimate parentcompany
Purchase 6,538,895 4.9 % ″ ″ ″ (4,577,855) (10.6)%
AcBel anditssubsidiaries
The same chairmanof the board of theultimate parentcompany
Purchase 703,441 0.5 % Net 60 days frompurchase
″ ″ (345,946) (0.8)%
Wan YuenTechnologyHolding Ltd.and itssubsidiaries
Investee whichFGH accounted forusing equity method
Purchase 4,427,581 3.3 % Net 60 days frompurchase
Similar to non-related parties
There is nosignificantdifference
(1,321,702) (3.1)%
CWCN Webtek With the sameultimate parentcompany
Sale (35,190,480) (100.0)% Net 60 days fromdelivery
According tomarkup pricing
Adjustments willbe made based ondemand forfunding
3,938,080 100.0 %
Forever CompalElectronic,Inc.
Parent company Sale (60,596,643) (86.2)% ″ ″ ″ 15,459,779 84.4 %
CIH and itssubsidiaries
With the sameultimate parentcompany
Purchase 42,288,665 60.2 % Net 60 days frompurchase
Similar to non-related parties
″ (6,861,091) (42.2)%
Just and itssubsidiaries
″ Purchase 18,216,812 26.0 % ″ ″ ″ (1,504,237) (9.3)%
UCGI CompalElectronic,Inc.
Parent company Purchase 151,443 100.0 % Net 120 days fromdelivery
″ There is nosignificantdifference
(40,843) (100.0)%
THAC TTI With the sameultimate parentcompany
Sale (438,749) (77.0)% Net 60 days frominvoice date
According tomarkup pricing
- 77,193 88.0 %
TTI THAC ″ Purchase 438,749 14.0 % ″ - - (77,193) (8.0)%
THAC TTI ″ Purchase 127,045 36.0 % Net 90 days from theend of the month of
delivery
- - (13,809) (12.0)%
TTI THAC ″ Sale (127,045) (4.0)% ″ According tomarkup pricing
- 13,809 1.0 %
(Continued)

80
COMPAL ELECTRONICS, INC.
Notes to Financial Statements
CompanyName
Counterparty
Nature ofrelationship
Purchase/(Sale) Amount
Percentageof total
purchases/(sales) Payment terms Unit price Payment Terms
EndingBalance
Percentageof totalnotes/
accountsreceivable(payable) Note
Arcadyan ArcadyanGermany
Arcadyan’ssubsidiaries
Sale (1,533,209) (7.0)% Net 120 days fromdelivery
- - 415,593 10.0 %
ArcadyanUSA
″ Sale (426,175) (2.0)% Net 60 days from theend of the month of
delivery
- - 125,458 3.0 %
Sinoprime Arcadyan The Company’ssubsidiaries
Sale (10,340,227) (100.0)% Net 45 days from theend of the month of
delivery
According tomarkup pricing
- 1,515,688 65.0 % (Note1)
CNC Sinoprime With the sameultimate parentcompany
Sale (10,340,227) (100.0)% ″ ″ - 1,439,174 31.0 % 〃
ArcadyanGermany
Arcadyan The Company’ssubsidiaries
Purchase 1,533,209 100.0 % Net 120 days fromdelivery
- - (415,593) (100.0)%
ArcadyanUSA
Arcadyan ″ Purchase 426,175 100.0 % Net 60 days from theend of the month of
delivery
- - (125,458) (100.0)%
Arcadyan Sinoprime Arcadyan’ssubsidiaries
Purchase 10,340,227 40.0 % Net 45 days from theend of the month of
delivery
According tomarkup pricing
- (1,515,688) (42.0)% (Note1)
Sinoprime CNC With the sameultimate parentcompany
Purchase 10,340,227 100.0 % ″ ″ - (1,439,174) (100.0)% 〃
Note 1: The ending balance is from the transactions of processing and sales of raw material.
(viii) Receivables from related parties with amounts exceeding the lower of NT$100 million or 20%of the capital stock:
(In Thousands of New Taiwan Dollars)
Name of Nature of Ending Turnover OverdueAmounts
received in Allowance
company Counter-party relationship balance rate Amount Action takensubsequent
periodfor baddebts Note
The Company CBN The Company’ssubsidiary
1,863,084 5.16 - - 472,274(Note 1)
-
″ CIH and itssubsidiaries
The Company’ssubsidiary
161,599 39.53 - - 728(Note 1)
-
″ UCGI The Company’ssubsidiary
118,056 1.22 - - -(Note 1)
-
Just and itssubsidiaries
Compal Electronic,Inc.
Parent company 545,751 2.27 - - -(Note 1)
-
″ Forever With the sameultimate parent
1,504,592 12.11 - - 1,493,498(Note 1)
-
CIH and itssubsidiaries
Compal Electronic,Inc.
Parent company 55,486,861 2.28 - - 35,091,024(Note 1)
-
″ Forever With the sameultimate parent
6,862,123 4.49 - - 6,862,123(Note 1)
-
BCI and itssubsidiaries
Compal Electronic,Inc.
Parent company 165,944 1.66 - - 54,252(Note 1)
-
″ CIH and itssubsidiaries
With the sameultimate parentcompany
4,577,855 1.61 - - 2,069,546(Note 1)
-
″ CEB With the sameultimate parentcompany
254,936 1.75 - - 90,360(Note 1)
-
Forever Compal Electronic,Inc.
Parent company 15,459,779 4.07 - - 13,034,160(Note 1)
-
CWCN Webtek With the sameultimate parentcompany
3,938,080 6.66 - - 3,937,725(Note 1)
-
Webtek Compal Electronic,Inc.
Parent company 4,569,567 5.93 - - 4,569,212(Note 1)
-
(Continued)

81
COMPAL ELECTRONICS, INC.
Notes to Financial Statements
Name of Nature of Ending Turnover OverdueAmounts
received in Allowance
company Counter-party relationship balance rate Amount Action takensubsequent
periodfor baddebts Note
Arcadyan Arcadyan Germany Arcadyan’ssubsidiary
415,593 2.62 - - -(Note 2)
-
″ Arcadyan USA Arcadyan’ssubsidiary
125,458 3.40 - - 29,589(Note 2)
-
″ TTI Arcadyan’ssubsidiary
163,745 0.03 - - -(Note 2)
-
Sinoprime Arcadyan The Company’ssubsidiary
1,515,688 6.97 - - 891,527(Note 2)
-
CNC Sinoprime With the sameultimate parentcompany
1,439,174 7.32 - - 891,527(Note 2)
-
CBN Speedlink With the sameultimate parentcompany
751,288 - 48,288 - 751,288(Note 1)
-
Speedlink Just and itssubsidiaries
With the sameultimate parentcompany
751,288 - 48,288 Enhanced thecollection
751,288(Note 1)
-
Note 1: Balance as of March 17, 2017.Note 2: Balance as of February 9, 2017.
(ix) Trading in derivative instruments: Please refer to notes (6)(b) and (6)(c).
(b) Information on investees:
The following is the information on investees for the year ended December 31, 2016 (excluding information oninvestees in Mainland China):
(In Thousands of New Taiwan Dollars or US Dollars)
Investor Investee Main Original Investment Amount Ending Balance Net income Share of
Company Company Location Businesses and Products
December 31,2016
December 31,2015
Shares(thousand)
Percentage ofOwnership
CarryingValue
(losses)of investee
profits/losses ofinvestee Note
TheCompany
Bizcom Milpitas, USA Warranty services andmarketing of LCD TV sand notebook PCs
36,369 36,369 100 100% 442,854 19,092 23,529
Just British VirginIslands
Manufacturing, sales andmaintenance of monitorsand LCD TVs, andinvestment
1,480,509 1,480,509 48,010 100% 8,572,543 768,478 768,478
CIH British VirginIslands
Sales and manufacturingof notebook PCs andinvestments
1,606,780 1,603,518 47,001 100% 31,773,109 2,335,151 2,335,151
Panpal Taipei City Investment 5,171,837 5,171,837 500,000 100% 4,958,913
(Note 1)
130,900 92,905
Gempal Taipei City Investment 900,036 900,036 90,000 100% 1,586,168
(Note 1)
97,287 75,234
Kinpo Groupmanagementconsultantcompany (“KinpoGroupmanagement”)
Taipei City Consultation, trainingservices, etc.
3,000 3,000 300 38% 4,291 182 69
Ripal Tainan City Manufacturing of electricappliance and audiovisualelectric products
60,000 60,000 6,000 100% 21,489 (8,073) (8,112)
Avalue Technology,Inc.
New Taipei City Manufacturing,processing, and importand export business ofindustrial motherboards
522,361 519,996 14,600 21% 552,125 323,864 68,995
Gallery ManagementLtd. (“Gallery”)
British VirginIslands
Investments in high-techbusiness in Taiwan andother regions or countries
- 116,354 - - - - (409)
CEH British VirginIslands
Investment 34 34 1 100% 3,800,619 - -
Allied Circuit Taoyuan City Production and sales ofPCB boards
395,388 395,388 10,158 20% 279,405 162,631 33,201
(Continued)

82
COMPAL ELECTRONICS, INC.
Notes to Financial Statements
Investor Investee Main Original Investment Amount Ending Balance Net income Share of
Company Company Location Businesses and Products
December 31,2016
December 31,2015
Shares(thousand)
Percentage ofOwnership
CarryingValue
(losses)of investee
profits/losses ofinvestee Note
TheCompany
Maxima Ventures I,Inc. (“Maxima”)
Taipei City Investment 1,260 1,260 126 23% 12,514 (14,002) (2,749)
Lipo Holding Co.,Ltd. (“Lipo”)
Cayman Islands Investment 489,450 489,450 98 49% 353,821 75,051 36,775
CPE Netherlands Investment 197,463 197,463 6,427 100% 711,972 398,853 229,413
ATK Hsinchu City Design, research &development, andselling of DVD,Combo, CD-RWDrives
202,908 202,908 899 28% 10,307 80 23
CrownpoTechnology Inc.(“Crownpo”)
Taipei City Manufacturing,processing, and sellingresistor chips, networkingchips, diodes, multilayerceramic capacitors,semiconductor devices,and selling electronicproducts
149,547 149,547 3,739 33% 51,174 10,383 3,451
Hong Ji Taipei City Investment 1,000,000 1,000,000 100,000 100% 1,033,943 63,243 63,228
Hong Jin Taipei City Investment 295,000 295,000 29,500 100% 338,563 31,699 31,699
Auscom Austin, TXUSA
R&D of notebook PCrelated products andcomponents
101,747 101,747 3,000 100% 117,873 1,820 1,866
Arcadyan Hsinchu City R&D, manufacturing andsales of wireless network,integrated householdelectronics, and mobileoffice products
1,325,132 1,325,132 41,305 22% 2,028,833 1,357,473 296,450
FGH British VirginIslands
Investment 2,754,741 2,754,741 89,755 100% 4,027,226 384,469 384,469
HSI British VirginIslands
Investment 1,346,814 1,346,814 42,700 100% 854,609 (44,935) (44,935)
CEP Poland Maintenance andwarranty services ofnotebook PCs
90,156 90,156 136 100% 1,813 38,427 38,005
Zhaopal Taipei City Investment 2,001,000 2,001,000 200,100 100% 648,049 (76) (76)
Yongpal Taipei City Investment 1,751,000 1,751,000 175,100 100% 568,106 (76) (76)
Kaipal Taipei City Investment 751,000 751,000 75,100 100% 243,334 (76) (76)
Lead-HonorOptronics. Co.,Ltd. (“Lead-Honor”)
Taoyuan City Manufacturing of electricappliance and audiovisualelectric products
42,000 42,000 2,772 42% - (30,358) (12,409)
Infinno TechnologyCorporation(“Infinno”)
Hsinchu County Manufacturing ofelectronic components,wholesale and retail saleof precision instrumentsand electronic materials
109,837 109,837 10,984 41% 10,409 (32,494) (13,333)
HengHao Taipei City Manufacturing of PCs,computer peripherydevices, and electroniccomponents
5,304,554 5,304,554 205,795 97% 1,306,267 (784,892) (778,578)
Mactech Taichung City Manufacturing ofequipment and lighting,retailing of equipmentand international trading
219,601 219,601 21,756 53% 186,698 (31,325) (22,607)
BCI British VirginIslands
Investment 2,636,051 2,636,051 90,820 100% 5,565,388 133,413 133,413
CBN Hsinchu County R&D and sales ofcommunication andelectronic components
284,827 52,000 26,418 50% 663,964 133,949 68,475
Rayonnant Taipei City Manufacturing and salesof PCs, computerperiphery devices, andelectronic components
295,000 295,000 29,500 100% 133,685 (5,500) (15,481)
CRH British VirginIslands
Investment 377,328 377,328 12,500 100% 235,107 (8,781) (8,781)
Ascendant PrivateEquity InvestmentLtd. (“APE”)
British VirginIslands
Investment 943,922 943,922 31,253 35% 1,089,920 478,720 166,220
CORE British VirginIslands
Investment 4,318,860 4,318,860 147,000 100% 5,147,628 400,455 400,455
Etrade British VirginIslands
Investment 1,532,029 1,532,029 46,900 90% (344,710) (436,731) (418,623)
Webtek British VirginIslands
Selling of mobile phones 3,340 3,340 100 100% 1,395,496 (18,108) (18,108)
Forever British VirginIslands
Selling of mobile phones 1,575 1,575 50 100% 1,558,155 587 587
(Continued)

83
COMPAL ELECTRONICS, INC.
Notes to Financial Statements
Investor Investee Main Original Investment Amount Ending Balance Net income Share of
Company Company Location Businesses and Products
December 31,2016
December 31,2015
Shares(thousand)
Percentage ofOwnership
CarryingValue
(losses)of investee
profits/losses ofinvestee Note
TheCompany
UCGI Taipei City Manufacturing and saleof computers andelectronic components
100,000 100,000 10,000 100% (122,677) (147,223) (140,950)
Palcom Taipei City Selling of mobile phones 100,000 100,000 10,000 100% 110,837 4,001 4,001
GLB New Taipei City Manufacturing and salesof medical equipment 246,860 246,860 15,000 50% 236,743 (11,447) (4,576)
80,166,563 3,766,213
Webtek Etrade British VirginIslands
Investment 161,250
(US$5,000)
- 5,000 10% (35,426)
(US$(1,098))
(436,731)
(US$(14,204))
Investmentgain(losses)recognized byWebtek
Forever GIA British VirginIslands
Sales of mobile phones - - - 100% - - Investmentgain(losses)recognized byForever
Panpal Arcadyan Hsinchu City Telecommunicationequipment and apparatusmanufacturing, electronicparts and componentsmanufacturing, restrainedtelecom radio frequencyequipments and materialsimport and manufacturing
180,968 180,968 6,827 4% 383,533 1,357,473 Investmentgain(losses)recognized byPanpal
Allied Circuit Taoyuan City Production and selling ofPCB boards
148,263 148,263 2,927 6% 80,513 162,631 ″
Others 849,306
Gempal Arcadyan Hsinchu City Telecommunicationequipment and apparatusmanufacturing, electronicparts and componentsmanufacturing, restrainedtelecom radio frequencyequipments and materialsimport and manufacturing
203,500 203,500 7,846 4% 464,689 1,357,473 Investmentgain(losses)recognized byGempal
Allied Circuit Taoyuan City Production and selling ofPCB boards
53,645 53,645 3,220 6% 88,564 162,631 ″
Others 4,218
Just CDH (HK) Hong Kong Investment 2,009,094
(US$62,298)
2,009,094(US$62,298)
62,298 100% 6,093,612
(US$188,949)
771,300(US$23,911)
Investmentgain(losses)recognized byJust
CII British VirginIslands
Investment 298,151
(US$9,245)
298,151(US$9,245)
9,245 100% 281,609(US$8,732)
(15,416)(US$(478))
″
CPI British VirginIslands
Sales of monitors, LCDTVs and relatedcomponents.
16,125
(US$500)
16,125(US$500)
500 100% 942,102(US$29,212)
-(US$-)
″
CII AEI U.S.A Sales and maintenance ofLCD TVs
32,250
(US$1,000)
32,250(US$1,000)
1,000 100% 67,290(US$2,087)
10,579(US$328)
Investmentgain(losses)recognized byCII
MEL U.S.A Investment 265,547
(US$8,234)
265,547(US$8,234)
- 100% 287,366(US$8,911)
(12,203)(US$(378))
″
MTL U.S.A Investment 32(US$1)
32(US$1)
- 100% 32(US$1)
-
(US$-)
″
Smart British VirginIslands
Sales of electronicproducts and relatedcomponents
32
(US$1)
32
(US$1)
1 100% 442(US$14)
(11)(US$-)
″
MELandMTL
CMX Mexico Manufacturing, sales andmaintenance of LCD TVs
259,613(US$8,050)
259,613(US$8,050)
32,903 100% 287,366(US$8,911)
(12,203)(US$(378))
Investmentgain(losses)recognized byMEL and MTL
CIH CIH (HK) Hong Kong Investment 2,412,381(US$74,803)
2,412,381(US$74,803)
74,803 100% 29,952,501(US$928,760)
2,325,033(US$72,077)
Investmentgain(losses)recognized byCIH
Jenpal British VirginIslands
Investment 237,038(US$7,350)
237,038(US$7,350)
7,350 100% 105,849(US$3,282)
1,496(US$46)
″
CCM British VirginIslands
Investment 164,475(US$5,100)
164,475(US$5,100)
5,100 51% 62,571(US$1,940)
2,834(US$88)
″
PFG British VirginIslands
Sales of notebook PCsand related components
32(US$1)
32(US$1)
1 100% 442,880(US$13,733)
-(US$-)
″
FWT British VirginIslands
Investment 287,025(US$8,900)
283,800(US$8,800)
8,900 100% 287,025(US$8,900)
-(US$-)
″
(Continued)

84
COMPAL ELECTRONICS, INC.
Notes to Financial Statements
Investor Investee Main Original Investment Amount Ending Balance Net income Share of
Company Company Location Businesses and Products
December 31,2016
December 31,2015
Shares(thousand)
Percentage ofOwnership
CarryingValue
(losses)of investee
profits/losses ofinvestee Note
Hong Ji Arcadyan Hsinchu City Telecommunicationequipment and apparatusmanufacturing, electronicparts and componentsmanufacturing, restrainedtelecom radio frequencyequipments and materialsimport and manufacturing
203,500 203,500 7,846 4% 464,689 1,357,473 Investmentgain(losses)recognized byHong Ji
Allied Circuit Taoyuan City Production and selling ofPCB boards
12,274 12,274 1,041 2% 22,673 162,631 ″
Hong Jin Arcadyan Hsinchu City Telecommunicationequipment and apparatusmanufacturing, electronicparts and componentsmanufacturing, restrainedtelecom radio frequencyequipments and materialsimport and manufacturing
112,569 112,569 4,340 2% 236,456 1,357,473 Investmentgain(losses)recognized byHong Jin
Arcadyan Arcadyan Holding British VirginIslands
Investment 962,291 1,479,091 23,780 100% 837,009 125,946 Investmentgain(losses)recognized byArcadyan
Arcadyan USA U.S.A Sales of wireless networkproducts
23,055 23,055 1 100% 56,477 5,145 ″
Arcadyan Germany Germany Technology support ofwireless networkproducts
1,125 1,125 0.5 100% 47,254 5,599 ″
Arcadyan Korea Korea Sales of wireless networkproducts
2,879 2,879 20 100% 2,225 863 ″
Zhi-pal Taipei City Investment 48,000 48,000 30,000 100% 399,508 63,276 ″
TTI Taipei City R&D and sales ofhousehold digitalproducts
296,429 287,786 24,474 60% 519,049 19,242 ″
AcBel Telecom Taipei City Investment 23,000 23,000 3,652 51% 40,281 15,822 Investmentgain(losses)recognized byArcadyan
Golden Smart HomeTechnology Corp.
Taipei City Selling of hardware andsoftware integration ofhigh-tech systems
15,692 6,961 1,229 22% 5,738 (3,185) ″
Arcadyan Brasil Brazil Sales of wireless networkproducts
81,265 81,265 965 99% 65,710 (29,851) ″
Arcadyan UK UK Technical support ofwireless networkproducts
1,980 - 50 100% 2,052 73 ″
CBN Hsinchu county R&D and sales ofcommunication andelectronic components
214,875 - 8,735 16% 219,723 133,949 ″
ArcadyanHolding
Sinoprime British VirginIslands
Sales of wireless networkproducts
1,613(US$50)
1,613(US$50)
50 100% 1,547(US$48)
19(US$1)
Investmentgain(losses)recognized byArcadyanHolding
Arch Holding British VirginIslands
Investment 355,105(US$11,011)
355,105(US$11,011)
35 100% 741,934(US$23,006)
117,466(US$3,641)
〃
TTI Quest Samoa Investment 38,700(US$1,200)
38,700(US$1,200)
1,200 100% 49,999 1,714 Investmentgain(losses)recognized byTTI
Quest Exquisite Samoa Investment 37,733(US$1,170)
37,733(US$1,170)
1,170 100% 49,149(US$1,524)
1,742(US$54)
Investmentgain(losses)recognized byQuest
AcBelTelecom
Leading Images British VirginIslands
Investment 1,613(US$50)
1,613(US$50)
50 100% 74,577 15,101 Investmentgain(losses)recognized byAcBel Telecom
Great Arch British VirginIslands
Sales of wireless networkproducts
1,613(US$50)
1,613(US$50)
50 100% 1,601 66 〃
(Continued)

85
COMPAL ELECTRONICS, INC.
Notes to Financial Statements
Investor Investee Main Original Investment Amount Ending Balance Net income Share of
Company Company Location Businesses and Products
December 31,2016
December 31,2015
Shares(thousand)
Percentage ofOwnership
CarryingValue
(losses)of investee
profits/losses ofinvestee Note
LeadingImages
Astoria GmbH Germany Sales of wireless networkproducts
848(EUR25)
848(EUR25)
25 100% 74,219(US$2,301)
15,101(US$468)
Investmentgain(losses)recognized byLeadingImages
Zhi-pal CBN Hsinchu county R&D and sales ofcommunication andelectronic components
48,000 48,000 15,650 29% 393,669 133,949 Investmentgain(losses)recognized byZhi-pal
Arcadyan Brasil Brazil Sales of wireless networkproducts
328 328 4 1% 328 (29,851) 〃
HSI IUE British VirginIslands
Investment 967,500(US$30,000)
967,500(US$30,000)
30,000 100% 569,716(US$17,666)
(44,735)(US$(1,387))
Investmentgain(losses)recognized byHSI
Goal British VirginIslands
Investment 409,575(US$12,700)
409,575(US$12,700)
12,700 100% 312,855(US$9,701)
(924)(US$(29))
″
IUE CVC Vietnam R&D, manufacturing,sales, and maintenance ofnotebook PCs, computermonitors, LCD TVs andelectronic components
967,500(US$30,000)
967,500(US$30,000)
30,000 100% 595,637(US$18,469)
(44,735)(US$(1,387))
Investmentgain(losses)recognized byIUE
Goal CDM Vietnam Construction of andinvestment ininfrastructure in Ba-Thienindustrial district ofVietnam
409,575(US$12,700)
409,575(US$12,700)
12,700 100% 374,361(US$11,608)
(924)(US$(29))
Investmentgain(losses)recognized byGoal
Rayonnant APH British VirginIslands
Investment 312,318 312,318 8,651 41% 156,380 (14,857) Investmentgain(losses)recognized byRayonnant
Forming Co., Ltd. Taoyuan City R&D and manufacturingof electronic materials
27,300 27,300 1,820 21% - (24,331) ″
CRH APH British VirginIslands
Investment 403,125(US$12,500)
403,125(US$12,500)
12,500 59% 235,106(US$7,290)
(14,857)
(US$(461))
Investmentgain(losses)recognized byCRH
HengHao HHA British VirginIslands
Investment 1,429,235 1,429,235 46,882 100% 632,079 67,843 Investmentgain(losses)recognized byHengHao
HHA HHB British VirginIslands
Investment 1,511,945(US$46,882)
1,511,945(US$46,882)
46,882 100% 650,526(US$20,171)
67,831(US$2,103)
Investmentgain(losses)recognized byHHA
HHB HengHao TradingCo., Ltd.
British VirginIslands
Marketing andinternational trade
323(US$10)
323(US$10)
10 100% 338(US$10)
8(US$-)
Investmentgain(losses)recognized byHHB
CPE CEE Poland Manufacturing, sales andmaintenance of LCD TVs
- 206,288(US$6,397)
- - - 26,152(US$811)
Investmentgain(losses)recognized byCPE
(Note2)
CBN Speedlink British VirginIslands
Import and exportbusiness
1,514 1,514 50 100% 1,656 29 Investmentgain(losses)recognized byCBN
FGH Wah YuenTechnologyHolding Ltd. andits subsidiaries
Mauritius Investment 2,894,615(US$89,755)
2,894,615(US$89,755)
95,862 37% 4,101,571(US$127,180)
1,049,954(US$32,549)
Investmentgain(losses)recognized byFGH
CORE BSH British VirginIslands
Investment 4,740,750(US$147,000)
4,740,750(US$147,000)
147,000 100% 5,147,629(US$159,616)
400,455(US$12,414)
Investmentgain(losses)recognized byCORE
BSH LC Future CenterLtd.
Hong Kong Investment and trading 4,630,133(US$143,570)
4,630,133(US$143,570)
147,000 49% 5,147,629(US$159,616)
854,934(US$26,503)
Investmentgain(losses)recognized byBSH
APH PEL British VirginIslands
Investment 101,620(US$3,151)
101,620(US$3,151)
3,151 100% 56,371(US$1,748)
42,241(US$1,309)
Investmentgain(losses)recognized byAPH
Rayonnant (HK) Hong Kong Investment 580,500(US$18,000)
580,500(US$18,000)
18,000 100% 326,422(US$10,122)
(57,038)(US$(1,768))
″
(Continued)

86
COMPAL ELECTRONICS, INC.
Notes to Financial Statements
Investor Investee Main Original Investment Amount Ending Balance Net income Share of
Company Company Location Businesses and Products
December 31,2016
December 31,2015
Shares(thousand)
Percentage ofOwnership
CarryingValue
(losses)of investee
profits/losses ofinvestee Note
BCI CMI British VirginIslands
Investment 2,606,445(US$80,820)
2,606,445(US$80,820)
80,820 100% 3,628,463(US$112,510)
(45,908)(US(1,423))
Investmentgain(losses)recognized byBCI
PRI British VirginIslands
Investment 322,500(US$10,000)
322,500(US$10,000)
10,000 100% 1,936,924(US$60,060)
179,320(US$5,559)
″
GLB RBL New Taipei City Detectors and test strip 15,000 - 1,275 100% 13,865 (2,112) Investmentgain(losses)recognized byGLB
Note 1: The carrying value had deducted $559,812 and $321,435 of the Company’s stock held by Panpal and Gempal, respectively.Note 2: CEE had been sold in December 2016.
(c) Information on investment in Mainland China:
(i) The names of investees in Mainland China, the main businesses and products, and otherinformation:
(In Thousands of New Taiwan Dollars/ US Dollars/ RMB)
Accumulatedoutflow of Investment flows
Accumulatedoutflow ofinvestment
Net income Accumulated
Name of investee
Main businesses
and products
Total amountof paid-in
capital
Methodof
investment
investment fromTaiwan as of
January 1, 2015 Outflow Inflow
from Taiwan as of
December 31,
2016 (Note 2)
(losses)of the
investee
Percentageof
ownershipInvestment
income (losses)Bookvalue
remittance ofearnings in
currentperiod
CPC Manufacturing and salesof monitors
1,193,250(US$37,000)
(Note 1) 1,193,250(US$37,000)
- - 1,193,250(US$37,000)
257,840(US$7,993)
100 % 257,840(US$7,993)
2,722,494(US$84,418)
-
CDT Manufacturing and salesof notebook PCs, mobilephones, and Digitalproducts
645,000(US$20,000)
(Note 2) 645,000(US$20,000)
- - 645,000(US$20,000)
(25,162)(US$(780))
100 % (25,162)(US$(780))
269,241(US$8,349)
-
CET Manufacturing ofnotebook PCs
387,000(US$12,000)
(Note 2) 387,000(US$12,000)
- - 387,000(US$12,000)
(420,026)(US$(13,021))
100 % (394,884)(US$(12,242))
4,505,789(US$139,714)
-
BT Manufacturing ofnotebook PCs
32,250(US$1,000)
(Note 2) 32,250(US$1,000)
- - 32,250(US$1,000)
(52,203)(US$(1,618))
100 % (52,203)(US$(1,618))
(32,437)(US$(1,006))
-
CGS Maintenance andwarranty service ofnotebook PCs
9,272(RMB2,000)
(Note 2) (Note 3) - - - (22,605)(US$(701))
100 % (22,605)(US$(701))
(32,624)(US$(1,012))
-
LIZElectronics(Kunshan) Co.,Ltd.
Production andprocessing chip-resistors,ceramic capacitors,diodes, and other latestelectronic componentsand related precisionelectronic equipment;selling self-producedproducts
1,032,000(US$32,000)
(Note 1) 429,893(US$13,330)
- - 429,893(US$13,330)
85,776(US$2,659)
43 % 37,038(US$1,148)
308,891(US$9,578)
-
LIZElectronics(Nantong) Co.,Ltd.
Research & development,and manufacturing chipcomponents (chipresistors, ceramic chipdiode; selling self-produced products andproviding after-salesservice. Performingwholesale and tradingbusiness of electroniccomponents,semiconductors, specialmaterials for electroniccomponents, and spareparts
338,883(US$10,508)
(Note 1) 47,408
(US$1,470)
- - 47,408(US$1,470)
(4,805)(US$(149))
48 % (2,300)(US$(71))
151,317(US$4,692)
-
Zheng YingElectronics(Chongqing)Co., Ltd.
Research & development,and manufacturing latestelectronic components,precision cavity mold,design and manufacturingfor standard parts formolds, and selling self-produced products
73,139(RMB15,776)
(Note 2) (Note 3) - - - (31,842)(RMB(6,556))
51 % (16,239)(RMB(3,343))
(13,495)(RMB(2,911))
-
CIC Manufacturing ofnotebook PCs
387,000(US$12,000)
(Note 2) 387,000(US$12,000)
- - 387,000(US$12,000)
527,719(US$16,360)
100 % 600,742(US$18,623)
6,576,827(US$203,933)
-
(Continued)

87
COMPAL ELECTRONICS, INC.
Notes to Financial Statements
Accumulatedoutflow of Investment flows
Accumulatedoutflow ofinvestment
Net income Accumulated
Name of investee
Main businesses
and products
Total amountof paid-in
capital
Methodof
investment
investment fromTaiwan as of
January 1, 2015 Outflow Inflow
from Taiwan as of
December 31,
2016 (Note 2)
(losses)of the
investee
Percentageof
ownershipInvestment
income (losses)Bookvalue
remittance ofearnings in
currentperiod
CPO Manufacturing and salesof LCD TVs
390,225(US$12,100)
(Note 1) 390,225(US$12,100)
- - 390,225(US$12,100)
47,797(US$1,482)
100 % 47,797(US$1,482)
2,845,189(US$88,223)
-
CIT Manufacturing ofnotebook PCs
774,000(US$24,000)
(Note 2) 774,000(US$24,000)
- - 774,000(US$24,000)
1,958,735(US$60,722)
100 % 2,045,770(US$63,420)
18,478,884(US$572,989)
-
LCFC (He Fei)ElectronicsTechnologyCo., Ltd.
Manufacturing andselling of personalcomputers and relatedcomponents, andproviding relatedmaintenance and after-sales service
8,546,250(US$265,000)
(Note 1) 4,187,663(US$129,850)
- - 4,187,663(US$129,850)
780,148(US$24,185)
49 % 382,272(US$11,851)
4,522,885(US$140,244)
-
CST International trade anddistribution of computersand electroniccomponents
45,150(US$1,400)
(Note 2) 45,150(US$1,400)
- - 45,150(US$1,400)
(2,296)(US$(71))
100 % (2,296)(US$(71))
50,370(US$1,562)
-
CIN Software and hardwareR&D of computers,mobile phones andelectronic components
64,500(US$2,000)
(Note 2) 64,500(US$2,000)
- - 64,500(US$2,000)
(58)(US$(2))
100 % (58)(US$(2))
917(US$28)
-
ShengBaoPrecisionElectronics(Taicang) Co.,Ltd.
Research & development,and manufacturing latestelectronic components,precision cavity mold,design and manufacturingfor standard parts formolds, and selling self-produced products
322,500(US$10,000)
(Note 2) 164,475(US$5,100)
- - 164,475(US$5,100)
2,501(US$78)
51 % 1,276(US$40)
60,680(US$1,882)
-
CIJ Investment andconsulting services
503,100(US$15,600)
(Note 2) 503,100(US$15,600)
- - 503,100(US$15,600)
618,788(US$19,183)
100 % 618,788(US$19,183)
628,839(US$19,499)
-
CDE Manufacturing and salesof LCD TVs
483,750(US$15,000)
(Note 2) (Note 3) - - - 494,019(US$15,315)
100 % 494,019(US$15,315)
346,454(US$10,743)
-
CIS Outward investment andconsulting services
2,606,445(US$80,820)
(Note 1) 2,606,445(US$80,820)
- - 2,606,445(US$80,820)
(45,908)(US$(1,423))
100 % (45,908)(US$(1,423))
3,628,463(US$112,510)
-
CEC R&D and manufacturingof notebook PCs, tabletPCs, digital products,network switches,wireless AP, andautomobile electronicproducts
2,580,000(US$80,000)
(Note 2) (Note 3) - - - 204,365(US$6,335)
100 % 204,365(US$6,335)
3,571,593(US$110,747)
-
CMC Corporate managementconsulting, financial andtax consulting,investment consulting,and investmentmanagement consultingservices
25,800(US$800)
(Note 2) (Note 3) - - - 1,412(US$44)
100 % 1,412(US$44)
25,414(US$788)
-
CEQ R&D, manufacturing andsales of notebook PCsand related components.Also provides relatedmaintenance andwarranty services
322,500(US$10,000)
(Note 1) 322,500(US$10,000)
- - 322,500(US$10,000)
179,320(US$5,559)
100 % 179,320(US$5,559)
1,936,924(US$60,060)
-
CompalPrecisionModule(Jiangsu) Co.,Ltd.
Manufacturing andselling of magnesiumalloy injection molding
13,222,500(US$410,000)
(Note 2) 2,664,721(US$82,627)
- - 2,664,721(US$82,627)
397,391(US$12,319)
37 % 145,525(US$4,511)
5,366,670(US$166,408)
-
ChangbaoElectronicTechnology(Chongqing)Co., Ltd.
Production andmarketing of magnesiumalloy molding
1,935,000(US$60,000)
(Note 2) 369,456(US$11,456)
- - 369,456(US$11,456)
461,486(US$14,306)
37 % 168,996(US$5,239)
901,025(US$27,939)
-
Rayonnant(Taicang)
Manufacturing and salesof aluminum alloy andmagnesium alloyproducts
580,500(US$18,000)
(Note 2) 403,125(US$12,500)
- - 403,125(US$12,500)
(56,902)(US$(1,764))
100 % (56,902)(US$(1,764))
327,049(US$10,141)
-
CCI Nanjing Manufacturing andprocessing of mobilephones and tablet PCs
709,500(US$22,000)
(Note 1) 709,500(US$22,000)
- - 709,500(US$22,000)
(318,802)(US$(9,883))
100 % (318,802)(US$(9,883))
(969,596)(US$(30,065))
-
(Continued)

88
COMPAL ELECTRONICS, INC.
Notes to Financial Statements
Accumulatedoutflow of Investment flows
Accumulatedoutflow ofinvestment
Net income Accumulated
Name of investee
Main businesses
and products
Total amountof paid-in
capital
Methodof
investment
investment fromTaiwan as of
January 1, 2015 Outflow Inflow
from Taiwan as of
December 31,
2016 (Note 2)
(losses)of the
investee
Percentageof
ownershipInvestment
income (losses)Bookvalue
remittance ofearnings in
currentperiod
CDCN Manufacturing andprocessing of mobilephones and tablet PCs
187,050(US$5,800)
(Note 1) 187,050(US$5,800)
- - 187,050(US$5,800)
(22,193)(US$(688))
100 % (22,193)(US$(688))
83,044(US$2,575)
-
CWCN Manufacturing andprocessing of mobilephones and tablet PCs
935,250(US$29,000)
(Note 1) 612,750(US$19,000)
- - 612,750(US$19,000)
(119,063)(US$(3,691))
100 % (119,063)(US$(3,691))
486,298(US$15,079)
-
Hanhelt R&D and manufacturingof electroniccommunicationequipment
64,500(US$2,000)
(Note 1) 64,500(US$2,000)
- - 64,500(US$2,000)
452(US$14)
100 % 452(US$14)
(935)(US$(29))
-
Arcadyan
SVA Arcadyan R&D and sales ofwireless networkproducts
422,475(US$13,100)
(Note 1) 594,045(US$18,420)
(Note 7)
- - 594,045(US$18,420)
3,566(US$111)
100 % 3,566(US$111)
119,185(US$3,696)
-
CNC Manufacturing andwireless networkproducts
401,513(US$12,450)
(Note 1) 355,105(US$11,011)
(Note 8)
- - 355,105(US$11,011)
117,466(US$3,641)
100 % 117,466(US$3,641)
741,928(US$23,006)
-
THAC Manufacturing ofhousehold electronicsproducts
108,038(US$3,350)
(Notes 1、10)
37,088(US$1,150)
- - 37,088
(US$1,150)
1,774(US$55)
100 % 1,774(US$55)
48,601(US$1,507)
-
HengHao
HengHaoOptoelectronicTechnologyKunshan Co.,Ltd.(“HengHaoKunshan”)
Production of touchpanels and relatedcomponents
1,290,000(US$40,000)
(Note 1) 1,283,647(US$39,803)
- - 1,283,647(US$39,803)
93,224(US$2,890)
100 % 93,224(US$2,890)
490,565(US$15,211)
-
Lucom DisplayTechnology(Kunshan)Limited(“Lucom”)
Manufacturing ofnotebook PCs and relatedmodules
483,750(US$15,000)
(Note 2) 209,593
(US$6,499)
(Note 12)
- - 209,593(US$6,499)
(25,401)(US$(787))
100 % (25,401)(US$(787))
141,498(US$4,388)
-
(ii) Limitation on investment in Mainland China:
Names ofCompany
Accumulated Investment inMainland China as of
December 31, 2016
Investment AmountsAuthorized by InvestmentCommission of Ministry of
Economic Affairs
Limitation oninvestment in
Mainland China byInvestment
Commission ofMinistry of Economic
AffairsThe Company 17,561,318 (USD 544,537)
(Note 5)24,019,994 (USD 744,806) (Note 6)
Arcadyan 986,237 (USD 30,581) 986,237 (USD 30,581) 5,220,767
HengHao 1,511,623 (USD 46,872) 1,608,373 (USD 49,872) 1,288,939
Note 1: Indirectly investment in Mainland China through companies registered in the third region.Note 2: Indirectly investment in Mainland China through an existing company registered in the third region.Note 3: Investees held by Kunshan Botai Electronics Co., Ltd. (“BT”), Compal Investment (Jiansu) Co., Ltd. (“CIJ”), Compal Electronic (Sichuan)
Co., Ltd. (“CIS”), Compal Electronics Technology (Kunshan) Co., Ltd.(“CET”), and Compal Electronics (China) Co., Ltd. (“CPC”) throughtheir own funds.
Note 4: The investment income (loss) was determined based on the financial report audited by CPA.Note 5: Including the investment amount of sold or dissolved company, Beijing Compower Xuntong Electronic Technology CO., LTD. VAP
Optoelectronics (NanJing) Corp., Flextronics Technology (Shanghai) Ltd. Lucom and the increased investment amount from merging withCompal Communication Co., Ltd.
Note 6: As the Company has obtained the certificate of being qualified for operating headquarters, issued by Industrial Development Bureau, MOEA,the upper limit on investment in mainland China is not applicable.
Note 7: Arcadyan paid US$18,420 thousands and acquired 100% shares of SVA Arcadyan from Accton Asia through Arcadyan Holding in 2010.Note 8: Arcadyan paid US$8,561 thousands and acquired 100% shares of CNC from Just through Arcadyan Holding in 2007.
(Continued)

89
COMPAL ELECTRONICS, INC.
Notes to Financial Statements
Note 9: SVA Arcadyan decreased its capital amounting to US$15,000 to offset accumulated losses in March 2009.Note 10: Arcadyan’s subsidiary TTI obtained the control over THAC with US$1,150 thousands on February 28, 2013 (the date of stock transferring).Note 11: The amounts in New Taiwan Dollars were translated at the exchange rates at the balance sheet date or the average exchange rate.Note 12: The Company had an accumulated investment amounting to US$7,350 thousands in the previous years. In the first half of 2014, HengHao
paid the Company and LG US$3,184 thousands and US$3,315 thousands, respectively, for organization restructure, to obtain 100%ownership of Lucom.
(iii) Significant transactions:
The significant inter-company transactions with the subsidiary in Mainland China, which were eliminatedin the preparation of consolidated financial statements, are disclosed in “ Information on significanttransactions”.
(14) Segment information:
Please refer to the consolidated financial report of 2016.

90
COMPAL ELECTRONICS, INC.
STATEMENT OF CASH AND CASH
EQUIVALENTS
December 31, 2016
(Expressed in thousands of New Taiwan Dollars;
in dollars of Foreign Currency)
Item Description AmountCash on hand $ 1,308
Checking account anddemand deposits
TWD 3,281,726
Foreign currency (US$104,546,394.15、EUR$93,676.49 and others) 3,382,776
6,664,502
Time deposits Foreign currency (US$1,034,000,000, Maturity date: 2017.1.3~2017.3.1)
33,346,500
(CNY$8,040,000, Maturity date: 2017.1.5~2017.7.11)
37,121
33,383,621
Cash equivalents:
Bonds purchasedunder resaleagreements TWD (2017.1.3~2017.1.10) 117,704
Foreign currency (US$100,000,000, Maturity date: 2017.1.19~2017.1.20) 3,225,000
3,342,704
Total $ 43,392,135
Note: The exchange rate is 32.25 New Taiwan dollars for 1 US dollar; 33.9 New Taiwan dollars for 1 EUR
dollar; 4.617 New Taiwan dollars for 1 CNY dollar.

91
COMPAL ELECTRONICS, INC.
STAEMENTS OF NOTES AND ACCOUNTS
RECEIVABLE
December 31, 2016
(Expressed in thousands of New Taiwan Dollars)
Item Description AmountD Company Non-related-party sales $ 94,154,975
E Company 〃 21,334,490
A Company 〃 10,799,240
H Company 〃 7,818,846
Others (Note) 〃 29,383,177
163,490,728
Less: allowance for uncollectible accounts (788,948)
Notes and accounts receivable, net $ 162,701,780
Note: The amount of individual client included in others does not exceed 5% of the account balance.

92
COMPAL ELECTRONICS, INC.
STATEMENTS OF INVENTORY
December 31, 2016
(Expressed in thousands of New Taiwan Dollars)
Item CostNet Realizable
ValueFinished goods $ 2,636,338 2,670,375
Work in progress 32,001 32,001
Raw materials 24,204,321 24,449,348
Raw materials in transit 1,096,351 1,096,351
Total $ 27,969,011 28,248,075
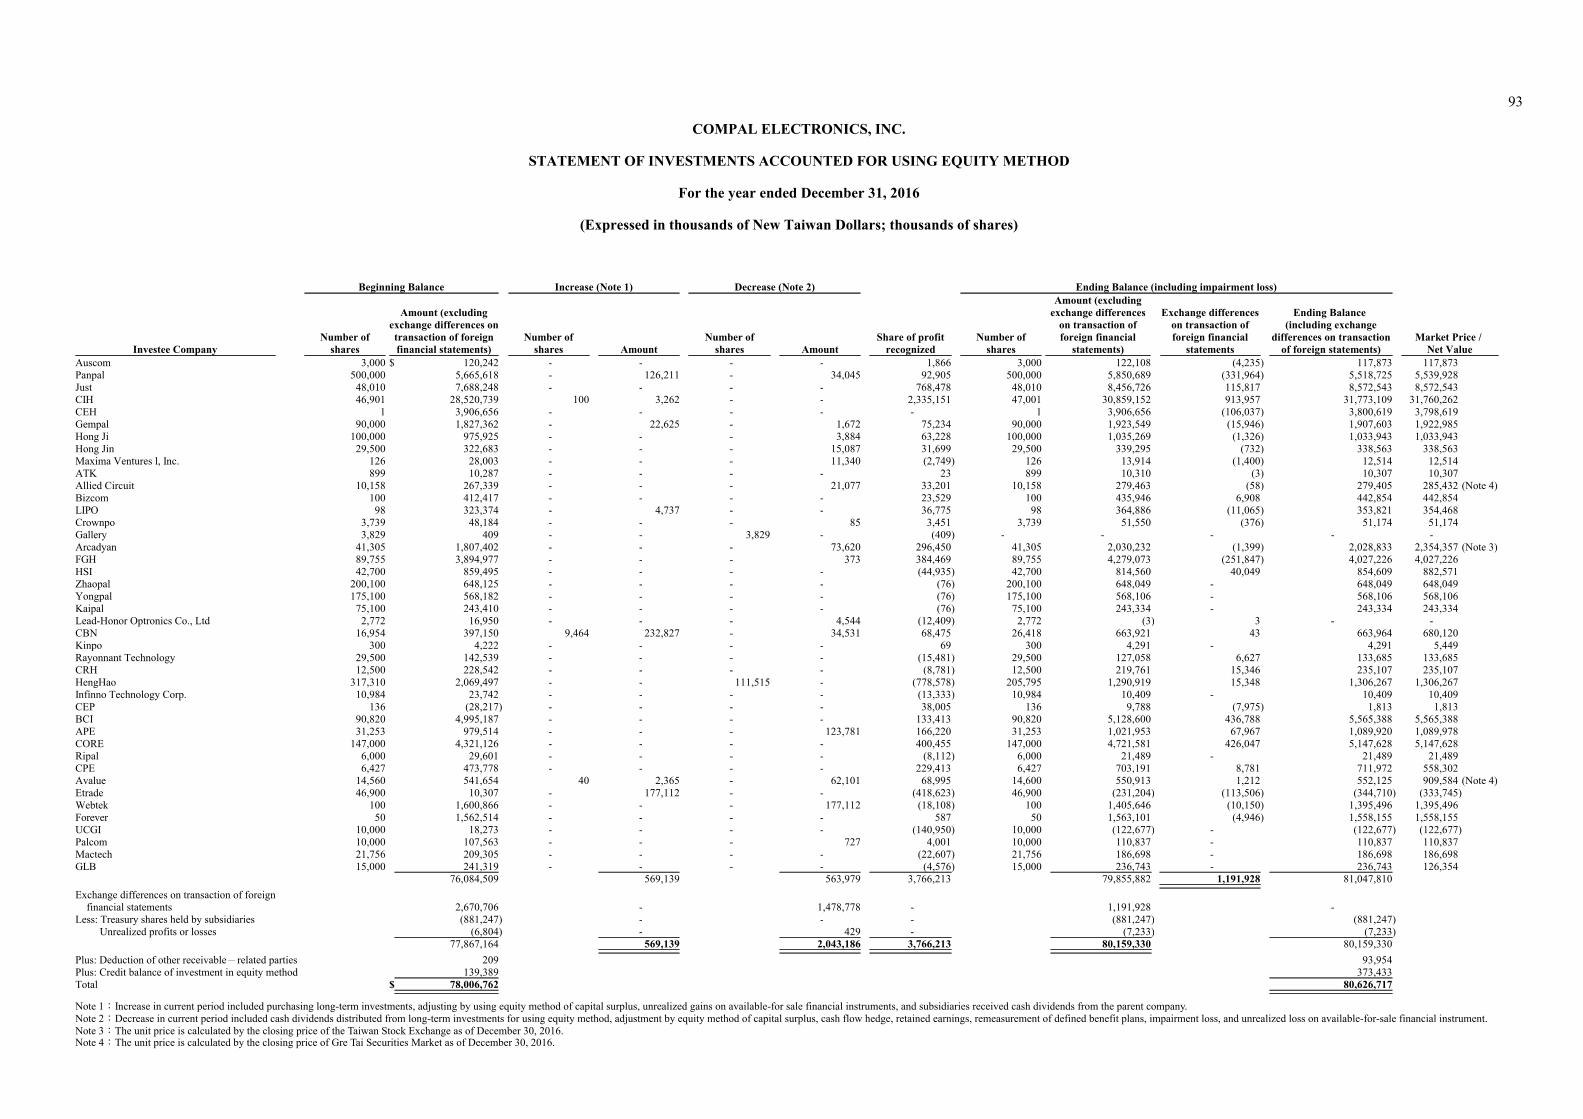
93
COMPAL ELECTRONICS, INC.
STATEMENT OF INVESTMENTS ACCOUNTED FOR USING EQUITY METHOD
For the year ended December 31, 2016
(Expressed in thousands of New Taiwan Dollars; thousands of shares)
Beginning Balance Increase (Note 1) Decrease (Note 2) Ending Balance (including impairment loss)
Investee CompanyNumber of
shares
Amount (excludingexchange differences ontransaction of foreignfinancial statements)
Number ofshares Amount
Number ofshares Amount
Share of profitrecognized
Number ofshares
Amount (excludingexchange differences
on transaction offoreign financial
statements)
Exchange differenceson transaction offoreign financial
statements
Ending Balance (including exchange
differences on transactionof foreign statements)
Market Price / Net Value
Auscom 3,000 $ 120,242 - - - - 1,866 3,000 122,108 (4,235) 117,873 117,873Panpal 500,000 5,665,618 - 126,211 - 34,045 92,905 500,000 5,850,689 (331,964) 5,518,725 5,539,928Just 48,010 7,688,248 - - - - 768,478 48,010 8,456,726 115,817 8,572,543 8,572,543CIH 46,901 28,520,739 100 3,262 - - 2,335,151 47,001 30,859,152 913,957 31,773,109 31,760,262CEH 1 3,906,656 - - - - - 1 3,906,656 (106,037) 3,800,619 3,798,619Gempal 90,000 1,827,362 - 22,625 - 1,672 75,234 90,000 1,923,549 (15,946) 1,907,603 1,922,985Hong Ji 100,000 975,925 - - - 3,884 63,228 100,000 1,035,269 (1,326) 1,033,943 1,033,943Hong Jin 29,500 322,683 - - - 15,087 31,699 29,500 339,295 (732) 338,563 338,563Maxima Ventures l, Inc. 126 28,003 - - - 11,340 (2,749) 126 13,914 (1,400) 12,514 12,514ATK 899 10,287 - - - - 23 899 10,310 (3) 10,307 10,307Allied Circuit 10,158 267,339 - - - 21,077 33,201 10,158 279,463 (58) 279,405 285,432 (Note 4)Bizcom 100 412,417 - - - - 23,529 100 435,946 6,908 442,854 442,854LIPO 98 323,374 - 4,737 - - 36,775 98 364,886 (11,065) 353,821 354,468Crownpo 3,739 48,184 - - - 85 3,451 3,739 51,550 (376) 51,174 51,174Gallery 3,829 409 - - 3,829 - (409) - - - - -Arcadyan 41,305 1,807,402 - - - 73,620 296,450 41,305 2,030,232 (1,399) 2,028,833 2,354,357 (Note 3)FGH 89,755 3,894,977 - - - 373 384,469 89,755 4,279,073 (251,847) 4,027,226 4,027,226HSI 42,700 859,495 - - - - (44,935) 42,700 814,560 40,049 854,609 882,571Zhaopal 200,100 648,125 - - - - (76) 200,100 648,049 - 648,049 648,049Yongpal 175,100 568,182 - - - - (76) 175,100 568,106 - 568,106 568,106Kaipal 75,100 243,410 - - - - (76) 75,100 243,334 - 243,334 243,334Lead-Honor Optronics Co., Ltd 2,772 16,950 - - - 4,544 (12,409) 2,772 (3) 3 - -CBN 16,954 397,150 9,464 232,827 - 34,531 68,475 26,418 663,921 43 663,964 680,120Kinpo 300 4,222 - - - - 69 300 4,291 - 4,291 5,449Rayonnant Technology 29,500 142,539 - - - - (15,481) 29,500 127,058 6,627 133,685 133,685CRH 12,500 228,542 - - - - (8,781) 12,500 219,761 15,346 235,107 235,107HengHao 317,310 2,069,497 - - 111,515 - (778,578) 205,795 1,290,919 15,348 1,306,267 1,306,267Infinno Technology Corp. 10,984 23,742 - - - - (13,333) 10,984 10,409 - 10,409 10,409CEP 136 (28,217) - - - - 38,005 136 9,788 (7,975) 1,813 1,813BCI 90,820 4,995,187 - - - - 133,413 90,820 5,128,600 436,788 5,565,388 5,565,388APE 31,253 979,514 - - - 123,781 166,220 31,253 1,021,953 67,967 1,089,920 1,089,978CORE 147,000 4,321,126 - - - - 400,455 147,000 4,721,581 426,047 5,147,628 5,147,628Ripal 6,000 29,601 - - - - (8,112) 6,000 21,489 - 21,489 21,489CPE 6,427 473,778 - - - - 229,413 6,427 703,191 8,781 711,972 558,302Avalue 14,560 541,654 40 2,365 - 62,101 68,995 14,600 550,913 1,212 552,125 909,584 (Note 4)Etrade 46,900 10,307 - 177,112 - - (418,623) 46,900 (231,204) (113,506) (344,710) (333,745)Webtek 100 1,600,866 - - - 177,112 (18,108) 100 1,405,646 (10,150) 1,395,496 1,395,496Forever 50 1,562,514 - - - - 587 50 1,563,101 (4,946) 1,558,155 1,558,155UCGI 10,000 18,273 - - - - (140,950) 10,000 (122,677) - (122,677) (122,677)Palcom 10,000 107,563 - - - 727 4,001 10,000 110,837 - 110,837 110,837Mactech 21,756 209,305 - - - - (22,607) 21,756 186,698 - 186,698 186,698GLB 15,000 241,319 - - - - (4,576) 15,000 236,743 - 236,743 126,354
76,084,509 569,139 563,979 3,766,213 79,855,882 1,191,928 81,047,810
Exchange differences on transaction of foreignfinancial statements 2,670,706 - 1,478,778 - 1,191,928 -
Less: Treasury shares held by subsidiaries (881,247) - - - (881,247) (881,247) Unrealized profits or losses (6,804) - 429 - (7,233) (7,233)
77,867,164 569,139 2,043,186 3,766,213 80,159,330 80,159,330
Plus: Deduction of other receivable-related parties 209 93,954Plus: Credit balance of investment in equity method 139,389 373,433Total $ 78,006,762 80,626,717
Note 1:Increase in current period included purchasing long-term investments, adjusting by using equity method of capital surplus, unrealized gains on available-for sale financial instruments, and subsidiaries received cash dividends from the parent company.Note 2:Decrease in current period included cash dividends distributed from long-term investments for using equity method, adjustment by equity method of capital surplus, cash flow hedge, retained earnings, remeasurement of defined benefit plans, impairment loss, and unrealized loss on available-for-sale financial instrument.Note 3:The unit price is calculated by the closing price of the Taiwan Stock Exchange as of December 30, 2016.Note 4:The unit price is calculated by the closing price of Gre Tai Securities Market as of December 30, 2016.

94
COMPAL ELECTRONICS, INC.
STATEMENT OF NON-CURRENT AVAILABLE-FOR-SALE FINANCIAL
ASSETS
For the year ended December 31, 2016
(Expressed in thousands of New Taiwan Dollars)
Beginning Balance Increase (Note 1) Decrease (Note 2) Ending Balance
Investee CompanyNumber of
Shares AmountNumber of
Shares AmountNumber of
Shares AmountNumber of
Shares AmountCollaterals orPledged Assets
Kinpo 124,044 $ 1,192,061 - 284,060 - - 124,044 1,476,121 None
Cal-Comp Electronics
(Thailand) Public Co.,
Ltd.
239,631 738,063 - - - 155,760 239,631 582,303 None
Innolux 134,877 1,340,681 - 223,896 - - 134,877 1,564,577 None
Chipbond 13,542 643,924 - - - 21,667 13,542 622,257 None
CPT 394,086 811,000 - - - - 394,086 811,000 None
Taiwan Star 98,046 980,465 - - - - 98,046 980,465 None
Others - 264,709 - 97,357 - 49,587 - 312,479 None
Total $ 5,970,903 605,313 227,014 6,349,202
Note 1:Increase included purchasing available-for-sale financial assets and unrealized gains on financial instruments at fair value through profit or loss.
Note 2:Decrease included impairment loss, unrealized loss on financial instruments at fair value through profit or loss and proceeds of capital reduction of investments.

95
COMPAL ELECTRONICS, INC.
STATEMENT OF PROPERTY, PLANT AND
EQUIPMENT
For the year ended December 31, 2016
(Expressed in thousands of New Taiwan Dollars)
Please refer to Note (6)(j).
STATEMENT OF SHORT-TERM LOANS
December 31, 2016
(Expressed in thousands of New Taiwan Dollars)
Creditor DescriptionContractPeriod Interest Rate
LoanCommitments
Collaterals orPledged Assets
Endingbalance
Bank of China Limited Credit Loans 2016.12~2017.01 1.15% $ 6,450,000 None 5,482,500
Ta Chong Bank 〃 2016.12~2017.01 1.00% 1,000,000 None 967,500
The Bank of Tokyo-Mitsubishi UFJ
〃 2016.12~2017.02 1.13%~1.23% 3,225,000 None 3,225,000
Credit Agricole Corporate& Investment Bank
〃 2016.12~2017.02 1.35%~1.39% 4,837,500 None 4,515,000
Sumitomo Mitsui BankingCorporation
〃 2016.11~2017.01 1.08% 3,225,000 None 3,225,000
Citibank Taiwan, Ltd. 〃 2016.12~2017.03 0.78%~1.12% 9,513,750 None 6,063,750
HSBC Bank (Taiwan)Limited
〃 2016.12~2017.02 1.16%~1.40% 4,515,000 None 4,515,000
Taipei Fubon CommercialBank Co., Ltd.
〃 2016.12~2017.01 0.67% 2,096,250 None 2,000,000
Mizuho Bank 〃 2016.12~2017.01 0.67% 3,225,000 None 450,000
$ 38,087,500 30,443,750

96
COMPAL ELECTRONICS, INC.
STATEMENT OF ACCOUNTS PAYABLE-NON-
RELATED PARTY
December 31, 2016
(Expressed in thousands of New Taiwan Dollars)
Suppliers AmountE Company $ 22,660,535
J Company 16,709,217
B Company 8,208,158
A Company 3,898,520
I Company 4,180,169
H Company 3,646,710
Others (Note) 13,232,259
Total $ 72,535,568
Note: The amount of individual vendor included in others does not exceed 5% of the account balance.

97
COMPAL ELECTRONICS, INC.
STATEMENT OF LONG-TERM LOANS
December 31, 2016
(Expressed in thousands of New Taiwan Dollars)
Amount
CreditorLoan
CommitmentsLoan within
1 yearLoan morethan 1 year
ContractPeriod
InterestRate Amount
Collaterals orPledged Assets
Hua Nan Commercial Bank $ 3,000,000 3,000,000 - 2015.11~2017.11 %1.14 3,000,000 None
Sumitomo Mitsui Banking
Corporation
1,800,000 - 1,790,000 2015.11~2018.11 %1.12 1,790,000 None
O-Bank (Originally named
Industrial Bank of Taiwan)
1,000,000 - 1,000,000 2015.12~2018.12 %1.12 1,000,000 None
CTBC Bank Co., Ltd. 2,000,000 - 2,000,000 2016.04~2018.04 %1.08 2,000,000 None
KGI Bank 2,500,000 - 2,500,000 2016.05~2019.05 %1.10 2,500,000 None
Taipei Fubon Commercial
Bank Co., Ltd.
2,000,000 - 1,950,000 2016.09~2019.07 %1.15 1,950,000 None
E. Sun Bank 2,500,000 - 2,495,000 2016.08~2019.08 %1.10 2,495,000 None
Bank SinoPac 3,500,000 - 3,500,000 2016.03~2020.03 %1.18 3,500,000 None
The Shanghai Commercial &
Savings Bank
2,300,000 - 2,300,000 2016.06~2020.06 %1.14 2,300,000 None
Bank of Taiwan 3,000,000 - 2,200,000 2016.09~2020.09 %1.16 2,200,000 None
Taiwan Corporative Bank 2,000,000 - 300,000 2016.11~2019.11 %1.14 300,000 None
Mega International
Commercial Bank
1,000,000 - 600,000 2016.11~2020.11 %1.17 600,000 None
Chang Hwa Bank 3,000,000 - 3,000,000 2016.12~2020.12 %1.14 3,000,000 None
Bank of America 5,160,000 4,700,000 - 2015.05~2017.06 %1.35 4,700,000 None
$ 34,760,000 7,700,000 23,635,000 31,335,000

98
COMPAL ELECTRONICS, INC.
STATEMENT OF OTHER PAYABLES
December 31, 2016
(Expressed in thousands of New Taiwan Dollars)
Item Description AmountPayroll payables and year-end
bonuses payable
2016/12 payroll expense, estimated 2016 year-end
bonuses, and employees and directors' compensations
$ 3,070,706
Technical service fee payables 1,145,711
Sales allowance payables 798,233
Others (Note) Export expense payables and others 2,711,296
Total $ 7,725,946
Note: The amount of each item in others does not exceed 5% of the account balance.

99
COMPAL ELECTRONICS, INC.
STATEMENT OF NET REVENUE
For the year ended December 31, 2016
(Expressed in thousands of New Taiwan Dollars)
Item Quantity AmountSales revenue:
5C electronic products Note $ 728,360,161
Others 298,035
Less: Sales return (619,894)
Sales allowance (3,247,001)
Net sales 724,791,301
Other operating revenue:
Service and processing revenue 861,794
Net sales revenue $ 725,653,095
Note: Due to multiple-categories, to be subdivided is difficult.
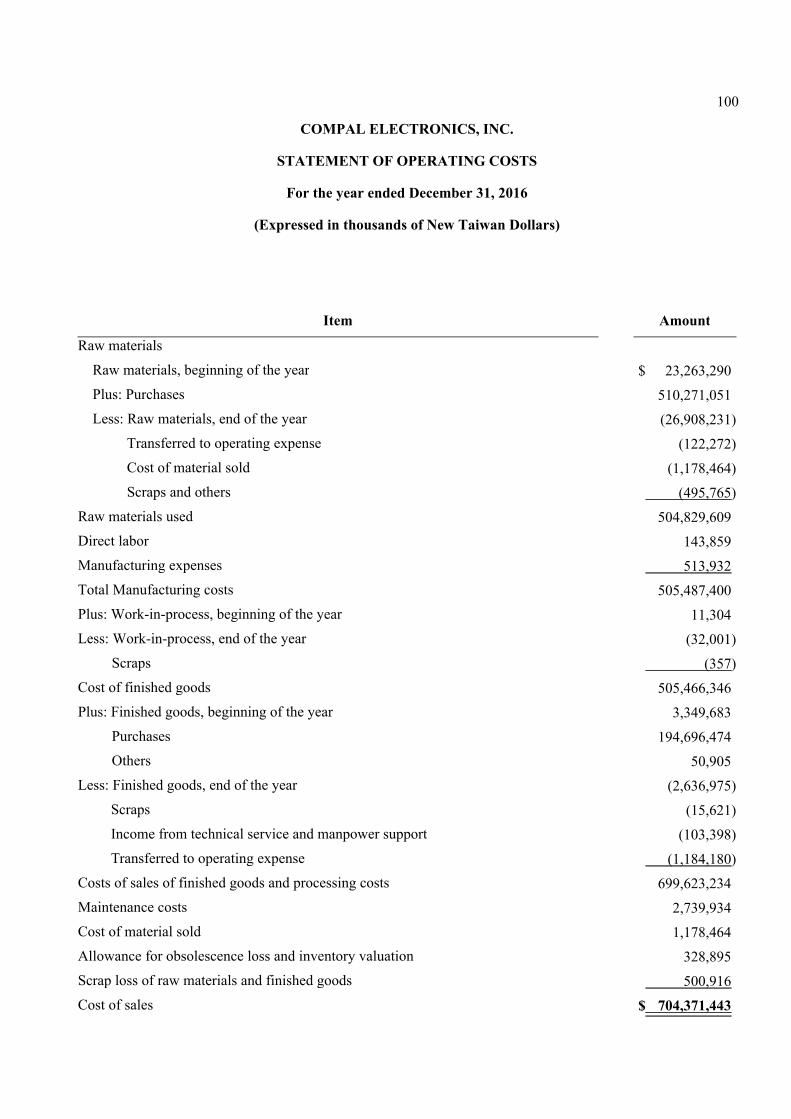
100
COMPAL ELECTRONICS, INC.
STATEMENT OF OPERATING COSTS
For the year ended December 31, 2016
(Expressed in thousands of New Taiwan Dollars)
Item Amount
Raw materials
Raw materials, beginning of the year $ 23,263,290
Plus: Purchases 510,271,051
Less: Raw materials, end of the year (26,908,231)
Transferred to operating expense (122,272)
Cost of material sold (1,178,464)
Scraps and others (495,765)
Raw materials used 504,829,609
Direct labor 143,859
Manufacturing expenses 513,932
Total Manufacturing costs 505,487,400
Plus: Work-in-process, beginning of the year 11,304
Less: Work-in-process, end of the year (32,001)
Scraps (357)
Cost of finished goods 505,466,346
Plus: Finished goods, beginning of the year 3,349,683
Purchases 194,696,474
Others 50,905
Less: Finished goods, end of the year (2,636,975)
Scraps (15,621)
Income from technical service and manpower support (103,398)
Transferred to operating expense (1,184,180)
Costs of sales of finished goods and processing costs 699,623,234
Maintenance costs 2,739,934
Cost of material sold 1,178,464
Allowance for obsolescence loss and inventory valuation 328,895
Scrap loss of raw materials and finished goods 500,916
Cost of sales $ 704,371,443

101
COMPAL ELECTRONICS, INC.
STATEMENT OF OPERATING EXPENSES
For the year ended December 31, 2016
(Expressed in thousands of New Taiwan Dollars)
ItemSelling
expensesAdministrative
expenses
Research anddevelopment
expensesPayroll expenses $ 343,451 1,544,536 5,991,174
Export expenses 166,452 60 52
Royalty expenses 320,385 - -
Research expenses - - 816,300
Material requisition 699 3,489 295,524
Shipping expenses 2,011,392 1,486 356
Sample expenses 352,701 26 1,894
Bad debts 714,682 - -
Others (Note) 151,070 846,060 1,746,528
Total $ 4,060,832 2,395,657 8,851,828
Note: The amount of each item in others does not exceed 5% of the account balance.