compaction simulation forum: tablet press...
TRANSCRIPT

1
Compaction Simulation Forum: Tablet Press SimulationKatie Metzler | 13 Nov 2012

Outline
• Tablet press parameters estimated in simulation
• Method for setting up a compaction profile
• Comparing compaction profiles from a press and the simulator (same material)
• Example of good compactibilitymatch and using the simulator to inform acceptable material property ranges
• Example of poor press simulation and investigating sources of error as future work
2
Huxley Bertram Engineering Ltd.Cambridge, England

Press Simulation vs. Force Control Mode
• Powder bed changes throughout press processing: – Fill routine– Pre-compression– Main compression– Ejection
• Punch-powder contact speed and time impacts tablet attributes– Punch speed– Time between pre and main compression– Dwell time during compressions
3

Press and Tooling Parameters Impact Tablet Attributes
4
Press A B C
Main Compression Roller Radius (mm) 127 105 60
Pre-Compression Roller Radius (mm) 127 105 60
Turret Effective Radius/ Pitch Circle Radius (mm) 140 367.5 75
Dwell Time @ 15 RPM (D Flat Head) 89 34 165
Dwell Time @ 15 RPM (D Domed Head) 75 27 140
Angle Between Pre/Main Rolls (o) 100 40 48
Time Between Pre- to Main @ 15 RPM (ms) 1111.1 444.4 533.3

Simulator Software: Rippie-Danielson
• Generates the punch trace- incoming velocity and dwell time- based on the tooling and press parameters
• Upper punch example
5
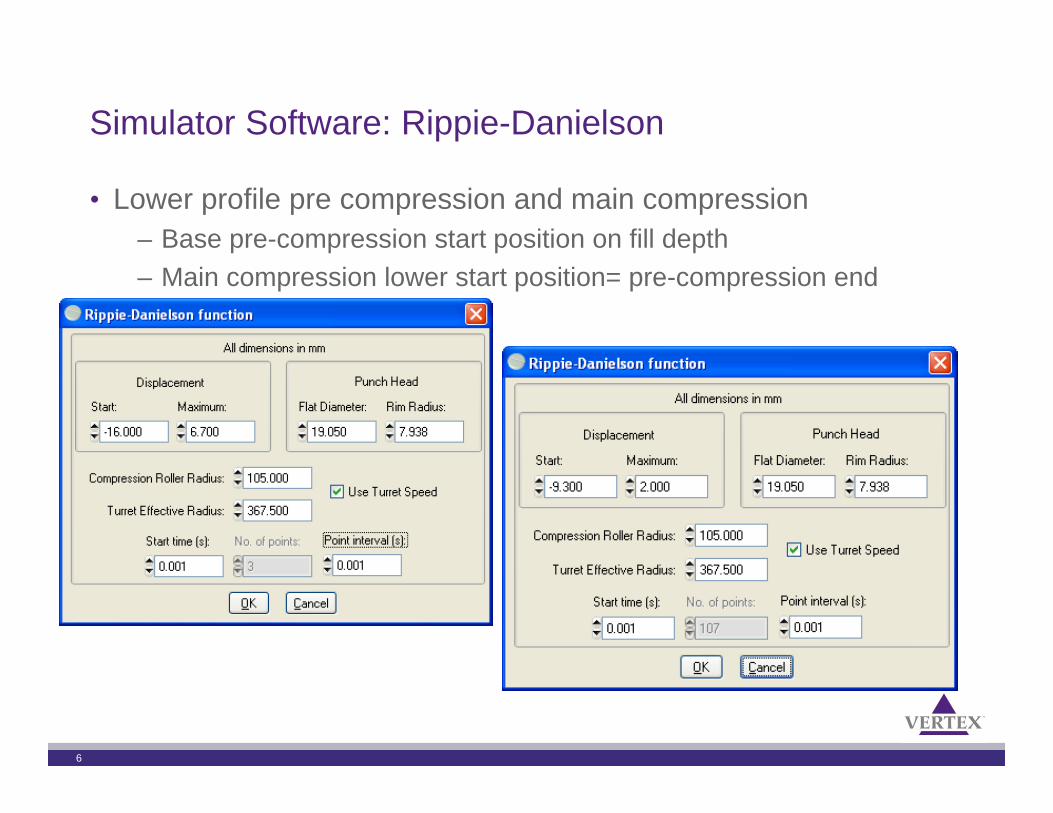
Simulator Software: Rippie-Danielson
• Lower profile pre compression and main compression– Base pre-compression start position on fill depth– Main compression lower start position= pre-compression end
position
6

Pre and Main Compression Profile Traces
• The shape and speed of the punch trace during compression is represented
• Ejection is not modeled• Time between pre- and main compression not accounted for
7

Manual Pre- and Main Compression Profile Integration
8
• Upper punch: – Start time of punch movement– Generated punch trace
• Add stationary punch position while compressions occur
• Lower punch: – Start time of movement
• Ensure upper punch is in the die before lower punch moves up to avoid splashing
– Use generated pre-compression punch trace
– Time between pre- and main compression
• Angle and distance between pre and main compression rollers
– Generated main compression punch trace
• Maintain appropriate dwell time – Ejection speed
-10
-8
-6
-4
-2
0
2
4
6
8
10
0 0.5 1 1.5 2
Posi
tion
(mm
)
Time (s)

Movement and Timing Considerations
1
-16
-12
-8
-4
0
4
8
25ms
73 ms
64ms
TPM+DT
TPM=444ms
-1 m
m
109ms
137 ms
611ms
581 ms
42 ms
84 ms
695 ms
695ms
2.5 mm profile @15 rpm with DT=30 ms
DT=30 ms30 ms
539 ms

Using Press Simulation to Predict Impact of DS Characteristics on Tablet Attributes• Predicted compactibility based on material attributes• Simulator advantages: fast turnaround time, much less material,
save on CMO costs
10
Red: model development dataBlue: verification data

Press Simulation vs. Full-Scale Press Comparison
• Blend aliquot taken from press processing to compress on the simulator
• Compression profile agreement• Used simulator to establish the
impact of press parameters on outcome
– RPM– Pre-compression– Main compression– Dwell time
• Future: establish operating ranges before full scale
11

Press Simulation Deviation from Full-Scale Data and Trouble-Shooting• Validated press for one lot as seen
previously• Differences for the next lot
– Material attribute?– Characterization differences?– Poor press representation?
• Lot used at Vertex found to be different lot than at the CMO*
12

Lessons Learned and Future Work
• Model does not currently emulate the die-fill process and ejection is only approximated
• Material properties, storage, and characterization methods can also impact the compaction discrepancies
• Automate the profile-building process
13

Questions
14
Backup
15

Movement and Timing Considerations
1
-16
-12
-8
-4
0
4
8
25ms
73 ms
64ms
TPM+DT
TPM=444ms
-1 m
m
109ms
137 ms
611ms
581 ms
42 ms
84 ms
695 ms
695ms
2.5 mm profile @15 rpm with DT=30 ms
DT=30 ms30 ms
539 ms