comp 14112 speech notes - university of manchester · 1 comp 14112 fundamentals of artificial...
TRANSCRIPT

1
Comp 14112 Fundamentals of Artificial Intelligence
Lecture notes, 2015-16 Speech recognition
Tim Morris
School of Computer Science, University of Manchester
1 Introduction to speech recognition 1.1 The problem Speech recognition is a challenging problem in Artificial Intelligence. It is a solved problem in some restricted settings, for example when spoken words are limited to a small vocabulary. In this case speech recognition systems are already in common use, e.g. for command and name recognition in mobile phones, or for automated telephony systems. However, error-free recognition of unrestricted continuous speech remains a difficult and unsolved problem. Current technologies can now achieve reasonable word accuracy and have been steadily improving over the last decade, but they are still some way from achieving performance comparable to human listeners. There is a great deal to be gained by improving these systems. For example, human transcription of speech, as required in certain areas of medicine and law, is expensive and tedious. Automated systems are already providing a substantial cost reduction in this area. Nevertheless, further improvements are required and speech recognition remains an active area of industrial and academic research. The most successful current approaches to speech recognition are based on the same probabilistic principles that you saw during the earlier lectures. One reason for this is that a probabilistic approach can be very effective when dealing with highly variable sensory inputs. This was true in the robot localisation problem, for example, where the robot only receives imperfect and corrupted information about its location; it is also true for sound signals received by a microphone or by our ears. However, in the case of speech this variability does not only stem from “noise” such as irrelevant sounds or sensor errors, although these sources of variability can severely affect speech recognition systems and should be taken into consideration. A much more significant source of variation in speech signals is due to natural variations in the human voice. A person can say exactly the same sentence in many different ways, with large differences in timing and modulation. Two different people are even more variable in the way that they may say the same word or sentence. A successful speech recognition system has to be able to account for these sources of variation and recognise that the same sentence is being spoken. This requires that the underlying model of speech being used is sufficiently flexible. In this course we will investigate how one can approach the speech recognition problem by constructing a generative probabilistic model of speech. By constructing a statistical model of how signals derived from speech are generated, it is then natural to use probability calculus in order to update our belief about what has been said. The type of probabilistic model that we will construct is called a Hidden Markov Model (HMM). HMMs are currently one of the most popular approaches for solving the problem of speech recognition. Before introducing the HMM, we first have to explain how speech can be represented by features that are useful for modelling. After introducing our choice of features, we will then show how a simple classifier can be constructed in order to differentiate the words “yes” and “no”. We will approach this problem by a number of different methods, which will highlight some important techniques that are of central importance in many Artificial Intelligence applications. We will start with a very simple feature-based classifier. Then we will consider a number of HMM approaches to the problem, introducing methods for classification and decoding in HMMs. You will be constructing a “yes”/“no” classifier in the associated lab sessions, where you will be able to see some real speech data first-hand. Finally, we will consider the problem of speech recognition in more complex settings.
2
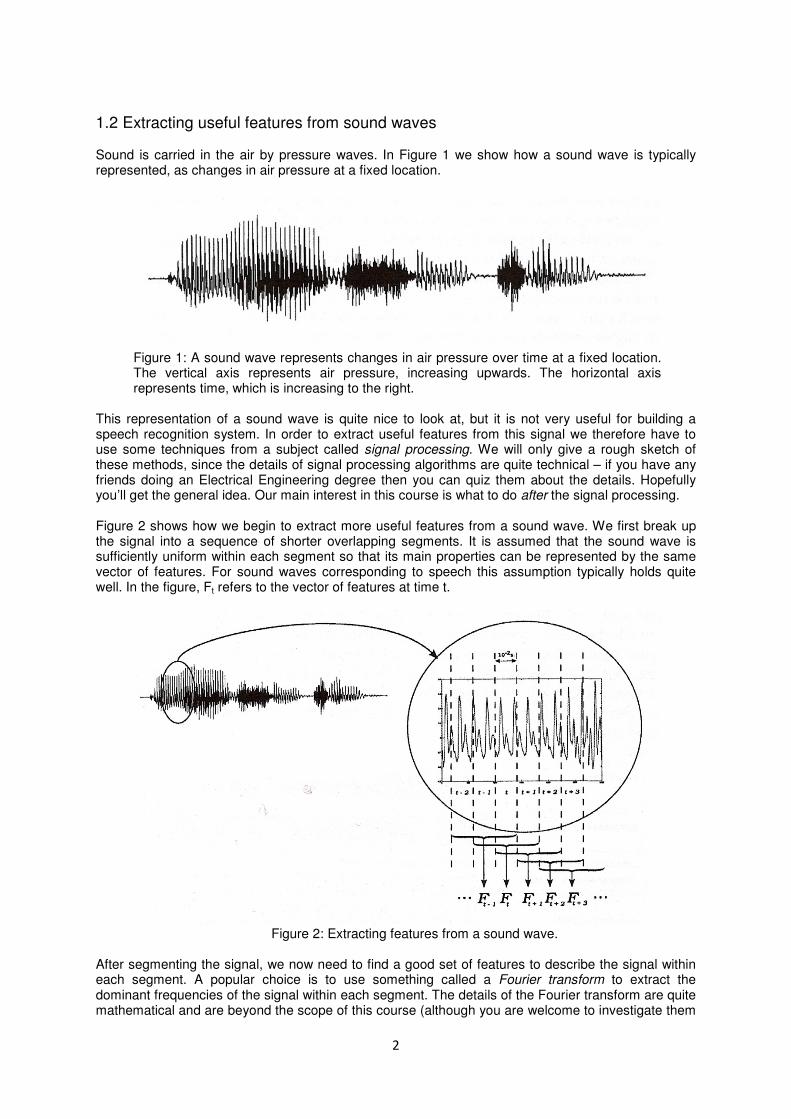
1.2 Extracting useful features from sound waves Sound is carried in the air by pressure waves. In Figure 1 we show how a sound wave is typically represented, as changes in air pressure at a fixed location.
Figure 1: A sound wave represents changes in air pressure over time at a fixed location. The vertical axis represents air pressure, increasing upwards. The horizontal axis represents time, which is increasing to the right.
This representation of a sound wave is quite nice to look at, but it is not very useful for building a speech recognition system. In order to extract useful features from this signal we therefore have to use some techniques from a subject called signal processing. We will only give a rough sketch of these methods, since the details of signal processing algorithms are quite technical – if you have any friends doing an Electrical Engineering degree then you can quiz them about the details. Hopefully you’ll get the general idea. Our main interest in this course is what to do after the signal processing. Figure 2 shows how we begin to extract more useful features from a sound wave. We first break up the signal into a sequence of shorter overlapping segments. It is assumed that the sound wave is sufficiently uniform within each segment so that its main properties can be represented by the same vector of features. For sound waves corresponding to speech this assumption typically holds quite well. In the figure, Ft refers to the vector of features at time t.
Figure 2: Extracting features from a sound wave.
After segmenting the signal, we now need to find a good set of features to describe the signal within each segment. A popular choice is to use something called a Fourier transform to extract the dominant frequencies of the signal within each segment. The details of the Fourier transform are quite mathematical and are beyond the scope of this course (although you are welcome to investigate them

3
in your own time if you are interested). However, a useful analogy is to think of a musical chord, which is a combination of notes at specific frequencies. The Fourier transform allows you to extract the individual notes from the chord and determine exactly how loud the contribution from each note is. The same principle can be applied to an arbitrary sound wave, except that in this case there may be contributions from a continuous range of frequencies. After some processing, we obtain a set of Mel-frequency cepstrum coefficients (MFCCs) for each segment of the signal. In the labs you will be working with data representing 13 MFCCs. These are 13 numbers representing the contribution from different frequency bands obtained by a Fourier transform. There is a vector of 13 MFCC features for each segmented part of the speech signal. The Mel-frequency bands are spaced so that the perceived frequency range of each band appears to be similar to the human ear.
1.3 Representing words After the signal processing stage, the sound is represented as a sequence of 13-dimensional vectors, each representing a segment of the original sound wave. The speech recognition task is to label these in some way, so that we can identify the meaning of the spoken word or sentence. One approach would be to directly label the segments as representing a particular word; that is the approach we will be following in the lab and it works reasonably well for short words like “yes” and “no”. However, a better approach for longer words and sentences is to break them up into smaller and more elementary utterances called phonemes. Figure 3 shows the sequence of phonemes corresponding to the start of a sentence beginning “The Washington…” (spoken with an East Coast US accent). A quick web-search will locate a number of different phonetic alphabets in common use. Sometimes it is useful to combine phonemes, e.g. a sequence of three phonemes is known as a triphone.
Sound signal
Extracted features
Labelling corresponding phonemes Path through HMM
Path through triphone HMM
Figure 3: Representing a sentence as a sequence of phonemes. The bottom rows correspond to phoneme and triphone HMMs which we will discuss later.
1.4 Language models So far we have only considered the low-level processing of a sound wave in order to extract features that can be labelled as words or phonemes. Humans are also able to use their knowledge of language in order to improve their recognition of spoken words, e.g. if we miss a word, or don’t hear it very clearly, then we may be able to guess what it was most likely to be. We have a sophisticated understanding of language and no artificial intelligence is yet able to understand natural language as well as we can. The problem of understanding natural languages is very challenging indeed, much harder than the problem of recognising individual spoken words. However, we can use simple statistical language models in order to help disambiguate cases that our speech recognition system finds difficult. The models can identify simple patterns in language, e.g. which words are more likely to follow a particular word in a given language. You may have a simple language model in your mobile

4
phone’s predictive text mode. Probabilistic methods provide an excellent approach for combining evidence from language models with evidence from speech signals. 1.5 Training: learning by example The models that we will use have to be trained on real examples of speech. Training is the process whereby the parameters of a model are adapted to a particular problem domain, i.e. we fit the parameters to some exemplar data known as training data. Training is a fundamental part of many Artificial Intelligence applications and is the main focus of Machine Learning, a field of research that lies on the interface between Artificial Intelligence and Statistics. Many of the most successful real-world applications of Artificial Intelligence involve some kind of training. In the current problem the speech models that we will develop will be parameterised based on real examples of speech.
1.6 Back to the problem Now we have the building blocks that a speech recognition system works with. In the pre-processing stage we use signal processing to convert a sound wave into a sequence of MFCC feature vectors. Our job is then to label each of these feature vectors with the word or phoneme being spoken at that time. In the next few lectures we will investigate a number of different approaches for solving this task.
2 Building a feature-based classifier Before constructing a HMM for the speech recognition problem, we will first investigate a simpler approach based on analysis of a small set of features de- scribing each recorded word. We will show how such a set of features can be used to construct a probabilistic classifier. A classifier is an agent which takes some input data, in our case features extracted from a speech signal, and predicts the class of the data. In our case the two possible classes are C1 =“yes” or C2
=“no”. Ideally, if the speech signal comes from a person saying “yes”, then the classifier should predict C1, while if the speech signal comes from a person saying “no” then the classifier should predict C2. In practice, it is unusual to obtain perfect performance and most methods will make mistakes and missclassify some examples. Our goal when building a classifier is to make as few mistakes as possible. As well as limiting the number of mistakes, it will also be useful for our classifier to represent its belief about the class of each example. Some examples are going to be easy and the agent will be quite certain about the classification. Some examples will be much harder to classify and the agent will be less certain. In an application it would be very useful for the classifier to be able to indicate that it is uncertain, since then the speaker could be prompted to repeat a word. As in the robot localisation example, we can use probabilities to represent the agent’s belief in the classification.
2.1 The data and features In the lab you will be given 165 examples of recorded speech from different people saying “yes” and “no”. We will use this data in order to train our classifier. The raw sound signals are in WAVE files (with a .wav extension) and the corresponding sequence of MFCCs are in files with a .dat extension. The speech signals have been cropped in order to exclude the silence before and after each word is spoken. You will see how this cropping can be done using an HMM later. In order to extract a simple set of features for our classifier we will simply average each MFCC across all time segments. On the left of figure 4 we show the average of the 1st MFCC for the 165 examples given in the lab exercise. It can be seen that there is quite a large difference between the typical results for the different words and for different speakers. This feature looks like it may be useful for constructing a classifier. We see that all examples whose 1st MFCC is below -15 correspond to a “yes”, while all examples whose 1st MFCC is above -5 correspond to a “no”. When the 1st MFCC lies between these values then the example may either be a “yes” or a “no”.

5
Figure 4: On the left is a histogram showing the time-averaged 1st MFCC from 165 examples of different speakers saying “yes” and “no”. On the right we show the signal duration for the same data (in seconds).
On the right of figure 4 we show the duration of the signals for the same words. This feature looks much less useful for constructing a classifier.
2.2 Building a classifier from one feature Our general approach to building a classifier will be based on Bayes’ theorem. We will take C1 to mean the proposition “the class is C1” and we will take x to mean “the value of the feature is observed to be x”. Then we can use Bayes’ theorem to work out the probability that the class is C1 given that we have observed the feature to be x,
����|�� = �|��������|������� �|������� (1)
Here, p(C1) is our prior belief that the word is in the class C1. We have p(C2) = 1−p(C1) since we are assuming that the word must be in one class or the other. The prior will depend on the application. For example, if we were using the “yes”/“no” classifier for a cinema telephone booking system, then it could be reasonable to assume that the caller is not interested in most films and therefore set p(C1) to be quite small. In other applications the agent’s prior belief will be equal for both classes and p(C1) = p(C2) = 0.5. In order to calculate p(C1|x) using the above formula, we have to know what p(x|C1) and p(x|C2) are. In the robot localisation example these were constructed by modelling the error made by the robot sensors as a normal distribution. In the present example we will use the same approach, but now we will take more care explaining exactly how to use data in order to estimate the parameters of the normal distribution. This is what we mean by training the model. The features we will consider are continuous numbers. That means that p(x|C1) and p(x|C2) are actually representing probability density functions rather than probability mass functions. The normal distribution is a very important and useful example of a probability density function and we describe it in detail now. 2.2.1 Probability densities and the normal distribution A probability density function p(x) represents the probability p(x)dx that the variable x lies in the interval [x, x+dx] in the limit dx → 0. It is a non-negative function and the area under the function is one, i.e.

6
� �����
���� = 1
The mean µ and variance σ2 are defined to be,
� = � �������� ��, �� = � �� − ��������
�� �� (2)
where σ is known as the standard deviation and characterises the width, or spread, of the distribution. The normal distribution, also known as the Gaussian distribution, has the following probability density function,
���� = �√���� ��� ������
���� (3)
and the mean and variance are the two parameters of the distribution. Figure 5 shows two examples of normal density functions, with a different mean and variance in each case.
Figure 5: On the left we show the density function p(x1) for a normally distributed variable x1 with mean 2 and variance 1. On the right we show the density function p(x2) for a normally distributed variable x2 with mean 4 and variance 0.5. The arrows indicate a width
of two standard deviations (2σ). 2.2.2 Training: fitting the normal distributions to data We will approximate p(x|C1) and p(x|C2) by normal distributions fitted to some training data. It is possible to fit a normal distribution to data by setting its mean and variance equal to the empirical
mean m and variance σ2 of the data. Given a set of N data points {x
(1), x
(2), . . . , x
(n)} then m and s2
are defined as
! = �"∑ ��$�"$%� And &� = �
"∑ '��$� −()�"$%� (4)
Note that the label n is a superscript in these expressions, not a power. On the left of figure 6 we show two normal distributions fitted to the “yes” and “no” data histograms by
setting µ = m and σ2 = s
2 for each of the two classes of data. The histograms have been normalised
now so that they represent frequencies in each class, and therefore they have area one. This provides a simple and useful way for us to estimate p(x|C1) and p(x|C2). This fit is not perfect, because it is unlikely that the data is exactly normally distributed and because we have quite a small

7
data set. However, the fit doesn’t look too bad, and it provides us with a simple method to build a classifier.
Figure 6: On the left are the normal density functions fitted to “yes” and “no” data. The mean and variance of the normal densities were set equal to the empirical mean and variance of MFCC 1 in the training data. On the right is the resulting classification rule obtained by assuming equal prior probability for each class.
2.2.3 Building the classifier Now that we have expressions for p(x|C1) and p(x|C2), learned from our training data, we can simply plug them into equation (1) and work out the required classification probability for any new example. The result is shown on the right of figure 6, where we have assumed equal prior probability for each class, e.g. p(C1) = p(C2) = 0.5. The classifier rule is intuitively reasonable. For small values of MFCC 1 the classifier is confident that the word is “yes” and the probability is therefore close to one in this regime. For relatively large values of MFCC 1 the classifier is confident that the word is “no” so that the probability of “yes” is close to zero. In-between these regimes the classifier is less confident about the correct classification.
2.3 Building a classifier from multiple features We can usually build a better classifier by considering more than one feature. Let bold x now represent a vector of features x = [x1, x2, …, xd]. This vector can be represented as a point in a d-dimensional space; we therefore often refer to the examples in the data set as data points. As an example, figure 7 shows the same data as previously but now plotting two MFCCs for each data point. We can generalise to higher dimensions by considering further MFCCs. In this case it is harder to visualise the data, but exactly the same methods that we develop below can be applied. The probability of the feature vector x is interpreted to mean
p(x) = p(x1 Λ x2 Λ. . . xd) where xi is taken to mean “the value of the ith feature is xi”. We often write p(x1 Λ x2 Λ . . . xd) as p(x1, x2, …, xd) so that the comma is interpreted as an “and”. This is natural when dealing with vectors, since the probability can be thought of as a function with d arguments.

8
Figure 7: If two features are used to build the classifier then the data can be represented as points in two dimensions. Each point can be considered a vector x = [x1, x2], where x1 is the distance from the origin along the horizontal axis and x2 is the distance from the origin along the vertical axis.
We can easily generalise equation (1). The only difference is that the scalar quantity x is now replaced by the vector quantity x. By Bayes’ theorem again,
����|�� = �|��������|������� �|������� (5)
In order to use this classification rule, we have to come up with expressions for p(x|C1) and p(x|C2). We will again approximate these by using normal distributions fitted to some training data. We will further assume that the features are conditionally independent given knowledge of the class. This means that we make the simplifying assumption that the probability density for the vector x can be written as a product of the densities for each feature, i.e.
���|��� = ����|�������|���⋯���+|��� = ,���-|���+
-%�
���|��� = ����|�������|���⋯���+|��� = ,���-|���+
-%�
In figure 8 we show an example of a normal density in two dimensions obtained by making this assumption. Each feature x1 and x2 has a normal density as given in the previous example (recall figure 5). In the bottom row we show the corresponding density function for the two-dimensional vector x = [x1, x2]. Note that the volume under the density surface for a 2D vector is one, which is analogous to the condition that the area under the curve is one for the density of a scalar quantity. As before, we can estimate the mean and variance of p(xi|C1) and p(xi|C2) as the empirical mean and variance of each feature using the training data from each class. On the left of figure 9 we show the

9
contours of equal probability for normal densities fitted to the data from each class. Once we have approximated p(x|C1) and p(x|C2) in this way, we can then compute p(C1|x) using equation (5) just as we did for the single feature example. We will again assume equal prior probabilities p(C1) = p(C2) = 0.5. The only difference to the single feature case is that now p(C1|x) depends on a vector, which in our two-dimensional example has two components x = [x1, x2]. In this case one can show the resulting classification probability as a surface, as shown on the right of figure 9.
Figure 8: Examples of normal density functions in one and two dimensions. Top left: Density function p(x1) for a normally distributed variable x1 with mean 2 and variance 1. Top right: Density function p(x2) for a normally distributed variable x2 with mean 4 and variance 0.5. Bottom left: Density function p(x1, x2) obtained by making the
simplifying assumption that p(x1 Λ x2) = p(x1)p(x2). Bottom right: Contours of equal probability for the same density function.
The type of classifier that has been developed here is an example of a naïve Bayes classifier. It is called “naive” because of the assumption that features are conditionally independent given knowledge of the class. This greatly simplifies the classification problem, but it is quite a crude approximation for many problems. However, this remains a popular type of probabilistic classifier and works well in many applications. More advanced classifiers have been developed and classification is quite a mature and highly developed research area in Machine Learning.

10
Figure 9: On the left we show the result of fitting two normal densities to the data points from each class. On the right is the resulting classification probability, assuming equal prior probability for each class.
3 Markov chains A Markov chain, also known as a 1st order Markov process, is a probabilistic model of sequences. It can be thought of as a generative model, i.e. a model of how sequences of objects can be produced in a random or probabilistic fashion.
3.1 Definitions An nth order Markov process specifies a probability distribution over sequences. Let st be the object at time t in a temporal sequence of objects. The objects in the sequence belong to a finite set of states,
st ∈ S, known as the state space. In our case these states will be either words, phonemes or triphones, depending on the type of model we are discussing. In the case of words, the state space would be the vocabulary. In the case of phonemes, the state space would be the phonetic alphabet being used or some subset of the phonetic alphabet. Let s denote the whole sequence from s1 to sT where T is the length of the sequence,
s = s1s2s3 . . . st−1st . . . sT . For an nth order Markov process, the probability of st being generated at time t is only determined by the n values before it in the sequence. In other words, the probability of the current element is conditionally independent of all previous elements given knowledge of the last n,
p(st|st−1, st−2, . . . , s1) = p(st|st−1, st−2, . . . , st−n) . A zeroth order Markov process is an uncorrelated random sequence of objects. Throws of a die or coin tosses are examples of zeroth order Markov processes, since the previous event has no influence on the current event. This is not a good model for many real-world sequential processes, such as sequences of words or phonemes, where the context of an object has a large influence on its probability of appearing in a sequence. We are therefore typically more interested in the case where the process order n > 0. In this course we will mainly be dealing with 1st order Markov processes, commonly referred to as Markov chains, in which case

11
p(st|st−1, st−2, . . . , s1) = p(st|st−1)
and the probability of the current element in the sequence is only determined by the previous one. Later we will see that higher order Markov processes can always be mapped onto a 1st order Markov process with an expanded state space; therefore it is sufficient for us to only consider the 1st order case and all the results carry over to the higher order case in a straightforward way. We will only consider homogeneous Markov processes, defined as those for which p(st = i | st−1 = j) = p(st′ = i | st′−1 = j) for all times t and t′.
3.2 Graphical representation A Markov chain can be represented by a directed graph, which is a graph where the edges between pairs of nodes have a direction. An example is shown in Figure 10. Here, there are two states a and b. The numbers associated with the edges are the conditional probabilities determining what the next state in the sequence will be, or whether the sequence will terminate. These probabilities are called transition probabilities. They remain fixed over time for a homogeneous Markov process. One can imagine generating sequences of a and b from this graph by starting at the START state and then following the arrows according to their associated transition probability until we reach the STOP state. Hence, we see that this is a generative model of sequences. The START and STOP states are special because they do not generate a symbol and therefore we do not include them in the state space S.
Figure 10: Graphical representation of a Markov chain model of sequences with state space S = {a, b}.
The information represented by Figure 10 is,
p(s1 = a) = 0.5 , p(s1 = b) = 0.5 ,
p(st = a | st−1 = a) = 0.4 , p(st = a | st−1 = b) = 0.2 , p(st = b | st−1 = b) = 0.7 , p(st = b | st−1 = a) = 0.5 , p(STOP | st = a) = 0.1 , p(STOP | st = b) = 0.1 .
3.3 Calculating the probability of a sequence We can use the transition probabilities in order to work out the probability of the model producing a particular sequence s,
12
��&� = ��&����&�|&����&.|&��⋯��/012|/3� = ��&��,��&4|&4���3
4%�
where we have defined sT+1 = STOP. For example,
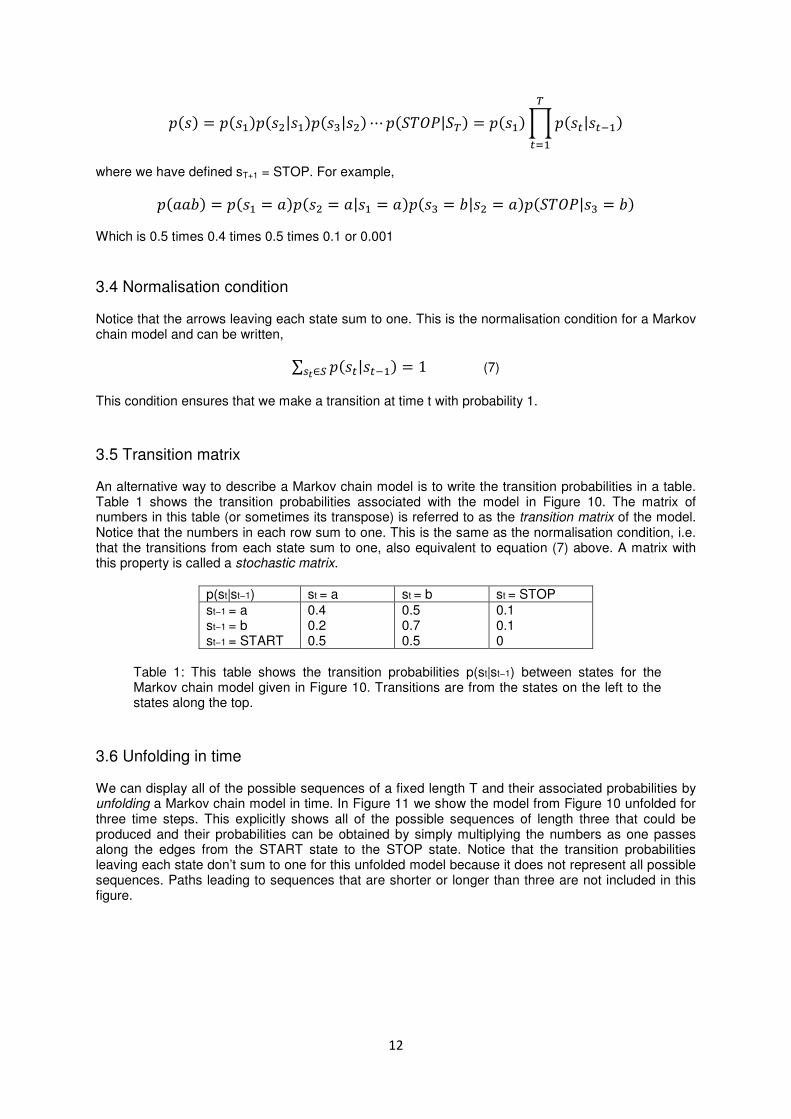
��556� = ��&� = 5���&� = 5|&� = 5���&. = 6|&� = 5���/012|&. = 6� Which is 0.5 times 0.4 times 0.5 times 0.1 or 0.001
3.4 Normalisation condition Notice that the arrows leaving each state sum to one. This is the normalisation condition for a Markov chain model and can be written,
∑ ��&4|&4��� = 178∈: (7)
This condition ensures that we make a transition at time t with probability 1.
3.5 Transition matrix An alternative way to describe a Markov chain model is to write the transition probabilities in a table. Table 1 shows the transition probabilities associated with the model in Figure 10. The matrix of numbers in this table (or sometimes its transpose) is referred to as the transition matrix of the model. Notice that the numbers in each row sum to one. This is the same as the normalisation condition, i.e. that the transitions from each state sum to one, also equivalent to equation (7) above. A matrix with this property is called a stochastic matrix.
p(st|st−1) st = a st = b st = STOP
st−1 = a st−1 = b st−1 = START
0.4 0.2 0.5
0.5 0.7 0.5
0.1 0.1 0
Table 1: This table shows the transition probabilities p(st|st−1) between states for the Markov chain model given in Figure 10. Transitions are from the states on the left to the states along the top.
3.6 Unfolding in time We can display all of the possible sequences of a fixed length T and their associated probabilities by unfolding a Markov chain model in time. In Figure 11 we show the model from Figure 10 unfolded for three time steps. This explicitly shows all of the possible sequences of length three that could be produced and their probabilities can be obtained by simply multiplying the numbers as one passes along the edges from the START state to the STOP state. Notice that the transition probabilities leaving each state don’t sum to one for this unfolded model because it does not represent all possible sequences. Paths leading to sequences that are shorter or longer than three are not included in this figure.

13
Figure 11: Unfolding the model shown in Figure 10 to show all possible sequences of length three.
This unfolded model shows that there is an exponential increase in the number of possible sequences as the length of the sequence increases. In this example there are 2×2×2 possible sequences of length 3. One can see this by observing that there are two choices for any sequence for t = 1, 2 and 3. There are 2
L possible distinct sequences of length L. This number soon becomes huge as L
increases. We therefore have to be very careful to design efficient algorithms that don’t explicitly work with this number of sequences. Luckily such algorithms exist, which is one of the reasons that Markov chain models and hidden Markov models are so useful.
3.7 Phoneme state models In Figure 12 we show a model where the states are the phonemes that combine to make the words yes and no. Each state has a self-transition, which allows the phoneme to be repeated a number of times so, for example, “yes” could be “y-eh-s”, “y-eh-eh-s” or “y-y-eh-s-s” etc. The reason for these self-transitions is that they can be used to model the duration of each phoneme in speech.
Figure 12: Markov chain model with a phoneme state space S = {y, eh, s, n, ow}. The model generates phoneme sequences corresponding to the words “yes” and “no”. Each phoneme can be repeated a number of times to model its duration within a spoken word.
p(st|st−1) y eh s n ow STOP
y 0.5 0.5 0 0 0 0
eh 0 0.5 0.5 0 0 0
s 0 0 0.5 0 0 0.5
n 0 0 0 0.4 0.6 0
ow 0 0 0 0 0.25 0.75
START 0.5 0 0 0.5 0 0
Table 2: This table shows the transition probabilities between states for the Markov chain model given in Figure 12. Most transition probabilities are zero indicating that these states are not connected. A matrix like this with many zero entries is called a sparse matrix.
The transition probabilities for this model are given in Table 2. As before, the normalisation condition ensures that the rows sum to one. Notice that most of the entries in the table are zero, indicating that most of the transitions between states are not allowed. This sparse structure is typical of Markov
14
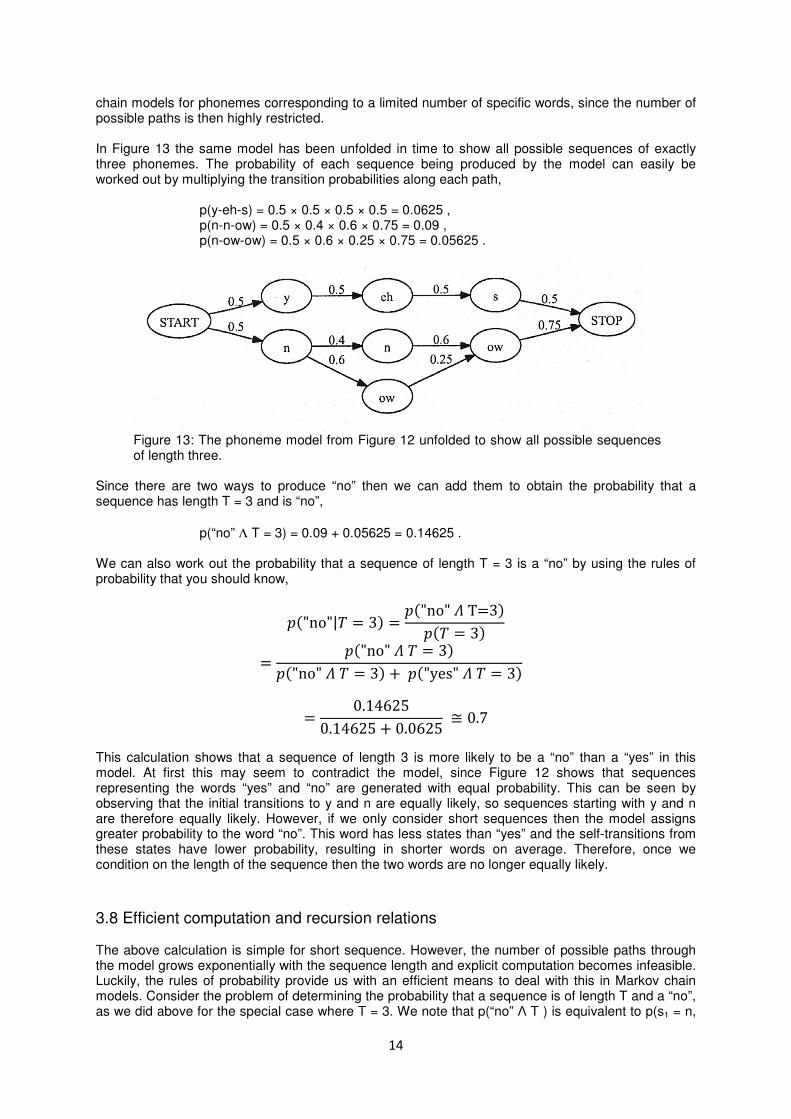
chain models for phonemes corresponding to a limited number of specific words, since the number of possible paths is then highly restricted. In Figure 13 the same model has been unfolded in time to show all possible sequences of exactly three phonemes. The probability of each sequence being produced by the model can easily be worked out by multiplying the transition probabilities along each path,
p(y-eh-s) = 0.5 × 0.5 × 0.5 × 0.5 = 0.0625 , p(n-n-ow) = 0.5 × 0.4 × 0.6 × 0.75 = 0.09 , p(n-ow-ow) = 0.5 × 0.6 × 0.25 × 0.75 = 0.05625 .
Figure 13: The phoneme model from Figure 12 unfolded to show all possible sequences of length three.
Since there are two ways to produce “no” then we can add them to obtain the probability that a sequence has length T = 3 and is “no”,
p(“no” Λ T = 3) = 0.09 + 0.05625 = 0.14625 . We can also work out the probability that a sequence of length T = 3 is a “no” by using the rules of probability that you should know,
��"no"|0 = 3� = ��"no"?T=3���0 = 3�
= ��"no"?0 = 3���"no"?0 = 3� + ��"yes"?0 = 3�
= 0.146250.14625 + 0.0625 ≅ 0.7
This calculation shows that a sequence of length 3 is more likely to be a “no” than a “yes” in this model. At first this may seem to contradict the model, since Figure 12 shows that sequences representing the words “yes” and “no” are generated with equal probability. This can be seen by observing that the initial transitions to y and n are equally likely, so sequences starting with y and n are therefore equally likely. However, if we only consider short sequences then the model assigns greater probability to the word “no”. This word has less states than “yes” and the self-transitions from these states have lower probability, resulting in shorter words on average. Therefore, once we condition on the length of the sequence then the two words are no longer equally likely.
3.8 Efficient computation and recursion relations The above calculation is simple for short sequence. However, the number of possible paths through the model grows exponentially with the sequence length and explicit computation becomes infeasible. Luckily, the rules of probability provide us with an efficient means to deal with this in Markov chain models. Consider the problem of determining the probability that a sequence is of length T and a “no”, as we did above for the special case where T = 3. We note that p(“no” Λ T ) is equivalent to p(s1 = n,

15
sT+1 = STOP) for the model in Figure 12 (we will use a comma in place of Λ to make the notation below more compact). We can write the sum over all possible sequences between s1 = n and sT+1 =STOP as,
��&� = M, &3 � = /012� = O O⋯7PQ:7�Q:
O ��&� = M, &�, &�, ⋯ , &3��, &3�:RQ:
= O O⋯7PQ:7�Q:
O ��&� = M���&�|&� = M���&.|&��⋯��&3|&3�����/012|&3�:RQ:
On the face of it, this looks like a sum over a huge number paths through the model. In the worst case this sum would require the calculation of |S|
T−1 terms where |S| is the size of the state space.
However, by evaluating these sums in a particular order, as shown below, we can calculate the sum much more efficiently:
��&�, &� = M� = ��&�|&� = M���&� = M�∀&� ∈ /
��&., &� = M� = O ��&.|&����&�, &� = M�∀&. ∈ /7�∈:
��&T, &� = M� = O ��&T|&.���&., &� = M�∀&T ∈ /7P∈:
⋮ ��&3 � = /012, &� = M� = O ��/012|&3���&3 , &� = M�
7R∈:
Except for the first and last lines, we see that each line involves a sum over |S| terms which has to be worked out |S| times. Therefore, each of these lines requires a number of operations (multiplications and additions) roughly proportional to |S|
2. The number of these lines is T−2, so we see that the
number of operations is at least (T−2)|S|2. This is much better than an exponential scaling and allows
the computation to be carried out efficiently for long sequences and quite large state spaces. For models where many states are not connected, such as typical phoneme models, then the computation time is even less. The reason for this is that the sums above only need to include connected states, since p(st = i|st−1 = j) = 0 for two unconnected states i and j (recall Table 2). In the 2nd year algorithms course you will see more examples of algorithms like this, and you will learn how to calculate their computational complexity which determines how the computation time scales with L and |S|. We can write the above set of equations in a more compact form as a recursion relation,
��&�, &� = M� = ��&�|&� = M���&� = M� ��&4 �, &� = M� = O ��&4 �|&4���&4, &� = M�VWX2 ≤ Z ≤ 0
78∈:
where we have defined sT+1 = STOP.
3.9 Training It is possible to fit a Markov chain model to training data in order to estimate the transition probabilities. The simplest approach is just to use frequency counts from the sequences in the training data. Let Nij be the number of times that state j follows state i in the training data. We simply set the transition probabilities to be proportional to these counts, i.e.
��&4 = [|&4�� = \� = "],^∑ "]__∈`
∀\, [ ∈ / (9)

16
The denominator ensures that the probabilities are properly normalised, i.e. the sum of all transition probabilities leaving any state is one. As an example consider the two-state Markov model in Figure 10. Imagine that the transition probabilities are unknown but that we have observed the following three sequences,
abbaab ababaaa abbbba . We are asked to estimate the transition probabilities for the model from this training data. First we compute the counts for each type of transition, which we can put in a table as shown below.
Ni,j j = a j = b j = STOP
i = a 3 5 2
i = b 4 4 1
i = START 3 0 0
Then equation 9 shows that we should normalise the counts by the sum over each respective row to obtain the transition probabilities.
p(st = j|st−1 = i) j = a j = j = STOP i = a 0.3 0.5 0.2
i = b 4/9 4/9 1/9
i = START 1 0 0
3.10 Higher order models
Figure 14: A 2nd order Markov process with state space S = {a, b} is equivalent to a 1st order Markov process with an expanded state space S = {aa, ab, ba, bb}. Notice that some transitions are not allowed.
So far, we have only considered 1st order Markov processes. Higher order processes can capture even greater contextual information. In fact, all higher order Markov processes can be mapped onto a 1st order process with an extended alphabet. For example, if we have a fully connected 2nd order model with state space S = {a, b} then this is equivalent to a 1st order model with state space S = {aa, ab, ba, bb} with the transitions shown in Figure 14. The extended model is not fully connected, because there is a constraint that the states ending with a must be followed by states starting with a, and similarly states ending with b must be followed by states starting with b. The reason for this is that these states overlap in the original sequence, e.g.
abbaaba → ab − bb − ba − aa − ab − ba . Since we can map a higher order Markov process onto a 1st order model, all the theory carries over in a straightforward manner.
17
A triphone Markov chain model is an example of a 3rd order phoneme Markov process mapped onto a 1st order process with an extended state space (recall Figure 3). The additional context provided by a triphone model can greatly improve the performance of the hidden Markov model speech recognition methods that we discuss next, because the context of a phoneme can strongly influence the way that it is spoken.
4 Hidden Markov Models Hidden Markov models (HMMs) combine aspects of the Markov chain model and feature-based classifier that you have seen in the previous two lectures. Underlying an HMM is a Markov chain model. The difference is that the states of the Markov chain cannot be observed; they are hidden or latent variables. Instead of producing a sequence of states, like a Markov chain, in the HMM each state emits a feature vector according to an emission probability p(xt|st). All we observe are a sequence of feature vectors and we cannot be sure which state has produced them. Like a Markov chain model, an HMM is a generative model of sequential data, but the generated sequence is now a sequence of feature vectors, e.g.
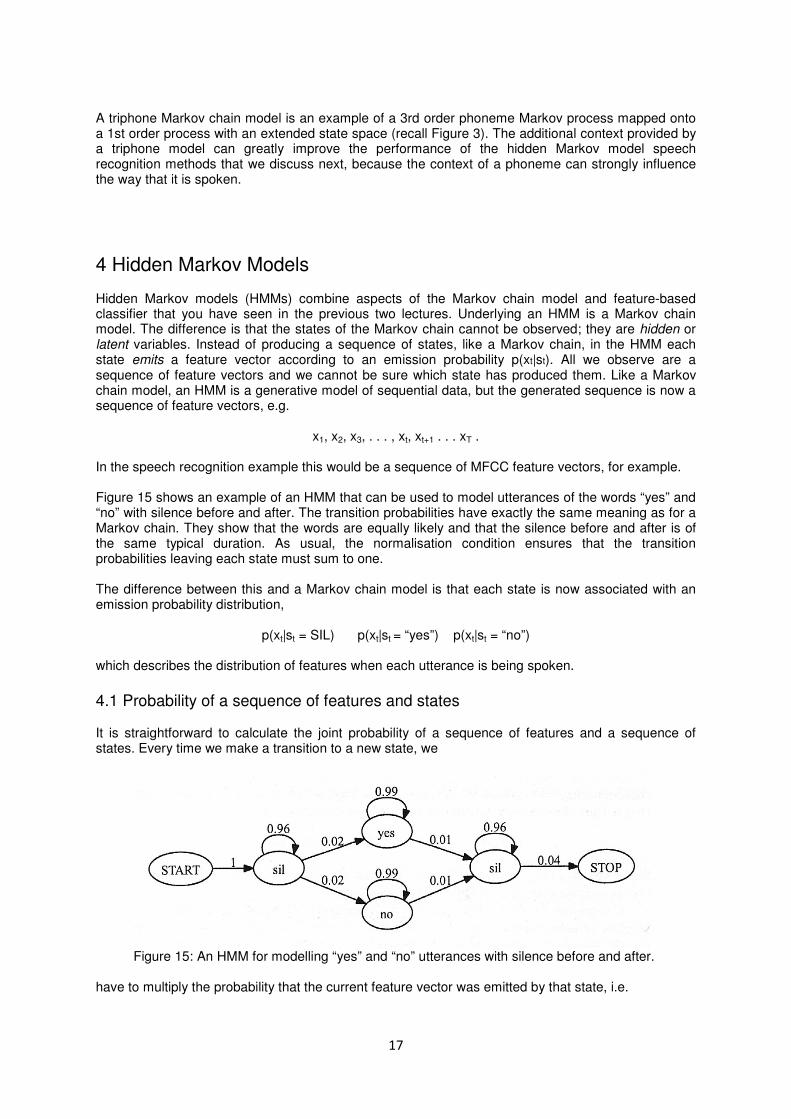
x1, x2, x3, . . . , xt, xt+1 . . . xT . In the speech recognition example this would be a sequence of MFCC feature vectors, for example. Figure 15 shows an example of an HMM that can be used to model utterances of the words “yes” and “no” with silence before and after. The transition probabilities have exactly the same meaning as for a Markov chain. They show that the words are equally likely and that the silence before and after is of the same typical duration. As usual, the normalisation condition ensures that the transition probabilities leaving each state must sum to one. The difference between this and a Markov chain model is that each state is now associated with an emission probability distribution,
p(xt|st = SIL) p(xt|st = “yes”) p(xt|st = “no”) which describes the distribution of features when each utterance is being spoken.
4.1 Probability of a sequence of features and states It is straightforward to calculate the joint probability of a sequence of features and a sequence of states. Every time we make a transition to a new state, we
Figure 15: An HMM for modelling “yes” and “no” utterances with silence before and after.
have to multiply the probability that the current feature vector was emitted by that state, i.e.

18
����, ��, ⋯ , �3 , &�, &�, ⋯ , &3� = ��&������|&����&�|&������|&��⋯ ⋯��&3|&3������3|&3���/012|&3� = ��&��,��&4 �|&4����4|&4�
3
4%�
(10) where sT+1 = STOP. The problem is, we don’t know what the state sequence s = s1, s2 . . . sT is. If we knew the state sequence, then we would already have solved the problem since we would know which word has been spoken. Our task is to make inferences only using the feature data. This task can be carried out by two approaches, described below, for which efficient algorithms exist.
4.2 Classification One approach is to compute the probability of the observed sequence of features for models corresponding to different classes of data. For example, we can construct an HMM for utterances of the word “yes” as shown in Figure 16.
Figure 16: An HMM for modelling the word “yes” with silence before and after.
As before we will call “yes” class C1 and “no” class C2. We can use this model in order to work out p(x1, x2, . . . , xT |C1). We can use a similar model of the word “no” and compute p(x1, x2, …, xT |C2). Then Bayes’ theorem allows us to classify a sequence,
����|��, ��, ⋯ , �3� = ����, ��, ⋯ , �3|������������, ��, ⋯ , �3|�������� + ����, ��, ⋯ , �3|��������
As usual, we need to assign the prior p(C1) in order to use this classification rule. We also need a way of efficiently computing p(x1, x2, …, xT |Ci) for each model. We can use a similar recursion relation to the one for summing over paths in the Markov chain model, which was given by equation (8). For each model we calculate,
����, &�� = ����|&����&�� ����, ��, ⋯ , �4 , &4� = ���4|&4� O ��&4|&4�������, ��, ⋯ , �4��, &4���VWX2 ≤ Z ≤ 0
78a�∈:
����, ��, ⋯ , �3� = O ����, ��, ⋯ , �3 , &3���/012|&3�:R∈:
(11) This is known as the Forward Algorithm in the HMM literature, because it involves iterating forward along the sequence from t = 1 until terminating at t = T .
4.3 Decoding A classification approach works well for distinguishing between a small number of possible words or phrases. However, if we want to recognise whole sentences then this approach is not feasible. We can hardly consider a different model for every possible sentence in the English language. Instead,

19
we have to use a decoding approach to the problem. We want to determine which state sequence s = s1, s2, . . . , sT corresponds to a particular sequence of feature vectors x1, x2, . . . , xT (recall Figure 3). A sensible choice is the sequence s* that is most likely given the sequence of feature vectors,
&∗ = ��&|��, ��, ⋯ , �3�7�,7�,⋯,7Rcdefc
Here, argmax means that the quantity on the right is maximised with respect to the quantity written underneath. This is an example of an optimisation problem, since we are finding the state sequence that optimises a particular quantity. Optimisation is important in many areas of Artificial Intelligence. It turns out that there exists an efficient algorithm for working this out, the celebrated Viterbi Algorithm. It has a similar recursive form to the Forward Algorithm. The details are beyond the scope of this course, but if you are interested then there are some good HMM reviews available that discuss it. Rabiner’s [2] is a classic and also discusses speech recognition (you can find it via the University website) while Durbin et al. [1] provide a nice introduction to HMMs in a different application domain. These are both at an advanced level. Viterbi decoding was used in order to remove the silence from the data you saw in Lab 2. The optimal path through a model like the one in Figure 15 was obtained for all 165 examples in order to identify which parts of the speech were associated with the SIL states. All the feature vectors associated with the SIL states were then removed from the MFCC data files. For Lab 3 you will be working with the original uncropped data.
4.4 Training The transition and emission probabilities can be estimated by fitting them to training data. If the training data sequences are labelled, so that the corresponding state sequences are known, then training is straightforward. In this case the transition probabilities can be calculated using counts in the same way as for the Markov chain model, while the emission probability densities can be estimated in a similar fashion to the normal density models described earlier. However, hand-labelling of training data is difficult, time consuming and error prone. It is more usual that the training data is not labelled, although the sentence or words being spoken in the training data will usually be known. In this case training can be carried out using the Baum-Welch algorithm. The details of this algorithm are beyond the scope of the course. It is a special case of the EM-algorithm, which is also very useful in many other areas of Machine Learning.
Acknowledgements Many thanks to Gwenn Englebienne for providing the figures for the signal processing examples and for help in processing the speech data.
References 1 R. Durbin, S.R. Eddy, A. Krogh, and M. Mitchison. Biological Sequence Analysis. Cambridge
Uuniversity Press, 1998. 2 L. R. Rabiner. A tutorial on hidden Markov models and selected applications in speech
recognition. Proceedings of the IEEE, 77:257–286, 1989.