commuting mass transport calculator - gbca
TRANSCRIPT

commuting mass transport calculator guide
June 2009

1Date Issued: June 2009
TABLE OF CONTENTS1.0 INTRODUCTION 3
2.0 DIFFERENCES BETWEEN GREEN STAR RATING TOOLS 3
3.0 HOW THE CALCULATOR WORKS 3
3.1 DEFINITION OF TERmS USED IN THIS GUIDE 4
4.0 HOW TO USE THE CALCULATOR 4
4.1 OpTION ONE: DEEmED TO SATISFy CRITERIA BASED ON pOSTCODES 4
4.2 OpTION TWO: DEEmED TO SATISFy CRITERIA BASED ON pROxImITy TO TRAIN STATION 6
4.3 OpTION THREE: mANUAL DATA ENTRy 7
4.3.1 WALKING DISTANCE FROm BUILDING ENTRANCE TO TRANSpORT STOp 8
4.3.2 AvERAGE INTERvAL BETWEEN SERvICES DURING pEAK pERIODS 9
4.4 ADDITIONAL GUIDANCE 12
AppENDIx A – WEIGHTINGS AND pOINT ALLOCATION SySTEm 13
AppENDIx B – DOCUmENTATION REQUIREmENTS FOR DEEmED TO SATISFy 16
AppENDIx C – ExAmpLES 18

2Date Issued: June 2009
Tool Version Revision Date Issued
Commuting mass Transport Calculator Guide – Release
A June 2009

3Date Issued: June 2009
The Green Building Council of Australia (GBCA) has developed a Commuting mass Transport Calculator (the Calculator) that is used in all Green Star rating tools to assess how well a building can be accessed using public mass transport. The Calculator determines the number of points awarded out of the five available for the Green Star credit Tra-4 ‘Commuting mass Transport1’ . This Calculator Guide (the Guide) should be used in conjunction with the Calculator in the Green Star rating tools.
The Calculator allows projects to be compared against a benchmark on identical terms. This is essential for Green Star assessment. The Calculator determines the number of points awarded based on the type of mass Transport; the ‘Average Interval Between Services During peak periods’; and the proximity of the mass Transport stops to the development.
1 The Credit is called ‘Commuting mass Transport’ in Green Star – Office Design v2, and Green Star – Office As Built v2 and ‘public Transport’ in Green Star - Office Interiors
v1.1. The guidelines in this document are relevant to these Rating Tools as well.
1.0 – INTrOduCTION
2.0 – dIFFErENCES BETwEEN GrEEN STAr rATING TOOLS
Since the Calculator has been designed to assess the sector specific transport needs for different building types, there are slight differences in each Green Star rating tool. The following issues have been changed in the Calculator to reflect the sector specific requirements:
Green Star – Retail Centre: Data for Saturdays and late night shopping transport need to be included.•Green Star – Education tool: Higher values are assigned to bus services since there are often dedicated bus services for schools and •universities.Green Star – multi Unit Residential: Data for transport on weekends needs to be included.•
3.0 – HOw THE CALCuLATOr wOrkS
The Calculator determines the number of Green Star points achieved based on scores representing the type and ‘Average Interval Between Services During peak periods’ of mass Transport routes, as well as their proximity to the building. Data can be entered manually or by selecting pre-assessed or deemed to satisfy options as explained in the sections below. points are awarded in proportion to the proximity of a building to mass Transport stops and the frequency of the mass Transport services. Appendix A outlines in detail the values and scores assigned for each transport service, its frequency, and proximity to the building.

4Date Issued: June 2009
3.1 – dEFINITION OF TErmS uSEd IN THIS GuIdE
4.0 – HOw TO uSE THE CALCuLATOr
4.1 – OpTION ONE: dEEmEd TO SATISFy CrITErIA BASEd ON pOSTCOdES
The following definitions are used for the different terminology used in this Guide and the Calculator:
Afternoon peak period – Refers to the afternoon period where mass transportation is mostly used. For the purposes of Green Star, •this is between 4:30pm and 6:30pmBus Route – The route regularly followed by a passenger bus•Ferry Route – The route regularly followed by a passenger ferry•mass Transport – Transportation by bus, train, tram or ferry, which provides service on a regular and continuing basis•mass Transport Service (or ‘Service’) – Refers to a vehicle (train, tram, bus or ferry) covering a particular route at a given time•morning peak period – Refers to the morning period where mass transportation is mostly used. For the purposes of Green Star, this •is between 7:30am and 9:30amRailway and Tram Line – The route taken by a passenger train or tram•Transport Interchange – A location where passengers are exchanged between services of the same or different mode of transport. •These locations include train stations; bus and tram stops; and ferry wharfs.
The Calculator is embedded in the Green Star rating tools, which are located on the GBCA website, www.gbca.org.au/greenstar. It can be found on a tab in the spreadsheet after the Transport Category. There are three main options to follow when using the Calculator:
Deemed to satisfy criteria based on the postcode of the development site;1. Deemed to satisfy criteria based on proximity to selected train stations; and 2. manual data entry for trains, buses, trams and ferries. 3.
All options are described in detail in this Guide. please note that data should only be entered in the white cells of the Calculator.
This option allows projects to automatically achieve five Green Star points when they are located within one of the selected postal regions listed in Table 1, and within 500m walking distance of either:
A bus interchange with at least six bays; or •A train station with at least four platforms.•
If the postcode of the project is not listed2, or the project is not eligible (as outlined above); data for bus, tram and/or ferry services should be manually entered. Data for train services could be manually entered or the deemed to satisfy option can be used, as explained in section 4.2.
2 As additional qualifying postcodes become available they will be incorporated into the Calculator.

5Date Issued: June 2009
ACT NSW VIC QLD SA WA NT TAS 2000 3000 4000 5000
2010 3008
2060 3121
3205
Table 1: postcodes with a ‘Deemed to Satisfy’ provision
Figure 1: Sample of postcode selected automatically displaying the five ‘points Achieved’
If eligible, select the postcode of the project site from the dropdown list. The Calculator will automatically display the maximum five points as shown in Figure 1. Compliance Requirements documentation for the Deemed to Satisfy Criteria based on postcodes is outlined in Appendix B.

6Date Issued: June 2009
The GBCA has pre-assessed a number of train stations3 in different cities based on the number of railway lines servicing that particular station, as well as the ‘Average Interval Between Services During peak periods’. projects located within 1km of these pre-assessed stations can use this option by selecting train stations from the list in the ‘Deemed to Satisfy Criteria Based on proximity to Train Station’ option in the ‘Train Services’ section of the Calculator (Figure 2). If the project is not within 1km of these pre-assessed stations, the ‘manual Data’ entry option should be used as described in Section 4.3 below.
Up to five points will be awarded depending on the distance and the ‘Average Interval Between Services During peak periods’ at the particular train station. When five points are not awarded based just on proximity to train stations, additional points can be achieved by manually entering data for buses, trams and ferries where applicable as per section 4.3.
3 As additional train station details become available they will be listed on the GBCA website and incorporated into the Calculator.
4.2 – OpTION TwO: dEEmEd TO SATISFy CrITErIA BASEd ON prOxImITy TO TrAIN STATION
Once the ‘Deemed to Satisfy Criteria Based on proximity to Train Station’ option is selected, train stations in NSW, QLD and vIC can be selected from the ‘Train Stations’ section as shown in Figure 3. Note that the ‘State’ field will be automatically displayed according to the information entered in the ‘Building Input’ section of the Rating Tool. If the state is other than NSW, QLD or vIC, the ‘Train Stations’ option is not displayed in the Calculator.
Figure 2: Options for Train Data Entry
Figure 3: List of Train Stations
7Date Issued: June 2009
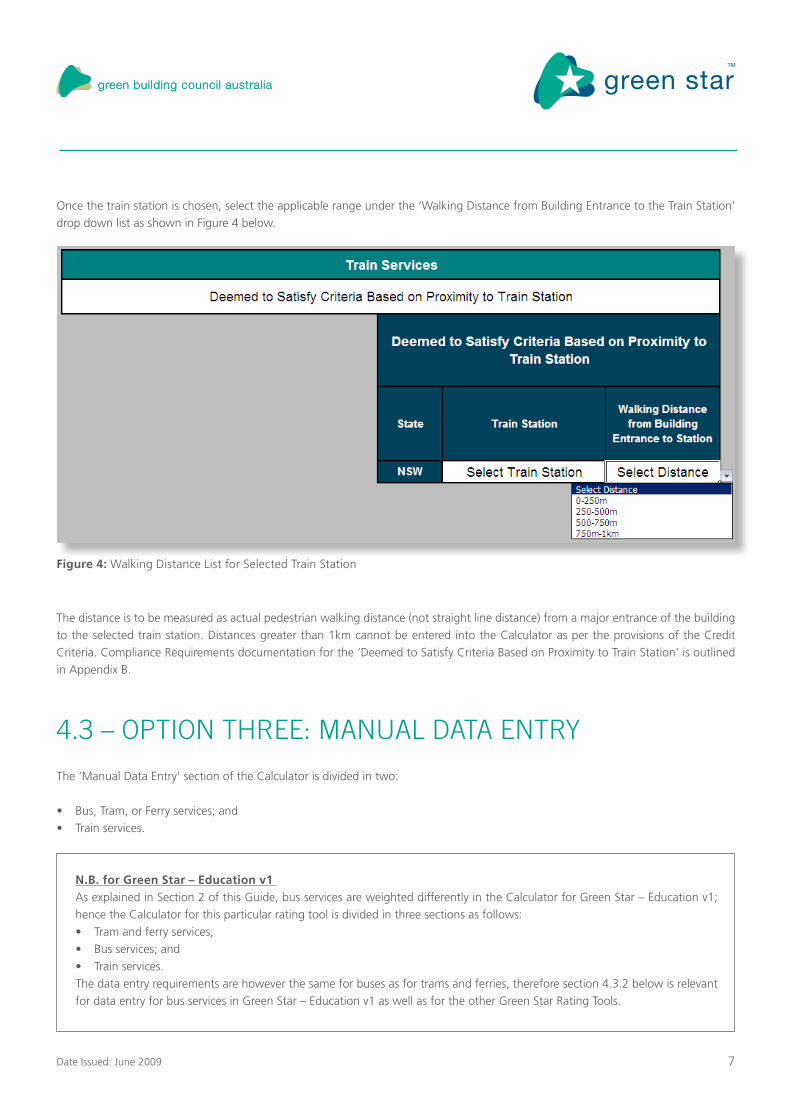
Once the train station is chosen, select the applicable range under the ‘Walking Distance from Building Entrance to the Train Station’ drop down list as shown in Figure 4 below.
The distance is to be measured as actual pedestrian walking distance (not straight line distance) from a major entrance of the building to the selected train station. Distances greater than 1km cannot be entered into the Calculator as per the provisions of the Credit Criteria. Compliance Requirements documentation for the ‘Deemed to Satisfy Criteria Based on proximity to Train Station’ is outlined in Appendix B.
The ‘manual Data Entry’ section of the Calculator is divided in two:
Bus, Tram, or Ferry services; and•Train services.•
N.B. for Green Star – Education v1 As explained in Section 2 of this Guide, bus services are weighted differently in the Calculator for Green Star – Education v1;
hence the Calculator for this particular rating tool is divided in three sections as follows: Tram and ferry services; •Bus services; and•Train services. •
The data entry requirements are however the same for buses as for trams and ferries, therefore section 4.3.2 below is relevant for data entry for bus services in Green Star – Education v1 as well as for the other Green Star Rating Tools.
Figure 4: Walking Distance List for Selected Train Station
4.3 – OpTION THrEE: mANuAL dATA ENTry

8Date Issued: June 2009
The manual data entry option requires a number of calculations prior to entering the data in the Calculator. All calculations required are described in detail in this section. The calculation requirements are the same for buses, trams, ferries and trains. However, as the modes of transport are weighted differently, data needs to be entered in separate tables. Note that each route for all eligible modes of transport must be assessed individually before the data is entered to the Calculator. Refer to Appendix A for further detail on how the transport score and the Green Star points are calculated.
Data about each particular route should be entered to the section of the calculator shown in Figure 5. The cell in which data should be entered is determined by calculating the following two indicators:
‘Walking Distance from Building Entrance to Transport Service’, (determines which row in the table should be used); and•‘Average Interval Between Services During peak periods’ (determines which column should be used). •
How these indicators should be calculated is explained in Sections 4.3.1 and 4.3.2, respectively; and some additional rules are provided in Section 4.4 of this Guide.
The distance between the building and the transport service is to be measured as actual pedestrian walking distance (not straight line distance) from a major entrance of the building to the relevant train station, bus/tram stop or ferry wharf. The Calculator includes four distance range groups:
0-250m•250-500m•500-750m•750m-1km.•
Figure 5: manual Data Input Table
4.3.1 – wALkING dISTANCE FrOm BuILdING ENTrANCE TO TrANSpOrT STOp

9Date Issued: June 2009
The ‘Average Interval Between Services During peak periods’ should be assessed individually for each mode of transport route. This should be calculated using the following methodology:
Determine the number of services during peak periods for each route.1. Calculate the ‘Average Interval Between Services During peak periods’ for each route.2.
1. Determine the number of services during peak periods for each routeThe number of services for each route servicing a stop (located within 1km walking distance of the building) needs to be determined for morning and afternoon peak periods. An example of data for two bus routes can be seen in Table 2. The number of services between peak periods for Route ‘1’ and Route ‘2’ is nine and seven respectively for ‘morning periods’, and four and nine for ‘Afternoon periods’. For the purposes of the Green Star rating tools, the GBCA has set morning and afternoon peak hours as follows:
morning peak period: Between 7:30am and 9:30am monday to Friday excluding public holidays•Afternoon peak period: Between 4:30am and 6:30pm monday to Friday excluding public holidays•
2. Calculate the Average Interval Between Services During Peak Periods The ‘Average Interval Between Services’ (AIBS) per route should be calculated separately for morning and afternoon peak periods by dividing 120 minutes (number of minutes in the two hour peak period) by the number of services of the route during the peak period. For example, using the data in Table 2, The ‘Average Interval Between Services’ for Route 1 during the morning peak period is 13 minutes calculated as follows:
Likewise, the ‘Average Interval Between Services’ (AIBS) for Route 1 during the Afternoon peak period is 30 minutes calculated as follows:
4.3.2 – AvErAGE INTErvAL BETwEEN SErvICES durING pEAk pErIOdS
N.B for Green Star – Retail Centre and Green Star – Multi Unit Residential:Services outside the above peak periods are not considered for Green Star assessment with the following exceptions:
Green Star – Retail Centre, in which the number and ‘Average Interval Between Services’ has to be determined for Saturdays •and late night shopping as follows:
For Saturdays, any two hour period between 9:00am and 5:00pm; and -For late night shopping, between 7:00pm and 9:00pm monday to Friday excluding public holidays -
Green Star – multi Unit Residential, in which the number and ‘Average Interval Between Services’ has to be determined for •weekends as follows:
For Saturdays and Sundays, any two hour period between 9:00am and 5:00pm -
AIBS = 120 = 13.33min 9
AIBS = 120 = 30min 4

10Date Issued: June 2009
Once these figures are obtained, the ‘Average Interval Between Services During peak periods’ (AIBSpp) is obtained by adding the two ‘Average Interval Between Services’ and divide the resulting number by two. The ‘Average Interval Between Services During peak periods’ for Route 1 is 22 minutes calculated as follows:
Calculations are required for each route servicing the stop. In the example of Table 2, the same calculations are required for Route 2 where the ‘Average Interval Between Services During peak periods’ is 15 minutes.
AIBSpp = 13.33 + 30 = 21.6min 2
Table 2: Sample data for the calculation of the ‘Average Interval Between Services During peak periods’ for two bus routes.
Continued >
Sample Bus Routes
Time of Services Morning Peak Period
Route 1 (Northbound Services)
Route 2 (Southbound Services)
7:25am 7:15am
7:45am 7:30am
8:00am 7:45am
8:15am 8:00am
8:25am 8:15am
8:35am 8:30am
8:50am 9:00am
9:05am 9:30am
9:15am 10:00am
9:25am -
9:40am -
Number of Services 9 Number of Services 7

11Date Issued: June 2009
Sample Bus Routes
Time of Services Afternoon Peak Period
Route 1 (Northbound Services)
Route 2 (Southbound Services)
4:20pm 4:25pm
4:50pm 4:40pm
5:20pm 4:55pm
5:50pm 5:05pm
6:20pm 5:15pm
6:50pm 5:25pm
- 5:35pm
- 5:45pm
- 6:00pm
- 6:15pm
- 6:35pm
- -
Number of Services 4 Number of Services 9
Assuming that the walking distance from the building entrance to the bus stop is 575m; data should be entered to the Calculator as shown in Figure 6 where each route is represented by a ‘1’ and is entered in the respective cells.
N.B. Standard rounding convention should be used (i.e. 13.3 is rounded to 13 and 13.5 is rounded to 14) Note that this example is just for two routes. The same calculations are required for other routes if applicable, and figures should be entered into the calculator accordingly (e.g. if there are three routes and each of them has an ‘Average Interval Between Services During peak periods’ ≤ 15, a ‘3’ should be entered in the relevant cell).

12Date Issued: June 2009
‘Route 1’
‘Route 2’
1 1
Figure 6: Data Entry based on Example
The following additional rules should be considered when using the Calculator:Mass Transport Route
A route that provides services in two directions (e.g. northbound and southbound) should be considered as two different routes. •Note that intervals between services may be different for each direction.Routes with an ‘Average Frequency Between Services During peak periods’ of more than 30 minutes are not eligible for •assessment.A transport route that terminates within 2km of the site is to be counted as half a service.•
Mass Transport StopsIn cases where a transport route services several stops within 1km from the building, only one stop (the closest to the building) •can be included for assessment. Only transport routes that service the selected stop can be included for assessment. •Transport stops located more than 1km from the building are not eligible for assessment.•
Transport InterchangeRoutes servicing a nearby Transport Interchange4 can be included in the assessment provided that:
The Transport Interchange can be accessed by mass Transport within a travel time of no more than 15 minutes and an ‘Average •Interval Between Services During peak periods’ of no more than 30 minutes.
If the conditions above are met, data for routes servicing the Transport Interchange can be entered in the Calculator as follows:Each route servicing the Transport Interchange should be entered into the Calculator as ‘0.5’ instead of ‘1’ (see Example in •Appendix C); andThe ‘Walking distance from Building Entrance to Transport Stop’ for the routes servicing the Transport Interchange is equal to •the actual walking distance from the site to the connecting service stop plus 250m.
N.B. Routes servicing more than one Transport Interchange can be included for assessment providing the conditions above are met and each route servicing the Transport Interchange is considered for calculations just one time.
4 As per the definition of terms in section 3.1 of this Guide, any given bus or tram stop; train station; or ferry wharf serviced by the same or a different mode of transport
following a different route can be considered a Transport Interchange.
4.4 – AddITIONAL GuIdANCE

13Date Issued: June 2009
AppENdIx A – wEIGHTINGS ANd pOINT ALLOCATION SySTEm

14Date Issued: June 2009
Each mass Transport route is allocated a score in the Calculator depending on the proximity to the site and its ‘Average Interval Between Services During peak periods’. This score is then used to calculate the Green Star points. The score is calculated as per Table 3.:
Green Star – OfficeGreen Star – Office InteriorsGreen Star – Retail Centre
Green Star – Multi Unit ResidentialGreen Star - HealthcareGreen Star – Industrial
Walking Distance from Building Entrance to Mass TransportAverage Interval Between Services
During Peak Periods
≤15min ≤30min
Score for bus, tram and ferry services
0-250m 6 4
250-500m 5 3
500-750m 4 2
750-1km 3 1
Score for train services
0-250m 7 5
250-500m 6 4
500-750m 5 3
750-1km 4 2
Green Star – Education
Walking Distance from Building Entrance to Mass TransportAverage Interval Between Services
During Peak Periods
≤15min ≤30min
Score for tram and ferry services
0-250m 6 4
250-500m 5 3
500-750m 4 2
750-1km 3 1
Score for bus and train services
0-250m 7 5
250-500m 6 4
500-750m 5 3
750-1km 4 2
Table 3: Allocation of points in the Calculator

15Date Issued: June 2009
The score achieved for each route is added to produce a total Calculator score. This total score is then converted to Green Star points as per Table 4.
Green Star – OfficeGreen Star – Office Interiors
Green Star – EducationGreen Star - HealthcareGreen Star - Industrial
Total Mass Transport Calculator Score
Number of Green Star points for Tra-4
10 1
20 2
40 3
60 4
80 5
Green Star – Retail Centre
Total Mass Transport Calculator Score
Number of Green Star points for Tra-4
10 1
20 2
40 3
60 4
Late night shopping and Saturdays
20 1
Green Star – Multi Unit Residential
Total Mass Transport Calculator Score
Number of Green Star points for Tra-4
10 1
20 2
40 3
60 4
Weekends
20 1
Table 4: Total scores required to achieve Green Star points in the credit Tra-4 ‘Commuting mass Transport’ for each of the Green Star rating tools.

16Date Issued: June 2009
AppENdIx B: COmpLIANCE rEquIrEmENTS FOr dEEmEd TO SATISFy

17Date Issued: June 2009
Option One - Deemed to Satisfy Criteria based on Postcodes:
Completed Green Star mass Transport Calculator•A Site plan or a location map, extending to the surrounding areas demonstrating the length of the walking distance from the •major entrance(s) of the building to the entrance of the Transport Stop.
Option Two - Deemed to Satisfy Criteria based on proximity to train station:
Completed Green Star mass Transport Calculator•A Site plan or a location map, extending to the surrounding areas demonstrating the length of the walking distance from the •major entrance(s) of the building to the entrance of the relevant train station.
Option Three – Manual Data Entry
As per the relevant Technical manual

18Date Issued: June 2009
AppENdIx C: ExAmpLES

19Date Issued: June 2009
For this example assume a building that due to its location is not eligible for the ‘Deemed to Satisfy Options’ based on postcodes or proximity to pre-assessed train stations. The data to determine the points gained under the Tra-4 ‘Commuting mass Transport’ Credit would need to be entered into the Calculator manually. The following assumptions should also be considered:
There is one train station located 643m walking distance from the main entrance to the building.•The train stopping at that station services just two routes – northbound and southbound.•peak morning and afternoon periods as per Green Star provisions are between 7:30am and 9:30am, and 4:30pm and 6:30pm •(120 minutes per peak period).The number and time of services during peak periods varies depending on the direction of the train as shown in Table 5. •
Example 1: Calculation of ‘Average Interval Between Services during peak periods’ for a Train route
Morning Peak PeriodRoute 1
Northbound ServicesRoute 2
Southbound Services
Time of Service Time of Service
7:28am 7:25am
7:48am 7:45am
8:08am 8:05am
8:48am 8:25am
9:15am 8:55am
9:20am 9:00am
9:30am 9:20am
9:38am 9:25am
- 9:35am
Number of Services 6 Number of Services 7
Afternoon Peak PeriodRoute 1
Northbound ServicesRoute 2
Southbound Services
Time of Service Time of Service
4:26pm 4:25pm
4:56pm 4:45pm
5:16pm 5:05pm
5:36pm 5:25pm
6:06pm 5:55pm
6:46pm 6:00pm
- 6:05pm
- 6:15pm
- 6:35pm
Number of Services 4 Number of Services 7
Table 5: Time and Number of Services During peak periods for Two Train Routes

20Date Issued: June 2009
Route 1 Route 2
‘Average Interval Between Services’ for morning peak period
‘Average Interval Between Services’ for Afternoon peak period
‘Average Interval Between Services During peak periods’
As explained in section 4.3.2 of this Guide, the ‘Average Interval Between Services During peak periods’ for each route was calculated as shown in Table 6.
The ‘Average Interval Between Services During peak periods’ is 25 minutes for Route 1, and 17 minutes for Route 2. Based on the results of these calculations and the assumptions above, data should be entered in the calculator as shown in Figure 7.
AIBS = 120 = 20min 6
AIBS = 120 = 17.14min 7
AIBS = 120 = 17.14min 47
AIBSpp = 20 + 30 = 25min 2
AIBSpp = 17.14 + 17.14 = 17.14min 2
AIBS = 120 = 30min 4
Table 6: Calculations of ‘Average Interval Between Services During peak periods’
Figure 7: Data Entry for Example 1
Both Routes have an ‘Average Interval Between Services During peak periods’ of more than 15 minutes, hence a ‘2’ should be entered in this cell.

21Date Issued: June 2009
Using all suppositions in Example 1, consider the following extra assumptions:
The train route that stops near the building services a Transport Interchange with a travel time of 12 minutes. •Six additional bus routes service the Transport Interchange; three arriving routes and three departing.•
Since the ‘Average Interval Between Services During peak periods’ for the train routes servicing the Transport Interchange is 25 and 17 minutes respectively; data for the additional bus routes servicing the Transport Interchange can be entered into the Calculator as per the rules in Section 4.4 of this guide.
The time and number of services during peak periods, and the ‘Average Interval Between Services’ calculations for each bus route are shown in Table 7.
Example 2: Calculation of ‘Average Interval Between Services during peak periods’ for routes Servicing a Nearby Transport Interchange
Morning Peak Period Services ‘To’ and ‘From’ Transport Interchange
Bus A Bus B Bus C
Route 1 To Transport Interchange
Route 2 From Transport
Interchange
Route 3 To Transport Interchange
Route 4 From Transport
Interchange
Route 5 To Transport Interchange
Route 6 From Transport
Interchange
Time Time Time Time Time Time
7:25am 7:20am 7:18am 7:45am 7:15am -
7:45am 7:40am 7:48am 8:30am 8:00am 6:45am
8:00am 8:00am 8:18am 9:15am 8:10am 7:45am
8:15am 8:20am 8:48am 10:00am 8:20am 8:45am
8:30am 8:40am 9:18am - 8:30am 9:45am
8:45am 9:00am 9:48am - 8:40am -
9:00am 9:20am - - 8:50am -
9:15am 9:40am - - 9:00am -
9:35am - - - 9:45am -
Number of Services Route 1
7Number of Services
Route 34
Number of Ser-vices Route 5
7
Number of Services Route 2
6Number of Services
Route 43
Number of Ser-vices Route 6
2
Average Interval Between Services
Route 117.14 min
Average Interval Be-tween Services Route 3
30 minAverage Interval Between Services
Route 517.14 min
Average Interval Between Services
Route 220 min
Average Interval Be-tween Services Route 4
40 minAverage Interval Between Services
Route 660 min
Table 7: Time of Services During peak periods and ‘Average Interval Between Services’ Calculations for three Bus Routes Servicing a Transport Interchange

22Date Issued: June 2009
Afternoon Peak Period of Services ‘To’ and ‘From’ Transport Interchange
Bus A Bus B Bus C
Route 1 To Transport Interchange
Route 2 From Transport
Interchange
Route 3To Transport Inter-
change
Route 4 From Transport
Interchange
Route 5 To Transport Interchange
Route 6 From Transport
Interchange
Time Time Time Time Time Time
4:25pm 4:30pm 4:50pm 4:40pm 4:15pm 4:29pm
4:45pm 4:50pm 5:20pm 4:55pm 4:45pm 4:32pm
5:00pm 5:10pm 5:50pm 5:10pm 5:15pm 4:35pm
5:05pm 5:20pm 6:20pm 5:25pm 5:20pm 4:58pm
5:10pm 5:30pm 6:50pm 5:40pm 5:25pm 5:13pm
5:15pm 5:40pm - 5:55pm 5:30pm 5:22pm
5:20pm 6:00pm - 6:10pm 5:35pm 5:30pm
5:30pm 6:20pm - 6:25pm 5:40pm 5:43pm
6:00pm 6:40pm - 6:40pm 5:45pm 5:59pm
6:15pm - - - 6:00pm 6:22pm
6:30pm - - - 6:30pm 6:28pm
6:45pm - - - 7:00pm 6:43pm
Number of Services Route 1
10Number of Services
Route 34
Number of Ser-vices Route 5
10
Number of Services Route 2
8 Number of Services
Route 48
Number of Ser-vices Route 6
10
Average Interval Between Services
Route 1 12 min
Average Interval Between Services
Route 3 30 min
Average Interval Between Services
Route 512 min
Average Interval Between Services
Route 215 min
Average Interval Between Services
Route 4 15 min
Average Interval Between Services
Route 612 min
Average Interval Between Services Dur-ing peak periods for Bus A Route 1 =
14.57 minutes ≈ 15 minutes
Average Interval Between Services Dur-ing peak periods for Bus B Route 3 = 30
minutes
Average Interval Between Services During peak periods for Bus C Route 5
= 14.57 minutes ≈ 15 minutes
Average Interval Between Services Dur-ing peak periods for Bus A Route 2 =
17.50 minutes ≈ 18 minutes
Average Interval Between Services Dur-ing peak periods for Bus B Route 4 = 27.50
minutes ≈ 28 minutes
Average Interval Between Services During peak periods for Bus C Route 6
= 36 minutes

23Date Issued: June 2009
The ‘Average Interval Between Services During peak periods’ for each route was calculated as per the instructions within this Guide. Data is entered into the Calculator in the ‘Bus, Tram and Ferry Services’ section as shown in Figure 8. This figure also shows data entered for ‘Trains’ as per Example 1 as well as the total number of points awarded.
According to the rules in Section 4.4 of this Guide, three bus services from and to the Transport Interchange are to be counted as six different routes, and should be entered in the Calculator as ‘0.5’ per service when eligible. The walking distance figure should be the distance from the stop near the building plus 250m. Since the assumed walking distance used in Example 1 is 643m, the distance to be used when entering data for routes to and from the Transport Interchange is 893m.
The calculation figures at the bottom of Table 7 indicate that five out of six bus routes servicing the Transport Interchange have an ‘Average Interval Between Services During peak Hours’ of 30 minutes or less. Bus C – Route 6 should be excluded from being entered into the Calculator as per the provisions of this Guide.
A project with the assumptions provided in Examples 1 and 2 would be awarded one point for this credit.
As per Example 1
Note that one point would be awarded with
the assumptions of Examples 1 and 2.
Route 1 and Route 4 should be entered in this cell as ‘0.5’ each.
Routes 2, 3 and 4 should be entered in this cell as ‘0.5’ each.
Figure 8: Data Entry for Example 1 and Example 2