community structures. my t. thai [email protected] 2 what is community structure definition: a...
TRANSCRIPT

Community Structures

My T. [email protected]
2
What is Community Structure
Definition: A community is a group of nodes in which:
There are more edges (interactions) between nodes within the group than to nodes outside of it

My T. [email protected]
3
Why Community Structure (CS)?
Many systems can be expressed by a network, in which nodes represent the objects and edges represent the relations between them: Social networks: collaboration, online social
networks Technological networks: IP address networks,
WWW, software dependency Biological networks: protein interaction networks,
metabolic networks, gene regulatory networks


My T. [email protected]
6
Why Community Structure?
Nodes in a community have some common properties
Communities represent some properties of a networks
Examples: In social networks, represent social groupings based
on interest or background In citation networks, represent related papers on
one topic In metabolic networks, represent cycles and other
functional groupings

My T. [email protected]
7
An Overview of Recent Work
Disjoint CS Overlapping CS
Centralized Approach Define the quantity of modularity and use the greedy
algorithms, IP, SDP, Spectral, Random walk, Clique percolation
Localized Approach Handle Dynamics and Evolution Incorporate other information

Graph Partitioning? It’s not
Graph partitioning algorithms are typically based on minimum cut approaches or spectral partitioning

Graph Partitioning Minimum cut partitioning breaks down when we
don’t know the sizes of the groups
- Optimizing the cut size with the groups sizes free puts all vertices in the same group
Cut size is the wrong thing to optimize
- A good division into communities is not just one where there are a small number of edges between groups
There must be a smaller than expected number edges between communities

My T. [email protected]
10
Edge Betweeness
Focus on the edges which are least central, i.e.,, the edges which are most “between” communities
Instead of adding edge to G = (V, emptyset), progressively removing edges from an original graph G = (V,E)

My T. [email protected]
11
Edge Betweeness
Definition: For each edge (u,v), the edge betweeness of (u,v) is
defined as the number of shortest paths between any pair of nodes in a network that run through (u,v)
betweeness(u,v) = | { Pxy | x, y in V, Pxy is a shortest path between x and y, and (u,v) in Pxy}|


My T. [email protected]
13
Algorithm
Initialize G = (V,E) representing a network while E is not empty
Calculate the betweeness of all edges in G Remove the edge e with the highest betweeness, G
= (V, E – e)
Indeed, we just need to recalculate the betweeness of all edges affected by the removal

My T. [email protected]
14
Time Complexity
Let |V| = n and |E| = m Calculate the betweeness of all edges: O(mn) Since we need to recalculate each time we
remove an edge: O(m2n)


My T. [email protected]
16
Disadvantages/Improvements
Can we improve the time complexity? The communities are in the hierarchical form,
can we find the disjoint communities?

My T. [email protected]
17
Define the quantity (measurement) of modularity Q and find an approximation
algorithm to maximize Q

Finding community structure in very large networksAuthors: Aaron Clauset, M. E. J. Newman, Cristopher Moore 2004
Consider edges that fall within a community or between a community and the rest of the network
Define modularity:
),(22
1wv
vw
wvvw cc
m
kkA
mQ
probability of an edge betweentwo vertices is proportional to their degrees
if vertices are in the same community
adjacency matrix
For a random network, Q = 0 the number of edges within a community is no different
from what you would expect

Finding community structure in very large networksAuthors: Aaron Clauset, M. E. J. Newman, Cristopher Moore 2004
Algorithm start with all vertices as isolates follow a greedy strategy:
successively join clusters with the greatest increase DQ in modularity
stop when the maximum possible DQ <= 0 from joining any two
successfully used to find community structure in a graph with > 400,000 nodes with > 2 million edges Amazon’s people who bought this also bought that…
alternatives to achieving optimum DQ: simulated annealing rather than greedy search

Extensions to weighted networks
Betweenness clustering? Will not work – strong ties will have a disproportionate number of
short paths, and those are the ones we want to keep Modularity (Analysis of weighted networks, M. E. J. Newman)
reuters new articles keywords
),(22
1wv
vw
wvvw cc
m
kkA
mQ
weighted edge
j
iji Ak

Structural Quality
Coverage
Modularity
Conductance
Inter-cluster conductance
Average conductance
There is no single perfect quality function. [Almedia et al. 2011]

ls : # links inside module s
L : # links in the network
ds : The total degree of the nodes in module s
: Expected # of links in module s
Resolution Limit
22
1 1
1
4 2
m ms s s
ss s
d l dQ l
L L L L
2
2sd
L
22

Modularity seems to have some intrinsic scale of order , which constrains the number and the size of the modules.
For a given total number of nodes and links we could build many more than modules, but the corresponding network would be less “modular”, namely with a value of the modularity lower than the maximum
23
The Limit of Modularity
L
L

24
The Resolution Limit
Since M1 and M2 are constructed modules, we have
1 1 2 2 1 22, 2, , / 4a b a b l l L

Let’s consider the following case
• QA : M1 and M2 are separate modules
• QB : M1 and M2 is a single module
Since both M1 and M2 are modules by construction, we need
That is, 25
The Resolution Limit (cont)
21 1 1 1 2 2 1 22 2 2 2B AQ Q Q La l a b a b l l L
0B AQ Q Q
1
21 1 2 2
2
2 2
Lal
a b a b

Now let’s see how it contradicts
the constructed modules M1 and M2
We consider the following two scenarios: ( )• The two modules have a perfect balance between internal and external
degree (a1+b1=2, a2+b2=2), so they are on the edge between being or not being communities, in the weak sense.
• The two modules have the smallest possible external degree, which means that there is a single link connecting them to the rest of the network and only one link connecting each other (a1=a2=b1=b2=1/l).
26
The Resolution Limit (cont)
1 2l l l

When and , the right side of
can reach the maximum value
In this case, may happen.
27
Scenario 1 (cont)
1 2 2a a 1 20, 0b b
1
21 1 2 2
2
2 2
Lal
a b a b
max / 4Rl L
max / 4Rl l L

a1=a2=b1=b2=1/l
28
Scenario 2 (cont)
min
2R
Ll l

For example, p=5, m=20
The maximal modularity of the network corresponds to the partition in which the two smaller cliques are merged
29
Schematic Examples (cont)

Fix the resolution?
Uncover communities of different sizes
My T. [email protected]
30
),(22
1wv
vw
wvvw cc
m
kkA
mQ

Blondel (Louvian method), [Blondel et al. 2008] Fast Modularity Optimization Hierarchical clustering
Infomap, [Rosvall & Bergstrom 2008] Maps of Random Walks Flow-based and information theoretic
InfoH (InfoHiermap), [Rosvall & Bergstrom 2011] Multilevel Compression of Random Walks Hierarchical version of Infomap
Community Detection Algorithms

RN, [Ronhovde & Nussinov 2009] Potts Model Community Detection Minimization of Hamiltonian of an Potts model spin system
MCL, [Dongen 2000] Markov Clustering Random walks stay longer in dense clusters
LC, [Ahn et al. 2010] Link Community Detection A community is redefined as a set of closely interrelated edges Overlapping and hierarchical clustering
Community Detection Algorithms

My T. [email protected]
33
Blondel et al Two Phases:
Phase 1: Initially, we have n communities (each node is a community) For each node i, consider the neighbor j of i and evaluate the
modularity gain that would take place by placing i in the community of j.
Node i will be placed in one of the communities for which this gain is maximum (and positive)
Stop this process when no further improvement can be achieved Phase 2:
Compress each community into a node and thus, constructing a new graph representing the community structures after phase 1
Re-apply Phase 1


State-of-the-art methods Evaluated by Lancichinetti,
Fortunato, Physical Review E 09 Infomap[Rosvall and
Bergstrom, PNAS 07] Blondel’s method [Blondel et.
al, J. of Statistical Mechanics: Theory and Experiment 08]
Ronhovde & Nussinov’s method (RN) [Phys. Rev. E, 09]
Many other recent heuristics OSLOM, QCA…
No Provable Performance GuaranteeNeed Approximation Algorithms
36

Power-Law Networks
We consider two scenarios: PLNs with the power exponent
Covers a wide range of scale-free networks of interest, such as scientific collaboration network (WWW with
Provide a constant approximation algorithm PLNs with
Provide an approximation algorithm
37

PLNs Model P(α, β)
38

LDF Algorithm – The Basis
Randomly group with one of its neighbor, the probability of “optimal grouping”:
Lower the degree of , higher the chance of “optimal grouping”
LDF Algorithm: Join/group “low degree” nodes with one of their neighbors.
Lemma: (Dinh & Thai, IPCCC ‘09) Every non-isolated node must be in the same community with one of its neighbor, in order to maximize modularity .
u v
w
x
y z
39

Algorithm 1. Low-degree Following Algorithm(Parameter ) 1. 2. for each with do3. if () then4. if then 5. 6. 7. else8. Select 9. 10. L:= 11. for each do12. 13. 14. Optional: Refine + Post-optimization15. return
• Low degree node = “Nodes with degree at most a constant ” (determined later).
• Join each low degree node with one of its neighbor. Labeling:
+ Members follow Leaders + Orbiters follow Members
• Isolated nodes Leaders
• A community = One leader + members + orbiters
• Refine CS: swapping adjacent vertices, merging adjacent communities, .etc
Joining nodes in non-decreasing order of degree. Select that maximizes Q.
Break tie by selecting the neighbor that maximizes .
Break tie by selecting the neighbor that maximizes .
LDF Algorithm
40

An Example of LDF
41

Theorem: Sketch of the proof = (fraction of edges within communities) –(fraction of edges within communities in a RANDOM graph with same node degrees) Given a community structure .
: Number of edges within : Total degree of vertices in , i.e. the volume of
• Power-law network with exp. : , for large
• is arbitrary small and only depends on constant
• One leader members• One member orbiters Small volume communities leaders’ degree
42

LDF Undirected -Theorem
43

D-LDF – Directed Networks
Use “out-degree” (alternatively in-degree) in places of “degree”u
v
• In directed network, the fraction reduced by half:
• One leader : members• One member: up to
orbiters Small volume communities leaders’ degree
44

D-LDF – Directed Networks
Introduce a new Pruning Phase: “Promote” every member with more than a constant orbiters to leaders (and their orbiters to members)
Create a new community for those promoted.
u
v
u
v
𝑑𝑐=445

LDF-Directed Networks
Theorem: For directed scale-free networks with (or ), the modularity of the community structure found by the D-LDF algorithm will be at least for arbitrary small . Thus, D-LDF is an approximation algorithm with approximation factor .
46

Dynamic Community Structure
t t+1 t+2Time
move
more edges
merge
Network evolution
47

Quantifying social group evolution (Palla et. al – Nature 07)
Developed an algorithm based on clique percolation -> allows to investigate the time dependence of overlapping communties Uncover basic relationships characterizing
community evolution Understand the development and self-
optimization
48
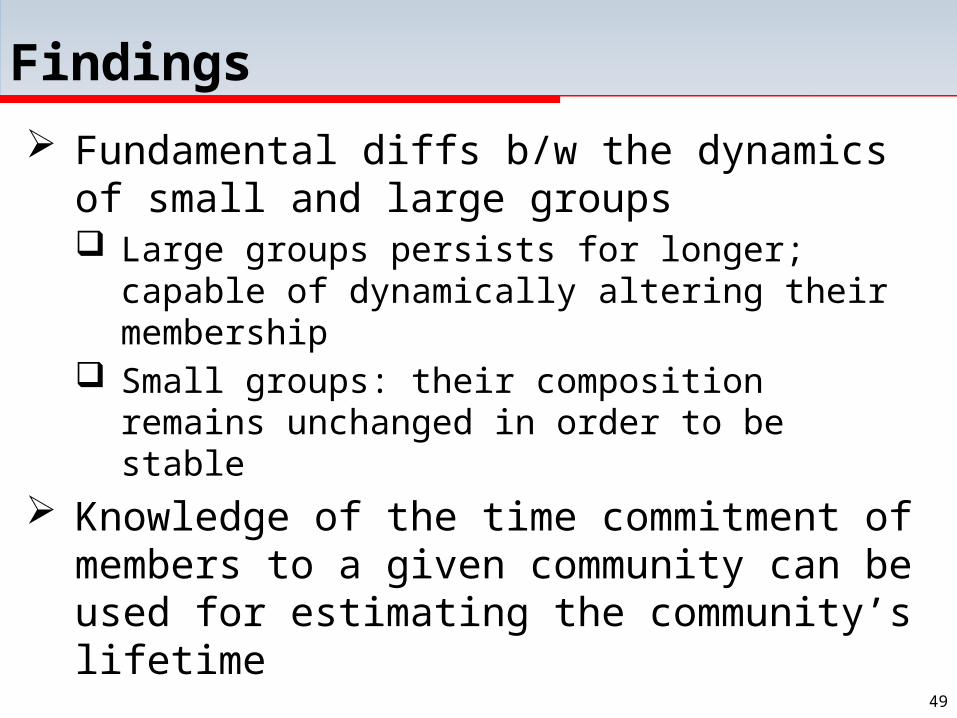
Findings
Fundamental diffs b/w the dynamics of small and large groups Large groups persists for longer; capable of
dynamically altering their membership Small groups: their composition remains
unchanged in order to be stable Knowledge of the time commitment of
members to a given community can be used for estimating the community’s lifetime
49

50

51

52

Research Problems
How to update the evolving community structure (CS) without re-computing it
Why? Prohibitive computational costs for re-
computing Introduce incorrect evolution phenomena
How to predict new relationships based on the evolving of CS
53

An Adaptive Model
Input networ
k
Network changesBasic communities
Basic CS
Updated communities
:
:
• Need to handle– Node insertion– Edge insertion– Node removal– Edge removal
54

Related Work in Dynamic Networks
GraphScope [J. Sun et al., KDD 2007] FacetNet [Y-R. Lin et al., WWW 2008] Bayesian inference approach [T. Yang et al., J.
Machine Learning, 2010] QCA [N. P. Nguyen and M.T. Thai, INFOCOM 2011] OSLOM [A. Lancichinetti et al., PLoS ONE, 2011] AFOCS [Nguyen at el, Mobicom 2011]
55

An Adaptive Algorithm for Overlapping
Input networ
k
Network changesBasic
communities
Phase 1: Basic CS detection ()
Updated communities
Phase 2: Adaptive CS update ()
Our solution:AFOCS: A 2-phase and
limited input dependent framework
N. Nguyen and M. T. Thai, ACM MobiCom 2011 56

Phase 1: Basic Communities Detection
Basic communities Dense parts of the networks Can possibly overlap Bases for adaptive CS
update
Duties Locates basic communities Merges them if they are highly
overlapped
57

Phase 1: Basic Communities Detection
Locating basic communities: when (C) (C)
(C) = 0.9 (C) =0.725
Merging: when OS(Ci, Cj)
OS(Ci, Cj) = 1.027 = 0.75
58

Phase 1: Basic Communities Detection
59
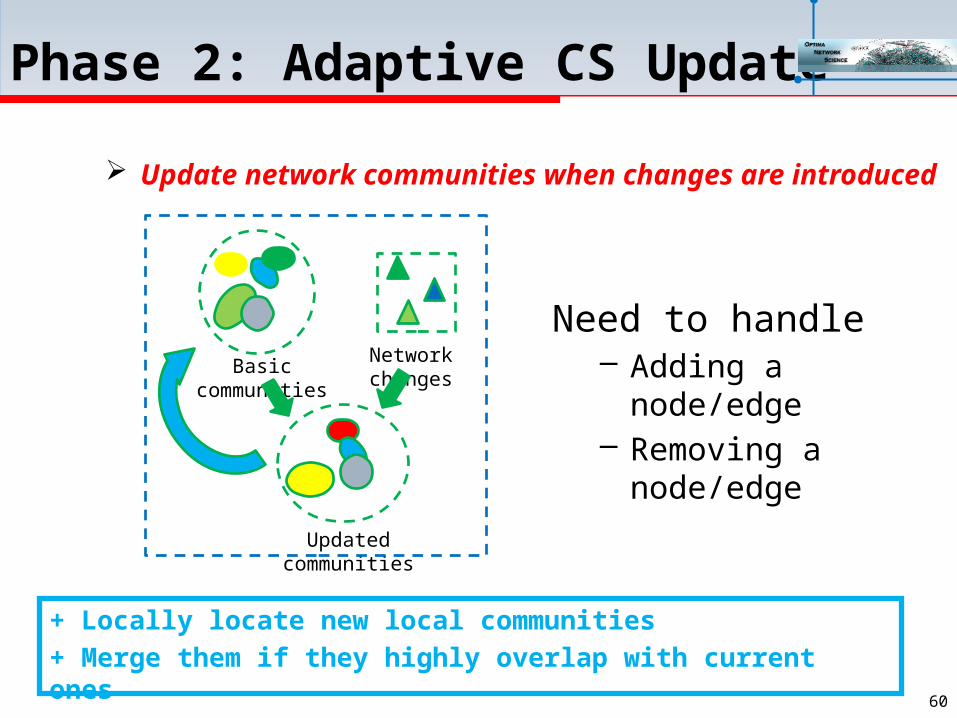
Phase 2: Adaptive CS Update
Update network communities when changes are introduced
Network changes
Basic communities
Updated communities
Need to handle– Adding a
node/edge– Removing a
node/edge
+ Locally locate new local communities+ Merge them if they highly overlap with current ones
60
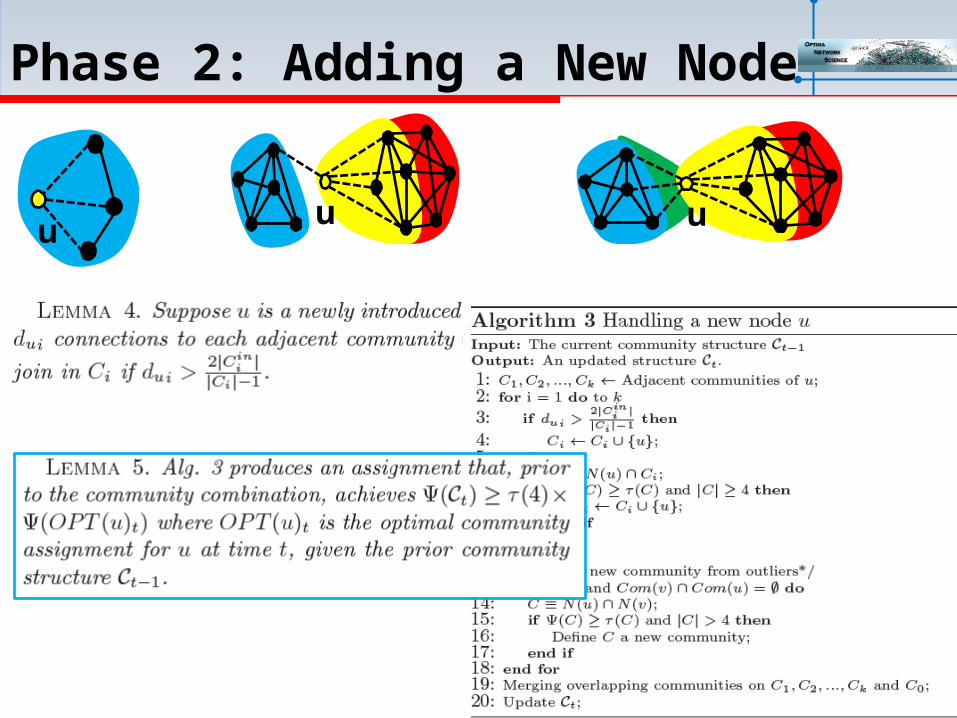
Phase 2: Adding a New Node
u u u
61

Phase 2: Adding a New Edge
62

Phase 2: Removing a Node
Identify the left-over structure(s) on C\{u}Merge overlapping substructure(s)
63

Phase 2: Removing an Edge
Identify the left-over structure(s) on C\{u,v}Merge overlapping substructure(s)
64

AFOCS performance: Choosing β
65

AFOCS v.s. Static Detection
+ CFinder [G. Palla et al., Nature 2005]+ COPRA [S. Gregory, New J. of Physics, 2010]
66

AFOCS v.s. Other Dynamic Methods
+ iLCD [R. Cazabet et al., SOCIALCOM 2010]
67

Adaptive CS Detection in Dynamic Networks
Running time is proportional to the amount of changes
Can be locally employed
More consistent community structure: Critical for applications such as routing.
4. Changes
in the Network
5. OutputCS
6. Compact Representation
Graph (CRG)
7. CS DetectionAlgorithm
1. Initial Network
START2. CS
DetectionAlgorithm
3. Refine
CS
• Significantly reduce the size of the network
• Allow higher quality (often more expensive) Algorithm in place of
68

b
a
3
b
a
1028
16
2
2z
y
x
tt
y
x z
10 20
12
2
2
b 2t
yx
a
z
10 20
12
2
2
b2t
yx
a
z
Adaptive CS Detection in Dynamic Networks
1. Initial network2. Detect CS with Algo. 3. Compress each community
into a single node; self-loops represents the weights of the within community edges.
4. Update changes in the network5. Affected nodes = Nodes incident
to changed edges/nodes6. Construct CRG by “pulling out”
affected nodes from their communities
7. Find CS of the CRG with Algo. 69

A-LDF – Dynamic Network Algorithm
Changes in the
Network
OutputCS
Compact Representation
Graph
CS DetectionAlgorithm
Initial Network
STARTCS
DetectionAlgorithm
Refine CS
• Both selected as the LDF algorithm (without the refining phase)
• Compact representation:• Label nodes that
represents communities with leader.
• Unlabel all pulled out nodes (nodes that are incident to changes).
70

A-LDF – Dynamic Network Algorithm
For dynamic scale-free networks with , A-LDF algorithm: for . Approximation algorithm. Running time where is the set of
“affected nodes”.
71

Experimental Results Datasets
Static data sets: Karate Club, Dolphin, Twitter, Flickr, .etc
Dynamic social networks: Facebook (New Orleans): 63 K nodes, 1.5 M edges ArXiv Citation network: 225 K articles, ~40 K new each
year
Metrics Modularity Number of communities Running time Normalized Mutual Information (NMI)
72

Static Networks Size
# Vertices Edges
1 Karate 34 78
2 Dolphin 62 159
3 Les Miserables 77 254
4 Political Books 105 441
5 Ame. Col. Fb. 115 613
6 Elec. Cir. S838 512 819
7 Erdos Scie. Collab. 6,100 9,939
8 Foursquare 44,832 1,664,402
9 Facebook 63,731 905,565
10 Twitter 88,484 2,364,322
11 Fllickr 80,513 5,899,882
73

Performance Evaluation
Karate
Les M
iserab
les
Amer Colg.
Fb.
Scien
. Colla
b.
Face
bookFll
ickr
0.40000.45000.50000.55000.60000.65000.70000.75000.80000.8500
LDFBlondelOptimal
Mod
ular
ity
Karate
Les M
iserab
les
Amer Colg.
Fb.
Scien
. Colla
b.
Face
bookFll
ickr
0.0001
0.001
0.01
0.1
1
10
LDFBlondel
Runn
ing
time
in se
cond
(s)
74

Evaluation in Dynamic Networks
75
0 2 4 6 8 10 12 14 16 18 20 22 240.25
0.30.35
0.40.45
0.50.55
0.60.65
Modularity (FB)
LDFOslomQCABlondel
Time points
0 2 4 6 8 10 12 14 16 18 20 22 2410
100
1000
10000
Number of communities (FB)
LDFOslomQCABlondel
Time points
0 2 4 6 8 10 12 14 16 18 20 22 240.01
0.1
1
10
100
1000
Running time (FB)
LDFOslomQCABlondel
Time points
0 2 4 6 8 10 12 14 16 18 20 22 240
0.10.20.30.40.50.60.70.80.9
1
NMI (FB)
LDFOslomQCA
Time points
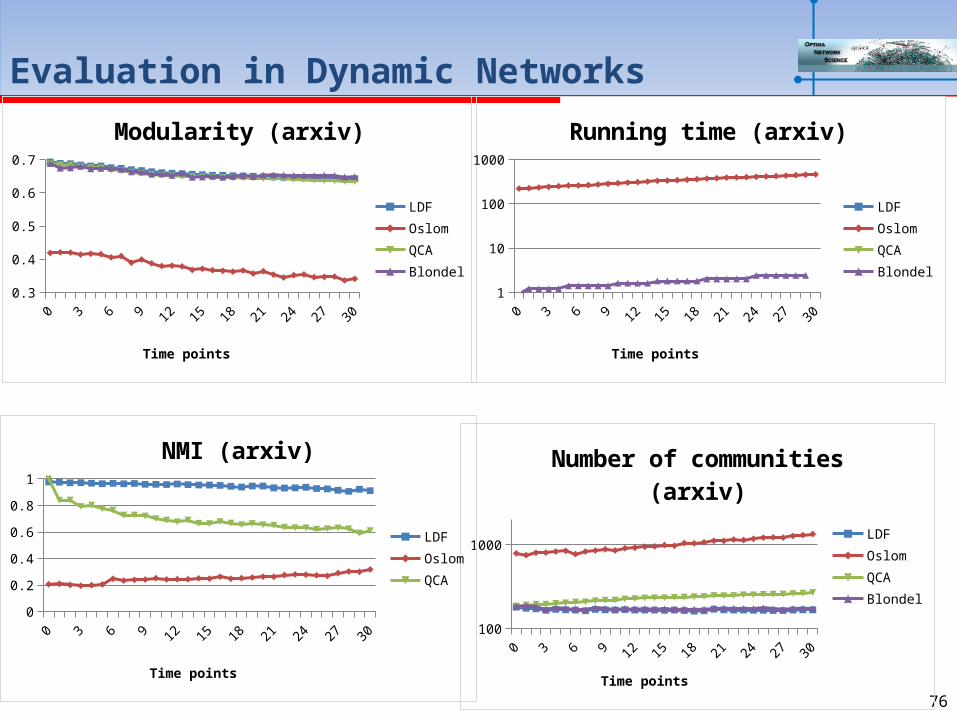
Evaluation in Dynamic Networks
76
0 2 4 6 8 10 12 14 16 18 20 22 24 26 28 300.3
0.350.4
0.450.5
0.550.6
0.650.7
Modularity (arxiv)
LDFOslomQCABlondel
Time points
0 2 4 6 8 10 12 14 16 18 20 22 24 26 28 30100
1000
Number of communities (arxiv)
LDFOslomQCABlondel
Time points
0 2 4 6 8 10 12 14 16 18 20 22 24 26 28 301
10
100
1000
Running time (arxiv)
LDFOslomQCABlondel
Time points
0 2 4 6 8 10 12 14 16 18 20 22 24 26 28 300
0.10.20.30.40.50.60.70.80.9
1
NMI (arxiv)
LDFOslomQCA
Time points

Incorporate other information
Social connections Friendship (mutal) relation (Facebook,
Google+) Follower (unidirectional) relation (Twitter)
77

Incorporate other information
The discussed topics Topics that people in a group are mostly
interested
78

Incorporate other information
Social interactions types Wall posts, private or group messages
(Facebook) Tweets, retweets (Twitter) Comments
79

In rich-content social networks
Not only the topology that mattersBut also, User interests
A user may interested in many communities Community interests
A community may interested in different topics
80

In rich-content social networks
Communities = “groups of users who are interconnected and communicate on shared topics” interconnected by social connection and
interaction types Given a social network with
Network topology Users and their social connections and
interactions Topics of interests
How can we find meaningful communities as well as their topics of interests?
81

Approaches
Use Bayesian models to extract latent communities Topic User Community Model
Posts/Tweets can be broadcasted Topic User Recipient Community Model
Posts/Tweets are restricted to desired users only Full Topic User Recipient Community
Model A post/tweet generated by a user can be based
on multiple topics
82

Assumptions
A user can belong to multiple communities
A community can participate in multiple topics
For TUCM and TURCM Posts in general discuss one topic only
Full TURCM Posts can discuss multiple topics
83

Background
Multinormial distribution – Mult(.) n trials k possible outcomes with prob. p1, p2,…, pk
sum up to 1 X1, X2,.., Xk (Xi denote the number of times outcome #i
appears in n trials)
84

Multinormal distribution
85

Symmetric Dirichlet Distribution
DirK(α) where α = (α1, …, αK) on variable
x1, x2, …, xK where xK = 1 – (x1+..+xK-1) has prob.
86
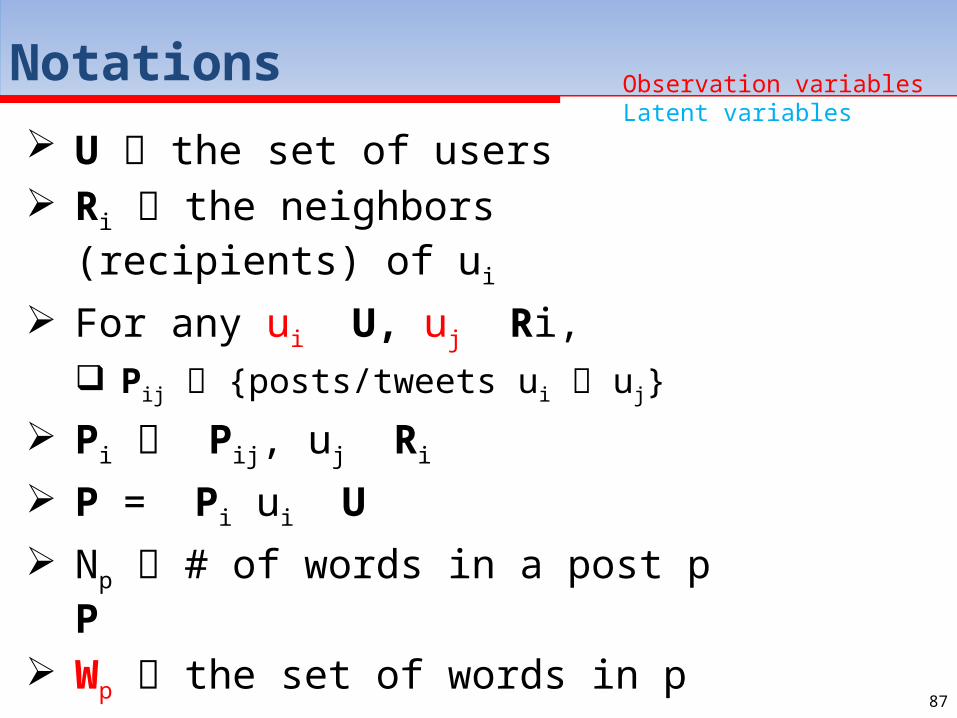
Notations
U the set of users Ri the neighbors (recipients) of
ui
For any ui U, uj Ri, Pij {posts/tweets ui uj}
Pi Pij, uj Ri
P = Pi ui U
Np # of words in a post p P
Wp the set of words in p
Xp the type of p c a community; z a topic
87
Observation variablesLatent variables

Notations (cont’d)
Z the number of topics
C the number of communities
V the size of the vocabulary from which the communications between users are composed
X the number of different type of communications
G(U, E) the social network
E set of edges
DirY(α) Mult(.) multinormal distribution represents ui’s interest in each
topic88

Topic User Community Model
Social Interaction Profile - SIP(ui)
89
The SIP of users is represented as random mixtures over latent community variables Each community is in turn defined as a
distribution over the interaction space

Topic User Community Model
90
1 2

Topic User Community Model
91
3a 3b

TUCM
Model presentation
92
A Bayesian decomposition

TUCM – Parameter Estimation
number of times a given word w occurs in p
C-p, X-p, Z-p and W-p community, post type, topic assignments and set of words except post p
93

TUCM – Parameter Estimation
94

TUCM – Parameter Estimation
95

Topic User Recipient Community
This model Does not allow mass messaging The sender typically sends out messages to
his/her acquaintances The post are on a topic that both sender and
recipient are interested in. In the same spirit of TUCM
Now we have user uj for all uj in Ri
96

TURC
97

Full TURC Model
Previous models Assume that each post generated by a user is
based on a single topic Full TURC
Relaxes this requirement Communities how have a higher relationship
to authors
98

Full TURC Model
99
1
3
2

Full TURC Model
100

Experiments
Data 6 month of Twitter in 2009
5405 nodes, 13214 edges, 23043 posts Enron email
150 nodes, ~300K emails in total
Number of communities C = 10 Number of topics = 20 Competitor methods: CUT and CART
101

Results
102

Results
103

Results
104