community snapshot - adena · community snapshot ross county 5 economy & employment majority of...
TRANSCRIPT
COMMUNITY SNAPSHOT
ROSS COUNTY, OHIO
DRAFT FALL 2015

Prepared for
Adena Health System Business Development Department 272 Hospital Road Chillicothe, Ohio 45601 (740) 779-7500 www.adena.org
Prepared by
planning NEXT 1269 Grandview Avenue Columbus, Ohio 43212 (614) 586-1500 www.planning-next.com
Unless otherwise noted, data has been sourced from the 2000 US Census and the 2013 American Community Survey throughout this report. Additional data sources include:
• Economic Development Alliance of Southern Ohio
• Ross-Chillicothe Convention & Visitors Bureau
• Ohio Development Services Agency
• Robert Wood Johnson Foundation
• ESRI
• Longitudinal Employer-Household Dynamics
• National Parks Service
COMMUNITY SNAPSHOT ROSS COUNTY
1
CONTENTS
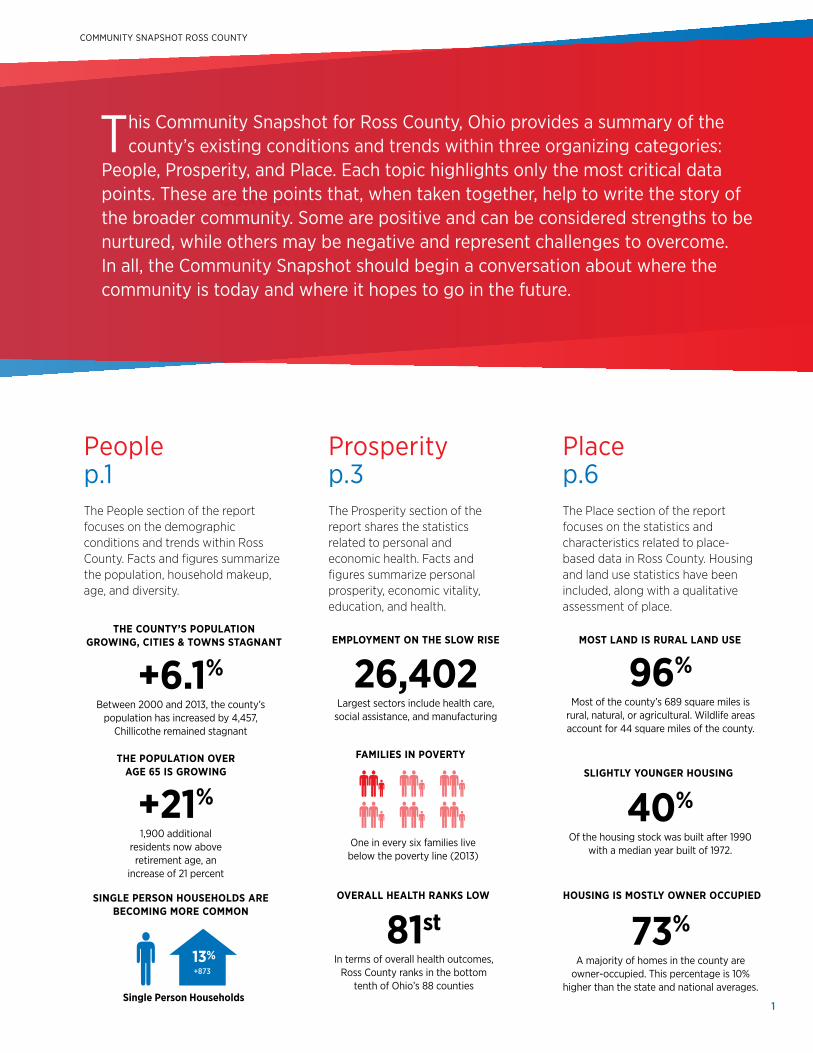
This Community Snapshot for Ross County, Ohio provides a summary of the county’s existing conditions and trends within three organizing categories:
People, Prosperity, and Place. Each topic highlights only the most critical data points. These are the points that, when taken together, help to write the story of the broader community. Some are positive and can be considered strengths to be nurtured, while others may be negative and represent challenges to overcome. In all, the Community Snapshot should begin a conversation about where the community is today and where it hopes to go in the future.
Prosperityp.3The Prosperity section of the report shares the statistics related to personal and economic health. Facts and figures summarize personal prosperity, economic vitality, education, and health.
26,402Largest sectors include health care,
social assistance, and manufacturing
EMPLOYMENT ON THE SLOW RISE
One in every six families live below the poverty line (2013)
FAMILIES IN POVERTY
81stIn terms of overall health outcomes,
Ross County ranks in the bottom tenth of Ohio’s 88 counties
OVERALL HEALTH RANKS LOW
Placep.6The Place section of the report focuses on the statistics and characteristics related to place-based data in Ross County. Housing and land use statistics have been included, along with a qualitative assessment of place.
73%A majority of homes in the county are
owner-occupied. This percentage is 10% higher than the state and national averages.
HOUSING IS MOSTLY OWNER OCCUPIED
40%Of the housing stock was built after 1990
with a median year built of 1972.
SLIGHTLY YOUNGER HOUSING
96%Most of the county’s 689 square miles is
rural, natural, or agricultural. Wildlife areas account for 44 square miles of the county.
MOST LAND IS RURAL LAND USE
Peoplep.1The People section of the report focuses on the demographic conditions and trends within Ross County. Facts and figures summarize the population, household makeup, age, and diversity.
+6.1%Between 2000 and 2013, the county’s
population has increased by 4,457, Chillicothe remained stagnant
THE COUNTY’S POPULATION GROWING, CITIES & TOWNS STAGNANT
+21%1,900 additional
residents now above retirement age, an
increase of 21 percent
THE POPULATION OVER AGE 65 IS GROWING
13%+873
Single Person Households
SINGLE PERSON HOUSEHOLDS ARE BECOMING MORE COMMON

ADENA HEALTH SYSTEM
2
POPULATIONPopulation increasing slowly in the county, stagnant in the City. From a brief pause between 1960 and 1970, the overall population of the county has increased around five percent each decade. The cities and towns have been more variable. Chillicothe has remained relatively stagnant, adding 89 residents between 2000 and 2013. The growth, then is generally happening outside of the county’s cities and towns, and in then unincorporated townships. Regionally, central Ohio is expected to grow by around 500,000 residents by 2030. While not within the immediate growth area, Ross County could expect to receive new residents as a carry over from this growth.
Smaller towns remaining stagnant. While the county added around 3,800 new residents between 2000 and 2013, a majority of this growth took place outside of the small towns. The small villages and towns across the county combined to lose to around 50 residents. Kingston, an outlier, added just under 275 residents over the period, a growth of 25 percent.
PEOPLEThe People section of the report focuses on the demographic conditions and trends within Ross County. The data used are the latest available provided by the American Communities Survey, as well as other sources. Facts and figures summarize the population, household makeup, age, and diversity.
The population forecast uses a linear model to project the 2030 population to top 80,000.
-23.8%
-241
Bainbridge
+17.6%
+91
Clarksburg
-5.2%
-53
Frankfort
+0.4%
+89Chillicothe
FIG 1. POPULATION CHANGE 1950-2030
0
10,000
20,000
30,000
40,000
50,000
60,000
70,000
80,000
90,000
1950 1960 1970 1980 1990 2000 2013 2030
ForecastedPopulation
Ross County
Chillicothe
Source: U.S. Census, American Communities Survey, Ohio Development Services Agency
+6.1%Ross County
The County added 4,457 people since 2000
POPULATION CHANGE, 2000-2013

COMMUNITY SNAPSHOT ROSS COUNTY
3
AGEAging along with the state. As the Baby Boomers enter retirement, the state and the nation are seeing an increasing percentage of their population over the age of 65. Between 2000 and 2013 Ross County’s median age increased from 36.9 to 39.6, or seven percent. This trend mirrors the state’s increase over this period. While the county increase matched comparable trends, in Chillicothe the rate of increase was nine percent, pushing the median age to 43.5 or ten percent higher than the state. Between 2000 and 2013 the number of county residents over the age of 65 grew by 1,900 or by 21 percent.
Largest age cohort approaching retirement. Roughly 16 percent of the county’s population is between the ages of 50 and 59. This cohort is around ten percent larger than the state and the 20 percent larger than the country. The county’s population workforce – those between 18 and 64 – is weighted toward individuals approaching retirement age.
HOUSEHOLDSSmall growth in the total number of households. The number of households increased alongside the change in population from 2000 to 2013. A little over 1,100 new households were added increasing the total by four percent.
The makeup of households is changing. While the median household size remained static, the change in the makeup of households was far more dynamic. The largest growth was in single-person households, which increased by more than 850, or 13 percent over the measured period. Over 65 households also grew by 13 percent, or 351. Households with children, however, decreased over the period by 7 percent or 651 households. The number of divorced men and women in Ross County is two to three times higher than the Ohio and U.S. averages. Of the grandparents living with their grandchildren in Ross County, more than 50 percent are the primary caregiver for their grandchildren. This is notably higher than the Ohio and US.
DIVERSITYA relatively homogeneous community. Just over 90 percent of the population identified as white in 2013. The two largest minority groups include Black or African Americans and individuals of two or more races, with each group representing just over four percent of the population. The Hispanic population increased by more than 400 residents between 2000 and 2013.
Very small foreign-born population. Compared with the state and nation, the county has a very small number of foreign-born residents. 13%
+873
Single Person Households
-7%-651
Households with Children
+21%The population over the age
of 65 grew by 1,900
CHANGE IN THE OVER AGE 65 POPULATION
0.3%Statewide, the foreign-born population is 4.1%.
FOREIGN BORN POPULATION
3%Just over three percent of
residents speak a language other than English at home
ENGLISH AS A SECOND LANGUAGE
39.6 years
In Chillicothe the figure is 43.5 years, more than 10% higher than the state.
MEDIAN AGE (2013)
13%+351
Over-65 Households
Median Household Size
2.5
Source: U.S. Census, American Communities Survey
FIG 2. COUNTY AGE COHORT COMPARISONS, 2013
80 and over
70 to 79
60 to 69
50 to 59
40 to 49
30 to 39
20 to 29
10 to 19
Under 9
0% 5% 10% 15%
Ross CountyOhio
greatest & boomer
gen x
gen z
millenials

ADENA HEALTH SYSTEM
4
PROSPERITYThe Prosperity section of the report focuses on the statistics related to personal prosperity, economic vitality, education, and health. The data has been assembled from a number of sources including the American Community Survey and local sources.
PERSONAL PROSPERITYLower levels of household income. The County’s median household income is lower than the state by almost $4,000. Over half of households (56 percent) earn less than $50,000 per year.
Wages trending upwards, but per capita earnings still below state levels. A majority of sectors reported wage increases from 2008, with the strongest growth in education and health services (26 percent increase). Even with these gains, however, the county still trails the state in per capita earnings by nearly $7,000. The 2013 estimate of $19,626 was about three-quarters the state and the two-thirds the national statistic.
Higher instances of families in poverty. Roughly one in six families are living at, or below the poverty line. Many of these families include children. Nearly a third of the county’s children (under age 18) are in families earning less than the poverty threshold.
Source: U.S. Census ACS 2010-2012 (3 year estimate)
FIG 3. MEDIAN HOUSEHOLD INCOME
Source: U.S. Census ACS 2010-2012 (3 year estimate)
FIG 4. HOUSEHOLD INCOME DISTRIBUTION
20%
15%
10%
5%
0%
Ross County
Ohio
U.S.
Less than $10,000
$10,000 - $14,999
$15,000 - $24,999
$25,000 - $34,999
$35,000 - $49,999
$50,000 - $74,999
$75,000 - $99,999
$100,000 - $149,999
$150,000 - or more
$43,072$4,000 lower than the state
median, $47,782
MEDIAN HOUSEHOLD INCOME, 2013
$35,421Chillicothe
One in every six families live below the poverty line
FAMILIES IN POVERTY, 2013
$50,000
$45,000
$40,000
$35,000
$30,000
Ross County Chillicothe Ohio USA

COMMUNITY SNAPSHOT ROSS COUNTY
5
ECONOMY & EMPLOYMENTMajority of private employment in service providing sectors. Close to 60 percent of all employment within the county is service providing, with the largest share in Trade, Transportation, and Utilities. This sector includes jobs such as trucking, warehousing, and others. Out of all sectors, Education and Health Services recorded the largest growth in employment from 2008, adding just over 11 percent.
Manufacturing still a vital component of the local economy. Even with a loss in the overall number of establishments, the manufacturing sector was still able to add roughly nine percent to its employment since 2008. The sector accounts for roughly a sixth of county’s total economy by employment.
Public sector jobs employ one in four. Between federal, state and local government just under 25 percent of jobs in the county are in the public sector.
Construction in slow recovery. The construction sector reported a 23 percent drop in employment from 2008. This was the largest loss in any sector and a clear result of the national recession. Since 2010, however residential construction has trended upwards. A total of 55 new units were built last year, the most in five years.
Top county employers include a mix of public and private sector companies, governments and institutions. The county’s largest employer, Adena Health System, is a regional healthcare provider with three hospitals. Kenworth Truck Company and P.H. Glatfelter are manufacturers of heavy truck components and specialty papers respectively. Other major employers include local and county governments, and institutions.
Source: U.S. Census ACS 2010-2012 (3 year estimate)
26,402Largest sectors include health care and social assistance and manufacturing*
TOTAL PRIMARY JOBS, 2013
83Represents seven percent of all private, active establishments
BUSINESS STARTS, 2014
410,000In 40-plus years of operation the Chillicothe
plant has produced more than 400,000 trucks
KENWORTH TRUCK PRODUCTION
+11%Employment growth in
education and health services
LARGEST SECTOR CHANGE SINCE 2008
24%Just over 6,000 workers are employed by the local, state,
or federal government
PUBLIC SECTOR EMPLOYMENT, 2014
Source: Economic Development Alliance of Southern Ohio
NAME SECTOR EMPLOYEES
Adena Health System Health/Medical Services
2,953
Kenworth Truck Company (PACCAR) Assembly of Heavy Trucks
2,215
Veterans Affairs Medical Center Veterans Hospital 1,520
P.H. Glatfelter Company Specialty Papers 1,180
Chillicothe Correctional Institution Ohio Penal Institution 532
Ross County Correctional Institution Ohio Penal Institution 493
Ross County County Government 417
Pickaway/Ross Career & Tech Center Vocational Education 344
Chillicothe City School District Education 314
City of Chillicothe City Government 251
FIG 5. MAJOR EMPLOYERS
PUBLIC
SECTOR
GOODS PRODUCING
SERVICE PROVIDING
Manufacturing 15%
Other Sectors 3%
Other Sectors 21%
Local Govt. 12%
State6%
Federal6%
Trade, Transportation & Utilities
19%
Education & Health Services
18%
*Data from the Ohio Development Services Agency
ADENA HEALTH SYSTEM
6
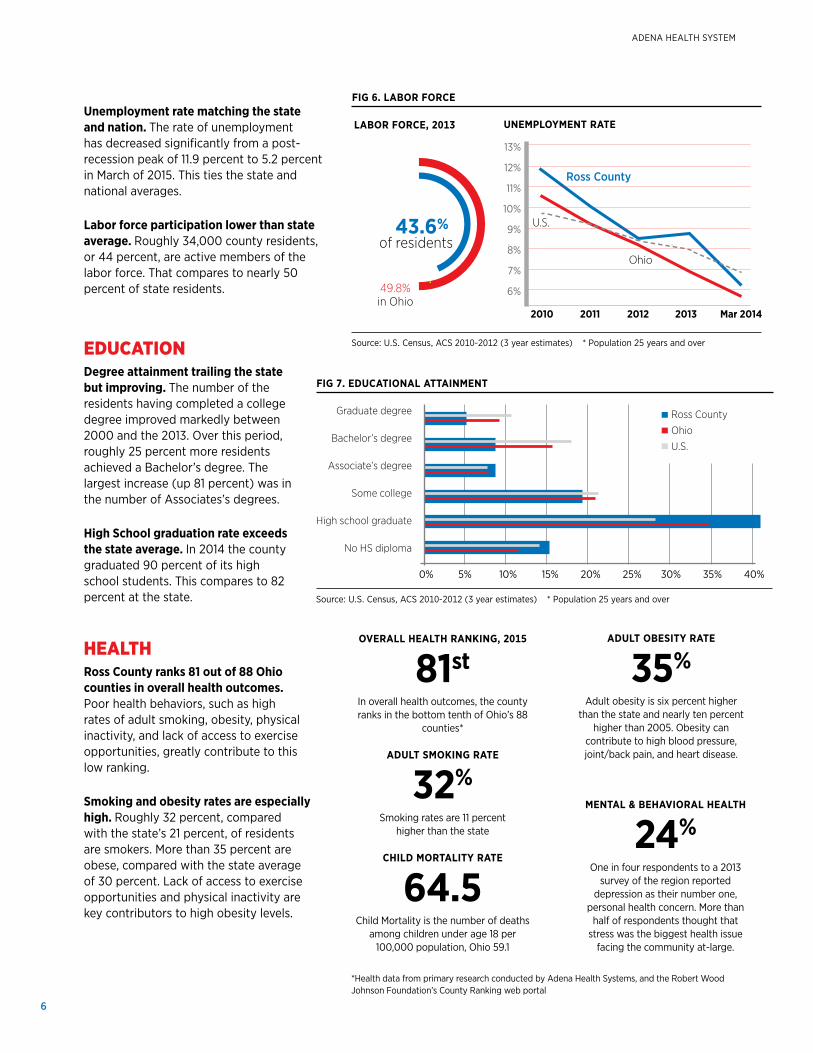
Unemployment rate matching the state and nation. The rate of unemployment has decreased significantly from a post-recession peak of 11.9 percent to 5.2 percent in March of 2015. This ties the state and national averages.
Labor force participation lower than state average. Roughly 34,000 county residents, or 44 percent, are active members of the labor force. That compares to nearly 50 percent of state residents.
EDUCATIONDegree attainment trailing the state but improving. The number of the residents having completed a college degree improved markedly between 2000 and the 2013. Over this period, roughly 25 percent more residents achieved a Bachelor’s degree. The largest increase (up 81 percent) was in the number of Associates’s degrees.
High School graduation rate exceeds the state average. In 2014 the county graduated 90 percent of its high school students. This compares to 82 percent at the state.
HEALTHRoss County ranks 81 out of 88 Ohio counties in overall health outcomes. Poor health behaviors, such as high rates of adult smoking, obesity, physical inactivity, and lack of access to exercise opportunities, greatly contribute to this low ranking.
Smoking and obesity rates are especially high. Roughly 32 percent, compared with the state’s 21 percent, of residents are smokers. More than 35 percent are obese, compared with the state average of 30 percent. Lack of access to exercise opportunities and physical inactivity are key contributors to high obesity levels.
FIG 7. EDUCATIONAL ATTAINMENT
Source: U.S. Census, ACS 2010-2012 (3 year estimates) * Population 25 years and over
Graduate degree
Bachelor’s degree
Associate’s degree
Some college
High school graduate
No HS diploma
0% 5% 10% 15% 20% 25% 30% 35% 40%
Ross County
Ohio
U.S.
LABOR FORCE, 2013
43.6% of residents
49.8% in Ohio
UNEMPLOYMENT RATE
2010 2011 20132012 Mar 2014
Ross County
U.S.
Ohio
13%
12%
11%
10%
9%
8%
7%
6%
FIG 6. LABOR FORCE
Source: U.S. Census, ACS 2010-2012 (3 year estimates) * Population 25 years and over
ADULT SMOKING RATE
32%Smoking rates are 11 percent
higher than the state
ADULT OBESITY RATE
35%Adult obesity is six percent higher
than the state and nearly ten percent higher than 2005. Obesity can
contribute to high blood pressure, joint/back pain, and heart disease.
MENTAL & BEHAVIORAL HEALTH
24%One in four respondents to a 2013
survey of the region reported depression as their number one,
personal health concern. More than half of respondents thought that
stress was the biggest health issue facing the community at-large.
OVERALL HEALTH RANKING, 2015
81stIn overall health outcomes, the county ranks in the bottom tenth of Ohio’s 88
counties*
CHILD MORTALITY RATE
64.5Child Mortality is the number of deaths
among children under age 18 per 100,000 population, Ohio 59.1
*Health data from primary research conducted by Adena Health Systems, and the Robert Wood Johnson Foundation’s County Ranking web portal

COMMUNITY SNAPSHOT ROSS COUNTY
7
PLACEThe Place section of the report focuses on the statistics and characteristics related to place-based information in Ross County. Housing and land use statistics have been included, along with a qualitative assessment of place.
HOUSINGSlightly younger housing stock. The median year built for housing in the county is 1972, with just under 40 percent constructed after 1990. The nineties were one the most active decades for construction when one in five homes were built. The national slowdown in home construction can be seen in the county’s slower performance after 2000, but over the 13 years measured the county still outperformed the state. Roughly 75 percent of housing structures are single-family homes. There is also a large percentage of mobile housing. This makes up 14 percent of all housing, and is much higher than the state average of four percent.
More owner-occupied housing. Homeowners represent 73 percent of the population. This is ten percent higher than the state and national averages.
New to current home. A large majority of residents moved in recently, with 61 percent reporting to have moved in after 2000. More than a quarter of the population moved in after 2005.
Lower median home value. The median home value of owner-occupied housing units is $106,000. This is about 80 percent the state’s amount of $127,000, and much less than the national average of $173,900.
Ross County
Ohio
30%
20%
10%
FIG 8. AGE OF HOUSING
Source: U.S. Census, ACS 2010-2012 (3 year estimates)
Built before 1950
1950’s 1980’s1960’s 1990’s1970’s Built after2000
LAND USEA mostly rural place. Even with a big city like Chillicothe at the center, the county is dominated by rural, agricultural, or natural land. Roughly 96 percent of the county’s 688 square miles is covered by pasture (14 percent), cropland (38 percent), or forest (44 percent).
Urban developed area dominated by Chillicothe. Several small towns are spread evenly across the county, each less than a square mile in area. The city of Chillicothe, at just over ten square miles, is by far the largest urban area. The city peaked in population in 1960 with 24,957 residents, yet has continued to add more incorporated land each decade since.
44%The county has many natural areas
including woodlands
28,440The county’s State Parks, forests,
nature preserves and wildlife areas cover more than 44 square miles
FORESTED AREA
ACREAGE OF NATURAL SPACE & PARKS

ADENA HEALTH SYSTEM
8
PLACE-BASED CHARACTERISTICSThere are a number of qualities about Ross County and its cities and towns that make it unique. Its history, geography, and location combine to form a unique setting with numerous assets and some challenges. Highlights of these include the following.
Historic urban centers. Chillicothe was the first capital of the state of Ohio. The city has a long history by state standards and its downtown helps to tell this story. The Majestic Theatre, the oldest continuously operating theatre in America, Adena, the 1807 home of Ohio’s sixth Governor, Thomas Worthington, and other similarly aged buildings have been maintained and help visitors get a sense of the community’s deep roots.
Walkable urban centers, surrounded by more auto-oriented development. Chillicothe was built in waves of development. These help to illustrate the major shift in transportation over its lifetime. The center of town is characterized by a tight, grid pattern of streets. There are small blocks and a general integration of uses. These characteristics combine to create a more walkable environment for residents and visitors. Farther out, more recent development has occurred at a larger scale. Vast parking lots, winding streets and cul-de-sacs, and limited access points make these areas accessible primarily by car.
Strong Recreational assets. The county is a destination for outdoor pursuits. These include hunting, water recreation, biking and hiking. There are four State Parks, and just over 20 miles of bike paths. The county has just over 28,000 acres of land within State Parks, forests, nature preserves, and wildlife areas.
Large and beautiful natural areas. While cities and towns dot the landscape, the county is primarily rural and open. Just over 44 percent of the land area is forested. Close to 52 percent is used for cropland or pasture. In all, more than 96 percent of county is non-urban.
Good regional access. The county is bisected by three major US routes. From north to south by US Route 23, and from northwest to southeast by US Route 35, and from the southwest to northeast by US Route 50. Each changes between a limited-access expressway and a major artery as it crosses the county. While no interstates run directly through the county, access is relatively close at hand, less than 40 miles to Interstate 71, and 50 miles to I-70.
A divided landscape. The county has been called the “foothills of the Appalachians”. This is because of its slow transition from its flat, agricultural plains in the northwest of the county, to its rolling, forested hills in its southeast. This transition was formed millennia ago by glacial activity, and is a unique feature.
1.
2.
3.
4.
5.
6.
The Majestic Theatre in downtown Chillicothe is the oldest continually operating theatre in the country.
The county’s urban development has two very distinct forms, a walkable pattern (above) and an auto-oriented pattern (below).
Don O’Brien, Flickr
The Hopewell Ceremonial Earthworks applied in 2008 to become a UNESCO World Heritage Site.
The Tri-County Triangle Trail is a 32-mile paved multi-use path across the county.
The Adena Mansion was completed in 1807, for Ohio’s sixth Governor, Thomas Worthington.
Adena Masion and Gardens Society
The Tri-County Trail, Inc.
UNESCO
Don O’Brien, Flickr
Don O’Brien, Flickr

COMMUNITY SNAPSHOT ROSS COUNTY
9
5
5
5
11
1
1
1
2
6
6
4
4
3
2
Chillicothe
South Salem
Frankfort
Clarksburg
KingstonAdelphi
Great Seal State Park
Tar Hollow State Park
Scioto Trails State Park
Paint Creek State Park 50
35
35
23
23
PLACE CHARACTERISTICS
Historic urban center
Walkable urban centers, surrounded by auto-oriented development
Strong recreational assets
Large and beautiful natural areas
Access is a challenge
A divided landscape
1
2
3
4
5
6
Ross
Pike
Fayette
Pickaway
Fairfield
Paint Creek
Scioto River
50
Bainbridge