community resilience indicators project
TRANSCRIPT
Prepared by Loic Le De, Monynna Sath and Anthony Petera (Auckland University of Technology) – 21 September 2020
Final Report: July 2019 – September 2020
Community Resilience Indicators Project
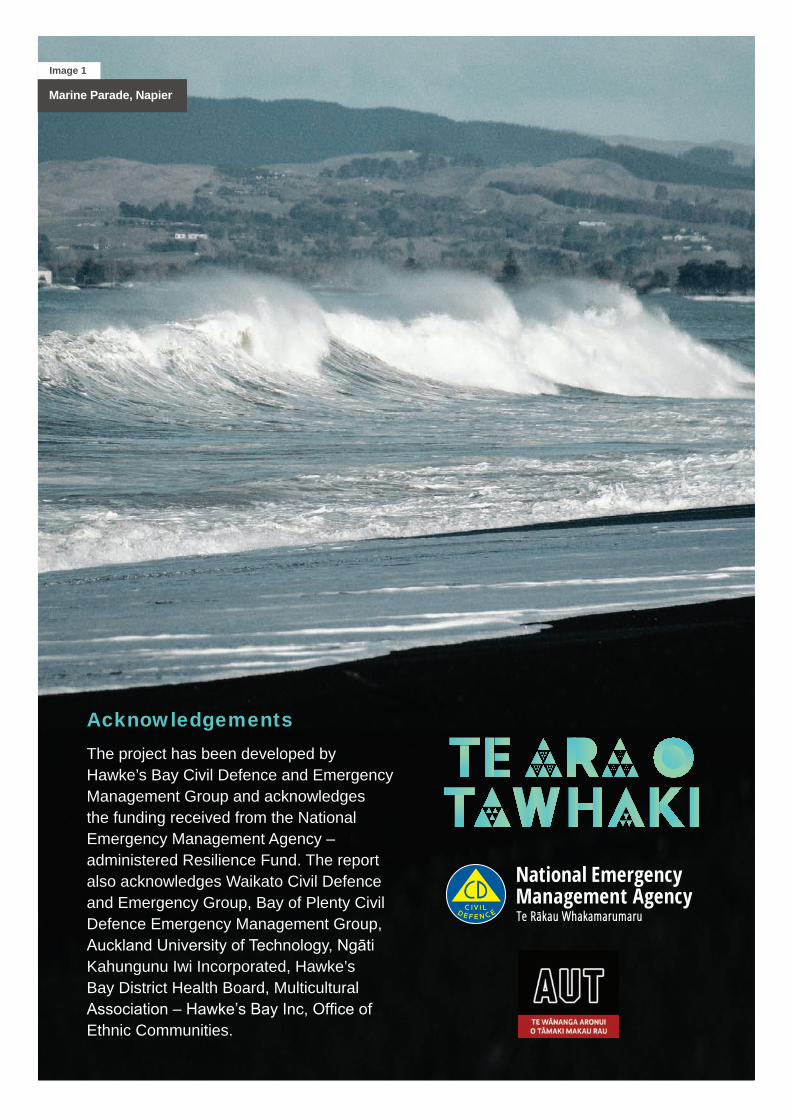
AcknowledgementsThe project has been developed by Hawke’s Bay Civil Defence and Emergency Management Group and acknowledges the funding received from the National Emergency Management Agency – administered Resilience Fund. The report also acknowledges Waikato Civil Defence and Emergency Group, Bay of Plenty Civil Defence Emergency Management Group, Auckland University of Technology, Ngāti Kahungunu Iwi Incorporated, Hawke’s Bay District Health Board, Multicultural Association – Hawke’s Bay Inc, Office of Ethnic Communities.
WHAT MATTERS MOST TO PEOPLE IN AN EMERGENCY
Marine Parade, Napier
Image 1
WHAT MATTERS MOST TO PEOPLE IN AN EMERGENCY
Te ara o Tawhaki > Community Resilience Indicators ProjectWHAT MATTERS MOST TO PEOPLE IN AN EMERGENCY
Table of Contents Introduction: Project background ................................................................................................................................ 1
1. A short review of the concept of resilience .......................................................................................................... 2
2. How is resilience measured? ...................................................................................................................................... 6
3. Methodological approach ......................................................................................................................................... 11
4. Methods: a toolkit for community-centred resilience indicators ............................................................. 13
5. Developing community-centred indicators: key results .............................................................................. 25
6. Discussion ........................................................................................................................................................................ 37
6.1 Positive outcomes of the community-centred indicators ....................................................................... 37
6.2 Limitation and challenges in developing the indicators .......................................................................... 42
6.3 Replication and upscaling: opportunities and challenges ..................................................................... 43
Conclusion ....................................................................................................................................................................... 45
Tihei Mauri Ora
Image 2
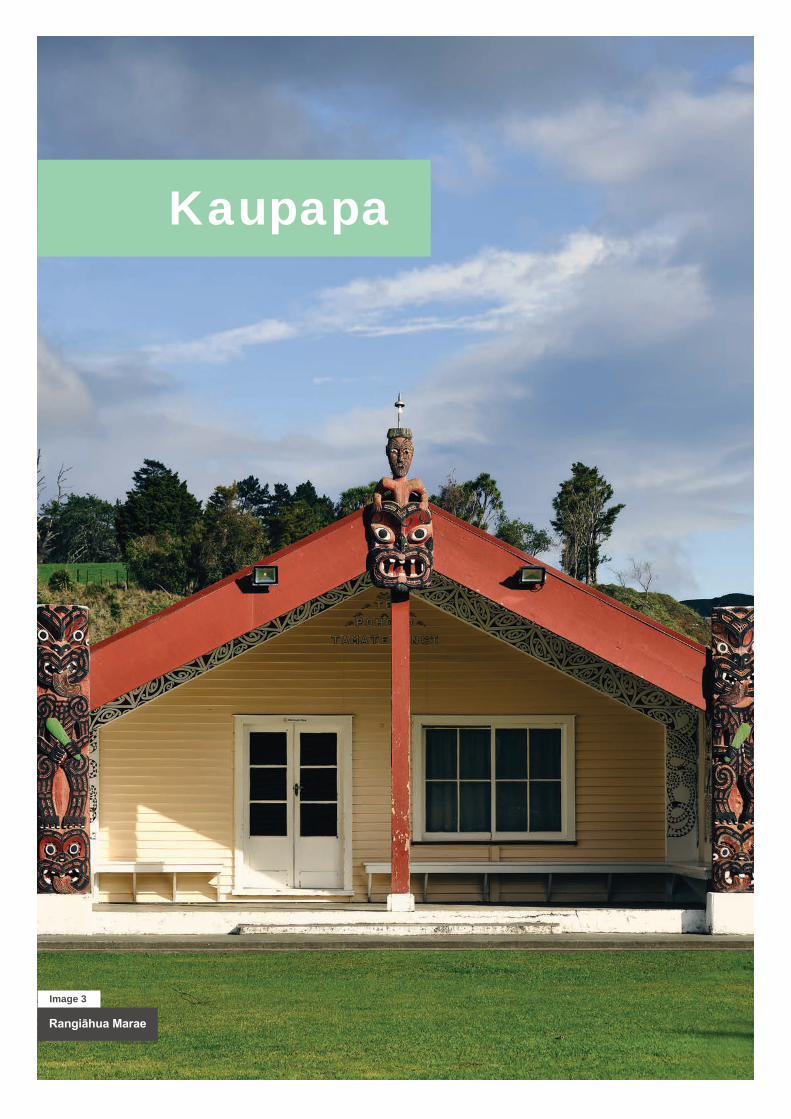
Kaupapa
Rangiāhua Marae
Image 3
WHAT MATTERS MOST TO PEOPLE IN AN EMERGENCY
1Te ara o Tawhaki > Community Resilience Indicators Project
Introduction:Project background On the eve of the emergency management systems reform and after the Nelson fires, the Christchurch
mosque shootings, the Whakaari/White Island disaster, and COVID-19 there is an increasing focus on the
emergency management sector. Of growing importance is the need to focus on people and strengthening
their resilience. Historically there has been an emphasis on readiness and response through community
resilience plans. However, there are still knowledge gaps including better understanding of resilience at
the community level and the effectiveness of CDEM groups initiatives towards strengthening resilience.
Given the inequities facing Māori, reports from Kaikoura and the TAG report in full, there is also a need for
greater responsivity to Māori when designing solutions in the emergency management sector.
In the National Disaster Resilience Strategy (MCDEM, 2019) a community is defined as “A group of people
who: live in an area or place (‘geographic’ or ‘place-based’ community); are similar in some way (‘relational’
or ‘population-based’ community); or have friendships, or a sense of having something in common
(‘community of interest’). People can belong to more than one community, and communities can be of any
size. With increasing use of social media and digital technologies, communities can also be virtual. The
National Resilience Strategy (MCDEM, 2019) defines resilience as the ability to anticipate and resist the
effects of a disruptive event, minimise adverse impacts, respond effectively post-event, maintain or recover
functionality, and adapt in a way that allows for learning and thriving. Historical difficulty has come when
these definitions meet frontline practitioners and local communities.
Designing resilience
The Te ara o Tawhaki is a three-year project that aims to better understand resilience of local communities
through designing indicators. This shall allow both practitioners and local communities to work together to
increase emergency preparedness and enhance welfare during response and recovery. This project attempts
to increase trust between local people and practitioners and ultimately contribute to strengthening community
resilience. The current project directly aligns with the National Disaster Resilience Strategy (MCDEM, 2019),
and has a unique alignment with Māori values as it places people at the heart of emergencies and the
resilience building process. Furthermore, the Hawke’s Bay CDEM Group Plan and Community Resilience
Strategy identify that communities can build resilience through sharing knowledge, cohesion and ongoing
cooperation. The project aims to enhance the ability of CDEM groups to measure resilience at the local level.
One of the outcomes of the project is the replication the proposed approach and tools at the national level.
This report starts with providing a short background on resilience and how it is usually measured. Section
3 explains the methodological approach of this project and section 4 details step-by-step the toolkit or
methods for developing indicators of resilience. The following sections provide the key results from the trial
of this toolkit with four communities. Section 6 analyses the strengths and positive outcomes of the toolkit,
the limitations and challenges linked to it, and the potential for replication in different parts of New Zealand.
Final Report: July 2019 – September 20202
Volunteers at Tihei Mauri Ora
Image 4
1. A short review of the concept of resilience
The concept of resilience has a long history intersecting several disciplines and fields of study (Alexander,
2013). It became popular in environmental studies with Holling’s (1973) paper on the resilience of
ecological systems that underlines the capability of a system to absorb shocks and its ability to reorganise
itself completely into either its pre-existing state or a new recovered one. The concept eventually arose in
disaster studies in the late 1970s (i.e. Torry, 1979), to thereafter spread rapidly. Nowadays, resilience is
a priority of most agendas for DRR at many scales. The Sendai Framework for Disaster Risk Reduction
(DRR) uses the term resilience 35 times, while the Hyogo Framework for Action 2005-2015 utilised
resilience 9 times. Furthermore, international organisations, governmental agencies as well as local
Non-Governmental Organisations (NGOs) also use frameworks, toolkits and reporting systems that are
informed by resilience.
Community led
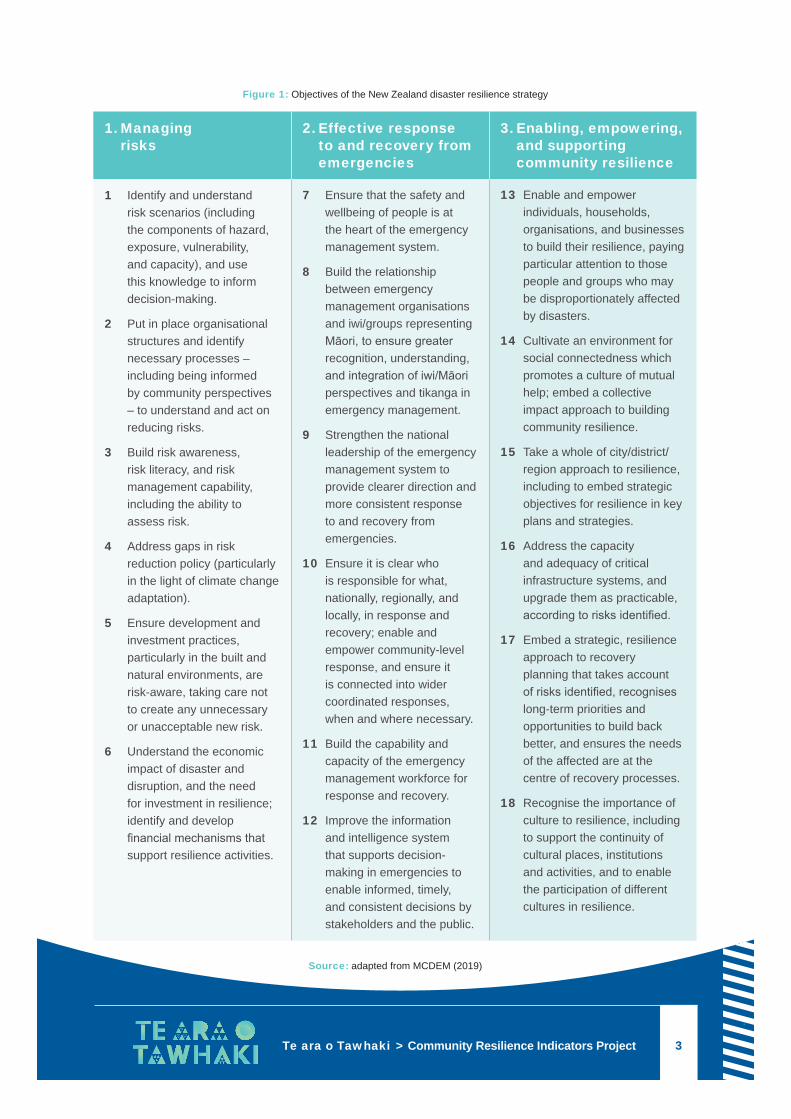
In New Zealand, resilience is integral part of the national strategy since 2019. The National Disaster
Resilience Strategy emphasises its goal is to “strengthen the resilience of the nation […] by enabling,
empowering and supporting individuals, organisations and communities to act for themselves and others,
for the safety and wellbeing of all” (MCDEM, 2019: 3). Furthermore, the objectives of this strategy strongly
emphasise the key role local communities should play in building resilience, including through objectives
2,3,8,10,13,14,17,18 in bold (Figure 1). This reflects a shift of approach from the top-down to the bottom-
up gradually occurring over the last few years.
WHAT MATTERS MOST TO PEOPLE IN AN EMERGENCY
3Te ara o Tawhaki > Community Resilience Indicators Project
1. Managing risks
2. Effective response to and recovery from emergencies
3. Enabling, empowering, and supporting community resilience
1 Identify and understand risk scenarios (including the components of hazard, exposure, vulnerability, and capacity), and use this knowledge to inform decision-making.
2 Put in place organisational structures and identify necessary processes – including being informed by community perspectives – to understand and act on reducing risks.
3 Build risk awareness, risk literacy, and risk management capability, including the ability to assess risk.
4 Address gaps in risk reduction policy (particularly in the light of climate change adaptation).
5 Ensure development and investment practices, particularly in the built and natural environments, are risk-aware, taking care not to create any unnecessary or unacceptable new risk.
6 Understand the economic impact of disaster and disruption, and the need for investment in resilience; identify and develop financial mechanisms that support resilience activities.
7 Ensure that the safety and wellbeing of people is at the heart of the emergency management system.
8 Build the relationship between emergency management organisations and iwi/groups representing Māori, to ensure greater recognition, understanding, and integration of iwi/Māori perspectives and tikanga in emergency management.
9 Strengthen the national leadership of the emergency management system to provide clearer direction and more consistent response to and recovery from emergencies.
10 Ensure it is clear who is responsible for what, nationally, regionally, and locally, in response and recovery; enable and empower community-level response, and ensure it is connected into wider coordinated responses, when and where necessary.
11 Build the capability and capacity of the emergency management workforce for response and recovery.
12 Improve the information and intelligence system that supports decision-making in emergencies to enable informed, timely, and consistent decisions by stakeholders and the public.
13 Enable and empower individuals, households, organisations, and businesses to build their resilience, paying particular attention to those people and groups who may be disproportionately affected by disasters.
14 Cultivate an environment for social connectedness which promotes a culture of mutual help; embed a collective impact approach to building community resilience.
15 Take a whole of city/district/region approach to resilience, including to embed strategic objectives for resilience in key plans and strategies.
16 Address the capacity and adequacy of critical infrastructure systems, and upgrade them as practicable, according to risks identified.
17 Embed a strategic, resilience approach to recovery planning that takes account of risks identified, recognises long-term priorities and opportunities to build back better, and ensures the needs of the affected are at the centre of recovery processes.
18 Recognise the importance of culture to resilience, including to support the continuity of cultural places, institutions and activities, and to enable the participation of different cultures in resilience.
Source: adapted from MCDEM (2019)
Figure 1: Objectives of the New Zealand disaster resilience strategy
Aumangea
Talalelei Taufale
Image 5
WHAT MATTERS MOST TO PEOPLE IN AN EMERGENCY
5Te ara o Tawhaki > Community Resilience Indicators Project
Continued from p2 1. A short review of the concept of resilience
Although resilience is used extensively, the concept is poorly defined with diverging views on its meaning
and applications (Pelling, 2003; Twigg, 2009; Oliver-Smith, 2009; Cutter, 2008a; 2016). Three elements
are nonetheless recurrent in the literature. Firstly, resilience reflects people’s and/or societies’ ability to
resist or absorb unusual stresses and shocks without needing much outside support (Horne and Orr,
1998; Mileti, 1999). Secondly, resilience relates to the capacity to cope with hazards and disasters, and
adapt to pressures and shocks such as demographic changes and climate change (Pelling et al., 2015;
Weichselgartner and Kelman, 2014). Lastly, resilience is generally linked to the idea of ‘bouncing back’
quickly after a disaster (Wildavsky, 1991). This notion of bouncing back has been criticised because it aims
for a return to the original position, which implies a return to pre-disaster vulnerability or the conditions that
caused the disaster in the first place. Therefore, scholars, practitioners and policy makers increasingly claim
that resilience is more about ‘bouncing forward’, which instead underlines the reduction of disaster risk
(Manyena, 2006; 2011).
Definingresilience
The concept of resilience is subject to both positive and negative critiques. Different scholars and
practitioners argue that the concept of resilience reframes the exact same challenges that have been
previously discussed as vulnerability and DRR (Weichselgartner and Kelman, 2014). For example, Twigg
(2009: 8) states that “DRR is the collection of actions, or processes, undertaken towards achieving
resilience”. Nonetheless, with resilience and resilience building, there is a tendency to focus on people’s
capacities, resources, knowledge and skills and by extension notions of self-organisation, self-efficacy and
self-reliance (Mackinnon and Derickson, 2013). Therefore, many scholars recognise the positive nature of
enhancing resilience since it suggests ‘building something up’ rather than just ‘reducing something’ such as
vulnerability and poverty (Manyena, 2006; 2011).
Critique
In recent years, resilience has been increasingly criticised for being part of a Western discourse that reflects
neoliberal values and agenda. Bankoff (2019: 219) states that “it [resilience] recasts the world according
to culturally-specific dictates. Depending on the context in which it is evoked, resilience either tries to
restructure non-Western societies according to prescribed economic formulae”. Some argue that resilience
tends to be used for labelling places, people, and societies as ‘resilient’ or ‘non-resilient’, which either avoids
supplying external support and reduces governments’ role in development work or justifies external aid
intervention based on an outsider-driven agenda (Mackinnon and Derickson, 2013; Kelman, 2018). Those
critiques pinpoint the fact that resilience is mostly defined, assessed and measured by outsider experts
rather than by those primarily concerned – local people (Gaillard and Jiyatsu, 2016; Jones and D’Errico;
2019; Jones, 2019). Several scholars thus point out the need for locals to play a central role in this process,
which implies to actively participate in defining their own resilience and self-evaluate accordingly.
Final Report: July 2019 – September 20206
2. How is resilience measured? The quest for quantification and measurements of resilience is nothing new. International institutions,
governmental agencies and NGOs have gradually felt the need for measuring resilience to guide their
policies and actions, monitor progress ‘on the ground’ and foster accountability (Gaillard and Jigyasu,
2016). This demand for measurement of resilience has generated a wide diversity of approaches, methods
and tools created by researchers, international organisations, NGOs and research institutes to appraise
the many dimensions of resilience at different scales (Béné, 2013; Levine, 2014).
Objective
The dominant approach to measure resilience, which has been termed ‘independent’ (Béné, 2013)
or ‘objective’ (Jones, 2019; Jones and D’Errico, 2019), relies mostly on outsiders’ viewpoints and
understanding of resilience. Outsiders are those external to the places, people or societies where they
conduct research, carry out project or develop policies aimed at strengthening people’s resilience. They
are scholars or technical staff from governmental agencies, NGOs or research institutes, and are generally
considered ‘experts’ in their field. The dominant approach implies a process where 1) outsiders have
defined resilience and its several components; and 2) have decided how resilience shall be measured.
Usually, outsiders develop a resilience framework based on the existing academic literature, extensive
expert consultation, and their specific goals or capacities to support resilience. Some form of community
engagement occasionally occurs to validate the defined framework, but rarely are the perspectives of local
people meaningfully included (Gaillard and Jigyasu, 2016; Jones, 2019). Once the criteria of resilience
have been selected, measurement toolkits are developed with proxy indicators – usually a long list of
indicators or sub-indicators. Typically, these include households’ income, level of education, access to
insurance schemes, performance of social security system and so on (Cutter et al. 2008; Cutter, 2010;
Stevenson et al., 2018).
Outsider driven
There are different advantages linked to such dominant/outsider-driven approach. First, most utilise
comprehensive and tangible definitions of resilience which often look strong to policy makers, donors
and decision-makers at large (Clare et al. 2018). Second, the approach and toolkits utilised to measure
resilience are easily replicable in different places. As a result, it enables compiling standardised metrics
that allows comparing different communities, cities or regions (COSA 2017). Lastly, this approach relies on
proxy indicators, many of which are regularly collected by governments and development agencies and
made available freely to public (Schipper and Langston 2015). For example, the New Zealand Resilience
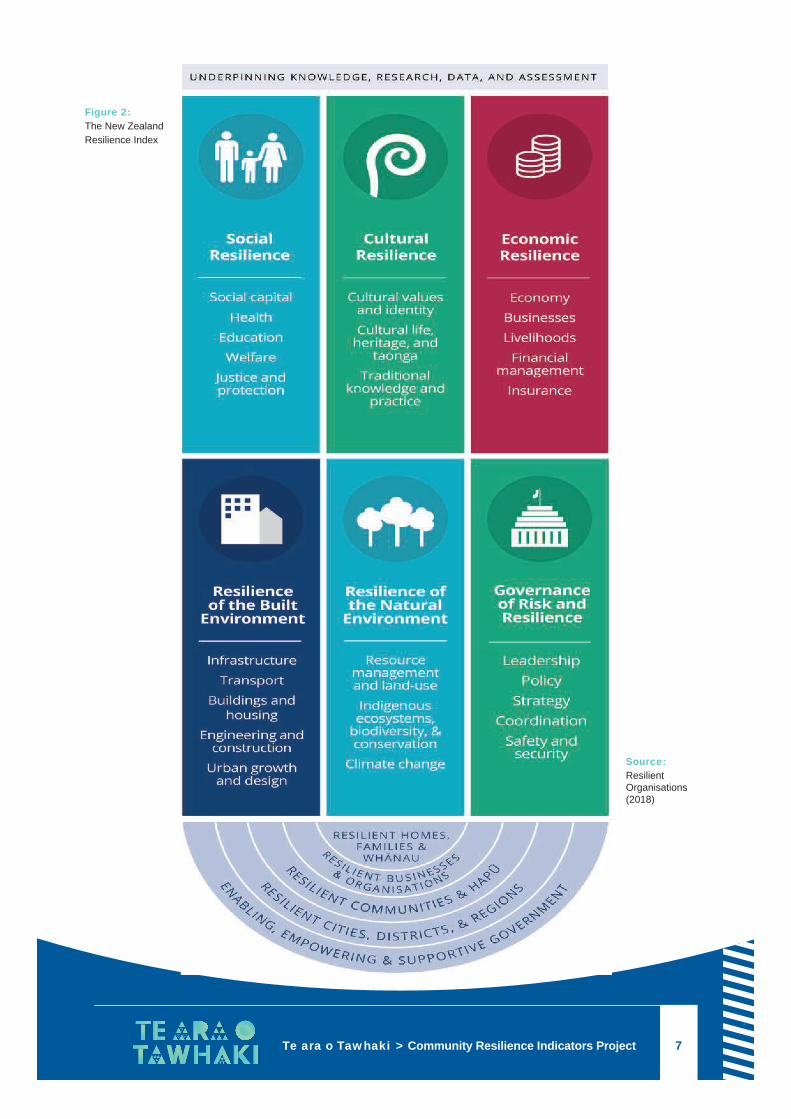
Index (Resilient Organisations, 2018), which adopts such outsider-driven approach, draws on six main
indicators defined by experts based on the existing academic literature and existing secondary data
publicly available nationwide (Stevenson et al., 2018) (Figure 2).
WHAT MATTERS MOST TO PEOPLE IN AN EMERGENCY
7Te ara o Tawhaki > Community Resilience Indicators Project
Source: Resilient Organisations (2018)
Figure 2:The New Zealand Resilience Index
Final Report: July 2019 – September 20208
Continued from p6 2. How is resilience measured?
While outsider-driven approaches and methods have some values, they are not without limitations (Levine
2014; Jones and D’Errico, 2019) (Figure 3). Although the resilience of individuals and household is partly
shaped by assets accumulation and availability of infrastructure or physical resources, much of it is linked
to intangible elements such as social networks and cohesion at the community level (Aldrich, 2012).
Outsider-driven approaches tend to use large lists of proxy indicators to account for them, but generally fail
capturing such intangible elements of resilience (Bahadur and Pichon 2017). For Chambers (2007) more
quantitative data does not mean better information, but generally means more bad data. Furthermore, such
approaches tend to be bias by outsiders’ views of what resilience means to them. As a result, definition or
conceptualisation of resilience are not context-specific and thus do not fit with local people’s realities. This
limits resilience indicators’ utilisation to tackle local issues and guide actions to build community resilience
(Gaillard and Jigyasu, 2016). Critiques of outsider-driven methods also emphasise that the built indicators
are used to advance a pre-defined agenda driven from the top-down rather than guided by local needs
(Mackinnon and Derickson, 2013; Kelman, 2018; Bankoff, 2019). Lastly, outsider-driven approaches often
fail to consider the capacities of local people (i.e. knowledge, level of preparedness) very hard to capture
with traditional methods, but yet critical in shaping local communities’ resilience (Norris, 2008).
Tihei Mauri Ora
Image 6

WHAT MATTERS MOST TO PEOPLE IN AN EMERGENCY
9Te ara o Tawhaki > Community Resilience Indicators Project
Dominant – outsider driven approach
Alternative – community centred approach
Epistemology Resilience as an attribute or consequence Resilience as a process
Methods Quantitative (i.e. questionnaire-based surveys, census, expert consultation, etc.)
Participatory (i.e. participatory quantitative methods)
Approach Extractive Self-reflective/self-organisational
Role of local people
Respondents/passive Analysists/active
Users Policy makers and practitioners Local people and practitioners
Strengths • Comprehensive/tangible framework of resilience
• Quick to set up
• Can be replicated in different places, enabling comparison
• Output look strong to decision-makers and donors
• Reflects people’s own and diverse views (indicators are context-specific)
• Addresses local concerns and priorities
• Empowers people in the process of building indicators
• Enables dialogue between local people and practitioners
Limitations • High level of generalisation (very little use at local level)
• Biased by outsiders’ views/definition of resilience
• Difficult to capture intangible aspects of resilience
• Highly dependent on facilitators’ skills
• Consistent participation across the process and issue of who participate
• Hardly comparable because context specific
Source: authors’ own (2020)
Figure 3: Characteristics of outsider-driven and community-centred approaches
Another view
With these elements in mind, alternative approaches and tools have recently been sought for measuring
resilience (Marshall 2010; Maxwell et al. 2015; Jones and Tanner 2017; Jones and Samman 2016; Claire
et al 2017; Seara et al. 2016; Béné et al. 2016). Termed ‘inductive’ (Bene, 2013), ‘subjective’ (Jones and
D’Errico, 2019; Jones, 2019) or ‘participatory pluralism’ (Chambers, 2007; Gaillard and Jigyasu, 2016),
these approaches start from the premise that local people have knowledge about their surrounding
environment, including the hazards they are exposed to, as well as their own vulnerabilities, capacities and
elements of resilience. Such alternative approaches and tools also recognise the legitimacy of people in
actively participating in the decision-making process on matters that affect their lives and/or meant to lift their
wellbeing. They attempt to place people at the centre of the resilience building process, including on defining
resilience in their own terms and in self-evaluating. These alternative approaches and tools ...
Final Report: July 2019 – September 202010
... are ‘community-centred’, and therefore very different from the more traditional and dominant approaches,
including in their epistemology, methods and role played by local people (Figure 3). They usually draw on
participatory methods and rely strongly on people’s own perceptions, viewpoints and priorities (Maxwell et
al., 2015). Scholars and practitioners usually emphasise a number strengths attached to them, including to
better address local issues through context-specific indicators, contributing to empower people in identifying
ways to build their own resilience, and strengthen the collaboration with outsiders who rather play a role of
facilitator or ‘enabler’. Such alternative, people-centred, approaches and tools have been trialled in a number
of different contexts with variations in their design (Jones and Samman 2016; Marshall, 2010; Seara et al.
2016; Béné et al. 2016).
Keeping a balance
While they comprise different strengths and generate positive outcomes, they also have limitations and pose
several challenges for both be successfully developed and implemented. One of the main limitations is that
while context-specific, the indicators hardly enable any comparison between locations or communities with
whom they have been developed. Secondly, the process can be time-consuming as it requires building trust
and/or engaging with people in their diversity (Cornwall, 2008). Thirdly, the ‘quality’ of both the process for
building the indicators and the final/produced indicators are highly dependent on facilitators’ skills: a genuine
process requires that everyone at the community level has a voice in defining resilience and identify ways
to measure it, including those highly vulnerable, marginalised and/or generally excluded from the decision-
making process (Chambers, 2007).
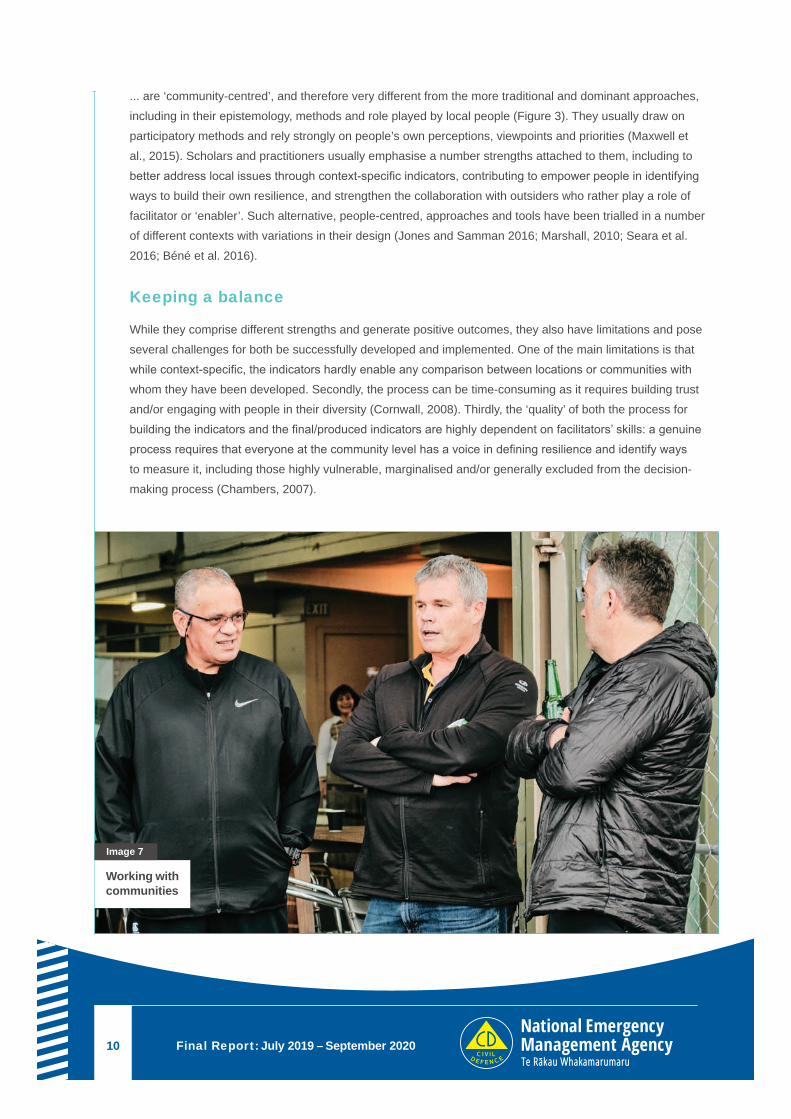
Working with communities
Image 7
WHAT MATTERS MOST TO PEOPLE IN AN EMERGENCY
11Te ara o Tawhaki > Community Resilience Indicators Project
3. Methodological approach The objectives of the project were twofold: 1) fostering the participation of local people in the process
of defining what resilience means to them and 2) developing indicators that would help enhance the
communication/dialogue with outsider agencies and meaningfully contribute to plan and act towards
strengthening resilience. The methodological approach adopts a community-centred approach to measure
community resilience. It draws on participatory methods, which have been used extensively by scholars
and practitioners in disaster and development work (Chambers, 1983). While enabling to produce rich
qualitative information, they have increasingly been used to measure elements linked to disaster risk and
resilience (Chambers, 2007; Le De et al., 2015; Gaillard et al., 2016).
Our approach
The development of the methodology involved a series of workshops with both practitioners and local
community members to trial, get feedback and refine the methodology used to develop the community-
centred resilience indicators. Three workshops took place in different regions of New Zealand where the
project would take place, including Bay of Plenty (BoP) and Hawke’s Bay. It also involved practitioners from
Waikato region who were involved in the project. Once the indicators would be trialled and co-developed
with practitioners, local people and the researchers, they could be rolled out with local communities. As a
result of COVID-19 and the national lockdown, the team of researchers and practitioners had to reconsider
the locations and communities with whom the indicators would be built.
Diversity
The project involved four different case studies, including one in Papamoa (BoP) composed largely of
Pākehā (n=22), and three in the Hawke’s Bay region with Migrants (n=20), Māori (n=17) and Pasifika
communities (n=8). The choice of these community groups is reflective of the different ethnicities that
compose New Zealand. It offers different viewpoints and worldviews in conceptualising resilience and its
different facets. Before conducting fieldwork, the project involved obtaining ethics approval from Auckland
University of Technology Ethics Committee (AUTEC). This was granted in August 2019 with number
19/353. A total of about 67 participants across the four locations were involved. Three workshops took
place in Papamoa and lasted about one hour and a half each. The first workshop occurred on the 16th
October 2019, the second workshop took place on the 5th February 2020 and the third on the 4th March
2020. The three in Hawke’s Bay took a different approach, being conducted over one day each and lasting
between 4 and 6 hours. The workshop with migrant participants was held on the 4th July 2020, Pasifika
participants met on the 18th July 2020, and the workshop with Māori was conducted on 8th August 2020.
KeteCommunity Toolkit
WHAT MATTERS MOST TO PEOPLE IN AN EMERGENCY
Kete – Community Toolkit 12-page extract from Te ara o Tawhaki/Community Resilience Indicators Project Final Report: July 2019 – September 2020
WHAT MATTERS MOST TO PEOPLE IN AN EMERGENCY
13Te ara o Tawhaki > Community Resilience Indicators Project
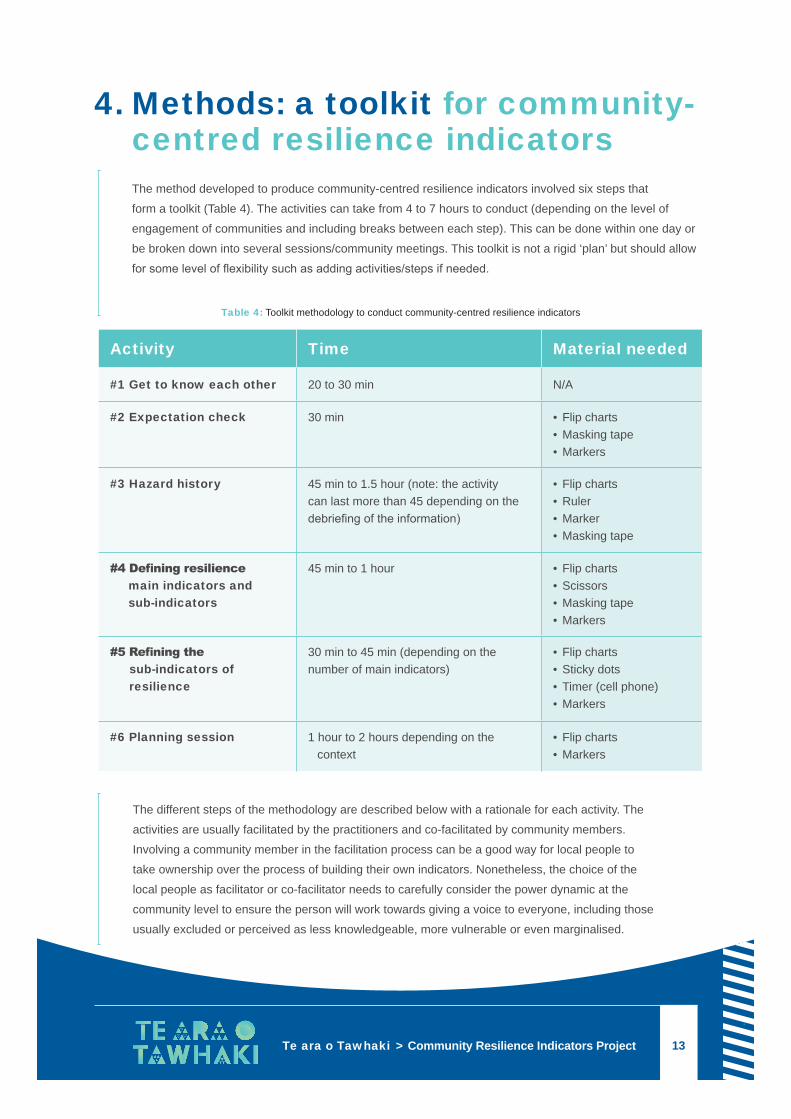
4. Methods: a toolkit for community-centred resilience indicators
The method developed to produce community-centred resilience indicators involved six steps that
form a toolkit (Table 4). The activities can take from 4 to 7 hours to conduct (depending on the level of
engagement of communities and including breaks between each step). This can be done within one day or
be broken down into several sessions/community meetings. This toolkit is not a rigid ‘plan’ but should allow
for some level of flexibility such as adding activities/steps if needed.
Activity Time Material needed
#1 Get to know each other 20 to 30 min N/A
#2 Expectation check 30 min • Flip charts• Masking tape• Markers
#3 Hazard history 45 min to 1.5 hour (note: the activity can last more than 45 depending on the debriefing of the information)
• Flip charts• Ruler• Marker• Masking tape
#4Definingresilience main indicators and sub-indicators
45 min to 1 hour • Flip charts• Scissors• Masking tape• Markers
#5Refiningthe sub-indicators of resilience
30 min to 45 min (depending on the number of main indicators)
• Flip charts• Sticky dots• Timer (cell phone)• Markers
#6 Planning session 1 hour to 2 hours depending on the context
• Flip charts• Markers
Table 4: Toolkit methodology to conduct community-centred resilience indicators
The different steps of the methodology are described below with a rationale for each activity. The
activities are usually facilitated by the practitioners and co-facilitated by community members.
Involving a community member in the facilitation process can be a good way for local people to
take ownership over the process of building their own indicators. Nonetheless, the choice of the
local people as facilitator or co-facilitator needs to carefully consider the power dynamic at the
community level to ensure the person will work towards giving a voice to everyone, including those
usually excluded or perceived as less knowledgeable, more vulnerable or even marginalised.
Final Report: July 2019 – September 202014
Step #1 Get to know eachother
Rationale: It is important that everyone gets to know who all the participants are. The facilitator should not assume that
all the community members know each other. It also helps the facilitator to know who is in the room and
which position people hold in the community.
Description: There are different activities that may range from ‘simple’ mutual introduction to more fun activities. This step
may include a karakia, prayer or any other formal acknowledgement as appropriate.
Step #2 Expectation check
Rationale: It is essential for the facilitator to understand
the participants’ expectations and reasons
for participating. This gives the facilitator the
opportunity to clarify what the project is about
and what it can or cannot achieve. Failing to be
precise about the project objectives and what it
can or cannot achieve can have very negative
consequences. For the participants, it is also an
important activity as it helps foster ownership and
reinforce the feeling that it is about the community.
Description: The facilitator should divide the room into smaller
groups of 4 to 7 people (this depends on the size
of the group). Participants are provided with a flip
chart and asked to list 1) what they want to achieve
with the resilience indicators; 2) what would make
this process/project successful; and 3) what would
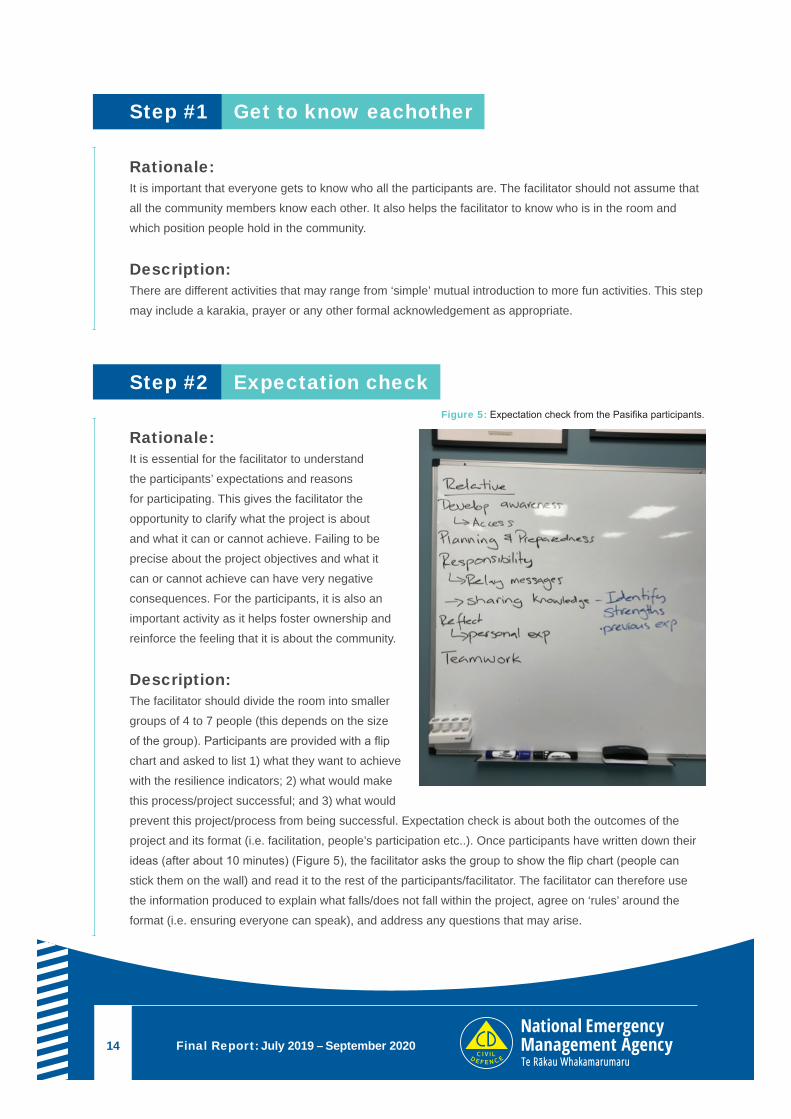
prevent this project/process from being successful. Expectation check is about both the outcomes of the
project and its format (i.e. facilitation, people’s participation etc..). Once participants have written down their
ideas (after about 10 minutes) (Figure 5), the facilitator asks the group to show the flip chart (people can
stick them on the wall) and read it to the rest of the participants/facilitator. The facilitator can therefore use
the information produced to explain what falls/does not fall within the project, agree on ‘rules’ around the
format (i.e. ensuring everyone can speak), and address any questions that may arise.
Figure 5: Expectation check from the Pasifika participants.
WHAT MATTERS MOST TO PEOPLE IN AN EMERGENCY
15Te ara o Tawhaki > Community Resilience Indicators Project
Step #3 Hazards and disasters history
Rationale: The objective is for the participants to start thinking about their community, the hazards that impacted them
in the past, what/who was affected, and the ways people coped with and recovered from the events. This
enables the community to think about key elements that form part of resilience (i.e. exposure and impacts on
people, vulnerability, coping capacities, abilities to bounce forward, etc..) to later be able to define resilience
indicators. This activity is much more powerful than asking the community to define an abstract concept
(i.e. Resilience) but shall rather help them define resilience in function of their daily realities and their local
context (Figure 6 and Figure 7). This activity also helps fostering ownership over the process of defining
indicators: it is about participants’ own resilience telling their stories – not that from outsiders. The facilitator
may learn about hazards, disasters and other elements shaping community’s vulnerability he/she ignored
(i.e. small-scale/recurrent events, vulnerable community members badly affected etc.).
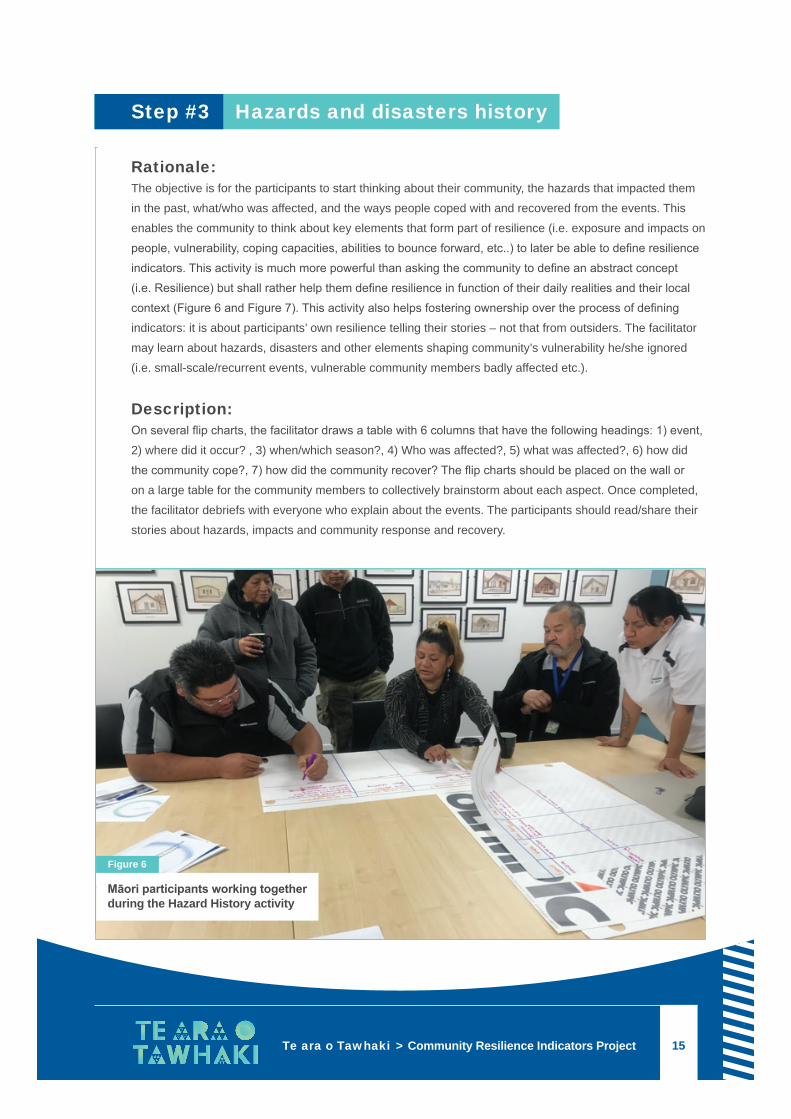
Description: On several flip charts, the facilitator draws a table with 6 columns that have the following headings: 1) event,
2) where did it occur? , 3) when/which season?, 4) Who was affected?, 5) what was affected?, 6) how did
the community cope?, 7) how did the community recover? The flip charts should be placed on the wall or
on a large table for the community members to collectively brainstorm about each aspect. Once completed,
the facilitator debriefs with everyone who explain about the events. The participants should read/share their
stories about hazards, impacts and community response and recovery.
Māori participants working together during the Hazard History activity
Figure 6
Final Report: July 2019 – September 202016
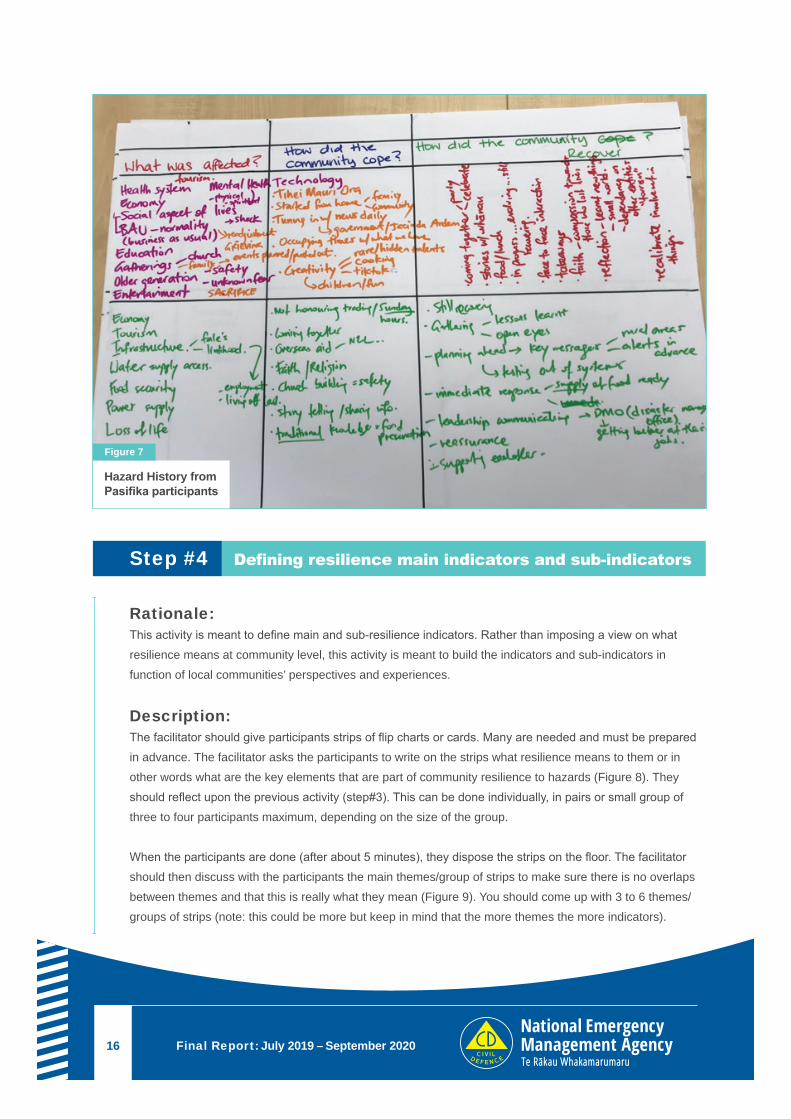
Hazard History from Pasifika participants
Figure 7
Step #4 Definingresiliencemainindicatorsandsub-indicators
Rationale: This activity is meant to define main and sub-resilience indicators. Rather than imposing a view on what
resilience means at community level, this activity is meant to build the indicators and sub-indicators in
function of local communities’ perspectives and experiences.
Description: The facilitator should give participants strips of flip charts or cards. Many are needed and must be prepared
in advance. The facilitator asks the participants to write on the strips what resilience means to them or in
other words what are the key elements that are part of community resilience to hazards (Figure 8). They
should reflect upon the previous activity (step#3). This can be done individually, in pairs or small group of
three to four participants maximum, depending on the size of the group.
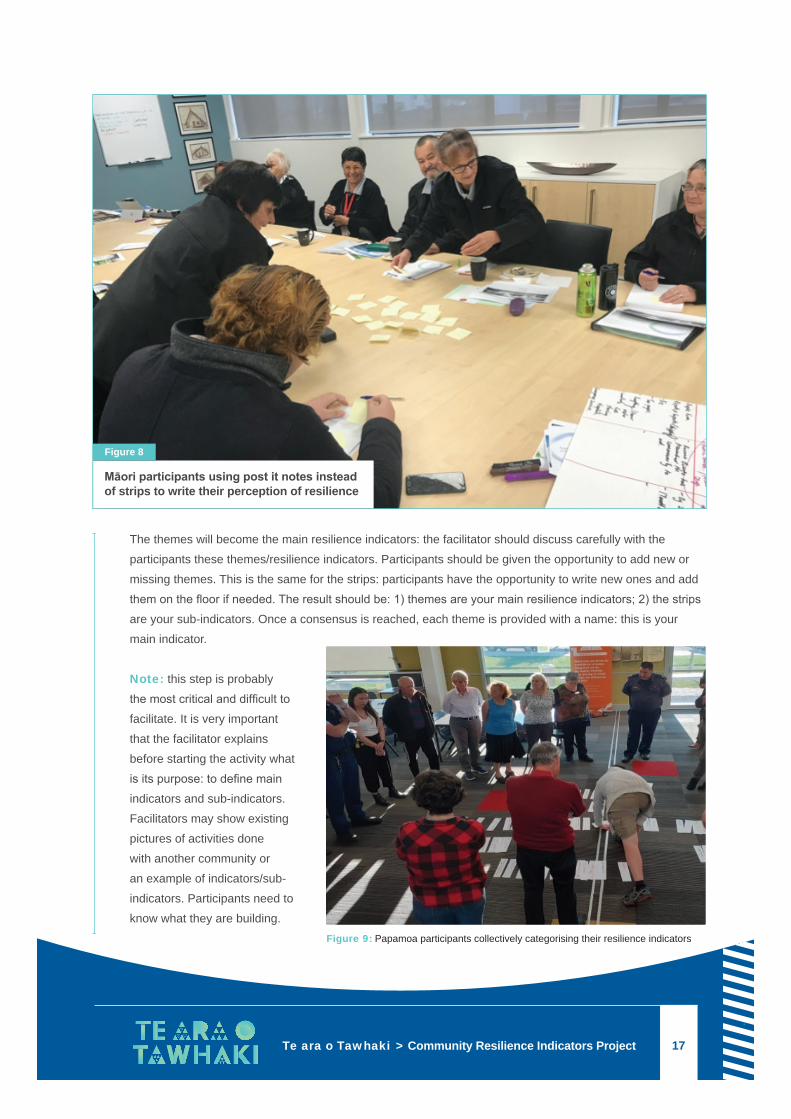
When the participants are done (after about 5 minutes), they dispose the strips on the floor. The facilitator
should then discuss with the participants the main themes/group of strips to make sure there is no overlaps
between themes and that this is really what they mean (Figure 9). You should come up with 3 to 6 themes/
groups of strips (note: this could be more but keep in mind that the more themes the more indicators).
WHAT MATTERS MOST TO PEOPLE IN AN EMERGENCY
17Te ara o Tawhaki > Community Resilience Indicators Project
Māori participants using post it notes instead of strips to write their perception of resilience
Figure 8
The themes will become the main resilience indicators: the facilitator should discuss carefully with the
participants these themes/resilience indicators. Participants should be given the opportunity to add new or
missing themes. This is the same for the strips: participants have the opportunity to write new ones and add
them on the floor if needed. The result should be: 1) themes are your main resilience indicators; 2) the strips
are your sub-indicators. Once a consensus is reached, each theme is provided with a name: this is your
main indicator.
Note: this step is probably
the most critical and difficult to
facilitate. It is very important
that the facilitator explains
before starting the activity what
is its purpose: to define main
indicators and sub-indicators.
Facilitators may show existing
pictures of activities done
with another community or
an example of indicators/sub-
indicators. Participants need to
know what they are building.Figure 9: Papamoa participants collectively categorising their resilience indicators
Final Report: July 2019 – September 202018
Sub-Indicators; Aroha kit e tangata, Manaakitanga, Whānau, Communication
Figure 11
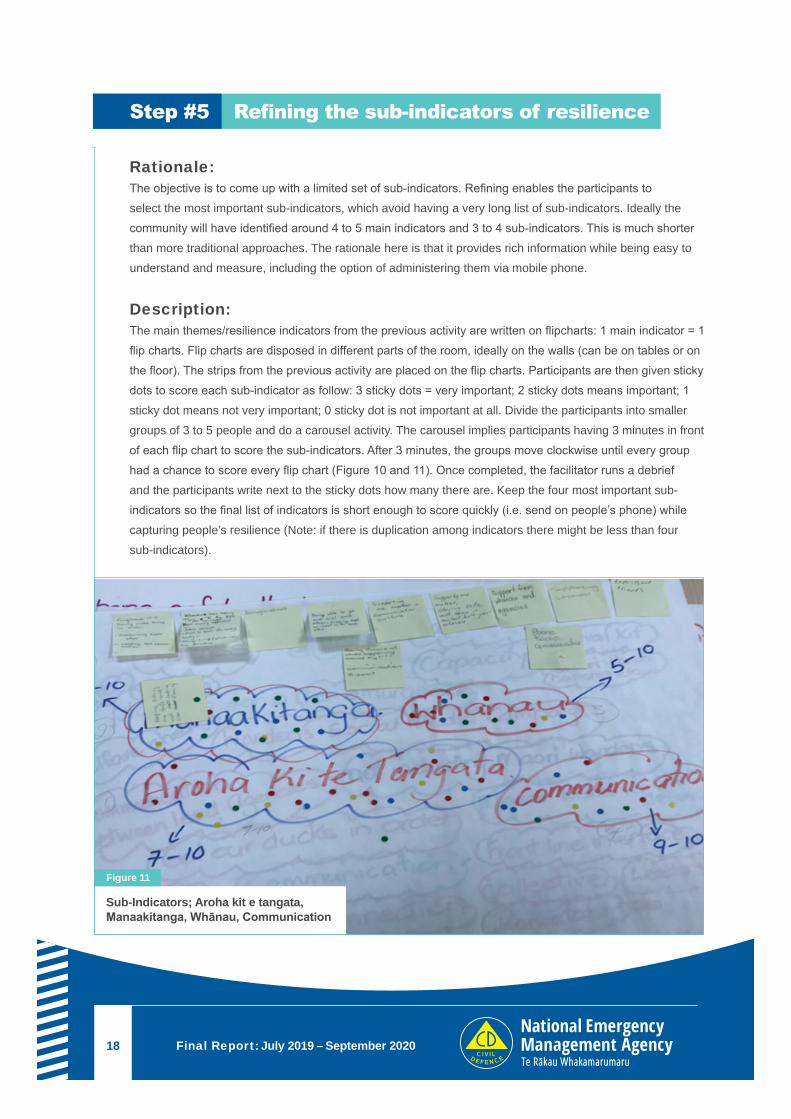
Step#5Refiningthesub-indicatorsofresilience
Rationale: The objective is to come up with a limited set of sub-indicators. Refining enables the participants to
select the most important sub-indicators, which avoid having a very long list of sub-indicators. Ideally the
community will have identified around 4 to 5 main indicators and 3 to 4 sub-indicators. This is much shorter
than more traditional approaches. The rationale here is that it provides rich information while being easy to
understand and measure, including the option of administering them via mobile phone.
Description: The main themes/resilience indicators from the previous activity are written on flipcharts: 1 main indicator = 1
flip charts. Flip charts are disposed in different parts of the room, ideally on the walls (can be on tables or on
the floor). The strips from the previous activity are placed on the flip charts. Participants are then given sticky
dots to score each sub-indicator as follow: 3 sticky dots = very important; 2 sticky dots means important; 1
sticky dot means not very important; 0 sticky dot is not important at all. Divide the participants into smaller
groups of 3 to 5 people and do a carousel activity. The carousel implies participants having 3 minutes in front
of each flip chart to score the sub-indicators. After 3 minutes, the groups move clockwise until every group
had a chance to score every flip chart (Figure 10 and 11). Once completed, the facilitator runs a debrief
and the participants write next to the sticky dots how many there are. Keep the four most important sub-
indicators so the final list of indicators is short enough to score quickly (i.e. send on people’s phone) while
capturing people’s resilience (Note: if there is duplication among indicators there might be less than four
sub-indicators).
WHAT MATTERS MOST TO PEOPLE IN AN EMERGENCY
19Te ara o Tawhaki > Community Resilience Indicators Project
Strips displaying the indicators from the activity placed on flip
Figure 10
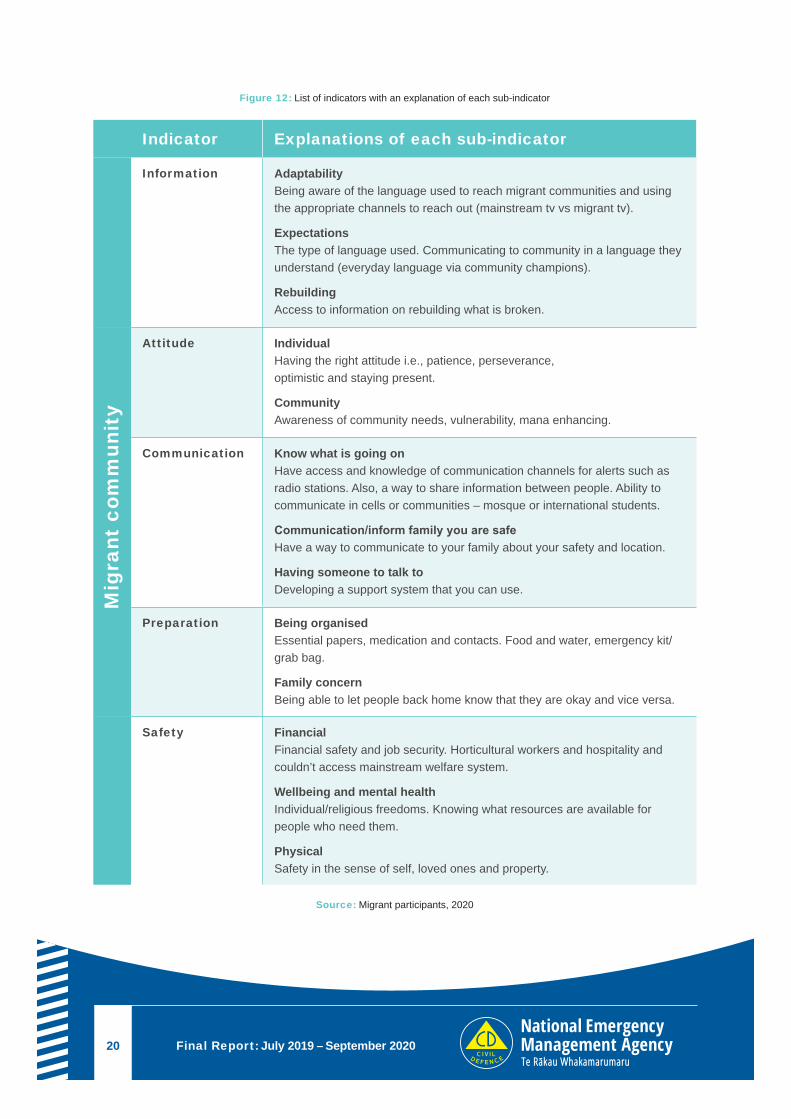
Note: Facilitators with the participants should write in front of each sub-indicators its meaning or a definition
of it (Figure 12). This allows for practitioners or community members who were not part of the steps to
understand what each sub-indicator means. This is particularly important when the indicators are measured,
re-visited, or when there is turnover of practitioners or new community members involved.
Final Report: July 2019 – September 202020
Indicator Explanations of each sub-indicator
Information Adaptability Being aware of the language used to reach migrant communities and using the appropriate channels to reach out (mainstream tv vs migrant tv).
Expectations The type of language used. Communicating to community in a language they understand (everyday language via community champions).
Rebuilding Access to information on rebuilding what is broken.
Attitude Individual Having the right attitude i.e., patience, perseverance, optimistic and staying present.
Community Awareness of community needs, vulnerability, mana enhancing.
Communication Know what is going on Have access and knowledge of communication channels for alerts such as radio stations. Also, a way to share information between people. Ability to communicate in cells or communities – mosque or international students.
Communication/inform family you are safe Have a way to communicate to your family about your safety and location.
Having someone to talk to Developing a support system that you can use.
Preparation Being organised Essential papers, medication and contacts. Food and water, emergency kit/grab bag.
Family concern Being able to let people back home know that they are okay and vice versa.
Safety Financial Financial safety and job security. Horticultural workers and hospitality and couldn’t access mainstream welfare system.
Wellbeing and mental health Individual/religious freedoms. Knowing what resources are available for people who need them.
Physical Safety in the sense of self, loved ones and property.
Figure 12: List of indicators with an explanation of each sub-indicator
Source: Migrant participants, 2020
Mig
rant
com
mun
ity
WHAT MATTERS MOST TO PEOPLE IN AN EMERGENCY
21Te ara o Tawhaki > Community Resilience Indicators Project
Final list of indicators produced by local people
Figure 13
Step #6 Planning session
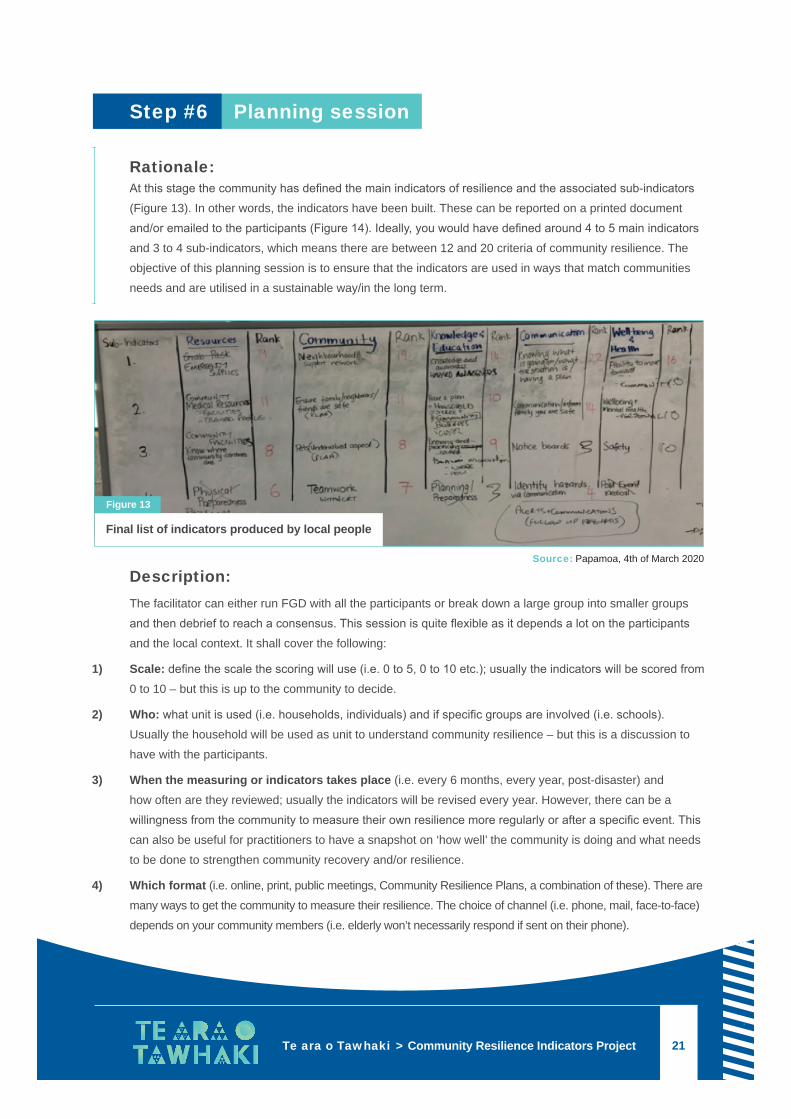
Rationale: At this stage the community has defined the main indicators of resilience and the associated sub-indicators
(Figure 13). In other words, the indicators have been built. These can be reported on a printed document
and/or emailed to the participants (Figure 14). Ideally, you would have defined around 4 to 5 main indicators
and 3 to 4 sub-indicators, which means there are between 12 and 20 criteria of community resilience. The
objective of this planning session is to ensure that the indicators are used in ways that match communities
needs and are utilised in a sustainable way/in the long term.
Description: The facilitator can either run FGD with all the participants or break down a large group into smaller groups
and then debrief to reach a consensus. This session is quite flexible as it depends a lot on the participants
and the local context. It shall cover the following:
1) Scale: define the scale the scoring will use (i.e. 0 to 5, 0 to 10 etc.); usually the indicators will be scored from
0 to 10 – but this is up to the community to decide.
2) Who: what unit is used (i.e. households, individuals) and if specific groups are involved (i.e. schools).
Usually the household will be used as unit to understand community resilience – but this is a discussion to
have with the participants.
3) When the measuring or indicators takes place (i.e. every 6 months, every year, post-disaster) and
how often are they reviewed; usually the indicators will be revised every year. However, there can be a
willingness from the community to measure their own resilience more regularly or after a specific event. This
can also be useful for practitioners to have a snapshot on ‘how well’ the community is doing and what needs
to be done to strengthen community recovery and/or resilience.
4) Which format (i.e. online, print, public meetings, Community Resilience Plans, a combination of these). There are
many ways to get the community to measure their resilience. The choice of channel (i.e. phone, mail, face-to-face)
depends on your community members (i.e. elderly won’t necessarily respond if sent on their phone).
Source: Papamoa, 4th of March 2020
Final Report: July 2019 – September 202022
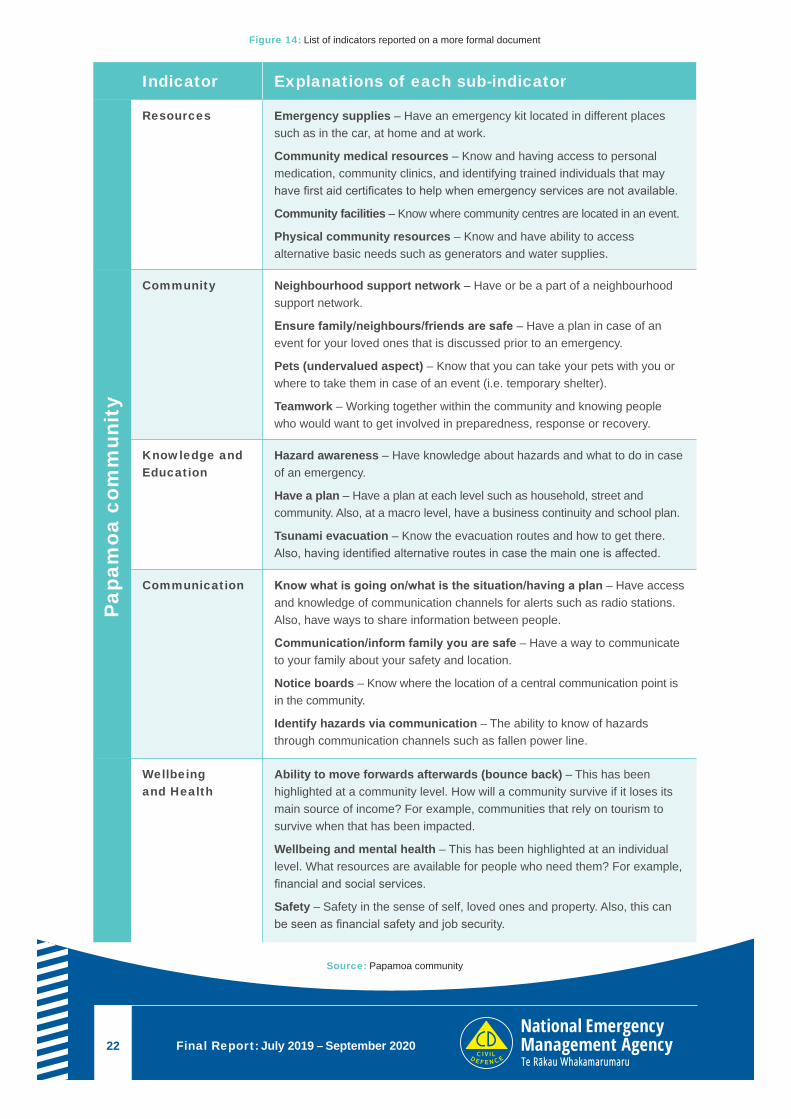
Indicator Explanations of each sub-indicator
Resources Emergency supplies – Have an emergency kit located in different places such as in the car, at home and at work.
Community medical resources – Know and having access to personal medication, community clinics, and identifying trained individuals that may have first aid certificates to help when emergency services are not available.
Community facilities – Know where community centres are located in an event.
Physical community resources – Know and have ability to access alternative basic needs such as generators and water supplies.
Community Neighbourhood support network – Have or be a part of a neighbourhood support network.
Ensure family/neighbours/friends are safe – Have a plan in case of an event for your loved ones that is discussed prior to an emergency.
Pets (undervalued aspect) – Know that you can take your pets with you or where to take them in case of an event (i.e. temporary shelter).
Teamwork – Working together within the community and knowing people who would want to get involved in preparedness, response or recovery.
Knowledge and Education
Hazard awareness – Have knowledge about hazards and what to do in case of an emergency.
Have a plan – Have a plan at each level such as household, street and community. Also, at a macro level, have a business continuity and school plan.
Tsunami evacuation – Know the evacuation routes and how to get there. Also, having identified alternative routes in case the main one is affected.
Communication Know what is going on/what is the situation/having a plan – Have access and knowledge of communication channels for alerts such as radio stations. Also, have ways to share information between people.
Communication/inform family you are safe – Have a way to communicate to your family about your safety and location.
Notice boards – Know where the location of a central communication point is in the community.
Identify hazards via communication – The ability to know of hazards through communication channels such as fallen power line.
Wellbeing and Health
Ability to move forwards afterwards (bounce back) – This has been highlighted at a community level. How will a community survive if it loses its main source of income? For example, communities that rely on tourism to survive when that has been impacted.
Wellbeing and mental health – This has been highlighted at an individual level. What resources are available for people who need them? For example, financial and social services.
Safety – Safety in the sense of self, loved ones and property. Also, this can be seen as financial safety and job security.
Figure 14: List of indicators reported on a more formal document
Source: Papamoa community
Papa
moa
com
mun
ity
WHAT MATTERS MOST TO PEOPLE IN AN EMERGENCYWHAT MATTERS MOST TO PEOPLE IN AN EMERGENCY
Whānautūārangi
Office of Ethnic Communities
Image 8
WHAT MATTERS MOST TO PEOPLE IN AN EMERGENCY
25Te ara o Tawhaki > Community Resilience Indicators Project
5. Developing community-centred indicators: key results
This section provides some of the key findings of the project. It details the different indicators produced in each
community. It also highlights some of the key results linked to the process of building the resilience indicators.
5.1 How is resilience measured?
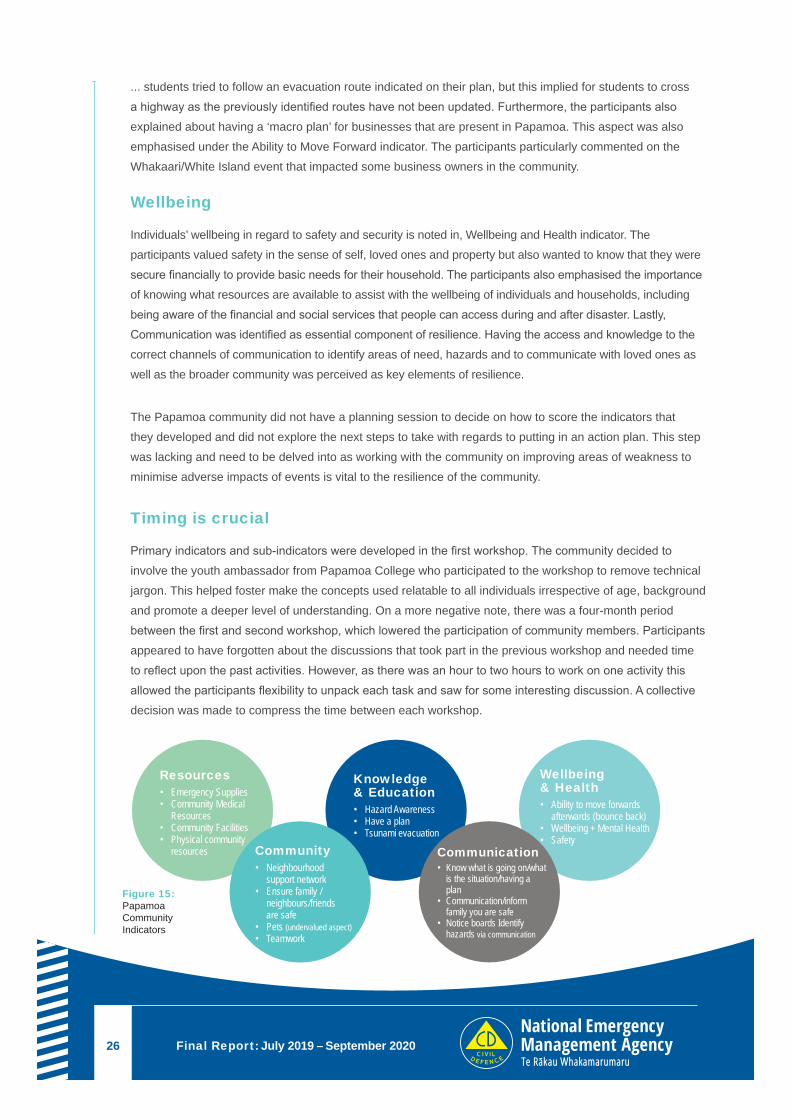
In Papamoa, the main indicators produced included Resources, Community, Knowledge and Education,
Communication and Wellbeing and Health (Figure 15 and 16). The participants highlighted the importance
of Resources, including having emergency kits, stockpiling of medical supplies, and other resources
to deal with power cut and telecommunication breakdown. Having a plan such as knowing evacuation
routes was perceived as critical to being resilient. The participants also identified the importance
of communication at different levels, within their household, their broader community and with key
stakeholders involved in disaster risk reduction and emergency management.
Caring for communities
The importance of resilience was not only identified on the individual or household level, but emphasis was
also placed at the wider community level. For instance, the participants highlighted that resilience was not
only about taking care of themselves, but also to ensure that community members were provided with the
adequate resources and support. The notion of sharing was seen as critical to being resilient. For example,
physical Community Resources indicator emphasises the importance of identifying community members that
have equipment to help in an emergency (i.e. generators, drinkable water, etc.). The notion of social cohesion
is also shown in Community Medical Resources indicator: the participants identified the need to have trained
individuals to assist others in the case of emergency services would not be able to provide support quickly.
Collaboration
Working collaboratively and forming a support network was perceived as an integral aspect of resilience.
Interestingly, participants identified pets as critical component of resilience. While this may appear without
much importance to outsiders, it was seen as essential to the participants. Local people emphasised that
pets are considered members of the family who need to be considered as key element of resilience. For
example, the participants mentioned the importance of being with their pets if having to evacuate during a
tsunami or an earthquake, implying having a plan in place and a shelter where pets are allowed.
Awareness and planning
Knowledge and Education focuses on being aware of hazards and having a plan in place. The community
members thought being resilient meant ongoing preparedness work, including regularly updating their
disaster preparedness plan. For example, one of the participants, a teacher, shared that high school ...
Final Report: July 2019 – September 202026
... students tried to follow an evacuation route indicated on their plan, but this implied for students to cross
a highway as the previously identified routes have not been updated. Furthermore, the participants also
explained about having a ‘macro plan’ for businesses that are present in Papamoa. This aspect was also
emphasised under the Ability to Move Forward indicator. The participants particularly commented on the
Whakaari/White Island event that impacted some business owners in the community.
Wellbeing
Individuals’ wellbeing in regard to safety and security is noted in, Wellbeing and Health indicator. The
participants valued safety in the sense of self, loved ones and property but also wanted to know that they were
secure financially to provide basic needs for their household. The participants also emphasised the importance
of knowing what resources are available to assist with the wellbeing of individuals and households, including
being aware of the financial and social services that people can access during and after disaster. Lastly,
Communication was identified as essential component of resilience. Having the access and knowledge to the
correct channels of communication to identify areas of need, hazards and to communicate with loved ones as
well as the broader community was perceived as key elements of resilience.
The Papamoa community did not have a planning session to decide on how to score the indicators that
they developed and did not explore the next steps to take with regards to putting in an action plan. This step
was lacking and need to be delved into as working with the community on improving areas of weakness to
minimise adverse impacts of events is vital to the resilience of the community.
Timing is crucial
Primary indicators and sub-indicators were developed in the first workshop. The community decided to
involve the youth ambassador from Papamoa College who participated to the workshop to remove technical
jargon. This helped foster make the concepts used relatable to all individuals irrespective of age, background
and promote a deeper level of understanding. On a more negative note, there was a four-month period
between the first and second workshop, which lowered the participation of community members. Participants
appeared to have forgotten about the discussions that took part in the previous workshop and needed time
to reflect upon the past activities. However, as there was an hour to two hours to work on one activity this
allowed the participants flexibility to unpack each task and saw for some interesting discussion. A collective
decision was made to compress the time between each workshop.
Figure 15: Papamoa Community Indicators
Wellbeing & Health• Ability to move forwards
afterwards (bounce back)• Wellbeing + Mental Health• Safety
Resources• Emergency Supplies• Community Medical
Resources• Community Facilities• Physical community
resources
Knowledge & Education• Hazard Awareness• Have a plan • Tsunami evacuation
Communication• Know what is going on/what
is the situation/having a plan
• Communication/inform family you are safe
• Notice boards Identify hazards via communication
Community• Neighbourhood
support network• Ensure family /
neighbours/friends are safe
• Pets (undervalued aspect)• Teamwork
WHAT MATTERS MOST TO PEOPLE IN AN EMERGENCY
27Te ara o Tawhaki > Community Resilience Indicators Project
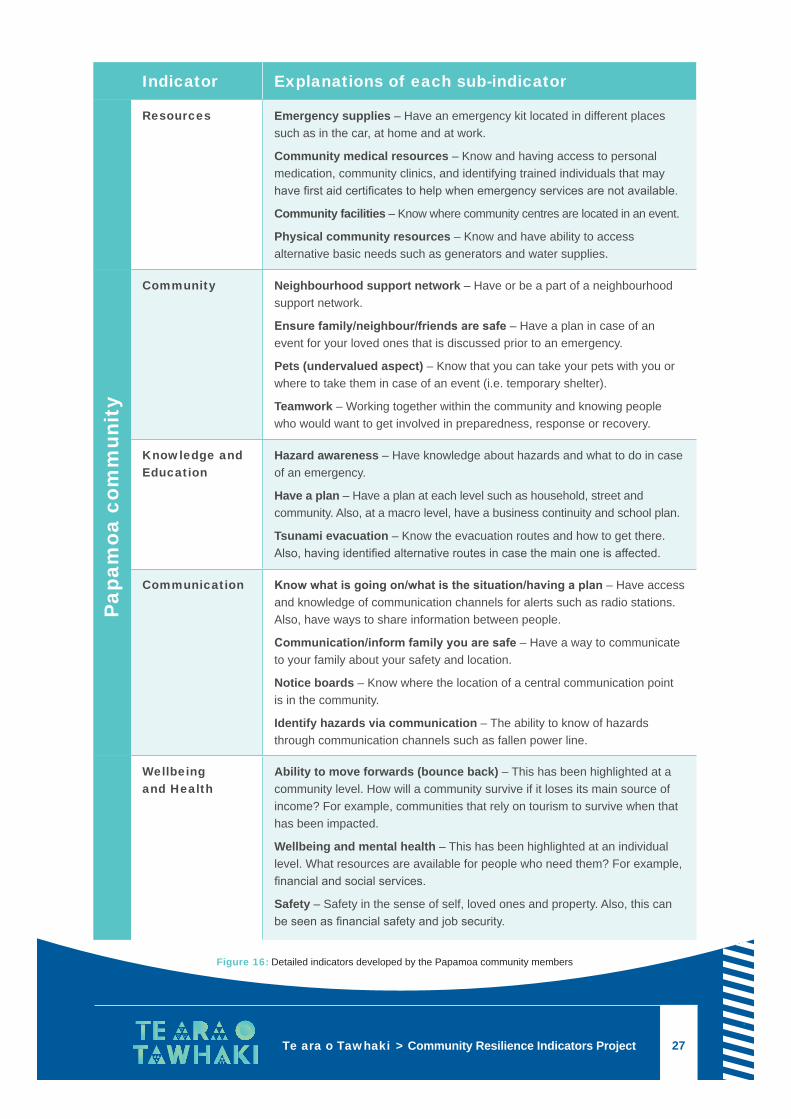
Indicator Explanations of each sub-indicator
Resources Emergency supplies – Have an emergency kit located in different places such as in the car, at home and at work.
Community medical resources – Know and having access to personal medication, community clinics, and identifying trained individuals that may have first aid certificates to help when emergency services are not available.
Community facilities – Know where community centres are located in an event.
Physical community resources – Know and have ability to access alternative basic needs such as generators and water supplies.
Community Neighbourhood support network – Have or be a part of a neighbourhood support network.
Ensure family/neighbour/friends are safe – Have a plan in case of an event for your loved ones that is discussed prior to an emergency.
Pets (undervalued aspect) – Know that you can take your pets with you or where to take them in case of an event (i.e. temporary shelter).
Teamwork – Working together within the community and knowing people who would want to get involved in preparedness, response or recovery.
Knowledge and Education
Hazard awareness – Have knowledge about hazards and what to do in case of an emergency.
Have a plan – Have a plan at each level such as household, street and community. Also, at a macro level, have a business continuity and school plan.
Tsunami evacuation – Know the evacuation routes and how to get there. Also, having identified alternative routes in case the main one is affected.
Communication Know what is going on/what is the situation/having a plan – Have access and knowledge of communication channels for alerts such as radio stations. Also, have ways to share information between people.
Communication/inform family you are safe – Have a way to communicate to your family about your safety and location.
Notice boards – Know where the location of a central communication point is in the community.
Identify hazards via communication – The ability to know of hazards through communication channels such as fallen power line.
Wellbeing and Health
Ability to move forwards (bounce back) – This has been highlighted at a community level. How will a community survive if it loses its main source of income? For example, communities that rely on tourism to survive when that has been impacted.
Wellbeing and mental health – This has been highlighted at an individual level. What resources are available for people who need them? For example, financial and social services.
Safety – Safety in the sense of self, loved ones and property. Also, this can be seen as financial safety and job security.
Figure 16: Detailed indicators developed by the Papamoa community members
Papa
moa
com
mun
ity

Final Report: July 2019 – September 202028
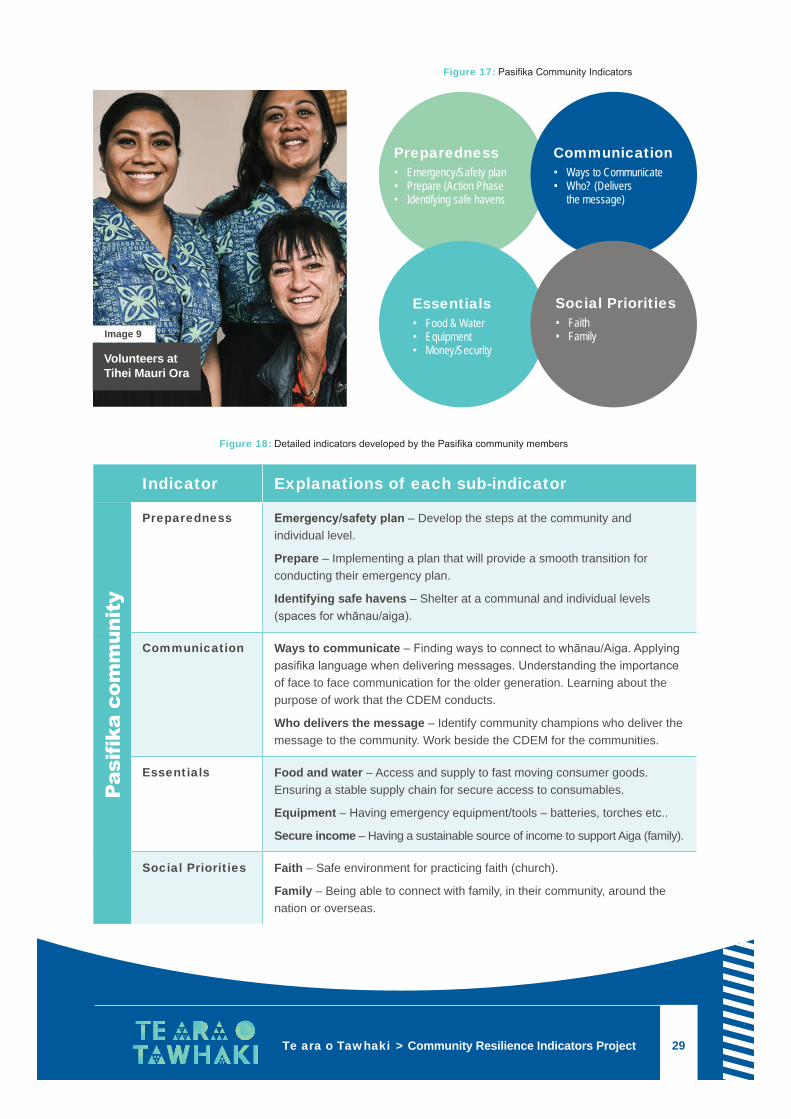
5.2 IndicatorsdevelopedbythePasifikaparticipants
During the workshop with the Pasifika community members, the themes of family, faith and resource security
were predominating in the discussions. The participants mentioned that their faith in their religion is important
to the Pasifika culture and by extension being resilient. Resilience is also highly linked to their connection
to their families. These are intertwined in the indicators of resilience the participants identified. The Pasifika
community identified four key main elements of resilience that they termed Preparedness, Communication,
Essentials and Social Priorities (Figure 17 and 18). The discussion surrounding preparedness focused
largely on developing emergency plans for the community. The participants emphasised the importance of
being prepared and acknowledged that many have no plans in place should a disaster occur. For instance,
the participants identified that during COVID-19 most of the Pasifika community was not prepared and that
the lack of preparedness amplified the impacts on people.
Languages are key
Communication was identified as an important element shaping the resilience of the Pasifika community. The
participants stated that frequently the community is presented with misinformation, understanding often get
lost when message is translated, and many members of this community have a tendency to spread rumors
and wrong information. To overcome this issue, the participants discussed that trusted individuals need to
be identified to communicate information to the wider community. In turn, information that would not come
from them should not be trusted. To ensure that the information from the CDEM is understood correctly, the
message should be tailored to the community, including being presented in various Pasifika languages.
Faith
The participants identified what was termed ‘Essentials’, which they defined as having access to consumable
goods that would provide their families with basic needs. The recent impact of COVID-19 greatly shaped the
discussion on such key element as many lost their job, impacting their level of security. Pasifika participants
also voice the access and possession of emergency equipment such as torches and batteries. Social
Priorities was focused mainly on faith and family. The participants voiced that faith is an essential part of
their culture which contributes to their resilience. This aspect was twofold: being able to actively practice
their faith makes them more resilient spiritually and psychological. Besides, practicing their faith help foster
family connections and collaboration, which is deeply rooted in the Pasifika culture. For instance, these
connections help them cope with the disasters. The participants explained that resilience was being able to
communicate and get support from their families both in New Zealand and overseas.
Sustainability
The participants highlighted that conducting more workshops would be required to further develop the
indicators and apply them within the community. Discussions around implementing workshops annually or
even monthly was considered for evaluation of the indicators, including evaluating their success within the
community and whether they are useful to strengthen resilience.
WHAT MATTERS MOST TO PEOPLE IN AN EMERGENCY
29Te ara o Tawhaki > Community Resilience Indicators Project
Indicator Explanations of each sub-indicator
Preparedness Emergency/safety plan – Develop the steps at the community and individual level.
Prepare – Implementing a plan that will provide a smooth transition for conducting their emergency plan.
Identifying safe havens – Shelter at a communal and individual levels (spaces for whānau/aiga).
Communication Ways to communicate – Finding ways to connect to whānau/Aiga. Applying pasifika language when delivering messages. Understanding the importance of face to face communication for the older generation. Learning about the purpose of work that the CDEM conducts.
Who delivers the message – Identify community champions who deliver the message to the community. Work beside the CDEM for the communities.
Essentials Food and water – Access and supply to fast moving consumer goods. Ensuring a stable supply chain for secure access to consumables.
Equipment – Having emergency equipment/tools – batteries, torches etc..
Secure income – Having a sustainable source of income to support Aiga (family).
Social Priorities Faith – Safe environment for practicing faith (church).
Family – Being able to connect with family, in their community, around the nation or overseas.
Figure 18: Detailed indicators developed by the Pasifika community members
Pasifikacommunity
Preparedness• Emergency/Safety plan• Prepare (Action Phase• Identifying safe havens
Communication• Ways to Communicate• Who? (Delivers
the message)
Essentials• Food & Water• Equipment• Money/Security
Social Priorities• Faith • Family
Figure 17: Pasifika Community Indicators
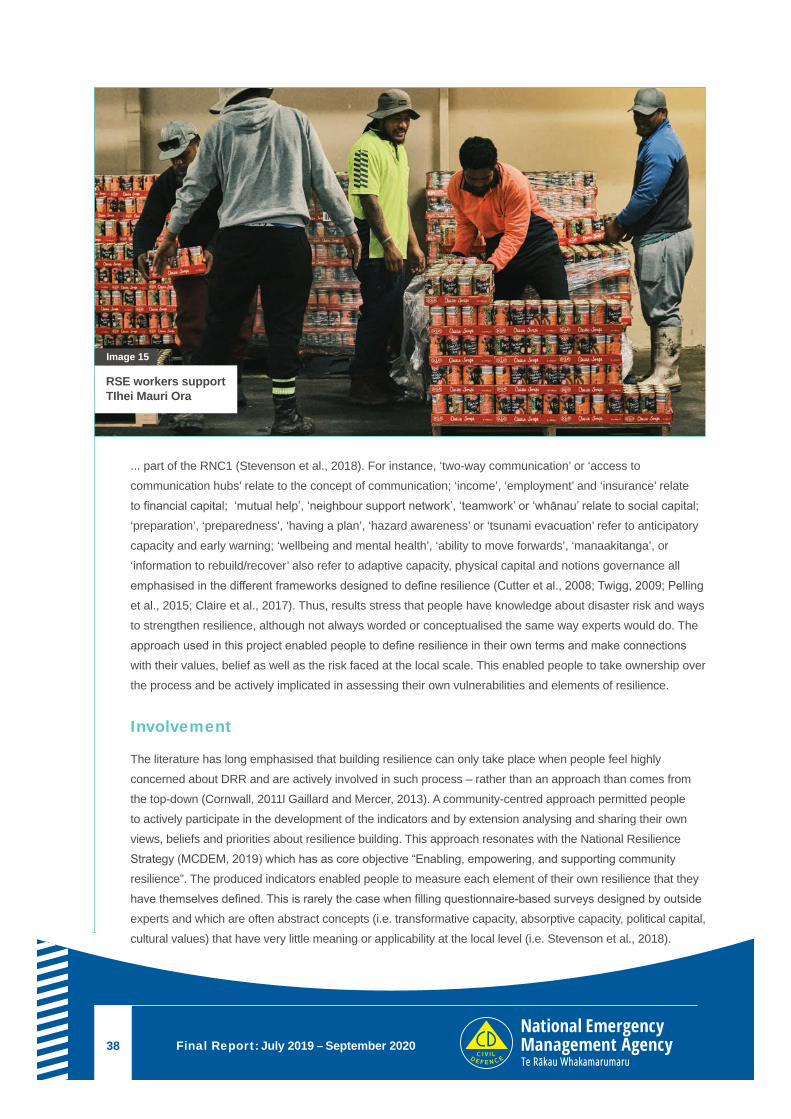
Volunteers at Tihei Mauri Ora
Image 9
Wairuatanga
Celebrating Pasifika
Image 10
WHAT MATTERS MOST TO PEOPLE IN AN EMERGENCY
31Te ara o Tawhaki > Community Resilience Indicators Project
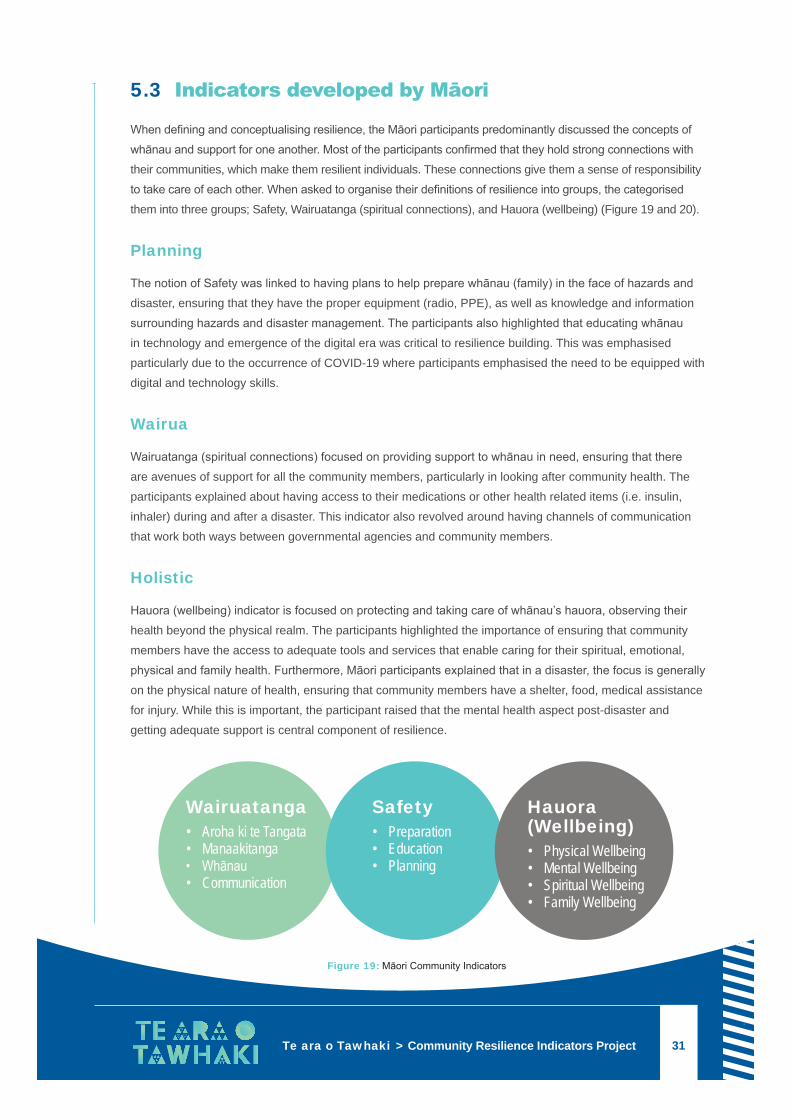
5.3 IndicatorsdevelopedbyMāori
When defining and conceptualising resilience, the Māori participants predominantly discussed the concepts of
whānau and support for one another. Most of the participants confirmed that they hold strong connections with
their communities, which make them resilient individuals. These connections give them a sense of responsibility
to take care of each other. When asked to organise their definitions of resilience into groups, the categorised
them into three groups; Safety, Wairuatanga (spiritual connections), and Hauora (wellbeing) (Figure 19 and 20).
Planning
The notion of Safety was linked to having plans to help prepare whānau (family) in the face of hazards and
disaster, ensuring that they have the proper equipment (radio, PPE), as well as knowledge and information
surrounding hazards and disaster management. The participants also highlighted that educating whānau
in technology and emergence of the digital era was critical to resilience building. This was emphasised
particularly due to the occurrence of COVID-19 where participants emphasised the need to be equipped with
digital and technology skills.
Wairua
Wairuatanga (spiritual connections) focused on providing support to whānau in need, ensuring that there
are avenues of support for all the community members, particularly in looking after community health. The
participants explained about having access to their medications or other health related items (i.e. insulin,
inhaler) during and after a disaster. This indicator also revolved around having channels of communication
that work both ways between governmental agencies and community members.
Holistic
Hauora (wellbeing) indicator is focused on protecting and taking care of whānau’s hauora, observing their
health beyond the physical realm. The participants highlighted the importance of ensuring that community
members have the access to adequate tools and services that enable caring for their spiritual, emotional,
physical and family health. Furthermore, Māori participants explained that in a disaster, the focus is generally
on the physical nature of health, ensuring that community members have a shelter, food, medical assistance
for injury. While this is important, the participant raised that the mental health aspect post-disaster and
getting adequate support is central component of resilience.
Figure 19: Māori Community Indicators
Wairuatanga• Aroha ki te Tangata• Manaakitanga• Whānau• Communication
Safety• Preparation• Education• Planning
Hauora (Wellbeing) • Physical Wellbeing• Mental Wellbeing• Spiritual Wellbeing• Family Wellbeing
Final Report: July 2019 – September 202032
Indicator Explanations of each sub-indicator
Wairuatanga (Spiritual Connection)
Aroha ki te tangata – Provide support within the community to whānau in need.
Manaakitanga – Ensuring that all whānau are receiving the support they need/(access to whānau in need).
Whānau – Ensuring safety for whānau health, (e.g have access to their medication, taking their medication).
Communication – Having an avenue of communication, working both ways (to whānau and to Māori wardens).
Safety Preparation – Ensuring that whānau are equipped with resources and knowledge to endure an event of a disaster.
Education – Educating whānau, equipping them with the ability to cope with the impacts of disaster. Develop whānau’s skills with technology to aid in their ability to communicate.
Planning – Help whānau develop plans for the event of a disaster.
Hauora (Wellbeing)
Physical wellbeing – Aid whānau in upkeeping their physical wellbeing.
Mental wellbeing – Provide supports/methods that helps whānau cope mentally.
Spiritual wellbeing – Support whānau’s spiritual wellbeing.
Family wellbeing – Ensure that whānau’s wellbeing is kept positive.
Figure 20: Detailed indicators developed by the Māori community members
Māoricom
munity
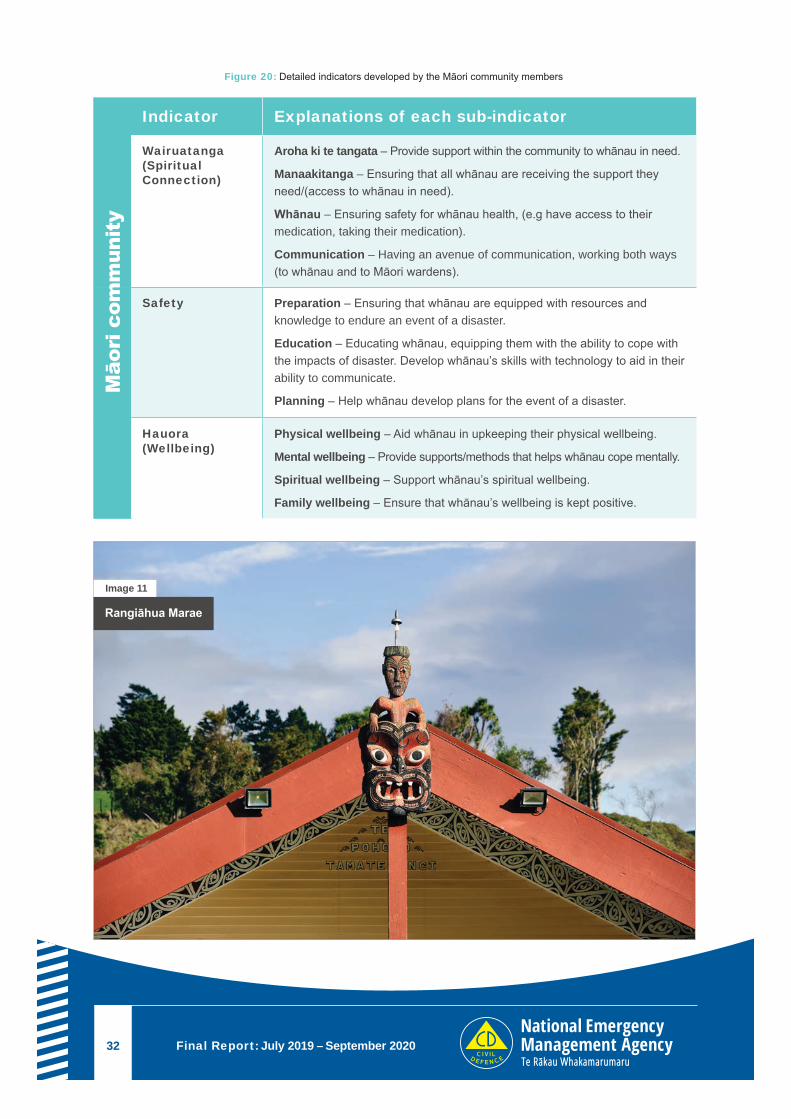
Rangiāhua Marae
Image 11
WHAT MATTERS MOST TO PEOPLE IN AN EMERGENCY
33Te ara o Tawhaki > Community Resilience Indicators Project
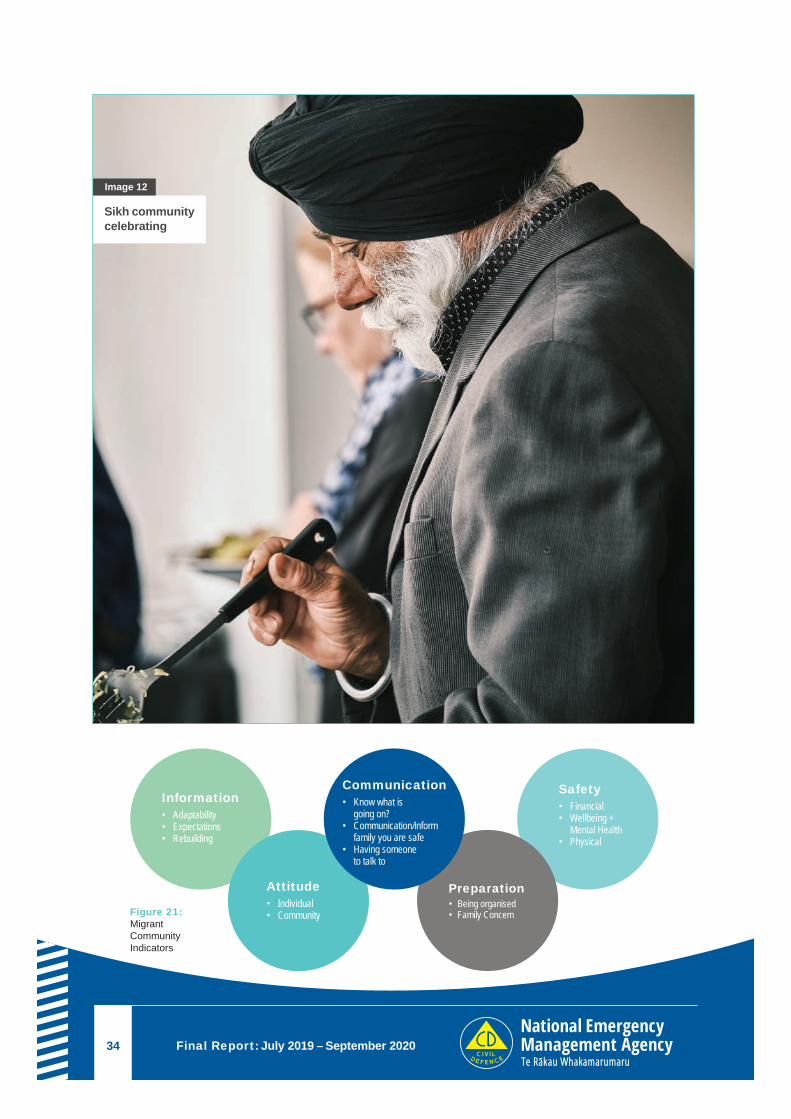
5.4 Indicators developed by migrant participants
The primary indicators developed with the migrant participants included Information, Attitude,
Communication, Preparation and Safety. Participants identified that accurate, understandable and timely
information is critical before, during and after a disaster. This encompasses how the information is delivered,
including accurate translation, and the type of information that is presented to the community. In regard
to the type of information being provided to the community the participants highlighted that they prefer
guidance and instruction how they can rebuild their community both physically (i.e. housing) and mentally
(i.e. psychosocial recovery). The migrants explained that often, when the CDEM/Government organisations
provide information about hazards and disasters, the type of language that is used is difficult to understand
due to the lack of understanding English. Access to knowledge surrounding disasters influences an
individual’s level of resilience, the participants highlighted that improving this access will support the
improvement of their resilience. An additionally benefit of creating more effective channels of communication
is providing the ability to communicate outside of their community, informing family within and outside of New
Zealand about their wellbeing. This was highlighted as an important factor to the migrant community since all
them emphasised their strong family ties and its importance is being resilient.
Attitude
Attitude was considered as an important aspect of resilience amongst the migrant community, stating that this
factor is the main determinant that predominately determines individuals and community’s abilities to recover
and rebuild after a disaster. Cultivating a social environment that reflects positive reinforcement towards
supporting the community was highlighted as important regarding resilience by the participants. Additionally,
the participants stated that local people hold capacities, skills and knowledge. Part of resilience building implied
having organisations that take into account such capacities and adequately draw on them.
Communication
The indicator Preparation focused on the importance of having a plan to be implemented in the face of
hazards and disasters. This involves determining the necessary steps to undertake should a hazard occur.
The participants also identified that stockpiling of emergency supplies is an essential component of strong
emergency plans. They also highlighted the importance of communicating in a timely fashion with their family
members both within New Zealand and overseas.
Sustainable relationships
The last indicator was Safety and encompassed financial security and support for individuals’ wellbeing
and mental health. The participants identified that often disasters can result in the loss of employment. The
participants reflected on COVID-19 and the direct impact on job security. The migrant participants highlighted
that resilience is also about access to welfare systems to supporting those who have lost their jobs. Overall,
the process of engaging migrants in building their own indicators was highly positive as it enabled them
to point out aspects that matter to them and areas where resilience can be strengthened. The participants
suggested to conducting more workshops to further develop the indicators and discuss community resilience.
Final Report: July 2019 – September 202034
Sikh community celebrating
Image 12
Figure 21: Migrant Community Indicators
Safety• Financial• Wellbeing +
Mental Health• Physical
Information• Adaptability• Expectations• Rebuilding
Attitude• Individual • Community
Preparation• Being organised • Family Concern
Communication• Know what is
going on?• Communication/inform family you are safe• Having someone
to talk to
WHAT MATTERS MOST TO PEOPLE IN AN EMERGENCY
35Te ara o Tawhaki > Community Resilience Indicators Project
Indicator Explanations of each sub-indicator
Information Adaptability – Being aware of the language used to reach migrant communities and using the appropriate channels to reach out (mainstream tv vs migrant tv).
Expectations – The type of language used. Communicating to community in a language they understand (everyday language via community champions).
Rebuilding – Access to information on rebuilding what is broken.
Attitude Individual – Having the right attitude i.e., patience, perseverance, optimistic and staying present.
Community – Awareness of community needs, vulnerability, mana-enhancing.
Communication Know what is going on – Have access and knowledge of communication channels for alerts such as radio stations. Also, a way to share information between people. Ability to communicate in cells or communities – mosque or international students.
Communication/inform family you are safe – Have a way to communicate to your family about your safety and location.
Having someone to talk to – Developing a support system that you can use.
Preparation Being organised – Essential papers, medication and contacts. Food and Water, emergency kit/grab bag.
Family concern – Being able to let people back home know that they are ok and vice versa.
Safety Financial – Financial safety and job security. Horticultural workers and hospitality and couldn’t access mainstream welfare system.
Wellbeing and mental health – Individual/religious freedoms. Knowing what resources are available for people who need them.
Physical – Safety in the sense of self, loved ones and property.
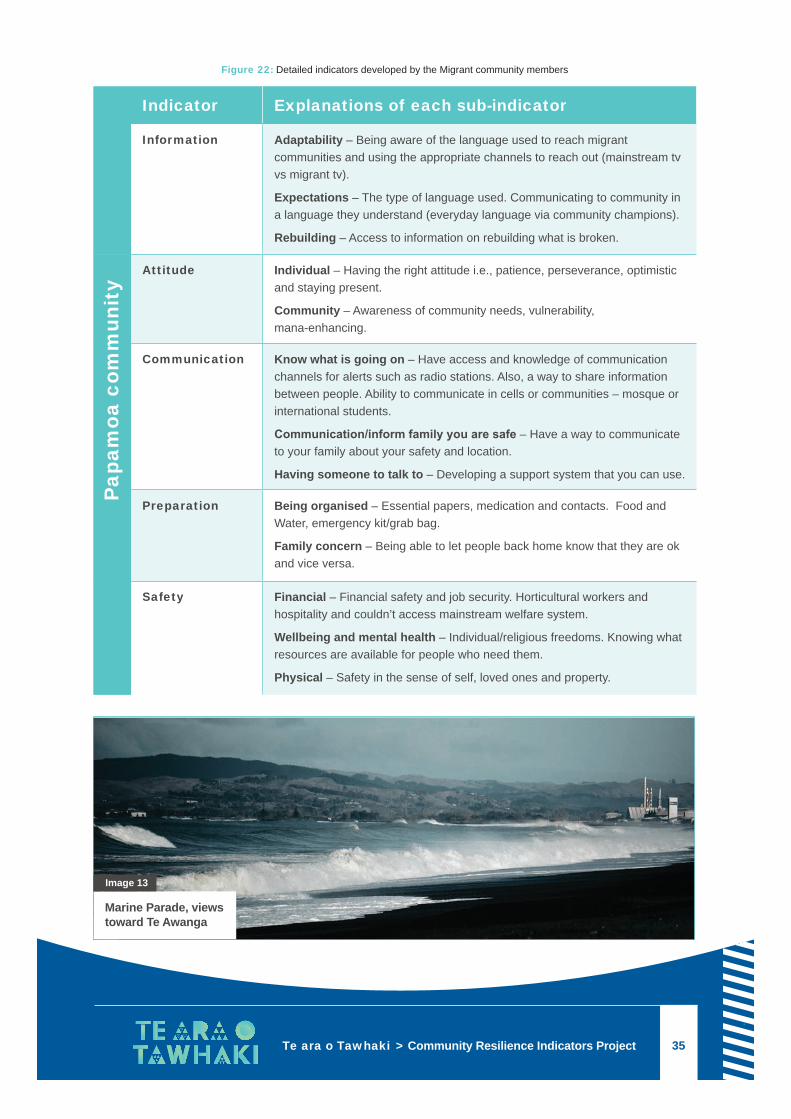
Figure 22: Detailed indicators developed by the Migrant community members
Papa
moa
com
mun
ity
Marine Parade, views toward Te Awanga
Image 13
Kōrerorero
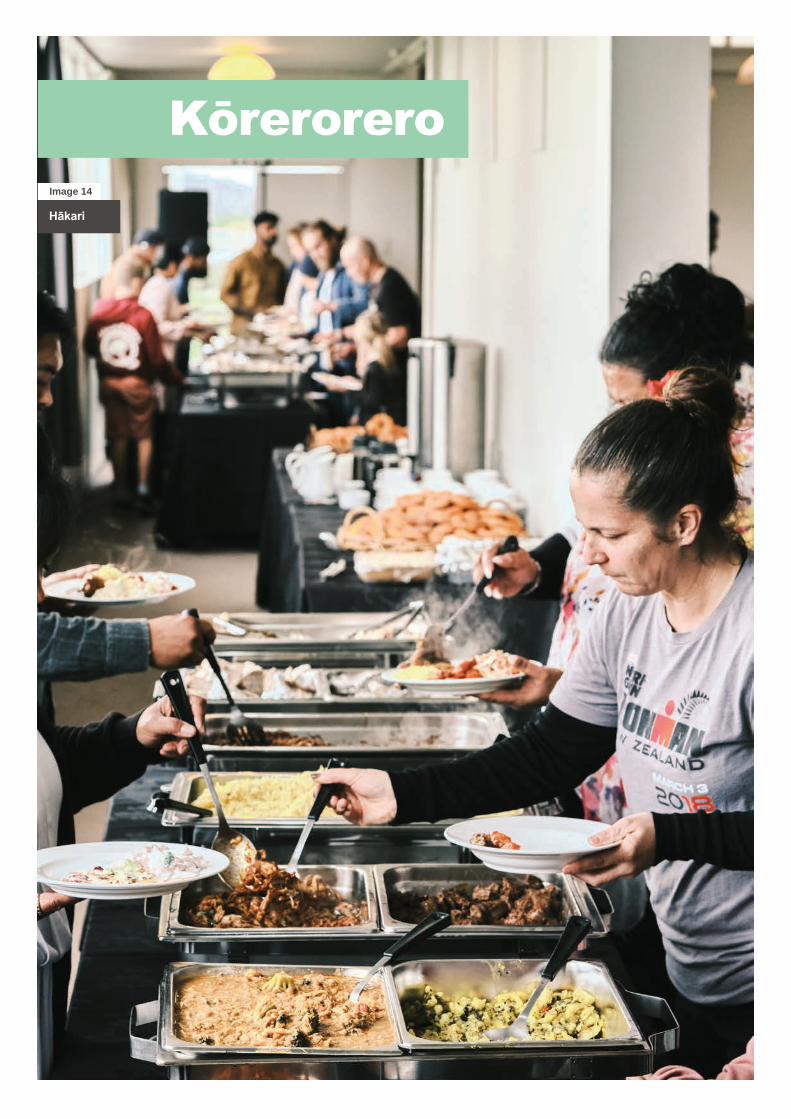
Hākari
Image 14
WHAT MATTERS MOST TO PEOPLE IN AN EMERGENCY
37Te ara o Tawhaki > Community Resilience Indicators Project
6. Discussion This section discusses both the process and outcomes in using a community-centred approach to develop
resilience indicators. It focuses on the strengths, limitations as well as lessons learned for replication.
6.1 Positive outcomes of community-centred indicators
While the communities differed in terms of ethnicity, cultural background or geographical locations, there were
many cross over amongst the indicators and sub-indicators developed. Communication is primary indicator
that emerged across three case studies, excluding the Māori Community. For Māori, communication fell under
the category of Wairuatanga (Spiritual Connection) reflecting their world view creating their own indicators.
Each community has its own interpretation of communication. The Pasifika participants focused around the
methods of communication and identifying who is to deliver the message while the migrant and Papamoa
participants underlined the importance of ‘being informed of what is going on’ not how the message is delivered.
Another theme that recurrently emerged was ‘preparation’ or ‘preparedness’, primarily discussing the notion of
developing an emergency plan or having access to the knowledge or tools to create a plan, either for the direct
family or wider community. Three of the communities (Māori, Pākehā, Pasifika) talked about the implementation
of a plan. Migrants, in turn, identified the importance of being organised, not a direct link to developing safety
plans, but a form of individual and community management that enables to cope with and respond to a disaster.
Wellbeing is central
Another recurrent indicator was ‘wellbeing and mental health’. This was identified across the Papamoa, Māori
and migrant community but it was absent from the Pasifika community. Yet, one can argue that religious beliefs
and practices are strongly linked to mental health and wellbeing as emphasised in the literature (Tamasese et
al., 2005; 2010). The Papamoa and the Māori community had wellbeing as one of their primary indicators, but
the Migrant community placed the wellbeing under the primary indicator of safety. This highlights that the three
communities are able to identify the importance of their own personal mental health and would want to know
what resources are available for those that need them. Notably, Māori and Pasifika participants have highlighted
the aspects of faith and spirituality as an area of importance for them, which reflects the cultural lens that these
communities use to appraise resilience (Thornton et al., 2010; Webber, 2008). Financial aspect (i.e. income,
insurance, employment) were recurrently mentioned as element of resilience, but generally associated directly
with wellbeing, mental health and safety. Lastly, local people underscored social connections and cooperation
which they termed ‘teamwork’, ‘community collaboration’, ‘whānau’, ‘mutual help’ and ‘neighbour support
network’, pointing out that resilience takes place at different levels, individual, family and the wider community
(Twigg, 2009; Aldrich, 2012; Béné, 2013).
Communities are connected
Most of the indicators and sub-indicators relate directly to key aspects often emphasised in the literature
(i.e. Cutter, 2008; Twigg, 2009; Pelling et al., 2015; Seara et al., 2016), including those developed as ...
Final Report: July 2019 – September 202038
... part of the RNC1 (Stevenson et al., 2018). For instance, ‘two-way communication’ or ‘access to
communication hubs’ relate to the concept of communication; ‘income’, ‘employment’ and ‘insurance’ relate
to financial capital; ‘mutual help’, ‘neighbour support network’, ‘teamwork’ or ‘whānau’ relate to social capital;
‘preparation’, ‘preparedness’, ‘having a plan’, ‘hazard awareness’ or ‘tsunami evacuation’ refer to anticipatory
capacity and early warning; ‘wellbeing and mental health’, ‘ability to move forwards’, ‘manaakitanga’, or
‘information to rebuild/recover’ also refer to adaptive capacity, physical capital and notions governance all
emphasised in the different frameworks designed to define resilience (Cutter et al., 2008; Twigg, 2009; Pelling
et al., 2015; Claire et al., 2017). Thus, results stress that people have knowledge about disaster risk and ways
to strengthen resilience, although not always worded or conceptualised the same way experts would do. The
approach used in this project enabled people to define resilience in their own terms and make connections
with their values, belief as well as the risk faced at the local scale. This enabled people to take ownership over
the process and be actively implicated in assessing their own vulnerabilities and elements of resilience.
Involvement
The literature has long emphasised that building resilience can only take place when people feel highly
concerned about DRR and are actively involved in such process – rather than an approach than comes from
the top-down (Cornwall, 2011l Gaillard and Mercer, 2013). A community-centred approach permitted people
to actively participate in the development of the indicators and by extension analysing and sharing their own
views, beliefs and priorities about resilience building. This approach resonates with the National Resilience
Strategy (MCDEM, 2019) which has as core objective “Enabling, empowering, and supporting community
resilience”. The produced indicators enabled people to measure each element of their own resilience that they
have themselves defined. This is rarely the case when filling questionnaire-based surveys designed by outside
experts and which are often abstract concepts (i.e. transformative capacity, absorptive capacity, political capital,
cultural values) that have very little meaning or applicability at the local level (i.e. Stevenson et al., 2018).
RSE workers support TIhei Mauri Ora
Image 15
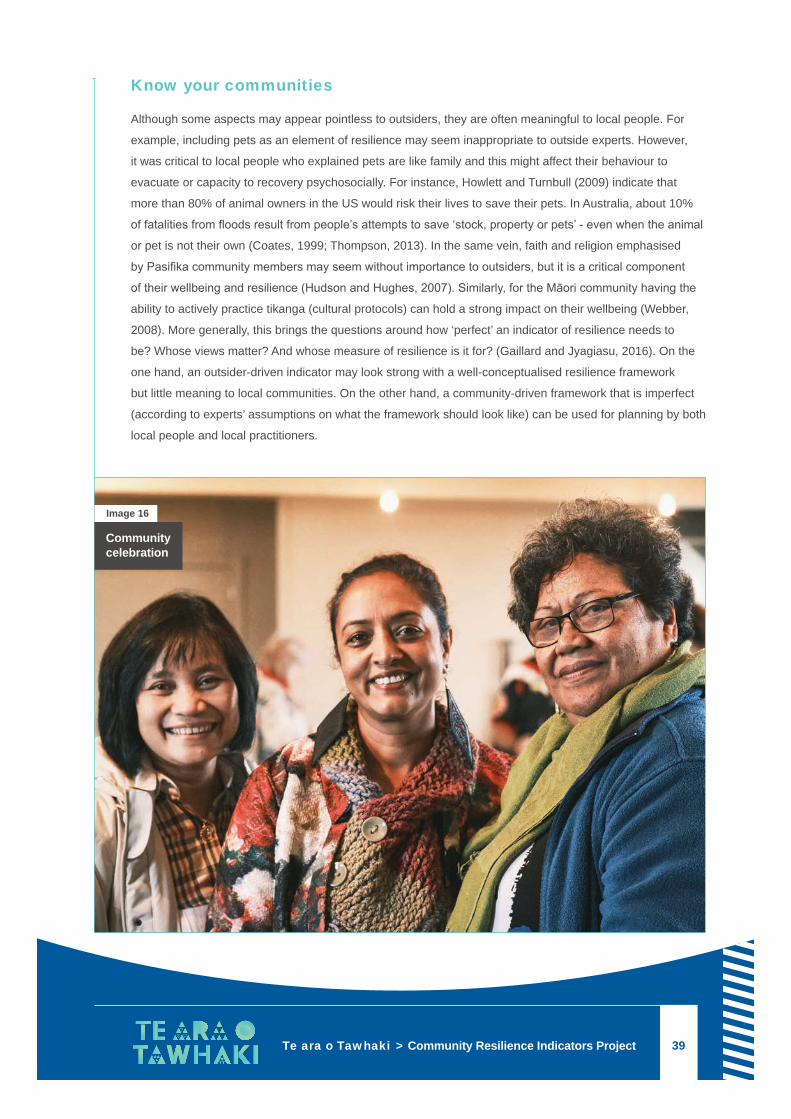
WHAT MATTERS MOST TO PEOPLE IN AN EMERGENCY
39Te ara o Tawhaki > Community Resilience Indicators Project
Know your communities
Although some aspects may appear pointless to outsiders, they are often meaningful to local people. For
example, including pets as an element of resilience may seem inappropriate to outside experts. However,
it was critical to local people who explained pets are like family and this might affect their behaviour to
evacuate or capacity to recovery psychosocially. For instance, Howlett and Turnbull (2009) indicate that
more than 80% of animal owners in the US would risk their lives to save their pets. In Australia, about 10%
of fatalities from floods result from people’s attempts to save ‘stock, property or pets’ - even when the animal
or pet is not their own (Coates, 1999; Thompson, 2013). In the same vein, faith and religion emphasised
by Pasifika community members may seem without importance to outsiders, but it is a critical component
of their wellbeing and resilience (Hudson and Hughes, 2007). Similarly, for the Māori community having the
ability to actively practice tikanga (cultural protocols) can hold a strong impact on their wellbeing (Webber,
2008). More generally, this brings the questions around how ‘perfect’ an indicator of resilience needs to
be? Whose views matter? And whose measure of resilience is it for? (Gaillard and Jyagiasu, 2016). On the
one hand, an outsider-driven indicator may look strong with a well-conceptualised resilience framework
but little meaning to local communities. On the other hand, a community-driven framework that is imperfect
(according to experts’ assumptions on what the framework should look like) can be used for planning by both
local people and local practitioners.
Community celebration
Image 16
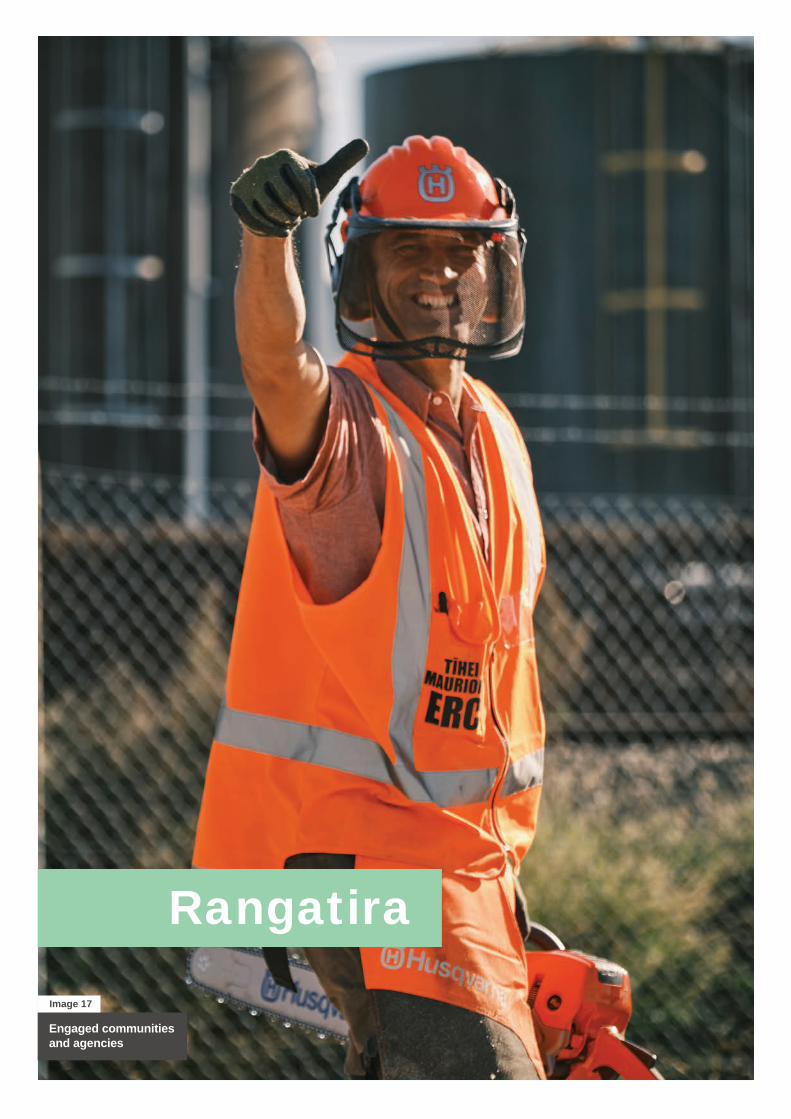
Rangatira
Engaged communities and agencies
Image 17
WHAT MATTERS MOST TO PEOPLE IN AN EMERGENCY
41Te ara o Tawhaki > Community Resilience Indicators Project
It’s about the process
A key outcome of using community-centred approach was that the produced indicators provided a platform for
dialogue, which is at the core of effective and sustainable disaster risk reduction process (Chambers, 2007;
Gaillard and Mercer, 2013). At the end of the process, both practitioners and local people had a common
understanding of the issues faced at local level, which might help increase trust, collaboration and more
effective planning. This is the opposite to the more traditional top-down approaches where indicators are purely
extractive with local people having a passive role of respondent or recipient of resilience building programs
(Jones and D’Errico, 2019; Jones 2019). Furthermore, such aspect questions the function of an indicator,
and whether it should only be reduced to “something that shows what a situation is like” as defined in the
Cambridge English dictionary, or, beyond providing a measure of resilience, also be a tool that provides mutual
understanding to different stakeholders and help discuss ways to address “the situation”.
Collaboration with CDEM
Developing community-centred indicators enabled people to pinpoint gaps and needs for improvement,
including how they could work better with CDEM groups and other relevant stakeholders. As an illustration,
the Pasifika participants discussed the need to develop a resilience plan that was largely missing in their
community. The participants identified different initiatives such as conducting more fono (meetings) and
involving more members of the community, involving the Pasifika health team and the Pasifika health
leadership groups, which they thought are organisations that can support the work to implemented in the
Pasifika community. Migrants requested more workshops with CDEM and explore how to strengthen the area
of communication. For practitioners, the produced indicators allow for a strong understanding of areas of
importance for the community and work with them to improve on these areas. This means that the indicators
help practitioners better target their preparedness, response and recovery activities in ways that fit local needs.
It shall also imply more sustainable actions to resilience building, since they have been discussed throughout
the entire process (Cornwall, 2008).
Readiness
Beyond defining resilience indicators, the process enabled people to share knowledge about hazards and
risk, concerns and ways to be more resilient. For example, in Papamoa, the participants discussed about
local capacities and social cohesion, identifying individuals in the community who had access to tools such
as machinery to clear physical obstructions in case of a disastrous event. The Māori participants shared that
“typically no work gets done until an emergency occurs. Then the community scrambles to cope with it, to
return into the same routine without learning from the community’s previous mistakes holding the same level
of vulnerability before the occurrence of the event”. The participants said they wanted to change this approach
in ways that the community would be more prepared by identifying their vulnerabilities and reducing them.
These findings emphasise the importance of the actively involving people in discussing their own components
of resilience (Chambers, 2003; 2007). These aspects are largely intangible, difficult to quantify or report on
to donors and policy makers. Nonetheless, these discussions contributed to place people at the centre of
emergencies and empower them in the risk reduction process, one of the key goals of the New Zealand
Resilience Strategy (MCDEM, 2019).
Final Report: July 2019 – September 202042
6.2 Limitation and challenges in developing indicators
Successfully developing community-centred indicators is not without difficulties. Most of the participants from
the four communities were very open to the idea of creating resilience indicators reflecting their own views
and the process was largely successful. Yet, fieldwork revealed that a more bottom-up/community-centred
approach can be challenging because people have been used to workshops run in a more top-down fashion.
This was indeed obvious in Papamoa where a few elderly participants came with their CDEM booklets
and expected to be told what to do. For example, the older participants kept highlighting the contents of
‘grab bags’ and CDEM check list of being prepared. However, none of this was experienced with the other
groups (Māori, migrants, Pasifika). Another element to consider is an history of lack of trust from local people
towards CDEM groups and therefore a change of approach in the way practitioners engage with local
communities can be challenging. Doing groundwork and developing strong relationship with local people
prior to facilitating the workshops made the process easier.
Process is key
Results revealed that some aspects are essential to ensure people are actively involved in the process.
One of these aspects includes the duration and timing of the activities. Having too much time between
the workshops affects the momentum over the process. For example, in Papamoa there was almost four
months between the first and second workshop, which affected the engagement of community members
in the development of the indicators. In the three communities of Hawke’s Bay, a decision was made to
run a one-day workshop instead, which proved effective. However, facilitators and communities need to be
mindful that being constrained by time presents the risk to rush the process, including discussions on some
important aspects of community resilience (Cornwall, 2011). By not having time as a constraint, individuals
are more able to unpack each aspect of the workshop, ask questions, share ideas, and come to a mutual
understanding and collective decisions.
Community engagement skills
Facilitation skills are also key for local people to actively participate and produce meaningful indicators.
For example, it was found that the words ‘indicators’, ‘resilience’ and ‘vulnerabilities’ were not intelligible to
the participants. Removing professional jargon and using simple wording that everyone could understand
contributed to create an environment where individuals could value and voice their own experience. Words
like ‘being ready’, ‘being prepared’ or ‘bouncing back/bouncing forward’ seem more appropriate as noted in
other studies (Jones, 2019). In Papamoa, the facilitators used the analogy with the All Black to communicate
about the concept of resilience and idea of preparedness, coping, collaborating and adapting to difficult
situations such as disasters. This indeed proved useful and helped both creating confidence and reducing
power relationship between the practitioners and locals. In the same vein, the facilitators of the Māori and
Pasifika communities were knowledgeable about the Māori/Pasifika concepts: this helped generating trust,
communicating ideas and discuss key aspects of resilience. In turn, a facilitator not having such skills
or background might struggle to discuss concepts such as manaakitanga and hauora for Māori and the
importance of religious believes and practices for Pasifika people.
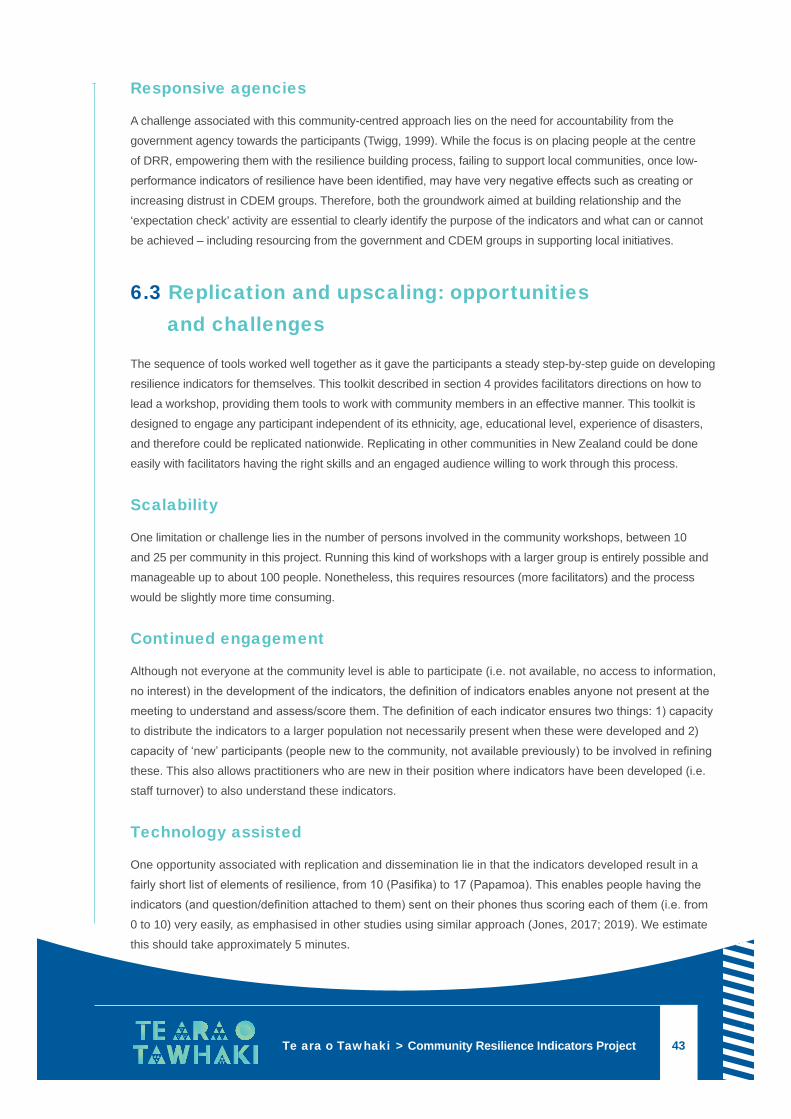
WHAT MATTERS MOST TO PEOPLE IN AN EMERGENCY
43Te ara o Tawhaki > Community Resilience Indicators Project
Responsive agencies
A challenge associated with this community-centred approach lies on the need for accountability from the
government agency towards the participants (Twigg, 1999). While the focus is on placing people at the centre
of DRR, empowering them with the resilience building process, failing to support local communities, once low-
performance indicators of resilience have been identified, may have very negative effects such as creating or
increasing distrust in CDEM groups. Therefore, both the groundwork aimed at building relationship and the
‘expectation check’ activity are essential to clearly identify the purpose of the indicators and what can or cannot
be achieved – including resourcing from the government and CDEM groups in supporting local initiatives.
6.3 Replication and upscaling: opportunities and challenges
The sequence of tools worked well together as it gave the participants a steady step-by-step guide on developing
resilience indicators for themselves. This toolkit described in section 4 provides facilitators directions on how to
lead a workshop, providing them tools to work with community members in an effective manner. This toolkit is
designed to engage any participant independent of its ethnicity, age, educational level, experience of disasters,
and therefore could be replicated nationwide. Replicating in other communities in New Zealand could be done
easily with facilitators having the right skills and an engaged audience willing to work through this process.
Scalability
One limitation or challenge lies in the number of persons involved in the community workshops, between 10
and 25 per community in this project. Running this kind of workshops with a larger group is entirely possible and
manageable up to about 100 people. Nonetheless, this requires resources (more facilitators) and the process
would be slightly more time consuming.
Continued engagement
Although not everyone at the community level is able to participate (i.e. not available, no access to information,
no interest) in the development of the indicators, the definition of indicators enables anyone not present at the
meeting to understand and assess/score them. The definition of each indicator ensures two things: 1) capacity
to distribute the indicators to a larger population not necessarily present when these were developed and 2)
capacity of ‘new’ participants (people new to the community, not available previously) to be involved in refining
these. This also allows practitioners who are new in their position where indicators have been developed (i.e.
staff turnover) to also understand these indicators.
Technology assisted
One opportunity associated with replication and dissemination lie in that the indicators developed result in a
fairly short list of elements of resilience, from 10 (Pasifika) to 17 (Papamoa). This enables people having the
indicators (and question/definition attached to them) sent on their phones thus scoring each of them (i.e. from
0 to 10) very easily, as emphasised in other studies using similar approach (Jones, 2017; 2019). We estimate
this should take approximately 5 minutes.
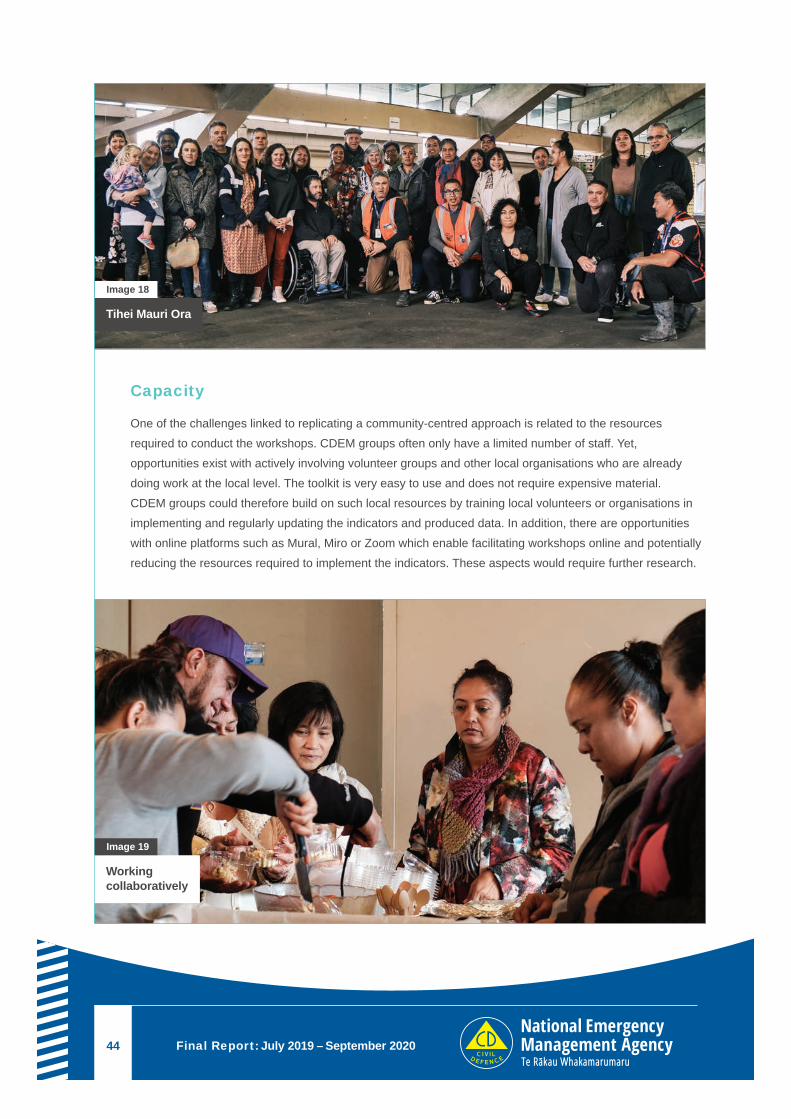
Final Report: July 2019 – September 202044
Tihei Mauri Ora
Image 18
Working collaboratively
Image 19
Capacity
One of the challenges linked to replicating a community-centred approach is related to the resources
required to conduct the workshops. CDEM groups often only have a limited number of staff. Yet,
opportunities exist with actively involving volunteer groups and other local organisations who are already
doing work at the local level. The toolkit is very easy to use and does not require expensive material.
CDEM groups could therefore build on such local resources by training local volunteers or organisations in
implementing and regularly updating the indicators and produced data. In addition, there are opportunities
with online platforms such as Mural, Miro or Zoom which enable facilitating workshops online and potentially
reducing the resources required to implement the indicators. These aspects would require further research.
WHAT MATTERS MOST TO PEOPLE IN AN EMERGENCY
45Te ara o Tawhaki > Community Resilience Indicators Project
Conclusion This report aimed to 1) explain the rationale for using a community-centred approach to developing
resilience indicators; 2) detail the methodology used in the Te ara o Tawhaki project and describe a toolkit
that can be used by facilitators; 3) provide the key results from the trial of this toolkit in four communities;
and 4) analyse the strengths and positive outcomes of the toolkit, the limitations and challenges associated
to it, and the potential for replication in different parts of New Zealand.
The way forward
The community-centred approach to developing resilience indicators is meant to produce indicators that
are context specific, place people at the centre of the risk assessment and resilience building process, and
ultimately strengthen collaboration with CDEM groups. The positive outcomes included:
+ The toolkit works very well as it enables participants to develop their own indicators of resilience;
+ It permits people to take ownership over the process and place them at the centre of the DRR and
resilience building process;
+ The process enables people to include their values, beliefs, worldviews in the indicators;
+ Anyone can participate, including those highly vulnerable or marginalised;
+ The produced indicators enable locals/practitioners mutual understanding on local issues;
+ The indicators help measure areas of low level of resilience that need to be strengthened. It means
policymakers and practitioners can better target their activities aimed to addressing local needs;
+ The process creates more trust and help foster collaboration;
+ The set of indicators is short and can easily be sent to people’s phones taking about 5 minutes to complete;
+ If people have not been involved in the initial development of the indicators (new community members,
not available etc.), they can still measure resilience in their community;
+ Definition of each indicator enables new staff (i.e. staff turnover) to build on the work previously done;
+ The toolkit is easy to use with opportunities to build on local resources such as volunteer groups.
Nonetheless, developing and implementing the indicators present different challenges and limitations,
largely inherent to the nature of the methodological approach and resources required. These include:
+ Developing the indicators requires facilitation skills which necessitate training;
+ The process takes 4 to 7 hours that can be divided in different workshops: this potentially requires
resources to implement;
+ The obtained indicators represent communities’ unique experiences and understanding of resilience: this
means they are context specific and not comparable from one community to another;
+ Lack of accountability from CDEM groups to the local people in areas that have been identified as ‘low
performing’ in terms of resilience could increase distrust and be disempowering instead of increasing trust
and empower people in building their own resilience.
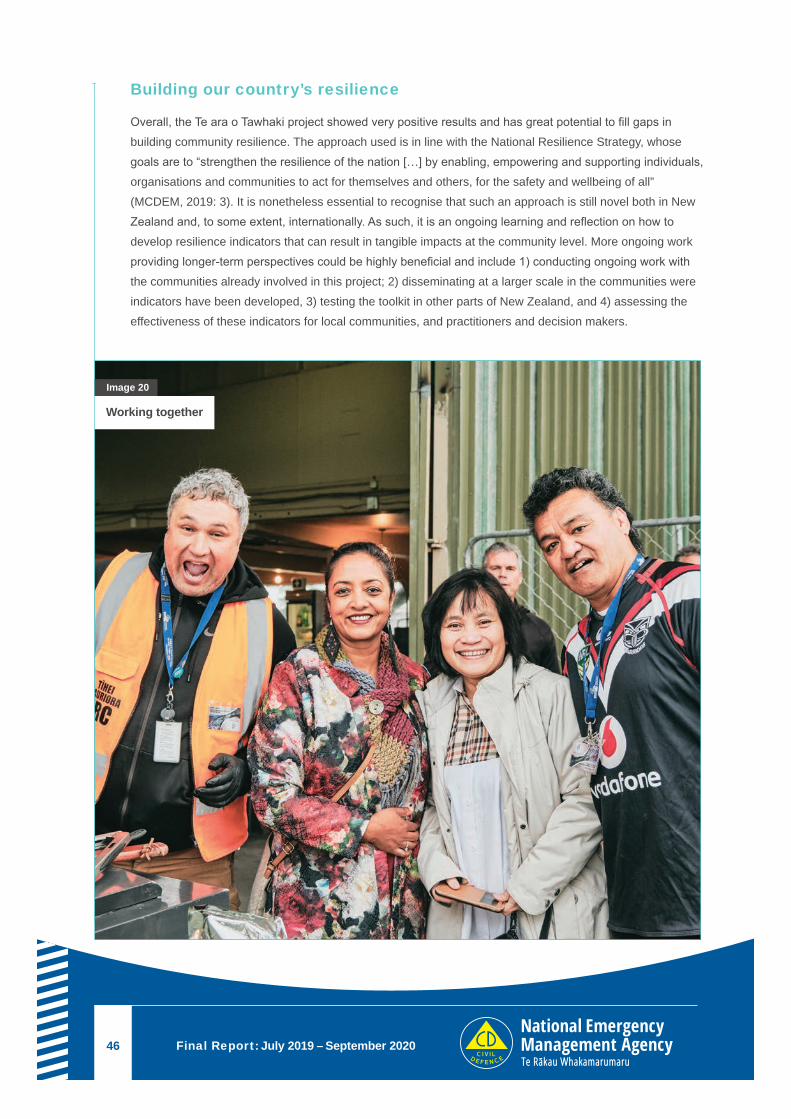
Final Report: July 2019 – September 202046
Building our country’s resilience
Overall, the Te ara o Tawhaki project showed very positive results and has great potential to fill gaps in
building community resilience. The approach used is in line with the National Resilience Strategy, whose
goals are to “strengthen the resilience of the nation […] by enabling, empowering and supporting individuals,
organisations and communities to act for themselves and others, for the safety and wellbeing of all”
(MCDEM, 2019: 3). It is nonetheless essential to recognise that such an approach is still novel both in New
Zealand and, to some extent, internationally. As such, it is an ongoing learning and reflection on how to
develop resilience indicators that can result in tangible impacts at the community level. More ongoing work
providing longer-term perspectives could be highly beneficial and include 1) conducting ongoing work with
the communities already involved in this project; 2) disseminating at a larger scale in the communities were
indicators have been developed, 3) testing the toolkit in other parts of New Zealand, and 4) assessing the
effectiveness of these indicators for local communities, and practitioners and decision makers.
Working together
Image 20
WHAT MATTERS MOST TO PEOPLE IN AN EMERGENCY
47Te ara o Tawhaki > Community Resilience Indicators Project
ReferencesAldrich D. P. (2012) Building resilience: Social capital in post-disaster recovery. University of Chicago Press.
Bahadur A., and F. Pichon (2017) Analysis of resilience measurement frameworks and approaches.
Overseas Development Institute, London, UK. [online] URL: http://www.preventionweb.net/
publications/view/52589
Bankoff G. (2019) Remaking the World in our Own Image: Vulnerability Resilience and Adaptation as
Historical Discourses. Disasters 43(2): 221–239.
Béné C. (2013) Towards a quantifiable measure of resilience. Working Paper No. 434, Institute of
Development Studies Work, Brighton.
Béné C., Al-Hassan RM., Amarasinghe O., Fong P., Ocran J., Onumah E., Ratuniata R., Van Tuyen T.,
McGregor JA and DJ. Mills (2016) Is resilience socially constructed? Empirical evidence from Fiji,
Ghana, Sri Lanka, and Vietnam. Global Environmental Change, 38, pp.153-170. DOI: https://doi.
org/10.1016/j.gloenvcha.2016.03.005
Clare A., Sagynbekova L., Singer G., Bene B. and A. Rahmanberdi (2018) Can subjective resilience
indicators predict future food security? Evidence from three communities in rural Kyrgyzstan. Centre
for Climate Change Economics and Policy Working Paper 342/Grantham Research Institute on
Climate Change and the Environment Working Paper 308. London: London School of Economics and
Political Science.
COSA. (2017). Simpler Resilience Measurement: Tools to Diagnose and Improve How Households Fare
in Difficult Circumstances from Conflict to Climate Change. The Committee on Sustainability
Assessment. Philadelphia, USA: Accessible at: https://thecosa.org/wp-content/uploads/2018/04/
COSA-FORDSimpler-Resilience-Measurement-Full-20180413.pdf
Chambers R. (2003) Participation and numbers. PLA Notes, 47. International Institute for Environment and
Development, London.
Chambers R. (2007) Who counts? The quiet revolution of participation and numbers. Working paper 296.
Institute of Development Studies, Brighton.
Claire A., Graber R., Jones L. and D. Conway (2017) Subjective measures of climate resilience: what is the
added value for policy and programming? Global Environmental Change, 46 pp17-22. DOI: https://
doi.org/10.1016/j.gloenvcha.2017.07.001
Coates L. (1999) Flood fatalities in Australia, 1788–1996. Australian Geographer, 30(3), 391–408. doi:
10.1080/00049189993657
Cornwall A. (2008) Unpacking ‘Participation’: models, meanings and practices. Community Development
Journal 43(3): 269-283. http://dx.doi.org/10.1093/cdj/bsn010.
Cornwall A. ed. (2011) The Participation Reader. London: Zed Books.
Final Report: July 2019 – September 202048
Cutter S.L. (2016) Resilience to What? Resilience for Whom? The Geographical Journal, 182: 110–113.
Cutter S.L. and C. Finch (2008) Temporal and Spatial Changes in Social Vulnerability to Natural Hazards.
PNAS 105 (7): 2301-2306. https://doi.org/10.1073/pnas.0710375105
Cutter S.L., Barnes L., Berry M., Burton C., Evans E., Tate E. and J. Webb (2008) A place-based model for
understanding community resilience to natural disasters. Global Environmental Change 18(4): 598–606.
Cutter S.L., C.G. Burton and C.T. Emrich (2010) Disaster resilience indicators for benchmarking baseline
conditions Journal of Homeland Security and Emergency Management, 7 (1): 10.2202/1547-7355.1732.
Gaillard JC, Cadag JRD, Hore K, Le Dé L, McSherry A (2016) A typology of participatory numbers. Dev Pract
26(8):998–1012
Gaillard J.C. and R. Jigyasu (2016) Measurement and Evidence: Whose Resilience for Whom? Resilience
Development Initiative 11: 1–15.
Gaillard J.C. and Mercer J. (2013) From knowledge to action Bridging gaps in disaster risk reduction. Progress
in human geography, 37(1):93-114.
Holling C.S. (1973) Resilience and stability of ecological systems. Annual Review of Ecology and Systematics
4: 1-23.
Horne J.F. and J.E Orr (1998) Assessing Behaviours that Create Resilient Organisations. Employment
Relations Today 24(4): 29–39.
Howlett, M., & Turnbull, C. (2009). Large animal emergency rescue training. Australia: AgriFood Skills Australia.
International Specialised Skills Institute.
Hudson J. and E. Hughes (2007) The role of marae and Māori communities in post disaster recovery: A Case
study, GNS Science report, 2007/15, GNS Science, Wellington, New Zealand
Jones L. (2019) A how-to guide for subjective evaluations of resilience. London: ODI
Jones L. and M. D’Errico (2019) Resilient, but from whose Perspective? Like-for-like Comparisons of Objective
and Subjective Measures of Resilience. Centre for Climate Change Economics and Policy Working
Paper 336/Grantham Research Institute on Climate Change and the Environment Working Paper 303.
London. 36 p.
Jones L. and T. Tanner (2017) ‘Subjective resilience’: using perceptions to measure household resilience to
climate extremes and disasters. Regional Environmental Change. 17. pp 229–243. DOI: https://doi.
org/10.1007/s10113-016-0995-2
Jones L. and E. Samman (2016) Measuring subjective household resilience: insights from Tanzania. Overseas
Development Institute (ODI). London: UK.
Jones, L. (2017). New methods in resilience measurement: Early insights from a mobile phone panel survey in
Myanmar using subjective tools. Overseas Development Institute. London: UK.
Kelman I. (2018) Islands of Vulnerability and Resilience: Manufactured Stereotypes?” Area, 1–8
WHAT MATTERS MOST TO PEOPLE IN AN EMERGENCY
49Te ara o Tawhaki > Community Resilience Indicators Project
Le Dé L., Gaillard J. C., Friesen W. and F.M. Smith (2015) Remittances in the face of disasters: A case study of
rural Samoa. Environment, Development and Sustainability, 17(3):653-672.
Levine S. (2014) Assessing resilience: why quantification misses the point. Working Paper, Humanitarian
Policy Group, Overseas Development Institute, London.
MacKinnon D. and D.K. Derickson (2013) From Resilience to Resourcefulness: A Critique of
Resilience Policy and Activism. Progress in Human Geography, 37(2): 253–270. http:// doi.
org/10.1177/0309132512454775
Manyena B. (2006) The concept of resilience revisited. Disasters, 30(4): 433-450.
Manyena B., G. O’Brien, P. O’Keefe and J. Rose (2011) Disaster resilience: a bounce back or bounce forward
ability? Local Environment, 16, 417–424, 2011.
Marshall N.A. (2010) Understanding social resilience to climate variability in primary enterprises and industries.
Global Environmental Change 20.1.: 36-43. DOI: https://doi.org/10.1016/j.gloenvcha.2009.10.003
Maxwell D., Constas M., Frankenberger T., Klaus, D. and M. Mock (2015) Qualitative Data and Subjective
Indicators for Resilience Measurement. Resilience Measurement Technical Working Group. Technical
Series No. 4. Rome: Food Security Information Network. Available at: http://www.fsincop.net/fileadmin/
user_upload/fsin/docs/resources/FSIN_TechnicalSeries_4.pdf
Mileti D. (1999) Disasters by Design: a Reassessment of Natural Hazards in the United States. Joseph Henry
Press, Washington.
Ministry of Civil Defence and Emergency Management (MCDEM) (2019) National Disaster Resilience Strategy
Rautaki ā-Motu Manawaroa Aituā. Department of the Prime Minister and Cabinet, Wellington.
Norris F.H., S.P. Stevens, B. Pfefferbaum, K.F. Wyche and R. L. Pfefferbaum (2008) Community Resilience
as a Metaphor, Theory, Set of Capacities, and Strategy for Disaster Readiness. American Journal of
Community Psychology, 41: 127-150.
Oliver-Smith A. (2009) Sea Level Rise and the Vulnerability of Coastal Peoples: Responding to the Local
Challenges of Global Climate Change in the 21st Century. In: InterSections No. 7, United Nations
University Institute for Environment and Human Security, Bonn.
Pelling M. (2003) The Vulnerabilities of Cities: Natural Disasters and Social Resilience. Earthscan, London.
Pelling M., K. O’Brien and D. Matyas (2015) Adaptation and Transformation. Climatic Change 133 (1): 113–27.
Resilience Organisations (2018) Weighting Indicators of Resilience: Expert Opinions on the New Zealand
Resilience Index. https://www.resorgs.org.nz/wp-content/uploads/2019/02/RNC_Weighting-Indicators-
of-Resilience.pdf
Schipper E.L.F. and L. Langston (2015) A comparative overview of resilience measurement frameworks:
analysing indicators and approaches. ODI Working Paper 422. Overseas Development Institute,
London.
Final Report: July 2019 – September 202050
Seara T., Clay P.M. and L. Colburn (2016) Perceived adaptive capacity and natural disasters: A fisheries case
study. Global Environmental Change,38, 49-57. DOI: https://doi.org/10.1016/j.gloenvcha.2016.01.006
Stevenson J., Kay E., Bowie C. and V. Ivory (2019) The resilience indicators bank and the New Zealand
resilience index. National Science Challenges. https://www.resorgs.org.nz/wp-content/uploads/2019/06/
Resilience_Indicators_Bank__NZRI_Jun2019.pdf
Tamasese K., Peteru C., Waldegrave C. and A. Bush (2005) Ole Taeao Afua, the new morning: a qualitative
investigation into Samoan perspectives on mental health and culturally appropriate services. Australian
and New Zealand Journal of Psychiatry, 39(4):300-309.
Tamasese T.K., Parsons T., Sullivan G. and c. Waldegrave (2010) A qualitative study into pacific perspectives
on cultural obligations and volunteering. Wellington: Pacific Section and The Family Centre Social
Policy Research Unit.
Thompson K. (2013) Save me, same my dog: Increasing natural disaster preparedness and survival by
addressing human-animal relationships. Australian Journal of Communication, 40: 123–136.
Thornton A., Kerslake M. T. and T. Binns (2010) Alienation and obligation: Religion and social change in
Samoa. Asia Pacific Viewpoint, 51(1), 1–16.
Torry W.I. (1979) Intelligence, resilience and change in complex social systems: famine administration in India.
Mass Emergencies, 2: 71-85.
Twigg J. (1999) The Age of Accountability? Future Community Involvement in Disaster Reduction. Australian
Journal of Emergency Management, 14(4): 51–8.
Twigg J. (2009) Characteristics of a Disaster-resilient Community: a Guidance Note. Version 2, Aon Benfield
UCL Hazard Research Centre, University College London, London.
UN-ISDR (United Nations, International Strategy for Disaster Reduction). Hyogo framework for action 2005–
2015: building the resilience of nations and communities to disasters. In: World conference on disaster
reduction, Kobe, Japan, January 2005.
UNISDR (United Nations International Strategy for Disaster Reduction). 2015. Sendai framework for disaster
risk reduction 2015–2030.
Webber M. (2008) Walking the Space between: Identity and Maori/Pākehā. Wellington: NZCER Press.
Weichselgartner J. and I. Kelman (2014) Geographies of Resilience: Challenges and Opportunities of a
Descriptive Concept. Progress in Human Geography, 1–19.
Wildavsky A. (1991) Searching for Safety. Transaction, New Brunswick, NJ.
WHAT MATTERS MOST TO PEOPLE IN AN EMERGENCY
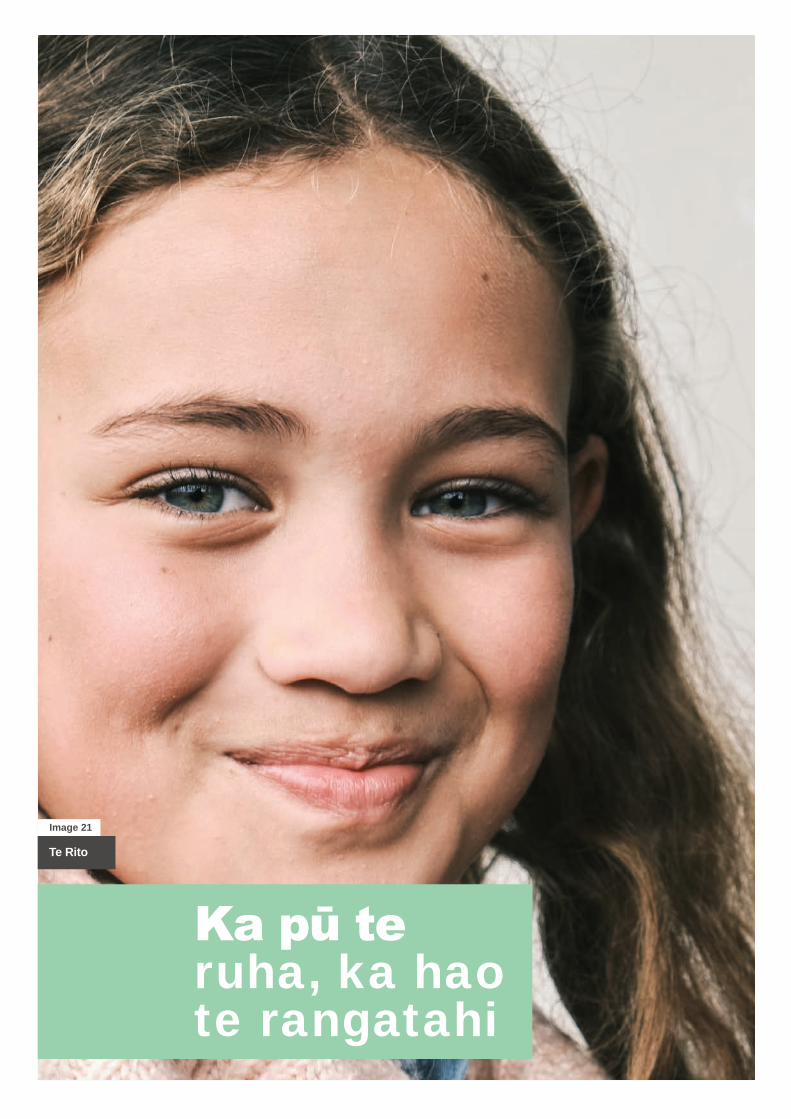
Kapūte ruha, ka hao te rangatahi
Te Rito
Image 21
WHAT MATTERS MOST TO PEOPLE IN AN EMERGENCYWHAT MATTERS MOST TO PEOPLE IN AN EMERGENCY