community reentry after prison drug treatmentsheridan correctional center national model drug prison...
TRANSCRIPT

COMMUNITY ReeNTRY AFTeR PRISON DRUG TReATMeNTLearning from Sheridan Therapeutic Community Program participants
Illinois Criminal Justice Information AuthorityWestCare Foundation
State of IllinoisPat Quinn, Governor


Community reentry after prison drug treatment Learning from Sheridan Therapeutic Community Program participants
January 2012
Prepared by Jessica Reichert, Senior Research Analyst
Illinois Criminal Justice Information Authority and
Dawn Ruzich, Manager, Research and Evaluation WestCare Foundation
With assistance from Rebecca Campbell, Research Analyst
Illinois Criminal Justice Information Authority This project was supported in part by Grant# 08-DJ-BX-0034 awarded to the Illinois Criminal Justice Information Authority by the Bureau of Justice Assistance, Office of Justice Programs, U.S. Department of Justice. Points of view or opinions contained within this document are those of the authors and do not necessarily represent the official position or policies of the Authority or the U.S. Department of Justice.
Suggested citation: Reichert, J. & Ruzich, D. (2012). Community reentry after prison drug treatment: Learning from Sheridan Therapeutic Community Program participants. Chicago, IL: Illinois Criminal Justice Information Authority.
Illinois Criminal Justice Information Authority 300 West Adams, Suite 200
Chicago, Illinois 60606 Phone: 312.793.8550 Fax: 312.793.8422
http://www.icjia.state.il.us

Acknowledgements The authors wish to thank the following individuals and agencies for providing assistance and guidance on this project:
Dona Howell, Division of Alcoholism and Substance Abuse Robert Jones, Illinois Department of Corrections Steven Karr, Illinois Department of Corrections
David Olson, Loyola University Chicago Kenneth Osborne, Illinois Department of Corrections
Sheila Perry, The Safer Foundation Janelle Prueter, Treatment Alternatives for Safe Communities Pam Rodriquez, Treatment Alternatives for Safe Communities
Jennifer Rozhon, Illinois Department of Corrections Amy Solomon, The Urban Institute
B. Diane Williams, The Safer Foundation
The authors would like to acknowledge the following Authority staff for their assistance:
Sharyn Adams
Lindsay Bostwick Lisa Braude Jack Cutrone
Cristin Monti Evans Jin Fong
Ernst Melchior Mark Myrent Lisa Stephens
Chris Devitt Westley
The authors would like to acknowledge the following WestCare Foundation staff for their assistance:
Leslie Balonick Stanley Brooks Amber Morsch
Table of contents Key findings ............................................................................................................ i Introduction ...........................................................................................................1 About Sheridan .....................................................................................................2 Literature review ....................................................................................................5 Methodology ..........................................................................................................7 Findings ............................................................................................................... 12 Sample demographics ...................................................................................... 12 Background prior to Sheridan ............................................................................ 13 Experiences at Sheridan ................................................................................... 16
Preparation for reentry ...................................................................................... 24 Experience in the community ............................................................................. 33 Relapse ................................................................................................................... 50 Recidivism ............................................................................................................... 55 Additional comments ........................................................................................ 64
Implications for policy and practice ..................................................................... 65
Conclusion .......................................................................................................... 68 References .......................................................................................................... 70 Appendices ......................................................................................................... 76

List of figures Figure 1. Percent of sample arrested by offense-type prior to Sheridan admission ............................................................................................................ 14 Figure 2. Percent of sample troubled by alcohol or drug use when first entering Sheridan .............................................................................................................. 15 Figure 3. Participant engagement in Sheridan .................................................... 17 Figure 4. Level of support from treatment staff .................................................... 20 Figure 5. Level of support from correctional staff ................................................ 21 Figure 6. Did Sheridan prepare you for success? ............................................... 22 Figure 7. Preparation by TASC service type ....................................................... 25 Figure 8. Safer Foundation service by type ......................................................... 26 Figure 9. Other community-based service participation by type .......................... 27 Figure 10. Following up on service referrals by parole ........................................ 31 Figure 11. Likelihood of getting caught if violating parole .................................... 32 Figure 12. Major life events after Sheridan before re-incarceration ..................... 34 Figure 13. Characteristics of neighborhood after release from Sheridan ............ 37 Figure 14. Housing upon release from Sheridan ................................................. 38 Figure 15. Characteristics of cohabitants after release from Sheridan ................ 39 Figure 16. Aftercare type attended ...................................................................... 40 Figure 17. How time was spent after release from Sheridan ............................... 43 Figure 18. Gang member status of sample ......................................................... 45 Figure 19. Employment after release from Sheridan ........................................... 45 Figure 20. Employment after Sheridan prior to re-incarceration .......................... 47 Figure 21. How money was spent after release from Sheridan ........................... 48

Figure 22. Medical status of sample. ................................................................... 49 Figure 23. Percent of sample who relapsed after Sheridan ................................. 50 Figure 24. Average time in months to relapse after Sheridan ............................. 51 Figure 25. Average time in days to relapse after Sheridan by age group, gang Involvement, and aftercare .................................................................................. 52 Figure 26. Percent of sample that relapsed by substance................................... 54 Figure 27. Difficulty in avoiding crimes after Sheridan......................................... 56 Figure 28. Factors contributing to criminal activity after Sheridan ....................... 57 Figure 29. Average time in days to first crime after Sheridan by age group and employment. ........................................................................................................ 58 Figure 30. Arrest charges of sample by offense type after Sheridan, before re-incarceration ................................................................................................... 61 Figure 31. Percent of sample by recidivism type after Sheridan ......................... 63 Figure 32. Average time in days to recidivism after Sheridan ............................. 64

List of tables Table 1. Sample by prison at time of interview ......................................................9 Table 2. Description of sample ............................................................................ 12 Table 3. Number of study participants by year of admission to Sheridan ............ 16 Table 4. Skills learned at Sheridan ...................................................................... 18 Table 5. Abilities learned at Sheridan for use upon release ................................ 18 Table 6. Cities lived after release from Sheridan ................................................. 35 Table 7. Re-incarceration offenses of sample ..................................................... 62

i
Key findings The Sheridan Correctional Center National Model Drug Prison and Reentry Program is a drug treatment program providing in-prison substance abuse treatment as well as substance abuse treatment upon release. Prior research has shown reductions in recidivism among Sheridan participants compared to other prisoners. This study examined a group of 50 re-incarcerated men who successfully completed the in-prison phase of the Sheridan program and what led to their re-incarceration. Among this sample, positive findings about the Sheridan program and its participants include:
• Sixty-two percent stated they were Very engaged in the Sheridan program.
• Slightly more than half (60 percent) felt Sheridan prepared them for success after release.
• Over three-fourths (76 percent) indicated they had a job at some point after graduating Sheridan and before their re-incarceration.
• A majority (84 percent) reported having little difficulty in finding housing.
• Most (86 percent) said Sheridan helped them more than a traditional prison.
Other notable findings include:
• On average, Sheridan graduates in this study spent 738 days (about two years) in the community before returning to IDOC. The range was 40 to 2,096 days (over five-and-a-half years).
• A majority of the men in our sample (90 percent) relapsed into drug or alcohol use after
their release from Sheridan.
• Slightly more than half (56 percent) of the sample reported they had illegal sources of income.
• Sixty-eight 68 percent stated drug dealing was common in the neighborhood they lived in
after release. This study found many factors associated with length of time to relapse to drug or alcohol use and recidivism (self-reported criminal activity or re-incarceration) including:
• Younger participants engaged in criminal activity and relapsed sooner than older participants. Younger participants also reported being less engaged in the Sheridan program than older participants.

ii
• After prison, those who returned to their original neighborhood relapsed sooner than those who did not return to their original neighborhood.
• Unemployed participants engaged in criminal activity sooner than employed participants.
• Those living in neighborhoods that were perceived as unsafe and/or where drug dealing was common relapsed sooner than those living in safer, lower-risk neighborhoods.
• Those who reported spending time with persons who engage in risky activities—
substance use and/or criminal activity—relapsed sooner than those who did not spend time with persons engaging in risky activities.
• Those with gang involvement engaged in criminal activity and relapsed sooner.
• Those who did not complete aftercare engaged in criminal activity and relapsed sooner
than those who did complete aftercare.

1
Introduction Most incarcerated offenders end up returning to society—in Illinois, over 35,000 adults are released from prison each year (Pew Center on the States, 2011). Therefore, reentry or the process of formerly incarcerated individuals returning back to local communities is a real concern, especially when just more than half of those offenders released from prison end up back in prison within three years (Pew Center on the States, 2011). Ex-offenders returning home from prison face challenges such as gaining employment and finding housing. Those with substance abuse problems have the additional challenge of trying to stay clean and sober. Often they relapse, putting them at greater risk for re-incarceration. Research has found that providing returning offenders with the services and resources they need reduces their chances of re-incarceration. Benefits of services after reentry include reduced incarceration costs, welfare payments, and medical costs, as well as increased tax revenue (Cohen, 2001), increased public safety, and less victimization to the community (Fretz, Helivbrun, & Brown, 2005). The reentry of drug offenders is of particular concern for Illinois as the state has a considerable number of drug arrests and incarcerations. Each year, more than 95,000 arrests for drug-law violations are reported in Illinois (Illinois State Police, 2010). More than 15,000 adults convicted of drug-law violations are sentenced to prison each year, comprising 40 percent of all prison sentences (Jones, Karr, Olson, & Urbas, 2005). In addition, many offenders are in prison for engaging in crimes to support a drug habit or committing crimes while under the influence of drugs or alcohol. Sheridan Correctional Center National Model Drug Prison and Reentry Program (Sheridan) was created as one potential solution to Illinois’ prison reentry concerns, high incarceration rates, and high recidivism among drug-related offenders (Olson, Juergens, & Karr, 2004). It was designed by a group of national and local criminal justice and social service policy makers, practitioners, and researchers based on best practices in the field. Sheridan houses and serves only inmates in need of substance abuse treatment and provides ongoing treatment during their prison stay. Research indicates that Sheridan has been successful, as evidenced by lower re-incarceration rates among Sheridan graduates than other similar offenders (Olson & Rozhon, 2011). The current study builds on prior research by providing qualitative data from in-depth interviews with former program participants who returned to prison. Re-incarcerated Sheridan participants shared personal information and insights, as well as their opinions of the multiple components of the Sheridan program, aftercare, and mandatory supervised release (MSR). When possible, the authors provided quotes to illustrate specific information in the program participants’ own words. The wealth of information gained from the interviews is shared in this report, as well as recommendations to improve the program.
2
About Sheridan Sheridan Correctional Center (SCC), a medium security prison, is one of 27 correctional centers operated by the Illinois Department of Corrections (IDOC). SCC closed in 2002 and re-opened as a drug treatment prison in January 2004. Similar to Sheridan, Southwestern Illinois Correctional Center also serves only inmates in need of substance abuse treatment but is smaller, has a lower security level, and has a special methamphetamine treatment unit. Appendix A provides a map depicting the locations of Illinois’ correctional centers throughout the state. Sheridan Correctional Center National Model Drug Prison and Reentry Program (Sheridan) is a fully-dedicated modified therapeutic community. Every inmate at Sheridan participates in substance abuse treatment programming. It is considered “modified” due to enhanced rules and security for the prison setting. Therapeutic communities utilize a hierarchical model in which there are increasing levels of responsibility and stages of treatment and a reliance on peers to help learn and assimilate to social norms (National Institute on Drug Abuse, 2002). Along with substance abuse treatment, Sheridan inmates are required to participate in vocational and/or educational training, employment readiness programming, and reentry case management. Furthermore, inmates agree to attend up to 90 days of community substance abuse treatment (or aftercare) as a condition of their parole. IDOC’s Reception and Classification Centers screen all inmates to identify those who are eligible for Sheridan. Inmates eligible to participate in this program include males who:
• Voluntarily choose to participate. • Are in need of substance abuse treatment. • Have at least 9 to 36 months left to serve in prison. • Are eligible for placement in a medium security prison. • Have no current or prior murder or sex offense convictions. • Do not suffer from severe mental illness that would interfere with their participation.
Sheridan participants can be removed from treatment if they refuse to participate in any aspect of the program or for disciplinary infractions. Non-disciplinary program removals may occur due to mental or medical health issues, not meeting eligibility requirements, or having known correctional or treatment staff prior to entering Sheridan. Since program inception through 2010, 16 percent of all Sheridan participants were removed for disciplinary reasons and 5 percent for non-disciplinary reasons (Olson & Rozhon, 2011). Until August 2009, Sheridan housed up to 950 inmates daily. However, in 2010, a number of changes to the Sheridan program were made to accommodate the growth in Illinois’ prison population. Sheridan now serves approximately 1,650 offenders daily, the maximum length of stay was increased from 24 to 36 months, and a pre-treatment and re-entry unit were added to the program. Those who complete the in-prison phase of Sheridan can receive Earned Good Conduct Credit (EGCC) for participation in substance abuse, vocational, or educational programming. These credits can reduce the time served in prison. Many Sheridan inmates are awarded EGCC for their

3
participation in the treatment program.1
From state fiscal years 2005 through 2010, more than 264,480 days of EGCC were earned by Sheridan participants, resulting in $16.7 million in reduced incarceration costs (Olson and Rozhon, 2011).
Upon release, every Sheridan graduate (participants who successfully complete the in-prison portion of the program) is supervised on Mandatory Supervised Release (parole) and referred to IDOC-funded aftercare services. Graduates must also participate in community-based case management. A case management agency, Treatment Alternatives for Safe Communities (TASC), links releasees to planned services, monitors their progress, and responds to additional needs that emerge. Parole agents attend to program compliance and community safety issues. All Sheridan graduates are required to participate in IDOC-funded aftercare services, typically lasting 90 days, as a condition of parole. Aftercare placements include halfway houses, recovery homes, transitional homes, and home with either an intensive outpatient or outpatient treatment recommendation. The only exception to this is for Sheridan participants who are referred to an Adult Transition Center (ATC) for work release upon completion of the in-prison Sheridan program. Just 4 percent of Sheridan clients have been discharged to an ATC since program inception (Olson & Rozhon, 2011). Sheridan graduates may also access employment assistance services (The Safer Foundation) and help from community organizations known as Community Support Advisory Councils (CSAC) that support parolees released to areas of high return. CSAC assists the parolee in connecting with community institutions and members who can assist them in building positive social networks. In addition to IDOC, key stakeholders in the Sheridan Correctional Center program include (Illinois Department of Corrections, 2006):
• WestCare Foundation. WestCare is the substance abuse treatment provider at Sheridan Correctional Center. WestCare is licensed to provide substance abuse treatment services by the Illinois Division of Alcoholism & Substance Abuse. (Gateway Foundation was the original substance abuse treatment provider at Sheridan. WestCare began providing services in November 2006.)
• Treatment Alternatives for Safe Communities (TASC). TASC secures post-release placements for offenders and provides case management in the community while the offender is on parole.
• The Safer Foundation. The Safer Foundation provides job preparedness training and vocational services to inmates while they are at Sheridan and employment placement assistance upon release.
• Illinois Valley Community College (IVCC). IVCC offers basic career planning and vocational training.
• Home Builders Institute. This institute teaches building trades to clients enrolled in their program.
1 The Illinois Department of Corrections suspended certain types of good time credit in January 2010. However, eligible offenders may still receive Earned Good Conduct Credit for participation in substance abuse programming, educational, or vocational programming.

4
• Illinois Manufacturing Foundation, Inc. This foundation teaches manufacturing trades to qualified clients and makes employment referrals to employers in their field of training upon discharge to the community.
• Community Support Advisory Council (CSAC). CSAC connects parolees to supportive services such as food, clothing, and housing.
Prior research on Sheridan Since 2004, researchers from Loyola University Chicago, IDOC, and the Authority have conducted ongoing process and impact evaluations of Sheridan Correctional Center. Olson, Juergens, & Karr (2004) examined the implementation of the Sheridan program. The authors found that Sheridan was servicing its intended population—inmates with substantial substance abuse and criminal histories. Furthermore, the program was successful in implementing several therapeutic community program components. Olson, Rapp, Powers, & Karr (2006) found that two years after the program’s inception, Sheridan was continuing to serve its targeted population. The authors also found in relation to a matched comparison group, Sheridan releasees had an overall 21 percent lower risk of re-arrest for a new offense (33 percent lower risk if the participant was at Sheridan for at least nine months), a 44 percent lower risk of re-incarceration; and were more successful in obtaining and keeping a job. Olson, Rozhon, & Powers (2009) found the Sheridan program had improved its rate of aftercare admissions and completion. This was achieved through coordination of pre-release planning, development of community-based partnerships, and a transformation of the parole model. These changes allowed the program to overcome many of the barriers to effective offender re-entry. Olson and Rozhon (2011) revealed several program outcomes. First, the authors concluded Sheridan participants improved their levels of psychological and social functioning and reduced criminal thinking patterns. Second, the authors calculated that 32 percent of Sheridan graduates completed at least one vocational certificate program. Third, the authors found an increased rate of aftercare treatment admissions and completions. And finally, the authors found Sheridan graduates have a 16 percent overall lower likelihood of being re-incarcerated than a statistically similar comparison group, and that the likelihood of re-incarceration for those Sheridan graduates who complete aftercare is 44 percent lower than the comparison group. Sheridan graduates that did not complete aftercare had a higher likelihood (30 percent) of a return to prison. This research study is intended to supplement previous research that has focused on recidivism outcomes of Sheridan graduates. This study gathered data from re-incarcerated graduates of the Sheridan program to better understand what contributed to their re-incarceration.

5
Literature review More than 1.5 million people are incarcerated in prisons throughout the country (Sabol, West, & Cooper, 2009), and almost two-thirds are substance abusers (National Center on Addiction and Substance Abuse, 2010). Substance use and criminal activity are often related. Drug use itself is illegal, crimes are committed to obtain money to buy drugs and feed addiction, and crimes are committed due to impairment caused by drug and alcohol use. Research has found that substance abusing prisoners have more extensive criminal histories than non-substance abusing prisoners (Mumola & Karberg, 2006). In addition, substance-abusing parolees have higher recidivism rates than parolees who are non-substance abusers (Belenko, 2006). The cost to taxpayers for dealing with drug-using criminal offenders is significant. In 2005, federal, state, and local criminal justice systems spent $74 billion on substance-involved offenders (National Center on Addiction and Substance Abuse, 2010). Drug treatment in prisons Sixty-one percent of state prisons offer substance abuse treatment to its prisoners (Mears, Winterfield, Hunsaker, Moore, & White, 2003). In-prison treatment, however, is hardly to scale. The National Center on Addiction and Substance Abuse (2010) reported that just 11 percent of inmates in need of substance abuse treatment receive any such treatment during their incarceration. In Illinois, approximately 27,000 adult and juvenile inmates are in need of substance abuse treatment while only 3,100 beds are available (LaVigne, Mamalian, Travis, & Visher, 2003). Research has shown drug treatment in prisons and after release helps prisoners stay clean, out of prison, and employed (American Psychological Association, 2004). If a therapeutic community treatment model is used, there are increased reductions in recidivism (Mitchell, Wilson, & Mackenzie, 2005). In addition, drug treatment is cost effective—each dollar spent on treatment saves between $4 and $7 in reduced drug-related crime and subsequent costs to the criminal justice system (Mears et. al., 2003). Therapeutic communities Therapeutic communities (TCs) are the most intensive drug treatment programs operating in prisons. TCs are considered “modified” when used in prison due to the need for enhanced rules and security. TCs are residential treatment programs that use the community—treatment staff and those in recovery—as a part of the treatment approach (National Institute on Drug Abuse, 2002). Participants have a role in operations of the TC by leading treatment sessions, monitoring residents for rule compliance, and resolving disputes. According to Mitchell et al.,
TCs have a confrontational nature in which both staff and participants openly challenge anti-social behaviors and attitudes. Participants also are supportive of each others’ struggles to make pro-social reformations. Many TCs share a philosophy that sees drug abuse as

6
symptomatic of a broader personality disorder, and, consequently, many TCs focus on the larger disorder and not just drug abuse, per se (2007, p.355).
A meta-analysis of drug abuse treatment in prisons found support for the effectiveness of TCs in reducing recidivism (Pearson & Lipton, 1999). Another meta-analysis of treatment programs found in-prison TCs were effective in reducing recidivism and post-release drug use (Mitchell, Wilson, & MacKenzie, 2007). In an analysis of six in- prison TCs with community aftercare components, Aos, Miller, & Drake (2006) found a statistically significant 6.9 percent reduction in recidivism rates for these types of programs when compared to treatment-as-usual group. Additional research has found substance abuse treatment does work to reduce alcohol and drug use, as well as crime (Gerstein, Datta, Ingels, Johnson, Rasinski, Schildhouse, & Talley, 1997). Reentry and substance abuse More than 800,000 prisoners are released back into communities annually in the United States (Glaze & Bonczar, 2009), and in Illinois, over 35,000 adults are paroled each year (Pew Center on the States, 2011). The recidivism rate is high for Illinois’ ex-prisoners—about half (52 percent) return to a state prison within three years (Pew Center on the States, 2011). Those with substance abuse histories have even higher rates of recidivism (Belenko, 2006). One study found about 95 percent of drug-involved parolees return to drug use (Martin, Butzin, Saum, & Inciardi, 1999), 68 percent are rearrested, and 25 percent are re-sentenced to prison for a new crime (Langan & Levin, 2002). The Urban Institute completed a multi-state study of prisoner reentry to original communities. They found ex-prisoners have significant challenges when returning to the community. Many use drugs or alcohol, commit parole violations or new crimes, and live with a person with an alcohol or drug problem (Brooks, Solomon, Kohl, Osborne, Reid, McDonald, & Hoover, 2008). After completing prison substance abuse treatment, continuing treatment after release back to the community, commonly known as aftercare, is crucial to limit re-offending and relapse. A significant body of research has shown that aftercare is important in reducing recidivism for those who have completed a prison TC (Chanhatasilpa, MacKenzie, & Hickman, 2000; De Leon, Melnick, Thomas, Kressel, & Wexler, 2000; Incardi, Martin, & Butzin, 2004; Knight, Simpson, & Hiller, 1999; Olson, Rozhon, & Powers, 2009; Wexler, De Leon, Thomas, Kressel, & Peters, 1999). It is apparent that lasting change requires continued work after release from prison. Additionally, treatment of prisoners with substance abuse problems is more cost effective when aftercare is completed (Griffith, Hiller, Knight, & Simpson, 1999). Unfortunately, many prisoners who complete in-prison treatment do not attend aftercare or leave early. This may be due in part to limited treatment availability for ex-prisoners, as well as the removal of institutional control over them (Farabee, Prendergast, Cartier, Wexler, Knight, & Anglin, 1999).

7
Methodology Researchers interviewed 50 inmates who successfully completed the in-prison phase of the Sheridan Correctional Center Therapeutic Community but were re-incarcerated following their release from Sheridan. Interviews were completed with inmates housed in the general population at Illinois Department of Corrections (IDOC) facilities. The sample is not necessarily representative of all Sheridan graduates, all Sheridan recidivists, or men returning to the Illinois Department of Corrections. The following are the research questions that guided this study. • What were re-incarcerated Sheridan participants’ experiences at Sheridan and after leaving
Sheridan? • What factors were associated with length of time to relapse to drugs and alcohol? • What factors were associated with recidivism after Sheridan?
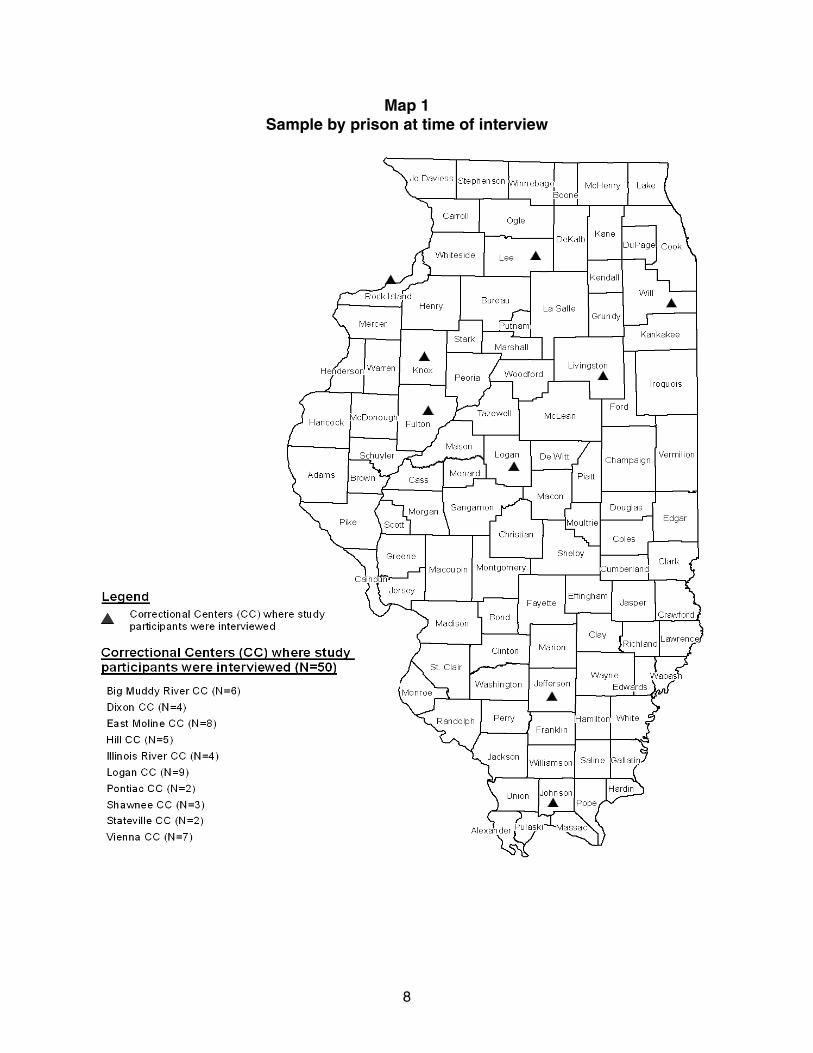
Researchers held structured, private, one-on-one interviews lasting 30 to 60 minutes in the participants’ correctional facility. All interviews were voluntary and written consent was received from all participants. Interviews took place from October 2010 to January 2011. Sample size IDOC provided researchers with a file of unique IDOC numbers of 385 incarcerated Sheridan recidivists by parent institution as of August 31, 2010. From this file, the researchers pulled a random, stratified sample of 200 potential interviewees. The sample was stratified by inmate’s age, home city, and time spent on parole after being released from Sheridan. Interviews took place at the inmate’s current parent institution at varied locations across the state. Due to staff time constraints and the cost-prohibitive nature of travel, researchers could not conduct interviews in all facilities. In addition, a high chance of attrition was present due to release, as well as some refusals to be interviewed. A sample of 200 was selected to achieve the end goal of 50 interviews. The final sample size was 50, or 13 percent of the original sample. Researchers attempted to interview an additional 24 inmates, but were unable to complete interviews. Participation was voluntary and 14 declined to be interviewed. Ten inmates were unable to be interviewed as they were either in segregation, transferred to another facility, or released before the interview could take place. All inmates in the study spoke English. The interviews took place at 10 Illinois prisons. Map 1 depicts where the correctional centers are located. Table 1 indicates the correctional centers in which the participants were housed. Note that inmates are not allowed to return to Sheridan once they have initially completed the program.
8
Map 1 Sample by prison at time of interview

9
Table 1 Sample by prison at time of interview
Illinois Correctional Center N
Logan 9 Moline 8 Vienna 7 Big Muddy 6 Hill 5 Illinois River 4 Dixon 4 Shawnee 3 Pontiac 2 Stateville 2 TOTAL 50
Interviews Interviewers Four trained interviewers worked on the project, including three Authority researchers and one evaluator on staff at the WestCare Foundation. All interviewers completed a three-hour training course on interviewing techniques and the survey questions. All were trained in research on human subjects and Institutional Review Board requirements. Interview questions The survey instrument was designed to obtain a wealth of information about the research subjects. Most questions for the interview were taken from the Massachusetts Prisoner Recidivism Study conducted by the Urban Institute (Kohl, Hoover, McDonald, & Solomon, 2008). Permission to use those questions was granted from the original authors. Substance abuse questions are similar in format to other validated drug screening instruments, such as the Addiction Severity Index. The interview schedule is available upon request. The interview asked 170 questions in 15 areas, including: • Demographics (9 questions). • Housing (8 questions). • Neighborhood (6 questions). • Family relations (10 questions). • Peers (9 questions). • Non-work activities (21 questions). • Employment/finances (20 questions). • Health (12 questions). • Criminal activity after release, before incarceration (7 questions). • Community programs and services (10 questions).

10
• Treatment Alternatives for Safe Communities (TASC) (5 questions). • The Safer Foundation (8 questions). • Sheridan (21 questions). • Parole supervision (18 questions). • Miscellaneous (6 questions).
Additional data sources In addition to information collected through interviews, administrative data were also used for this study. WestCare Foundation clinical case files were used, which included a clinical intake assessment, discharge summary, and continuing care plan. Administrative data obtained from the participant’s treatment file was gathered either through a Sheridan clinical intake assessment or from the participant’s prison discharge summary and continuing care plan. As previously mentioned, the original substance abuse treatment provider was Gateway Foundation. Gateway provided services at Sheridan from January 2004 through October 2006. WestCare became the treatment provider in November 2006. Thirteen interviewees were at Sheridan when Gateway was the provider. Therefore, some participant treatment information is inconsistent with the treatment information that WestCare maintains. The Authority’s Criminal History Record Information (CHRI) Ad Hoc datasets provided the criminal history records of those interviewed. These datasets were derived from records in the Illinois State Police’s Computerized Criminal History (CCH) system, the state’s central repository for criminal history record information. Using the men’s names and dates of birth, it was possible to retrieve the history of arrests in an electronic format for all the men in the study. IDOC’s Offender Tracking System (OTS) was utilized for sentencing information. OTS tracks custody of all IDOC adult inmates from admission through parole discharge. Consent process Informed consent forms outlining the goals of the study, risks, and interview procedures were signed by each participant. The consent form also provided contact information of the principal investigators of the study, the Authority’s general counsel, and staff at IDOC’s Research and Planning Unit. The Authority’s Institutional Review Board approved the research study after consideration of potential risk to human subjects. Limitations In survey research, there is a limitation when participants to not report some activity due to stigma, inability to recall incidents over their life, and fear of disclosure. Another limitation is that the data on the activities and associates of the offender upon release may be able to show an association, but not causation of re-incarceration. Again, this study only interviewed re-incarcerated participants of Sheridan. Furthermore, individuals may experience many additional risk factors for criminality and incarceration.

11
There are also limitations with using criminal history record information. The state’s Computerized Criminal History (CCH) System is driven by the submission and identification of an individual’s fingerprints. Once a match to previously submitted prints is established by the computer, the associated demographic information and criminal justice events are retrieved and collated into a criminal history transcript (rap sheet). However, the Authority’s access to this information (referred to as the Ad Hoc connection) is limited to an off-line copy of the live database, which is accessed through a match on name and date of birth, instead of the more positive biometric identifiers. Successful identification of a criminal history record through the Ad Hoc connection is dependent on the same name and date of birth being furnished by the individuals that has already been recorded in the state system. There are occasions when individuals are not fingerprinted during the course of arrest (such as if they were hospitalized due to injuries from the event). In that event, there may not be an official state criminal history record or only an incomplete record. Finally, other records may be missing due to data errors that interfered with processing. A final limitation is that the interview questions were not piloted and there are no metrics on the construct validity of the research instrument. However, most of the questions were used previously by the Urban Institute, so the survey has face and content validity. Statistical analysis There is a need to examine the influence age, treatment participation, and post-release employment have on recidivism among those who have attended prison-based therapeutic communities (Welch, 2007). This study examined factors cited to have influence on the length of time to relapse and recidivism for participants of a prison-based therapeutic community. Since all participants in the study were re-incarcerated, this study examined factors associated with lengths of time to “failure.” Failure was defined as re-arrest, self-reported criminal activity, re-incarceration, or relapse. Researchers used nonparametric analyses of bivariate relationships in this study to identify correlations between variables and to test differences within and between variable groups.

12
Findings Sample demographics Table 2 provides an overview of the demographics of the participants in the study sample. All were male participants at Sheridan and all were interviewed while re-incarcerated for the first time after completing the Sheridan program. Because this was an exploratory research project, there was no expectation that the sample would be representative of Sheridan program participants in general, or mirror the demographics of all those who recidivated after release from Sheridan in a given time period.
Table 2 Description of sample
n Mean Average age (in years, at time of interview) 50 36 Age range (at time of interview) Percent 20-29 11 22% 30-39 19 38% 40-49 12 24% 50+ 8 16% U.S. born Yes 48 96% No 2 4% Race White 11 22% Black 37 74% Asian 0 0% American Indian or Alaska Native 1 2% Other 1 2% Ethnicity Latino/ Hispanic 4 8% Non-Latino/ Hispanic 46 92% Education (highest grade or year in school) Elementary (1-8) 0 0% Some high school (9-12) 16 32% High school graduate 2 4% GED degree 13 26% Some college or some vocational school 12 24% Diploma or certificate trade school, community college
6 12%
Four-year college degree 1 2% Some graduate school 0 0% Graduate or professional degree 0 0%

13
The range of ages of study participants was 20 to 56 years old and the average age was 36 years old. Almost all of the research participants (96 percent) were born in the United States. Of them, 85 percent were born in Illinois and 15 percent were born in other states. Two participants were born in other countries—Ecuador and Germany. A majority (74 percent) of the sample was black, 22 percent were white, and 2 percent were American Indian or Alaska Native. One person stated that his race was “other” which he identified as Mexican. Ninety-two percent said their ethnicity was non-Hispanic and 8 percent said their ethnicity was Hispanic. Thirty-two percent of the study participants had an education of less than a high school degree. Thirty percent had a high school degree or GED and 38 percent had an education beyond high school. Background prior to Sheridan Criminal history According to the Authority’s Criminal History Record Information (CHRI) Ad Hoc datasets, the sample averaged 15.76 arrests (SD= 9.01), ranging from 2 to 44, prior to Sheridan admission. Of these arrests, 54 percent were felony–related offenses and 45 percent were misdemeanor-related offenses. Furthermore, 44 percent of the sample had property-related crimes as the most serious arrest charge. Figure 1 illustrates the percent of the sample arrested by most serious offense-type charge prior to admission to Sheridan. The offense type categories were derived from CHRI datasets by the use of an internal hierarchy. Person offenses include all non-sexual offenses against a person. Individuals with a conviction of a murder or sex offense are ineligible for participation in Sheridan.

14
Figure 1Percent of sample arrested by offense-type prior to
Sheridan admission
44%25%
15%
13%
3%
Drug
Person
Other
Weapon
Property
According to IDOC data, all of the study participants were convicted of felonies, rather than misdemeanors, when sentenced to Sheridan. Some (44 percent) were charged with a Class 2 felony, 24 percent with Class 3, 18 percent with Class 1, 12 percent with Class 4, and 2 percent with a Class X felony. Sentencing guidelines require longer periods of imprisonment for conviction of certain types of felonies ranging from six to 30 years for a Class X felony to one to three years for a Class 4 felony. When sentenced to Sheridan, 38 percent of the study participants were convicted of property crimes such as burglary and retail theft; 28 percent with drug crimes such as the manufacturing and delivery of narcotics; and 20 percent with crimes against a person such as robbery and aggravated battery. Eight percent were charged with a weapon offense, unlawful use of a weapon by a felon, and 6 percent had other offenses such as driving under the influence, forgery, and violating electronic monitoring. Study participants were asked to share the number of juvenile and adult incarcerations experienced throughout their lifetime. Less than half (42 percent) of the prisoners reported having been incarcerated as a juvenile and reported an average of one prior juvenile incarceration. All had been incarcerated as an adult with an average of five prior adult incarcerations, including Sheridan and their current incarceration. A majority (86 percent) of the sample had adult incarcerations prior to Sheridan and an average of three prior incarcerations. History of substance abuse The majority of our sample reported first trying alcohol or drugs during their adolescent or teenage years. The average age of reported first use was 13 years old and ages ranged from 1 year old to 28 years old.
Source: ICJIA analysis of CHRI data

15
When entering Sheridan, participants are evaluated and given a substance abuse or dependence diagnostic impression if they met the appropriate DSM-IV-TR (Diagnostic and Statistical Manual for Mental Disorders, text revision) criteria. Nearly one-third (29 percent) of participants had a cocaine dependence diagnosis, 25 percent had an opioid dependence diagnosis, 25 percent had a cannabis dependence diagnosis, 20 percent had an alcohol dependence diagnosis, and 2 percent were diagnosed with amphetamine dependence. See Appendix B for a breakdown of recidivism and relapse into drug or alcohol use by DSM-IV-TR diagnosis. When entering Sheridan, participants were asked how troubled they were about their alcohol and drug use. Response categories included Not at all, Slightly, Moderately, Considerably, and Extremely. Of the participants in our sample, 25 said that they were not at all troubled by their alcohol use while nine were extremely troubled by their alcohol use. Ten respondents stated that they were not at all troubled by their drug use while 22 respondents stated that they were extremely troubled by it. Figure 2 describes how troubled study participants were about their substance use upon entering Sheridan.
Figure 2Percent of sample troubled by alcohol or drug use
when first entering Sheridan
0%
10%
20%
30%
40%
50%
60%
70%
80%
90%
100%
Extremely Considerably Moderately Slightly Not at all
Level of concern
Perc
ent o
f sam
ple
Alcohol Drug
Thirty-two study participants had been through drug or alcohol treatment prior to entering Sheridan (including 15 respondents who participated in both drug and alcohol treatment programs). More than half of the sample (59 percent) had previously been to treatment for drug use and 37 percent of respondents had received substance abuse treatment for alcohol. The number of prior treatment episodes for both drug and alcohol treatment episodes ranged from one to four.

16
Experiences at Sheridan Admission to Sheridan Participants included in this study were admitted to Sheridan during the years 2004 to 2008. As previously noted, the Sheridan program was started in 2004 and the experiences of the first cohorts may reflect some program implementation issues. Table 3 indicates the number of study participants by year of admission to Sheridan.
Table 3 Number of study participants
by year of admission to Sheridan
Year n 2004 9 2005 9 2006 9 2007 15 2008 8
Length of stay at Sheridan According to IDOC, the average length of stay at Sheridan for the men participating in this study was 14.4 months with a minimum of six months and a maximum of 34.4 months. When the Sheridan program first opened in 2004, the minimum sentence length for program admission was six months. However, when research showed that men who participated in the program for less than nine months did not demonstrate any reductions in recidivism rates (Olson, Rozhon, & Powers, 2009), the admission criteria was increased to a minimum length of stay of nine months. On average, Sheridan graduates spent 738 days (about two years) in the community before returning to IDOC. The median or middle number of days was 593 days and the range was 40 to 2,096 days (over five-and-a-half years). Engagement in Sheridan The Sheridan participants interviewed for this study were asked to rate their engagement or participation in the Sheridan program, including counseling groups, education, and vocational training. A majority of the sample reported being engaged in the program (62 percent were very engaged in the program and 24 percent were somewhat engaged). Figure 3 indicates participant engagement in Sheridan.

17
Figure 3Participant engagement in Sheridan
Very engaged, 62%
Somewhat unengaged,
8%
Somewhat engaged, 24%
Very Unengaged,
4%
Unknown, 2%
Statistical analysis with regards to self- rated treatment engagement revealed two important findings. One, engagement levels were higher among older inmates and two, greater treatment engagement was correlated with recovery support group attendance. A significant positive correlation was found between prisoner engagement level at Sheridan and age at the time of Sheridan release (rs
=.324, n= 50, p= .022, two-tailed). Older prisoners reported being engaged in the treatment program at Sheridan more often (average of 35.72 years old; SD= 9.95) than younger prisoners (average of 26.43 years old; SD= 5.77). An independent t-test revealed the average age difference of 9.29 years between the condition of Sheridan engagement was significant (t=2.393, df= 48, p=.021, two-tailed). This finding is consistent with a study which found older adults adhere to treatment recommendations more often than younger ones (Oslin, 2002).
A significant positive correlation existed between Sheridan engagement and recovery support group participation (such as Alcoholics Anonymous) within the 30 days prior to IDOC re-incarceration (r2
= .340, n= 46, p< .021, two-tailed). It is likely that those who were engaged during the in-prison phase of treatment continued to participate in recovery support groups upon release. Conversely, all of the prisoners that reported not being engaged in the treatment program at Sheridan (n= 6) did not attend any recovery group meeting during the 30 days prior to IDOC re-incarceration.
Skills and abilities learned at Sheridan Certain skills have been shown to help in relapse and recidivism prevention. Sheridan graduates interviewed for this study were provided a list of skills and asked if they learned any of them while at Sheridan. A majority (86 percent) learned thinking skills and résumé writing (84 percent). Most (80 percent) said they learned better ways to spend leisure time, responsibility, problem solving, and communication. Table 4 indicates the skills learned while participating in the Sheridan program.

18
Table 4 Skills learned at Sheridan
Skill n Percent Thinking skills 43 86% Résumé writing 43 84% Responsibility 42 84% Better ways to spend leisure time 42 84% Problem solving 40 80% Communication 40 80% Decision making 39 78% Goal setting 38 76% Coping skills 37 74% Discipline 37 74% Relapse prevention 37 74% Life skills 37 74% Interviewing 35 70% Parenting 28 56% Compassion 27 54% Anger management 25 50%
Survey participants were also asked to list the abilities learned at Sheridan for use when released from prison. A majority (88 percent) said that Sheridan prepared them to continue their substance abuse treatment. Just over three-fourths of those interviewed (76 percent) said Sheridan prepared them to continue their education, obtain photo identification, and work on personal relationships (Table 5).
Table 5 Abilities learned at Sheridan for use upon release
Abilities n Percent Continue your substance abuse treatment 44 88% Continue your education 38 76% Obtain photo identification 38 76% Work on personal relationships 38 76% Find a job 35 70% Get counseling 33 66% Find a place to live 28 56% Get financial assistance, receive benefits 26 52% Access health care 17 34%
Sheridan compared to traditional prison All study participants had been incarcerated in a traditional prison prior to their stay at Sheridan. A total of 86 percent of those interviewed said that Sheridan’s therapeutic community helped

19
them more than a traditional prison. Few (8 percent) said Sheridan did not help them more than a traditional prison and 4 percent were not sure (2 percent said not applicable). Survey participants named counseling and aftercare among the most helpful aspects of Sheridan. One said, “The counselors are very hands-on. Had really good counselors while I was there.” Another man said, “Counselors had been in the same position. Talking definitely helps.” Some participants mentioned the schooling, counseling, and constructive activities as what set Sheridan apart from a traditional prison. The following are some of these comments.
“Because it brings you in tune to who you can be and don't have to be. It was therapeutic community. Everybody was understanding, there was a big brother thing going on.” “They have things to better your life unlike here where we just sit around and can't talk about our feelings without being called a sissy.” “It was more like getting a second chance. More than sitting in a cell and watching TV. [I was able to] find out the cause of what gets me going out using drugs, drinking.”
It is important to note that those men who stated that Sheridan did not help more than a traditional prison cited personal reasons and not programmatic failures for why Sheridan did not help them more than a traditional prison. These comments mainly centered on not wanting help or not wanting to change.
“Because I wasn't ready to change. If a person is ready, I believe it would help. It did change my thinking though.” “Because only there for the good time, ‘fake it to make it’.”
Furthermore, a majority (86 percent) of those interviewed reported they were glad they participated in the program and did not wish they had gone to a traditional prison. A couple of the men mentioned that they wished they could go back to Sheridan (offenders can only participate in the Sheridan program once). The following are some comments on why study participants were glad they went to Sheridan.
“Because I did not have to put up with the things at a traditional prison such as being with gang bangers, getting tickets, going to segregation.”
“Even now I still remember things. Taught me skills on anger, listening, coping. Humbleness. Not so many fights.” “Gave me more awareness and knowledge that I didn't have before. Seed is planted just keep watering it.”

20
Of those who would have preferred a traditional prison over Sheridan, more stringent parole as well as aftercare requirements were often noted as the reason. The following are some of the comments by those who wished they had gone to a traditional prison.
“When you leave Sheridan they try sending you to a halfway house and make you do drug treatment. Lots of extra requirements.” “Wish I went to a traditional prison because I probably would still be out in the world. Parole is a lot easier than TASC.” “Just there for good time and could have gotten it anywhere. Didn't want to do aftercare upon release.”
Support from treatment staff A majority (68 percent) of the Sheridan participants felt they received support from the substance abuse treatment vendor staff with whom they interacted at Sheridan and 20 percent said they sometimes/somewhat received support. Only 10 percent said they did not feel that they received any support (2 percent unknown). Figure 4 indicates the level of support the men said they received from treatment staff at Sheridan.
Figure 4Level of support from treatment staff
Yes, 68%
Sometimes/somewhat, 20%
No, 10%
Unknown, 2%
Study participants were asked to share what type of support they received from Sheridan treatment staff. Some said they could talk to the staff who really listened to them. One man said, “Could talk to them about anything, always there for you.” Another said counselors “always answered my questions.” One participant surveyed said, “They would listen and some shared their own personal experience to show they weren't just teaching but living it.”

21
Recommendations for improvement
Sheridan participants interviewed were asked if there was anything the substance abuse treatment staff could have done to make their community reentry experiences upon release more successful. Some of the men indicated that they were either misled or were unclear about what would happen after release from Sheridan and recommended more clarity with regards to the aftercare phase of the Sheridan program. As one interviewee stated, “[Be] more upfront about what to expect when you get home.” Others had more specific suggestions, such as better housing alternatives upon release. One man stated, “Needed more housing options after the halfway house, a sober living house, or more transitional housing.” While this suggestion is not within the scope of services that the in- prison treatment staff could provide, it does indicate that Sheridan participants may group the various service providers together rather than realizing their differing functions and roles in the program. Support from correctional staff More than half of those interviewed said that they did not receive support from correctional staff at Sheridan with whom they interacted (60 percent). One interviewee said the lack of interaction between correctional officers and counselors “hurt the program a lot.” Some participants interviewed said they received support from correctional staff (26 percent) and 12 percent said they received support sometimes/somewhat (2 percent unknown). Figure 5 indicates what the men said about support from correctional staff.
Figure 5Level of support from correctional staff
Yes, 26%
Sometimes/somewhat, 12%
No, 60%
Unknown, 2%
Those who indicated that they did receive support from correctional staff were asked to share what kind of support. Some of the men mentioned encouragement provided by correctional staff. One man stated, “They wanted to see the changes and the guys not come back. It's a good thing to see correctional officers do that.” Another said correctional officers gave him “words of

22
encouragement not to go back to gang lifestyle, drugs. Feels good when [a correctional officer] tells you.” While the focus of the IDOC correctional staff must be security, those that did feel supported by the correctional staff seemed to have a positive reaction to their encouragement.
How Sheridan program prepared its participants Overall, most of the participants of the Sheridan program felt it prepared them for success upon release. More than half (60 percent) felt Sheridan prepared them for success and 24 percent said that Sheridan prepared them in some ways. Fewer (10 percent) thought that Sheridan did not prepare them for success and 4 percent were not sure (2 percent unknown). Figure 6 indicates how study participants responded about their preparedness for success by Sheridan.
Figure 6Did Sheridan prepare you for success?
Yes, 60% In some ways, 24%
No, 10%
Not sure, 4%
Unknown, 2%
The men who reported that Sheridan prepared them for success said the various programs, groups, education, and classes were what helped them most. The following are some of their comments.
“Provided a fairly good aftercare program and that's what had the greatest impact.”
“Groups were helpful because I was able to share life experiences and share personal stories with fellow young inmates.” “They had a lot of vocational programs and I took advantage of that. They taught me a lot. Prepared me to get a job.”
Some of the men talked about Sheridan preparing them for success by making real changes in them and improving their lives. The following comments illustrate that.
“Prepared me to live, to be a man. Prepared me to live life on life's terms. Gave me hope. Coming from where I came from that was really unique.”

23
“Got me mentally ready; knowing what to expect when I go back to the world; gave hope, life.”
“Teach you about patience, understanding, respect, respect for others, how to think clearly without being on drugs. You need responsibility in situations.”
What helped most after release
The graduates of Sheridan interviewed for this study were asked what Sheridan offered that helped them most after release. Responses included employment, housing, anger management and communication skills assistance. One man said that “learning how to cope with family problems” helped him the most after release. Another cited the ability to“look at myself deeper, realize my decisions affect others.” Others said that what helped them most after release was learning better ways to spend free time.
“How to spend my time…without getting high—go to church, have a cup of coffee.” “Time management—what to do with free time, spare time; that's when I get into trouble.”
How Sheridan did not prepare graduates Study participants were asked how Sheridan did not prepare them for success after incarceration. Multiple respondents said the program was not honest with them about what to expect during and after the program. While further exploration would be needed to learn about inconsistencies, there could be several explanations for the participants making these claims. First, Sheridan participants receive information regarding the program from myriad sources including staff at the Reception and Classification units, correctional and treatment staff at Sheridan, and from fellow program participants. It is possible that they are being given inaccurate and/or inconsistent information from one or more of these sources regarding what the program provides. Second, many of the program’s components are not available to everyone. For example, Sheridan participants are told that they can participate in vocational training services and that job fairs are conducted on-site. However, not every participant is going to receive these services due to space, time, budgetary, and eligibility restrictions. The same is true for external services—geographical constraints limit some of the options that Sheridan graduates have. Finally, individuals in the study were at Sheridan at different periods of time and during different phases of program implementation; therefore, their responses may reflect aspects of the program that have since been changed. In addition to unclear program requirements, a couple survey participants stated that the program did not prepare them for success because it did not give them the skills they needed. Below are some of their comments.
“Didn't prepare for felony and housing issues.” “Too much text book talk, not enough real life experiences.”

24
Some acknowledged the fact that it was not that the program failed to prepare them but rather that they were not at Sheridan for change. One survey participant said, “You have to want to be engaged. I was there just to be there because it's close to where I stay at.” The men interviewed were also asked what was not offered at Sheridan that would have been helpful to them. Some mentioned that financial assistance would have been helpful. One man stated, “More financial help. Had nothing. Went two weeks without toothpaste. Would have been less stressful.” Others mentioned increasing access to vocational programs or employment. One said Sheridan “did not have enough spots open in the vocational classes.” Another said, “If they would have set us up with jobs once we were leaving, that would have helped.”
Finally, others suggested specific programmatic elements. One man said, “It was offered but they should have stressed the behavior modification techniques more in-depth.”
Preparation for reentry Treatment Alternatives for Safe Communities (TASC) TASC advocates for people in courts, jail, prisons, and child welfare systems who need treatment for drug and alcohol and mental health problems. TASC is responsible for pre-release clinical re- entry case management services and post-release reentry case management in the community while Sheridan participants are on mandatory supervised release. A majority of the study participants (78 percent) reported participating in TASC services upon release from Sheridan. Of them, 36 percent said TASC was helpful, 26 percent said it was not helpful, and 16 percent said it was somewhat or sometimes helpful (22 percent said not applicable). Some of those who did not participate in TASC stated that they were not informed about or required to receive TASC services or that TASC services were not available in their area. One person felt TASC would not be beneficial.
TASC Services
Of the 39 inmates that participated in TASC services, 41 percent reported participating in Case Management, 26 percent in Winner’s Circle (a community based support group for people who have been incarcerated), 15 percent in Recovery Support Services, and 15 percent in substance abuse treatment (Figure 7). Few participated in self-help groups such as Alcoholics Anonymous (5 percent) and 18 percent said Other. Eighteen percent participated in more than one service.

25
Figure 7Participation by TASC service type*
0%
10%
20%
30%
40%
50%
60%
70%
80%
90%
100%
CaseManagement
Winners Circle Other RecoverySupportServices
SubstanceAbuse
Treatment
Self-Help
Perc
ent o
f sam
ple
Overall, participants found TASC services to be beneficial. All study participants were asked if there were any actions TASC could have taken to make their reentry experiences post-Sheridan more successful. Slightly more than half of the respondents (51 percent) said “no” or that they “did not know.” One said, “They did their job. The rest was up to me.” Some of the men thought TASC was too intrusive and could have helped them by leaving them alone, however, a number of the men actually thought services through TASC should have lasted longer and that TASC should have monitored them more. The Safer Foundation The Safer Foundation provides job preparedness training to inmates while at Sheridan and employment placement assistance upon release. In prison, the Safer Foundation offers career guidance and teaches job-seeking skills. After release, clients in Safer can continue to receive job preparedness training. If necessary, the Safer Foundation offers transportation to work or school, clothing, stipends for education, and assistance with obtaining legal identification (The Safer Foundation, n.d.).
Safer Foundation services
Eighty-two percent of study participants reported using Safer Foundation services. Reasons for not participating included lack of interest and geographical challenges. There was an issue for some with Safer Foundation services not being available in their area.
*Of those in the sample who received TASC services, n=39

26
The Sheridan graduates used a variety of services related to jobs (coaching, case management, interviews, searches, placement, or simulated interviews), transportation (bus passes), computer labs, client supports, case management, and others (gift certificates, library, clothing.) (Figure 8). The study participants that did utilize the external Safer Foundation program primarily used the job-related services. Some of the men found the employment services useful and some were able to secure an interview or employment. Their comments included:
“Got me jobs—three interviews first week home.”
“I think they are pretty good. They helped me find a job. If a person wanted help, they would have helped.”
However, others felt the services were not helpful because the Safer Foundation lacked resources. One man commented, “[I] didn't get a lot out of it. Found better job on my own. Jobs weren't in my area.”
Figure 8Safer Foundation service participation by type
0%
10%
20%
30%
40%
50%
60%
70%
80%
90%
100%
Job Transportation Computer lab Client support Casemanagement
Other
Perc
ent o
f sam
ple
All interviewees were asked if there was anything the Safer Foundation could have done in order to make their reentry process after Sheridan more successful. Most said “no.” Their comments included:
“[Safer] was a great help in Springfield. They had my best interest in mind.”
*Of those in the sample who received Safer Foundation services, n=41

27
“They did everything they could for me.”
Some interviewees said that they were misled about the services the Safer Foundation could provide them and some said more job help or employment information would have made their reentry in to the community more successful. Community-based services All Sheridan graduates who participated in this study were asked to identify any additional community-based programs, besides TASC and the Safer Foundation, they participated in after being released. They also were asked to list any additional services that would have been helpful.
Other service participation
A majority (78 percent) of the sample participated in self-help groups, 20 percent participated in other substance abuse treatment after aftercare, and 20 percent participated in life skills classes. Few (12 percent) received GED or basic education services and 12 percent were in anger management classes. Ten percent participated in Community Support Advisory Council (CSAC), a voluntary program assisting with food, clothing, and housing. Eight percent were enrolled in parenting classes and 6 percent in mental health counseling (Figure 9).
Figure 9Other community-based service participation by type
0%
10%
20%
30%
40%
50%
60%
70%
80%
90%
100%
Self-helpgroups
Treatment Life skills Angermanagement
Education CSAC Parenting Mental health
Service type
Perc
ent o
f sam
ple
The Sheridan graduates cited a myriad of reasons why they chose to participate in supplementary community-based programs or services.

28
The men participated in recovery support or self-help groups, such as Alcoholics Anonymous or Narcotics Anonymous, for varying reasons including that it was a parole requirement or to help maintain sobriety. Some men also enjoyed the environment these groups provided. As one interviewee said, “I enjoyed being around others in recovery.” The Sheridan graduates that participated in other classes did so to learn useful skills that helped them. One said life skill classes “taught [him] to manage money. Never had to do that.” One former Sheridan inmate said he participated in anger management because he only knew “how to deal with people from a penitentiary perspective.” Those study participants that partook in CSAC services highlighted the assistance they received from the organization, “[CSAC helped me to] sign up for job referrals and [find a] place for counseling, eat, haircut.” CSAC is a voluntary program open to all men who exited from the Sheridan. CSAC works to connect parolees to supportive services such as food, clothing, and housing to ease the parolee’s successful transition back to the community. There are currently five CSAC sites—on the south, north, and west sides of Chicago, in Springfield, and in Marion. Each CSAC determines the barriers of its community and what it will focus on by polling its members. Examples of focus areas include employment, education, family awareness and connection, food, and clothing.
Other services that would be helpful
Next, inmates were asked if there were any services that would have been helpful that they did not receive while participating in either the internal or external Sheridan program. Out of the 50 men interviewed, 24 percent said yes, 72 percent said no, and 4 percent said they were not sure. However, of those that said yes, the specific services they suggested included services that are already offered by the Sheridan program. For example, the men suggested help with employment, schooling, parenting classes, mental health counseling, and housing. What this likely reflects is that many of the services provided by the Sheridan program are not to scale. Thus, all of the Sheridan participants may not have been able to take advantage of all of the services that are offered. Parole supervision In Illinois, all offenders sentenced to corrections are given a determinate sentence, so a parole board does not decide the date of release to parole. Instead, offenders are given mandatory supervised release (MSR), a statutorily defined period of time of supervision after release from prison. Offenders are monitored on MSR by parole agents until their parole is fulfilled. The terms “parole” and “MSR” are often used interchangeably, but will be referred to as parole in this report. All Sheridan graduates returning to the community are placed on parole and monitored by parole agents. In addition to in-person and telephone meetings with parole agents, parolees are also required to utilize the Automated Management System (AMS). Parolees call in to the AMS number where they are asked a script of questions. The parolee’s answers are then passed along to the parole agent. In- person meetings are typically required once per month and the parolee is expected to call in to the AMS system at least once per month.

29
Besides the mandatory aftercare requirement, the parolee is expected to work with both parole and TASC during his parole period. Parole and TASC work together to engage the Sheridan releasee, to ensure the releasee is abiding by all his parole conditions, and to assist as needed. All public safety decisions are clearly the responsibility of parole while TASC contributes to clinical treatment decisions and recommendations (Illinois Department of Corrections, 2006). The TASC case manager works with the parolee to overcome barriers to participation in aftercare services and to facilitate entry into his aftercare program. The TASC case manager may also address any additional needs with which the parolee was discharged from Sheridan (Illinois Department of Corrections, 2006). Three-quarters of the study participants participated in TASC services upon release from Sheridan. Sheridan graduates remain on parole for one to three years. A parolee is removed from parole once parole is complete or if he is re-incarcerated for a new crime or a technical violation. The Sheridan program was designed to incorporate diversion strategies through a series of sanctions and case management if a parolee engages in detrimental behavior. Parole agents utilize a series of graduated sanctions, known as the Parole Division Sanction Matrix, to make sanction judgments with Sheridan parolees (Illinois Department of Corrections, 2006). When applicable, the TASC case manager may also contribute to the diversion process.
Meetings with parole agent
Sheridan participants who are going to be released to the community attend a parole discharge meeting 30 days prior to their release or parole date. During this meeting, the details of the individual’s parole plan, placement details, service delivery goals, and objectives are reviewed with the participant to achieve a seamless transition into the community (Illinois Department of Corrections, 2006). All parties involved in the participant’s parole should be present at this meeting. They include the TASC case manager, external Safer Foundation job coach, CSAC community representative, IDOC counselor, parole agent, and the offender. Optimally, the offender will meet his actual parole agent at the 30 day discharge meeting so that they can begin to establish a relationship; so that all requirements and expectations are clear; and, so that the offender can express any areas of concern or where he may be in need of additional support. Of those interviewed, about half (52 percent) said that their specific parole agent did not attend those meetings (10 percent unknown).
Experience on parole
In terms of post-release meetings with parole, the graduates said that they had an average of about one meeting by phone per month and one in- person meeting per month. The men said the telephone meetings with their parole agent lasted an average of 5 minutes and ranged from one to 25 minutes. Face-to-face meetings lasted an average of 21 minutes and ranged from one to 90 minutes. Sheridan graduates were asked to describe their parole experience. Some described parole as helpful. One interviewee said, “[My parole officer] was more helpful and concerned than I expected. He didn't treat me like a prisoner but like a person, perhaps because I was acting like one this time.”

30
Some of those interviewed said that their parole agent helped by referring them to treatment instead of violating them.
“He made me do inpatient drug treatment. Otherwise, he would send me back to prison.” “He was a good officer. I dropped dirty three times. He let me get clean and go to a counselor.”
Most of the men interviewed in this study had a positive relationship with their parole agent, describing their relationships as fair, good, and professional. One person said his parole agent played a “really nice, caring, supportive big sister role.” Some of the men mentioned that they never saw their parole agent, which they indicated minimized the difficulty of their parole. Others expressed that there were too many restrictions on parole. Sheridan graduates often have more restrictions than parolees from other correctional facilities such as the 90 day aftercare and TASC case management conditions. Parolees often have many rules to follow which may be unrealistic and difficult to meet for any individual and more so if trying to stay sober, find or sustain a job, and support their family (Solomon, Osborne, Winterfield, Elderbroom, Burke, Stroker, Rhine, & Burrell, 2008). Eight men said that they had no relationship with their parole agent. One man said, “I don't know her, just her name.” Three men said the relationship with their parole agent was difficult. One described the relationship as “tough as hell.”
Service referrals by parole
The Sheridan graduates were asked to indicate the services to which their parole agent referred them. Ten of the men mentioned they were referred to substance abuse treatment, six received information about job fairs and got job referrals, six were referred to TASC and three were referred to the Safer Foundation. Other service referrals included anger management, GED program, vouchers for Link card, and assistance in obtaining legal identification cards. Nine said their parole agent did not refer them to anything. About one-third of the men (36 percent) said they followed up with the services referred to by their parole agent and 4 percent said they followed up with some of the services. Six percent of the interviewees said they did not follow up with services. Half of the men (50 percent) said not applicable because they were never referred to any services. (Four percent were unknown.) Figure 10 depicts the responses of the sample on following up with services. Of those referred to treatment (n=25), 72 percent followed up with services.

31
Figure 10Following up on service referrals by parole
Not referred to services, 50% Followed up
with some services, 4%
Unknown, 4%
Did not follow up, 6%
Followed up, 36%
The men were further asked why they did not follow up with services they were referred to by their parole agent. One person said, “I was bad into addiction. I got lazy, stubborn.”
How parole was helpful
The prisoners were asked to share what their parole agent did that was helpful. The men thought it was helpful when they were given chances, left alone, given support, and shown respect, as well as when referred to services or jobs. Their comments included:
“Supported me, stayed on me, making sure I didn't relapse, and did make meetings.” “He knew substance abuse places to go. Understood it would be hard to stay away. He said, ‘If you use, call me and I will help you.’ He gave you an opportunity to clean yourself up.”
During the interviews, the men were asked what their parole agent did not provide that would have been helpful. The men mentioned some additional resources like jobs and transportation, as well as fewer restrictions placed on them. Interestingly, several men said it would have been helpful if their parole agent had placed more restrictions on them. Their comments included:
“[I wanted him to] hold me accountable, drop me, test me. Especially knowing I came from Sheridan and have substance abuse issues.” “More home visits help you not to do things because you know they are coming.”
This desire for a more restrictive parole plan is consistent with one study that found parole served as an important external check on substance use and criminal behavior and most parolees appreciated being monitored (Nelson, Deess, & Allen, 1999).

32
Conditions of parole
Study participants were asked about the clarity and understanding of their conditions of parole. The vast majority of interviewees knew what their parole obligations included and understood them. Clarity was assessed using the following categories: Very clear, Somewhat clear, Somewhat unclear, and Very unclear. Based on these categories, 86 percent of men said their conditions of parole were made Very clear to them, while 8 percent said Somewhat clear, and 4 percent said Somewhat unclear (2 percent unknown). Moreover, in terms of understanding the conditions of their parole, eighty-four percent replied that they understood their conditions completely, 12 percent understood them somewhat, and 2 percent did not understand them (2 percent unknown). No respondents stated that they did not understand the conditions at all. Respondents were asked how likely they thought it was that they would get caught if they violated a condition of their parole (Figure 11); over half of the sample thought they would likely get caught if they violated parole. Forty percent stated very likely, 22 percent said somewhat likely, 18 percent said somewhat unlikely, and 14 percent said very unlikely (6 percent unknown).
Figure 11Likelihood of getting caught if violating
parole
Very likely, 40%
Somewhat likely, 22%
Somewhat unlikely, 18%
Unlikely, 14%Unknown, 6%
Parole agent knowledge of substance abuse
Given that all men participating in the Sheridan program are substance abusers, it would seem pertinent that their parole agents specifically address this area of their life. Out of all the interviewees, 54 percent said their parole agent discussed substance abuse issues with them at some time, while 44 percent never discussed their substance abuse issues with their parole agent.

33
Respondents were asked to gauge the level of knowledge their parole agent had about substance abuse issues. A majority (60 percent) thought their parole agents were very knowledgeable or somewhat knowledgeable, 16 percent said very unknowledgeable, and 6 percent said somewhat unknowledgeable. The Sheridan graduates that said their parole agent was knowledgeable about substance abuse issues cited the parole agent’s awareness of common relapse triggers and the effects of using. Their comments included:
“He knew what to look for in a person getting high.” “Showed up before a holiday, at the holiday, after the holiday.”
“She knew all about tricks addicts try to use. I couldn't trick her. She was very open-hearted and honest.”
Many survey respondents stated that if their parole agent was not knowledgeable about substance abuse issues, the parole agent would refer the graduate to his TASC case manager, indicating that the model was working as designed. How IDOC can make reentry successful The Sheridan graduates interviewed for this study were asked if there was anything IDOC could have done to make their reentry experience upon release more successful. A few men made comments about what parole could have done to help them including checking- in with them sooner after release and giving more chances before violating. One man who was interviewed said, “Parole agents were slow getting out. Halfway house helped me to get checked in with parole agent.” Another Sheridan graduate said, “Parole could have given me another chance. Some parole agents violate for small things and don’t violate for big things.” Experience in the community Major life events A number of respondents had major life events occur during the time they were released from Sheridan and prior to their subsequent re-incarceration. Among our sample, 20 percent experienced the birth of a child, 32 percent suffered a death in the family, 42 percent suffered the death of a friend, 10 percent got married, 4 percent got divorced, and 14 percent were the victims of a crime (Figure 12). Major life events, even positive ones, can cause considerable stress in a person’s life; however, it is unknown if these events directly contributed to the interviewee’s relapse (if applicable) or re-incarceration.

34
Figure 12Major life events after Sheridan before re-incarceration
0%
10%
20%
30%
40%
50%
60%
70%
80%
90%
100%
Death of familymember
Death of afriend
Birth of a child Divorced Married Victim of acrime
Life event
Perc
ent o
f sam
ple
Neighborhood after release The largest group of participants (n= 21, 42 percent) lived in Chicago immediately after release from Sheridan. This is consistent with a study of Illinois prisoner reentry that found 51 percent return to Chicago neighborhoods, many of which tend to be more economically and socially disadvantaged than the average Chicago neighborhood (LaVigne, 2003). Twenty percent of the men lived in the suburbs of Chicago. Thirty-six percent of the sample lived in other Illinois cities and one moved to another state. Table 6 indicates the cities that the men lived after release.

35
Table 6 Cities lived after release from Sheridan
N % Illinois city Chicago 21 42% East Moline 4 8% Joliet 4 8% Rockford 4 8% Peoria 2 4% Aurora 2 4% Arlington Heights 1 2% Bellwood 1 2% Blue Island 1 2% Calumet City 1 2% Carol Stream 1 2% Oak Park 1 2% Orland Park 1 2% Pontiac 1 2% Springfield 1 2% Streamwood 1 2% Tonica 1 2% Waukegan 1 2% Other state Pine Bluff, Arkansas 1 2% TOTAL 50 100%
In a study of Illinois reentry, Visher and Farrell (2005) found slightly more than 50 percent of parolees returned to the same neighborhood they lived in prior to incarceration. While Sheridan participants are encouraged to make changes in their lives including “people, places and things”, slightly more than half of the sample (54 percent) moved back to the same neighborhood after release from Sheridan. Many Sheridan participants said the reason for going back to the same neighborhood was because their families lived in that neighborhood or because they were familiar with that neighborhood. Those who did not return to the same neighborhood cited attempting to avoid negative influences and wanting to try a new place to live.
Returning to same neighborhood and days until relapse
Of those that relapsed (n = 45), 58 percent had returned to the same neighborhood they were living in before Sheridan, and 40 percent resided in a different neighborhood upon release (2 percent unknown). Statistical analysis revealed a significant negative correlation between returning to the same neighborhood and number of days until relapse (rs= -.361, n= 44, p= .016, two-tailed). The subjects in our sample that returned to the same neighborhood, on average relapsed sooner (average of 97.81 days; SD = 177.37) than those that resided elsewhere (average

36
of 230.33 days; SD = 271.71). A Mann-Whitney test revealed a significant difference between those that returned to the same neighborhood from those that did not when comparing the amount of time until relapse (U = 135.000, N1 = 26, N2
= 18, p = .018, two-tailed). As Travis, Solomon, and Waul (2001) stated, “The experience of a prisoner returning to his old neighborhood and friends places him at high risk for relapse, in part because the familiar places and people may act as a trigger to his brain and heighten cravings” (p. 27).
Additionally, a significant positive correlation existed between returning to the same neighborhood and spending free-time with risky individuals (rs
=.452, n= 47, p=.001, two-tailed). Risky individuals are those who engage in criminal activities or use substances. Of those that returned to the same neighborhood (n=27), 38 percent (n=18) reported spending time with individuals who engaged in criminal activities or used substances.
Returning to the same neighborhood also had an effect on income sources. A significant positive correlation was found between returning to same neighborhood after Sheridan release and having an illegal source of income (rs
= .362, n= 48, p= .011, two-tailed).
High-risk neighborhoods This study found that formerly incarcerated individuals who returned to risky neighborhoods reported more negative peer associations and illegal incomes. Risky neighborhoods were identified by the interviewee as places where drug dealing was common or as an unsafe place to live. These findings follow social disorganization theory which suggests certain neighborhoods with low socio-economic status, ethnic heterogeneity, residential mobility, and family disruption lead to higher crime rates (Bursik, 1988). Specifically, a majority of the sample resided in the Chicago metropolitan area after release from prison. These urban neighborhoods likely feature some characteristics of being socially disorganized such as being economically and socially disadvantaged (LaVigne, 2003), which may lead to more crime. Figure 13 depicts the characteristics of the neighborhoods that Sheridan graduates lived in after release.
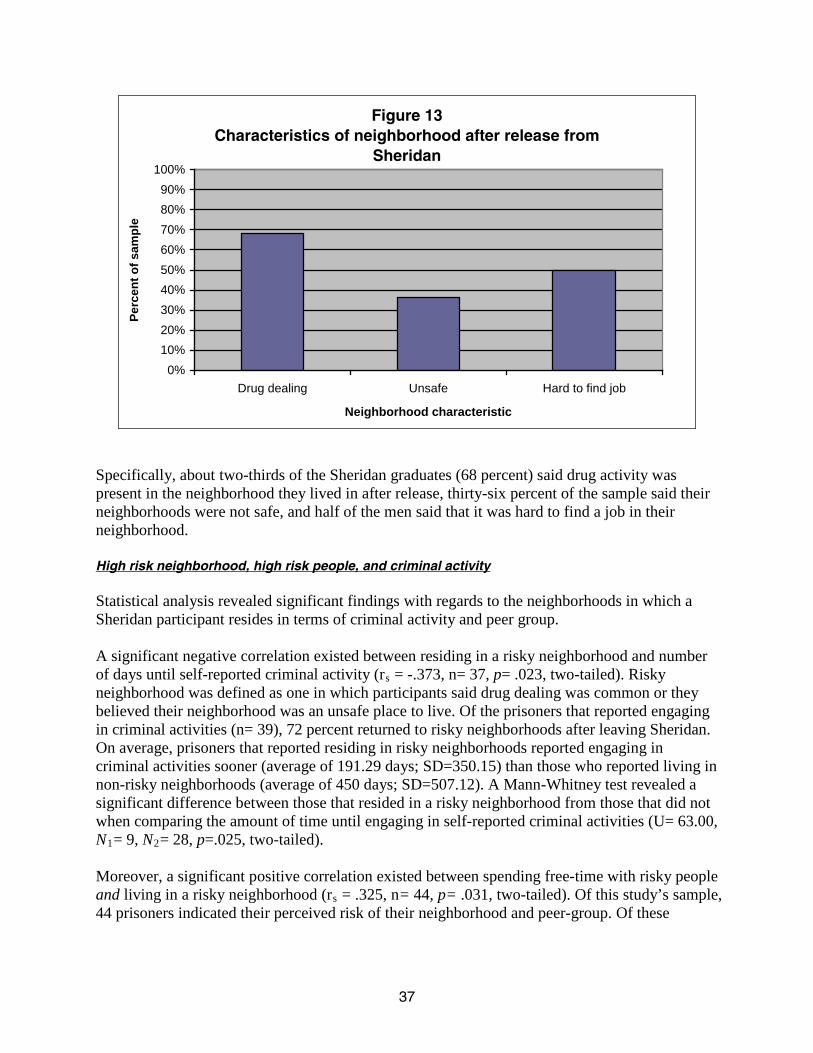
37
Figure 13Characteristics of neighborhood after release from
Sheridan
0%10%20%30%40%50%60%70%80%90%
100%
Drug dealing Unsafe Hard to find job
Neighborhood characteristic
Perc
ent o
f sam
ple
Specifically, about two-thirds of the Sheridan graduates (68 percent) said drug activity was present in the neighborhood they lived in after release, thirty-six percent of the sample said their neighborhoods were not safe, and half of the men said that it was hard to find a job in their neighborhood.
High risk neighborhood, high risk people, and criminal activity
Statistical analysis revealed significant findings with regards to the neighborhoods in which a Sheridan participant resides in terms of criminal activity and peer group. A significant negative correlation existed between residing in a risky neighborhood and number of days until self-reported criminal activity (rs = -.373, n= 37, p= .023, two-tailed). Risky neighborhood was defined as one in which participants said drug dealing was common or they believed their neighborhood was an unsafe place to live. Of the prisoners that reported engaging in criminal activities (n= 39), 72 percent returned to risky neighborhoods after leaving Sheridan. On average, prisoners that reported residing in risky neighborhoods reported engaging in criminal activities sooner (average of 191.29 days; SD=350.15) than those who reported living in non-risky neighborhoods (average of 450 days; SD=507.12). A Mann-Whitney test revealed a significant difference between those that resided in a risky neighborhood from those that did not when comparing the amount of time until engaging in self-reported criminal activities (U= 63.00, N1= 9, N2
= 28, p=.025, two-tailed).
Moreover, a significant positive correlation existed between spending free-time with risky people and living in a risky neighborhood (rs = .325, n= 44, p= .031, two-tailed). Of this study’s sample, 44 prisoners indicated their perceived risk of their neighborhood and peer-group. Of these

38
individuals, 45 percent (n= 20) reported spending time with risky individuals and living in a risky neighborhood. Housing after release from Sheridan Regarding post-prison living arrangements, the largest group of respondents (58 percent) went to a residential aftercare facility (halfway house, recovery home, or transitional home) (Figure 14). Twenty-two percent lived at a family member’s house or apartment, 8 percent stayed at a friend’s house or apartment, and 8 percent returned to their own house or apartment. One person was homeless after release and one lived in a nursing home to care for a family member.
Figure 14Housing upon release from Sheridan
Aftercare Facility, 58%
Family, 22%
Friends, 8%
Homeless, 2%
Own home, 8%
Nursing home, 2%
Prison releasees often move from their original post-prison location. Those surveyed moved an average of two times between their release from Sheridan and re-incarceration. On average, the Sheridan graduates in the study spent about two years (738 days) in the community and the median, or middle number, was just over a year-and-a half (593 days). The number of moves ranged from zero to 20. When asked where they lived for most of the time period prior to re-incarceration, 36 percent responded they stayed in their own houses or apartments, 24 percent said they stayed at a family member’s place, 14 percent said they were in a residential treatment facility, 14 percent said they stayed with a friend, and 4 percent were homeless. A majority of Sheridan graduates (84 percent) said that it was not difficult to find housing which may reflect the fact that aftercare housing was available to all men successfully exiting the Sheridan program; 14 percent said it was difficult (2 percent unknown). Of those who experienced difficulty in finding housing upon release, housing restrictions stemming from their felony conviction as well as unfamiliarity with a new place were given as reasons.
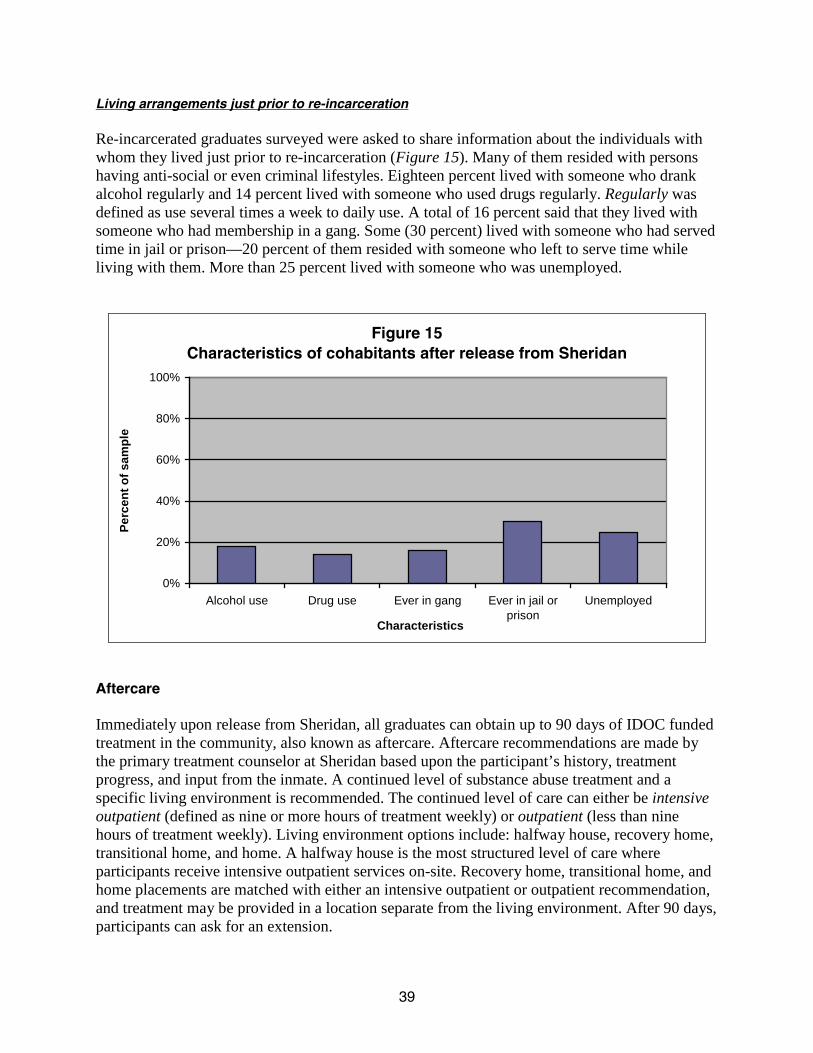
39
Living arrangements just prior to re-incarceration
Re-incarcerated graduates surveyed were asked to share information about the individuals with whom they lived just prior to re-incarceration (Figure 15). Many of them resided with persons having anti-social or even criminal lifestyles. Eighteen percent lived with someone who drank alcohol regularly and 14 percent lived with someone who used drugs regularly. Regularly was defined as use several times a week to daily use. A total of 16 percent said that they lived with someone who had membership in a gang. Some (30 percent) lived with someone who had served time in jail or prison—20 percent of them resided with someone who left to serve time while living with them. More than 25 percent lived with someone who was unemployed.
Figure 15Characteristics of cohabitants after release from Sheridan
0%
20%
40%
60%
80%
100%
Alcohol use Drug use Ever in gang Ever in jail orprison
Unemployed
Characteristics
Perc
ent o
f sam
ple
Aftercare Immediately upon release from Sheridan, all graduates can obtain up to 90 days of IDOC funded treatment in the community, also known as aftercare. Aftercare recommendations are made by the primary treatment counselor at Sheridan based upon the participant’s history, treatment progress, and input from the inmate. A continued level of substance abuse treatment and a specific living environment is recommended. The continued level of care can either be intensive outpatient (defined as nine or more hours of treatment weekly) or outpatient (less than nine hours of treatment weekly). Living environment options include: halfway house, recovery home, transitional home, and home. A halfway house is the most structured level of care where participants receive intensive outpatient services on-site. Recovery home, transitional home, and home placements are matched with either an intensive outpatient or outpatient recommendation, and treatment may be provided in a location separate from the living environment. After 90 days, participants can ask for an extension.

40
Almost all (94 percent) of the Sheridan participants in this study attended some aftercare. Research has shown aftercare is critical in reducing recidivism among those who have completed prison therapeutic community programs (Chanhatasilpa, MacKenzie, & Hickman, 2000; De Leon, Melnick, Thomas, Kressel, & Wexler, 2000; Incardi, Martin, & Butzin, 2004; Knight, Simpson, & Hiller, 1999; Olson, Rozhon, & Powers, 2009; Wexler, De Leon, Thomas, Kressel, & Peters, 1999). Of those who attended aftercare (n=45), 38 percent went to a halfway house, 11 percent went to a recovery home, 9 percent went to a transitional home, and 2 percent reported they went to an other form of aftercare (residential inpatient). In addition, 18 percent reported living at home and attending intensive outpatient and 22 percent reported living at home and attending outpatient treatment (Figure 16).
Figure 16Aftercare type attended*
Halfway house, 38% Home with out-
patient, 22%
Other, 2% Home with intensive
out-patient, 18%Recovery
home, 11%
Transitional home, 9%
Study participants reported attending 23 different aftercare programs. The most commonly listed programs were Gateway Foundation (n=8), Jack Clark’s Family (n=4), Rock Island County Council on Addictions (n=3), and Stepping Stones Inc (n=3). Those interviewed reported aftercare participation for an average of 79 days. While Sheridan participants can attend aftercare for up to 90 days, their lengths of stay in aftercare ranged from one day to one year. On-going assessment during aftercare can lead to shorter or longer length of stays. The 6 percent of the men who did not attend aftercare were asked to explain why they opted not to participate. Their comments included:
“Didn’t remember it being required.”
*Of those in the sample who attended aftercare, n=45

41
“I ain’t going to do that. I’m super-duper rebellious, do what I want to do. You aren’t going to tell me what to do.”
Almost half (48 percent) of the study participants said that they completed their aftercare while almost half (48 percent) did not (4 percent said it was Not applicable). The high percentage of those who did not complete aftercare may be due to the sample consisting of only re-incarcerated Sheridan graduates. Most said they left on their own or were asked to leave. Their comments included: “Just stopped going, busy chasing girls and living a loser lifestyle.” “Because I kept getting high, dirty drops.”
“Work schedule got in the way.”
How aftercare was helpful
Slightly more than half of the sample said that attending aftercare helped them in some way (58 percent). Aftercare helped by giving them a place to live, so they could save money, by keeping them busy which slowed or stopped drug use, and by providing social stimulation and skill building activities. Comments on how aftercare helped some of the Sheridan graduates included:
“I didn't have to worry about rent which allowed me to save money and afford my own apartment.” “Personal interactions with people [were helpful]. People giving personal experience, most counselors have drug/alcohol issues and/or have been incarcerated and gone another way with their life.”
“Helped me in every way. Make mental transition to living in society and doing things (i.e. paying bills) that I didn't know how to do.”
On the other hand, twenty percent of those interviewed said aftercare did not help them and 16 percent said that it helped sometimes/somewhat. Their comments included:
“I’d been through it [drug treatment] for two years—[having to do aftercare] aggravated me. I wanted to go home after work.”
“I was incarcerated for two-and-a-half years and had no interest in getting high again.” “I didn't want to stop smoking weed or selling drugs.” Role of family relationships The relationship that an offender maintains with his family both during his prison stay and after release can have considerable effects on his post-release success. Hairston (1991) found that offenders with family ties during their incarceration do better post-release than those without

42
family ties. Studies have found that inmates that have more family contact during their incarceration—in-person visits, mail, or specialized family programming—have lower recidivism rates (Visher & Travis, 2003). A study by the Vera Institute of Justice found that post-release “supportive families were an indicator of success across the board, correlating with lower drug use, greater likelihood of finding jobs, and less criminal activity,” (Nelson, Deess, & Allen, 1999, p. i). The Pennsylvania Department of Corrections’ Parole Violator Study found that parole violators were less likely than non-violators to live with a spouse and less likely to be in a stable, supportive relationship (Bucklen, 2006). However, families may also be a negative influence for the offender. Family members often are dealing with their own substance use and legal issues. In a study on men paroling in Cleveland, 64 percent of parolee family members had substance use problems, 30 percent had a family member currently in jail or prison, and 62 percent had a family member with a criminal conviction (Visher & Courtney, 2007).
Family members
At the time of the interview, more than half of the re-incarcerated graduates of Sheridan in the sample (56 percent) never married and 24 percent were married. Sixteen percent were divorced, 2 percent were separated, and 2 percent were widowed. Sixty-two percent of those interviewed had a spouse, intimate partner, or significant other, and 38 percent did not. Of those with an intimate partner (n=34), 16 percent said their partner used drugs regularly and 10 percent said they drank alcohol regularly. Regularly was defined as use several times a week to daily use. Of those with an intimate partner, 16 percent said that person had spent time in jail or prison and 3 percent said their intimate partner engaged in criminal activity. A majority of the Sheridan graduates had children (88 percent). Of those who had children, the sample had an average of three children, ranging from one to eight children per prisoner. The age range of their children was from under 1 year old to 31 years old. Before their re-incarceration but after their release from Sheridan, they reported spending an average of 34 hours per week with their children, ranging from no time to 168 hours per week. Thirty percent lived with their children before their return to prison and 66 percent did not (4 percent unknown). Thirty percent of the men spent no time with their children after their release from Sheridan and before their subsequent re-incarceration. Almost all Sheridan graduates said that they were close to at least one family member (94 percent). The number of family members with whom they consider themselves close ranged from 1 to over 50, with an average of 16 family members. More than half of the prisoners (54 percent) said that they had family members who drank alcohol regularly and 42 percent said family members used drugs regularly. Regularly was defined as use several times a week to daily use. More than half of the men (52 percent) said that their family members have served time in jail or prison and 20 percent said family members engaged in criminal activity. None of the participants reported being threatened, harassed, or physically hurt by a family member in the month prior to re-incarceration.
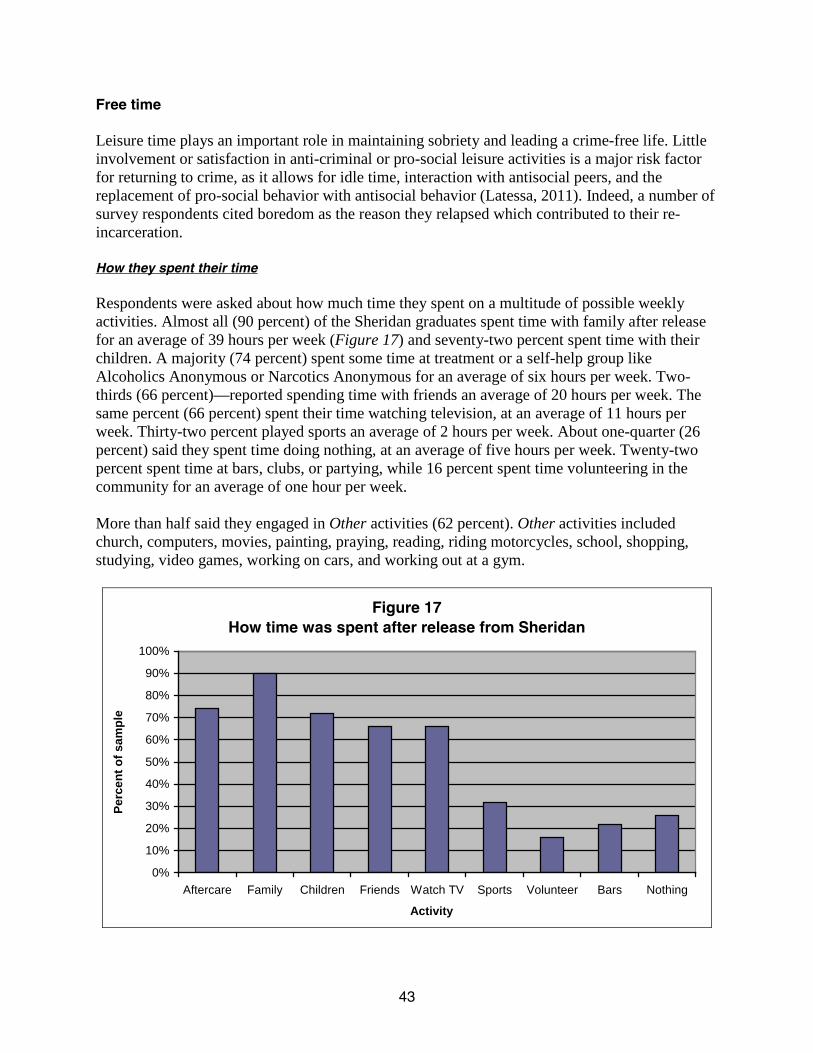
43
Free time Leisure time plays an important role in maintaining sobriety and leading a crime-free life. Little involvement or satisfaction in anti-criminal or pro-social leisure activities is a major risk factor for returning to crime, as it allows for idle time, interaction with antisocial peers, and the replacement of pro-social behavior with antisocial behavior (Latessa, 2011). Indeed, a number of survey respondents cited boredom as the reason they relapsed which contributed to their re-incarceration.
How they spent their time
Respondents were asked about how much time they spent on a multitude of possible weekly activities. Almost all (90 percent) of the Sheridan graduates spent time with family after release for an average of 39 hours per week (Figure 17) and seventy-two percent spent time with their children. A majority (74 percent) spent some time at treatment or a self-help group like Alcoholics Anonymous or Narcotics Anonymous for an average of six hours per week. Two-thirds (66 percent)—reported spending time with friends an average of 20 hours per week. The same percent (66 percent) spent their time watching television, at an average of 11 hours per week. Thirty-two percent played sports an average of 2 hours per week. About one-quarter (26 percent) said they spent time doing nothing, at an average of five hours per week. Twenty-two percent spent time at bars, clubs, or partying, while 16 percent spent time volunteering in the community for an average of one hour per week. More than half said they engaged in Other activities (62 percent). Other activities included church, computers, movies, painting, praying, reading, riding motorcycles, school, shopping, studying, video games, working on cars, and working out at a gym.
Figure 17How time was spent after release from Sheridan
0%
10%
20%
30%
40%
50%
60%
70%
80%
90%
100%
Aftercare Family Children Friends Watch TV Sports Volunteer Bars Nothing
Activity
Perc
ent o
f sam
ple

44
All of those interviewed for the study were asked who they spent their time with after their release from Sheridan. A majority spent time with family (68 percent) and 64 percent spent time with an intimate partner, significant other, or spouse. Having support from family has been found to be strongly correlated with parolee success after release (Nelson, Deess, & Allen, 1999). About half spent time with friends (46 percent) and 38 percent spent time alone. A few spent time with co-workers (10 percent). A few said Other, which included alcohol anonymous group, church, pastor, customers, halfway house groups, and recovery home residents (16 percent). Study participants were asked to provide more detail about the people with whom they spent their free time after their release from Sheridan. A total of 42 percent of the men spent free time with people who used drugs regularly and 40 percent spent free time with those who used alcohol regularly. Regularly was defined as use several times a week to daily use. About half (48 percent) spent time with individuals who had served time in jail and prison, and 24 percent spent time with individuals who served time in jail or prison while they were hanging out with them. Some spent time with people involved in a gang (22 percent). Sixty percent said they spent time with people who were unemployed.
Friends
As mentioned above, 46 percent of study participants reported spending time with friends. A majority reported that they had friends they could hang out with and not get into trouble (66 percent), but 32 percent did not (2 percent missing). The average number of friends they could hang out with and not get into trouble was four friends. Gang membership About half (52 percent) of the interviewed Sheridan graduates reported they had been an active member in a gang at one point in their lives (n=26); 46 percent had never been in a gang (n=23) (2 percent, n=1, unknown). Of those who had been in a gang (n=26), 23 percent admitted to current gang affiliation (n=6) (Figure 18). The ages when the men first joined a gang ranged from 5 years old to 18 years old, and the average age was 12 years old. The ages when the men said they quit the gang ranged from 19 years old to 35 years old, and the average age was 27 years old. The number of years spent in a gang ranged from six to 23 years, and the average number of years was 15. They gangs they reported being members of included the Gangster Disciples, Latin Kings, Black P. Stones, Vice Lords, Four Corner Hustlers, Ambrose, and Taylor Street Jousters.

45
Figure 18Gang membership status of sample
Unknown, 2%Prior/current gang, 52%
Never in gang, 46%
Employment and finances Participants were asked about their employment between release from Sheridan and re-incarceration.
Employment after release from Sheridan
A majority of those interviewed said they had a job at some point after graduating Sheridan and prior to re-incarceration (72 percent) (Figure 19). Twenty-six percent never had a job between incarcerations (2 percent unknown).
Figure 19Employment after release from Sheridan
Employed, 72%
No employment,
26%
Unknown, 2%

46
The percentage of those who completed the in-prison phase of Sheridan and had a job after leaving Sheridan is higher than what has been found in other studies. Kachnowski (2005) found 49 percent of a sample of formerly incarcerated individuals had worked at least one week in the year after release from prison. Visher, Debus, and Yahner (2008) found that 65 percent of ex-offenders had a job at some point in the eight months after release. The higher percentage of Sheridan participants that were employed post-release may reflect that Sheridan participants are provided job preparedness classes and many participate in vocational certification training programs (or differences in the current study’s sample). While there is not sufficient research to substantiate that the effectiveness of vocational and job training programs, there is evidence that these sorts of programs may work for some offenders (Travis, Solomon, & Waul, 2001). Moreover, agencies contracted with the Sheridan program such as the Safer Foundation and CSAC help some Sheridan graduates find employment upon release. Study participants were asked how many days they looked for a job. Of those who shared the number of days they looked for a job (n=30), the average number was 16.2 days, or a range of one to 100 days. In addition, the men were asked how many hours per week they looked for a job. Of those who shared how many hours they looked for a job (n=10), the average amount of time was 11.9 hours per week, a range of two to 30 hours per week. Seventy- six percent of the men interviewed for this study asserted that they had a profession, trade, or skill and 22 percent did not (2 percent unknown). Most of the men reported being employed or trained in “blue collar jobs”—five of the men said they were in the culinary profession, four said electrician, and four said welding. Some listed more than one profession, trade, or skill. Three men said carpentry, painting, and truck driving. Two said home building, construction, plumbing, and forklift. Other jobs/fields mentioned were handyman, roofing, siding, dry wall, brick layer, farmer, barber, auto mechanic, and machinist. The 50 men in our sample held a total of 69 jobs—many had multiple jobs during the time period. The most common work was found at restaurants followed by hotels. Other employment sectors included landscaping, trucking, plumbing, roofing, waste management, barber shop, car washes, and grocery stores. Of those that had jobs during the time period, 84 percent had a full-time job and 16 percent had a part-time job. Those interviewed for the study had from one to 10 different jobs between Sheridan release and re-incarceration with an average of 2 jobs. Those who had been employed worked from one to 72 months at one job, or an average of 10.8 months. At the time of re-incarceration, 60 percent of the sample reporting being employed—48 percent full-time, 10 percent part-time, and 2 percent temporarily employed (Figure 20). Some were unemployed (28 percent), 10 percent were students and 2 percent were volunteers. On average, the men in the sample were paid for about 13 of the 30 days prior to their re-incarceration.

47
Figure 20Employment after Sheridan prior to
re-incarceration
Unemployed, 28%
Full-time, 48% Part-time, 10%
Volunteer, 2%
Temporary, 2%
Student, 10%
Many of the men said it was very easy to keep a job (40 percent). A total of 18 percent said it was somewhat easy to keep a job, 6 percent said it was somewhat hard to keep a job, and 6 percent said it was hard to keep a job.
How first paycheck was spent
The individuals who successfully completed the in-prison phase of Sheridan interviewed for this study were asked what they did with their first paycheck. While suddenly having a lot of cash is a common relapse trigger (RelapsePrevention.org, n.d.), just six men reported spending a first paycheck on alcohol or drugs. Many spent money on practical things, such as food and clothing. Some gave money to their children and family. Some even put the money in the bank. Specifically, spending money on clothes or shoes was mentioned 13 times, giving money to a family member was mentioned 10 times, putting their money in the bank or savings was mentioned seven times, and paying bills was mentioned seven times. Spending money on children was mentioned six times, food four times, and rent twice. Other things they said they spent their first paycheck on included a truck, DVDs, cigarettes, girlfriend, and cell phone. One man said he bought a tent and sleeping bag.
Sources of income
Study participants were asked to share the best estimate of their total personal income for the year before taxes from all sources, including illegal income. Their average income was $25,700 per year. A majority (84 percent) of those interviewed said that someone contributed to their support, typically a significant other or a family member (i.e. parent, sibling, cousin). One man mentioned how his mother’s contribution led to criminal activity. He said, “Mom gave me the

48
money to start buying drugs for selling.” Many men mentioned receiving financial support from more than one person. Friends were also mentioned as persons who contributed to support. Slightly more than half (56 percent) of the sample said they had illegal sources of income. Many (42 percent) did not have an illegal income source and one person (2 percent) did not want to answer. Twelve men said they were selling drugs, eight said they committed theft, and three said they committed robbery or burglary. Two men said they committed credit card and check fraud.
How money was spent
The Sheridan graduates in our sample were asked, “On what did you spend your money?” The most common response was clothing or shoes (Figure 21) followed by drugs and/or alcohol. Other common responses were spending money on children or child support, food, bills, cars or gas, and rent. One man said he was spending money on his family “trying to make up for years when I wasn't there.” Five of the interviewees said they spent money on entertainment, three on cigarettes, and two on jewelry. Two said they put their money in savings. Other responses were that money was spent on guns, medicine, work supplies, girlfriend, and church. Many of the men listed more than one area in which they spent their money.
Figure 21How money was spent after release from Sheridan
0
5
10
15
20
25
30
35
40
45
50
Clothing Drugs/alcohol Children Food Bills Cars
Expenses
Num
ber i
n sa
mpl
e
Debt
The Sheridan graduates interviewed for this study were asked if they were in debt and if so, how much debt they had at the time of the interview. Debt could include credit cards, court costs and fees, or child support. Sixty percent report no debt (n=30) and 40 percent did report being in debt (n=20). The men’s debt ranged from $75 to $80,000. Of those with debt, the average amount of debt was $6,779. The median (or middle amount) was $7,258. The total sum of debt for the 20 men with debt interviewed for this study was $338,956.
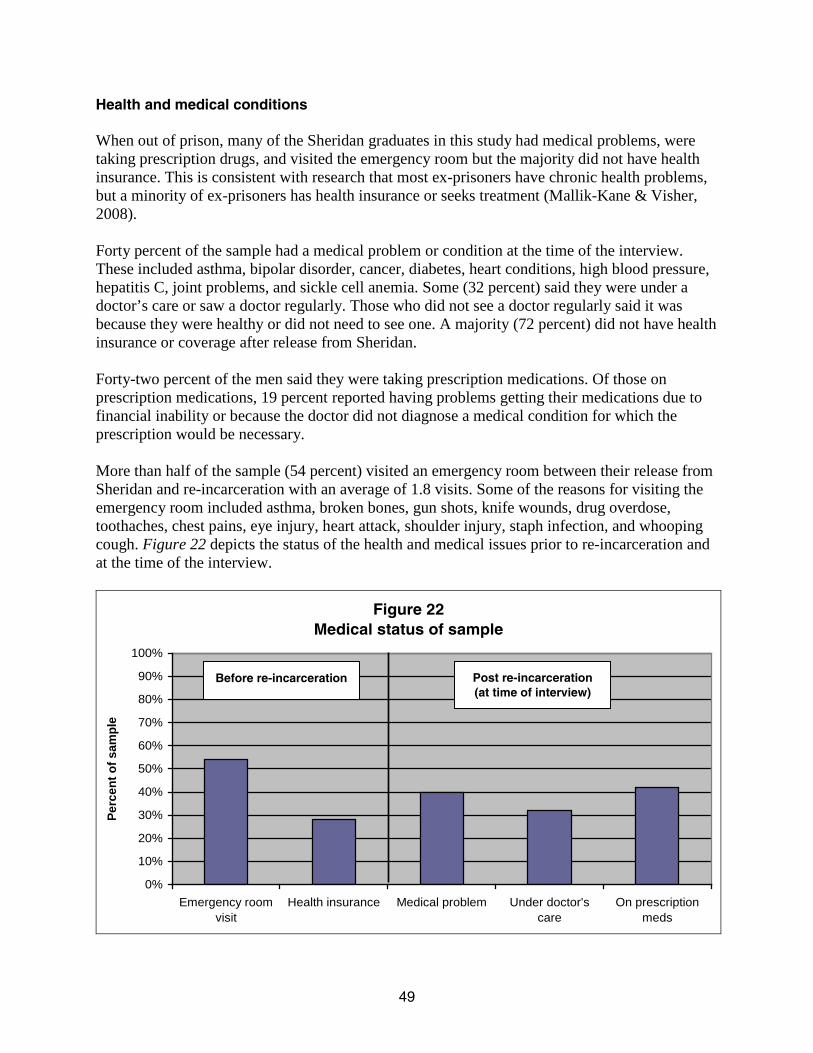
49
Health and medical conditions When out of prison, many of the Sheridan graduates in this study had medical problems, were taking prescription drugs, and visited the emergency room but the majority did not have health insurance. This is consistent with research that most ex-prisoners have chronic health problems, but a minority of ex-prisoners has health insurance or seeks treatment (Mallik-Kane & Visher, 2008). Forty percent of the sample had a medical problem or condition at the time of the interview. These included asthma, bipolar disorder, cancer, diabetes, heart conditions, high blood pressure, hepatitis C, joint problems, and sickle cell anemia. Some (32 percent) said they were under a doctor’s care or saw a doctor regularly. Those who did not see a doctor regularly said it was because they were healthy or did not need to see one. A majority (72 percent) did not have health insurance or coverage after release from Sheridan. Forty-two percent of the men said they were taking prescription medications. Of those on prescription medications, 19 percent reported having problems getting their medications due to financial inability or because the doctor did not diagnose a medical condition for which the prescription would be necessary. More than half of the sample (54 percent) visited an emergency room between their release from Sheridan and re-incarceration with an average of 1.8 visits. Some of the reasons for visiting the emergency room included asthma, broken bones, gun shots, knife wounds, drug overdose, toothaches, chest pains, eye injury, heart attack, shoulder injury, staph infection, and whooping cough. Figure 22 depicts the status of the health and medical issues prior to re-incarceration and at the time of the interview.
Figure 22Medical status of sample
0%
10%
20%
30%
40%
50%
60%
70%
80%
90%
100%
Emergency roomvisit
Health insurance Medical problem Under doctor'scare
On prescriptionmeds
Perc
ent o
f sam
ple
Before re-incarceration
Post re-incarceration (at time of interview)

50
Relapse Drug and alcohol dependence is a chronic medical condition and like many chronic conditions, relapse is both common and likely. McLellan, Lewis, O’Brien, and Kleber (2000) found that drug relapse rates are similar to the relapse rates of other chronic conditions such as asthma, diabetes, and hypertension. Between 40 and 60 percent of drug addicts relapse whereas 30 to 50 percent of those with diabetes and 50 to 70 percent of those with either hypertension or asthma experience a relapse episode (National Institute on Drug Abuse, n.d.). Long-term drug abuse can significantly alter the way the brain functions even long after the person has stopped using drugs or alcohol. These changes to the brain have many behavioral consequences including the inability to exert control over the impulse to use drugs despite adverse consequences (National Institute on Drug Abuse, 2009). McLellan et al. (2000) suggests that, similar to other chronic illnesses, drug dependence needs to be treated with long-term care strategies and not as an acute illness. At this time, relapse is not defined in any universally accepted way (Connors, Donovan, & DiClemente, 2001). For purposes of this report, the conservative definition of relapse is any use of drugs or alcohol. Substance use after Sheridan A high percentage of the men in our sample reported relapsing after completing the Sheridan program. Again, this may be due to the fact that all of the Sheridan graduates in the study were re-incarcerated. Almost the entire sample said they relapsed by using drugs or alcohol (n=45) (90 percent). Five men reported that they did not relapse. Many relapsed with both drugs and alcohol. A majority of the sample (76 percent) said they relapsed by using drugs after release from Sheridan (n=38). A total of 64 percent of the men said they relapsed by using alcohol (n=32) (Figure 23).
Figure 23Percent of sample who relapsed after Sheridan
0%
10%
20%
30%
40%
50%
60%
70%
80%
90%
100%
Relapsed-any substance Relapsed-alcohol Relapsed-drugs
Perc
ent o
f sam
ple

51
*Of those who relapsed (n=44) Of those who relapsed with alcohol (n=32) Of those who relapsed with drugs (n=38)
The men that relapsed (90 percent of the sample) were asked to describe the main contributing factor to their relapse. They commonly cited boredom, pressure of being around friends who used, as well as the enjoyment of using drugs. Also cited were depression, stress, and familial pressure, and failure to attend support group meetings. Time after release to relapse Of those who relapsed (n= 45), the average number of days to relapse was 149 (SD=226.15)). The median (middle number) and the mode (most common number) were both 45 days. The number of days between release from Sheridan and relapse ranged from less than 24 hours to 720 days (almost two years). Of the 38 men who relapsed with drugs, the average number of days before resuming drug use after release from Sheridan was 163 days. The range of days before using drugs was one to 720 days (almost two years). The median number was 60 days and the mode was 45 days (n=5). Of the 32 men who relapsed by using alcohol, the average number of days before resuming alcohol use after release from Sheridan was 154 days. The range of days before using alcohol was one to 720 days (almost two years). The median number was 45 days and the mode was one day (n=4). Figure 24 shares the average time in months to relapse upon release.
Figure 24Average time in months to relapse after Sheridan*
0
1
2
3
4
5
6
Relapse-any substance Relapse-alcohol Relapse-drugs
Ave
rage
num
ber o
f mon
ths
There were several factors found to be associated with the time before relapse including age, aftercare completion, peers, and gang involvement. Again, relapse was defined as any substance use. Figure 25 depicts the average time in days to relapse after Sheridan by age group, gang involvement, and aftercare participation.

52
Figure 25Average time in days to relapse after Sheridan by age group, gang involvement, and aftercare
Yes19-29 Yes No30+ No0
50
100
150
200
250
300
Age Gang involvement Aftercare
Ave
rage
tim
e in
day
s
Age at Sheridan release and relapse
Of those that relapsed (n=45), 47 percent were between 19 and 29 years of age and 53 percent were 30 years of age or older at the age of exit from Sheridan. A significant positive correlation existed between prisoner age at time of Sheridan exit and amount of time before relapse (rs=.576, n=45, p < .001, two-tailed). Younger study participants, under age 30, on average relapsed sooner (mean=58.71 days; SD=156.77) than older study participants, age 30 or older (mean=227.42 days; SD=250.22). A Mann-Whitney test revealed a significant difference between younger and older prisoners in the amount of time before relapse (U = 92.000, N1 = 21, N2
= 24, p < .001, two-tailed).
These finding are consistent with a study that found older adults usually stay in treatment longer and have more positive treatment outcomes than younger adults (Satre, Mertens, Areán, & Weisner, 2004). Moreover, Oslin, Pettinati, and Volpicelli (2002) found that when compared to younger adults, older adults attend treatment more frequently which translates into lower relapse rates than the young adult population.
Aftercare completion and relapse
A significant positive correlation existed between completing aftercare and the number of days until relapse (rs = .319, n = 42, p = .039, two-tailed). Those who completed aftercare delayed relapse longer. Of those that attended aftercare, 50 percent completed aftercare (n = 21). Those individuals refrained from substance use longer (mean = 251.48 days; SD = 279.15) than those who did not complete aftercare (mean = 38.95 days; SD = 40.70). A Mann-Whitney test revealed a significant difference between those that completed aftercare to those who did not complete aftercare when comparing the amount of time before relapse (U = 139.500, N1 = 21, N2 = 21, p = .041, two-tailed). This finding is consistent with prior research showing that inmates who

53
complete both in-prison treatment and community aftercare have the most success in preventing or delaying relapse (Knight, Hiller, Simpson, & Broome, 1998; Martin, Butzin, Saum & Inciardi, 1999; Nielsen, Scarpitti, & Inciardi, 1996; Wexler, DeLeon, Kressel, & Peters 1999).
High-risk people and relapse
A significant negative correlation was found between the number of days to relapse and spending time with persons engaging in risky activities after release—defined as individuals engaging in substance use and/or criminal activity (rs = -.318, n = 43, p = .037, two-tailed). Study participants that reported spending time with persons who engage in risky activities on average relapsed sooner (mean = 64.61 days; SD = 114.25) than those who did not report spending time with persons who engage in risky activities (mean = 241.55 days; SD = 287.02). Visher and Courtney (2007) found similar results—men who had family members who used drugs were more likely to return to drug use themselves and used drugs early on after prison release. Furthermore, frequently surrounding oneself by friends who use drugs or alcohol is likely to lead to substance use or relapse as peers typically have a significant influence over each other’s behaviors (Marks, 2009). A Mann-Whitney test revealed a significant difference between those that spent free time with persons who engage in risky activities from those that do not when comparing the amount of time until relapse (U = 145.500, N1 = 23, N2
= 20, p = .039, two-tailed).
A significant negative correlation was found between the number of days before relapse and a history of gang involvement (r
Gang involvement and relapse
s = -.302, n= 44, p = .047, two-tailed). Gang involvement was defined as at any time being an active member in a gang. Those in the sample that reported a history of gang involvement on average relapsed sooner (mean = 111.36 days; SD = 213.57) than those who did not report any gang involvement (mean = 192.14 days; SD = 239.26). A Mann-Whitney test revealed a significant difference between those that had gang involvement from those that did not when comparing the amount of time until relapse (U = 158.000, N1 = 22, N2
= 22, p = .048, two-tailed). Research is relatively sparse on the correlation between substance use and gang involvement; however, one study revealed that youth gang members reported an increase in the frequency of their drug use once they joined a gang indicating a high prevalence of drug use among gang members (Gatti, Tremblay, Vitaro, & McDuff, 2005).
Substance use just prior to re-incarceration Study participants were asked what specific substances they used in the 30 days prior to their re-incarceration. A majority of the sample used alcohol (66 percent). They reported using alcohol for an average of 12 out of 30 days, and 38 percent used alcohol to the point of intoxication for an average of 11 days (Figure 26). About half (46 percent) of the sample used cannabis an average of 21 out of 30 days and the same percentage used cocaine an average of 16 out of 30 days. About one-fourth used heroin for an average of 23 out of 30 days. Ten percent used ecstasy and 10 percent used non-prescribed prescription drugs. Four percent used hallucinogens and 2 percent used methadone. None of the study participants reported using methamphetamine, amphetamines, or inhalants.

54
Figure 26Percent of sample that relapsed by substance
0%
10%
20%
30%
40%
50%
60%
70%
80%
90%
100%
Alcohol Alcohol tointoxication
Cannabis Cocaine Heroin Ecstacy Illegalprescription
drugsSubstances
Perc
ent o
f sam
ple
In the 30 days prior to their re-incarceration, more than half admitted to using more than one substance including alcohol per day (58 percent). Twelve percent overdosed in the 30 days prior to their incarceration. A majority of study participants (72 percent) spent money on drugs in the 30 days prior to their re-incarceration, spending an average of $1,911 during that time period. Sixty-four percent spent money on alcohol in the 30 days before being re-incarcerated, spending an average of $233. Attempts to stop substance use Of the Sheridan participants who resumed alcohol use, 21 percent attempted to stop using in the 30 days prior to being re-incarcerated. The men tried to stop an average of one time and were able to stop using for an average of one day. Of those who resumed drug use, 39 percent attempted to stop using drugs in the 30 days prior to their incarceration. The men tried to stop an average of nine times and successfully stopped use for an average of one day. Many of those interviewed attended a recovery support group in the 30 days prior to their incarceration (36 percent). Half of the inmates interviewed said the frequency of their substance use increased the longer they were out of Sheridan, and 58 percent said that the amount of drugs or alcohol used increased as time progressed.
*30 days prior to re-incarceration

55
Relapse led to re-incarceration Slightly more than half (54 percent) of the Sheridan graduates in this study said that their relapse contributed to their re-incarceration in some way. Those interviewed were asked to share how their relapse contributed to their re-incarceration. Some reported that relapsing led to bad decision-making, which, in turn, led to re-incarceration.
“When I was intoxicated, I didn't realize what I was doing or care what I was doing.” “I was too high. I beat the police up, couldn't control myself.” Others explained how relapsing led them to commit new crimes. The following are some of those comments.
“I started hanging with criminals, participating in criminal activity, robbing, stealing, dealing drugs.” “The day I got the case for being here was for going to get crack because alcohol was not cutting it. Was arrested for possession.”
“[Relapsing] caused me to steal to get money to get my drug. That’s why I'm here, for theft.”
Finally, some of the Sheridan graduates said that their relapse led to a technical violation of parole and subsequent re-incarceration. “[I failed] to report because was high. Didn't want to drop.” “TASC violated my parole due to non-compliance of drug treatment.” Recidivism In this study, recidivism was measured three ways—self-reported criminal activity, re-arrest as measured by state criminal history information, and re-incarceration to the Illinois Department of Corrections. All of those in the sample were re-incarcerated after successfully completing the in-prison phase of Sheridan. Most were found guilty of a new criminal offense, but some were found to have a technical violation of their parole. Technical violations occur when parolees violate the conditions of their parole, such as not attending treatment or using drugs. Self-reported criminal activity When asked about their criminal activity, the majority of the sample (80 percent) said they committed crimes for which they may or may not have been arrested after Sheridan release. The men in the sample reported committing a range of one to over 200 crimes with a median of two crimes.

56
Despite that most of the sample reported engaging in criminal activity, 32 percent said it was very easy to avoid committing crimes and 30 percent said it was pretty easy (Figure 27). Twenty-four percent said it was very hard and 14 percent said it was pretty hard to avoid committing crimes.
Figure 27Difficulty in avoiding commiting crimes after
Sheridan
Very easy, 32%
Pretty easy, 30%
Pretty hard, 24%
Very hard, 14%
Contributors to criminal activity Those who committed crimes after their release (n=45 or 90 percent of the sample) were asked what factors contributed to criminal activity. Sixty-three percent said financial issues, 50 percent said substance use, 35 percent said family issues, 30 percent said relationship issues, and 28 percent said work issues (Figure 28). Some (45 percent) said other things played a role in their criminal activity, including gang involvement, neighborhood, lifestyle, and peer pressure.

57
*Of those in the sample who committed crimes after release, n=45
Figure 28Factors contributing to criminal activity after Sheridan*
0%
10%
20%
30%
40%
50%
60%
70%
80%
90%
100%
Substance use Family issues Relationshipissues
Money issues Work issues
Perc
ent o
f sam
ple
More than three-fourths of the study participants (76 percent) said that something could have prevented or deterred them from criminal activity. Some said that not being with people who were negative influences, or conversely being around positive influences, would have helped. The following are some of those quotes.
“[I should have involved] myself with people that weren't involved in illegal activities… and if I had my daughter everyday.” “Getting away from the same people. Was with the same people I hung out with before Sheridan.” “Not being hard-headed, listening to older guys, not succumbing to peer pressure, not hanging out with wrong people.”
A couple of the Sheridan graduates thought a job or source of income would have helped and some of the men said that more monitoring from parole and TASC would have helped. One man shared, “Once I relapsed, I was still on parole. My parole agent never dropped me. I wished my PO would have dropped me because my relapse would have been known and I could have avoided this.”
A couple men felt it was their own lack of determination to stay out of trouble that caused their criminal activity. One man lamented, “[I could have avoided criminal activity] If I just listened to myself—the little voice in my head.” Another said, “If I would have stayed determined to stay out of trouble[I could have avoided criminal activity]. Knew outcome would be jail.”

58
A number of factors were found to be associated with the length of time before criminal activity. Age, employment and aftercare participation all demonstrated positive correlations; residing in a risky neighborhood and gang involvement had a negative correlation.
Age and self-reported criminal activity
A significant positive correlation existed between prisoner age at the time of Sheridan release and the length of time until reported criminal activity (rs= .443, n= 39, p= .005, two-tailed). Of the men that self-reported engaging in criminal activities (n=39), 46 percent were between 19 and 29 years of age, and 54 percent were 30 years of age and above. Younger participants reported engaging in criminal activities sooner (average of 176.94 days; SD= 412.10) than older participants (average of 404.81 days; SD= 443.25). A Mann-Whitney test revealed a significant difference between younger and older prisoners in the amount of time before engaging in self-reported criminal activities (U= 96.500, N1= 18, N2
= 21, p= .008, two-tailed). This finding is consistent with evaluations that found younger graduates of prison treatment programs had higher rates of re-arrest and re-incarceration (Inciardi, 2004; Welch, 2007). This finding also corresponds to crime statistics that have consistently found criminal activity peaks in the late teens and early twenties, and declines thereafter.
Employment and self-reported criminal activity
A marginally significant positive correlation was found between employment and the number of days between exiting Sheridan and self-reported criminal activity (rs=.288, n= 39, p=.075, two-tailed). Of the participants that self-reported criminal activity (n= 39), 33 percent (n=13) were not employed and 67 percent (n=26) were employed. The unemployed men on average reported engaging in criminal activities sooner (average of 168.15 days; SD = 319.95) than the employed men (average of 365.38 days; SD= 479.75). A Mann-Whitney test revealed a marginally significant difference between employed and unemployed prisoners when comparing the average amount of days before engaging in self-reported criminal activities (U=109.500, N1= 13, N2
= 26, p = .076, two-tailed). This finding is consistent with a study that found after prison treatment, employment significantly reduces re-incarceration (Welch, 2007). Employment can provide structure, positive peers, financial stability, and personal satisfaction.
Figure 29 depicts the average time in days to the first self-reported crime post-Sheridan by age group and employment.

59
Figure 29Average time in days to first crime after Sheridan
by age group and employment
19-29 Yes30+ No0
50
100
150
200
250
300
350
400
450
Age Employment
Ave
rage
tim
e in
day
s
Aftercare and self-reported criminal activity
A significant positive correlation existed between completing aftercare and the number of days until self-reported criminal activity (rs= .364, n= 36, p= .029, two-tailed). More days lapsed between exiting Sheridan and engaging in criminal activities among those who completed aftercare (n= 21) (average of 424.95 days; SD= 523.818) than those who did not (n= 15) (average of 110.07 days; SD= 117.18). A Mann-Whitney test revealed a significant difference between those that completed aftercare to those who did not complete aftercare in the amount of time before engaging in self-reported criminal activities (U= 90.500, N1= 21, N2
= 15, p= .030, two-tailed). This is consistent with a prior study on Sheridan graduates which found the largest reductions in recidivism among those who completed aftercare (Olson & Rozhon, 2011).
High-risk neighborhoods and self-reported criminal activity
A marginally significant negative correlation was found between self-reported number of days before engaging in criminal activity and the presence of drug dealing in one’s neighborhood post-Sheridan release (rs= -.297, n= 37, p= .074, two-tailed). Participants that reported the presence of drug dealing in their neighborhood reported engaging in criminal activity sooner (average of 197.26 days; SD= 355.37) than those who did not report the presence of drug dealing (average of 408.00 days; SD= 496.23). A Mann-Whitney test revealed a marginally significant difference between those who resided in neighborhoods with drug-dealing from those who did not when comparing the amount of time until engaging in self-reported criminal activities (U= 83.000, N1= 27, N2= 10, p = .074, two-tailed). This finding is consistent with a study that found a connection between drug dealing in neighborhoods and crime—either crime encourages drug dealing or that the presence of drug dealing
*Crime was self-reported.
attracts other types of crime (Ford & Beveridge, 2006).

60
Gang involvement and self-reported criminal activity
A marginally significant negative correlation was found between the number of days prisoners refrained from criminal activity and gang involvement (rs= -.312, n= 39, p= .053, two-tailed). Gang involvement was defined as at any time being an active member in a gang. Participants that reported gang involvement stated engaging in criminal activity sooner (average of 207.19 days; SD= 394.91) than those who did not report any gang involvement (average of 407.50 days; SD= 473.51). A Mann-Whitney test revealed a marginally significant difference between those who had gang involvement from those who did not when comparing the amount of time until self-reported criminal activity (U= 121.000, N1= 21, N2
= 18, p= .055, two-tailed). This is understandable as criminal activity is often a central activity of gangs (Esbensen, 2000).
Arrest after Sheridan, before re-incarceration The Authority’s Criminal History Record Information (CHRI) Ad Hoc datasets provided the arrest charges of those interviewed after Sheridan and prior to re-incarceration. It was possible to retrieve the history of arrests and convictions in an electronic format for all the men in the study. A majority (90 percent) were arrested after their release from Sheridan (n=45). Of those that were re-arrested, the average amount of days between leaving Sheridan and the offense date was 339 days (SD= 313.15), ranging from 2 to 1,252 days (almost three and a half years). The sample averaged 2.1 arrests (SD= 2.2), ranging from 0 to 12 after Sheridan and prior to re-incarceration. Of these subsequent arrests, 63 percent were for felony offenses, 32 percent misdemeanor offenses, and 5 percent for Other. Altogether though, the sample averaged 1.3 felony arrests, ranging from 0 to 5, and 0.82 misdemeanor arrests, ranging from 0 to 12. Figure 30 indicates the most serious arrest charge for each person by offense type. The offense type categories were derived from CHRI datasets by the use of an internal hierarchy. Person offenses include all non-sex offenses against a person.

61
Source: ICJIA analysis of CHRI data
Figure 30Arrest charges of sample by offense type
after Sheridan, before re-incarceration
0%
10%
20%
30%
40%
50%
60%
70%
80%
90%
100%
Person Property Drug Weapon Other
Offense type
Perc
ent o
f sam
ple
Re-incarceration All survey respondents were asked to describe what led up to their re-incarceration after they were released from Sheridan. Frequently, survey respondents stated that they were doing well and then returned to substance use: “I was doing good and then I started partying. It escalated until I got locked up.”
“When I got out I was real motivated about treatment but then I got complacent. I got everything in order so then I thought I could go back and use.” “Was doing good, working with animals and the farm. The kids were all doing good. Then I started drinking again. I had a binge of 18 hours drinking and I committed a crime.”
Financial uncertainty and pressure were also factors that respondents used to explain the circumstances that led up to their re-incarceration during the reentry period. One man said, “I needed money so I started selling drugs.”
A lack of judgment also played a central role in many of the interviewee’s re-incarceration.
“I was not using the tools that Sheridan provided me. I was doing it my way instead.”

62
“I think I left the recovery home prematurely. I hadn’t established a support group of people who were not getting high yet. I didn’t have anybody because my support group was in the recovery home.”
A majority of study participants (82 percent) were re-incarcerated for new convictions and sentences to IDOC or new arrests while on MSR and 18 percent were re-incarcerated for technical violations. The criminal offenses for which study participants were re-incarcerated on new sentences varied but the most common were property and drug offenses. Table 7 shares the criminal offenses, as well as offenses by offense type. If the offender was a parole violator, the offenses are their original prison offenses.
Table 7 Re-incarceration offenses of sample
n Percent Offense types Property 19 38% Drug 15 30% Person 4 8% Weapons 2 4% Traffic 1 2% Technical violation 9 18% TOTAL 50 100% Specific criminal offenses Burglary 7 14% Possession of a controlled substance 6 12% Retail theft 4 8% Aggravated battery 3 6% Residential burglary 3 6% Possession/delivery of other amount of narcotic 3 6% Delivery at a school, high school, or park 2 4% Manufacturing/delivery of between 15 and 100 grams of cocaine/crack
2 4%
Possession of narcotics schedule I or II at a school, high school, or park
2 4%
Theft 2 4% Armed habitual criminal 1 2% Armed robbery 1 2% Attempted burglary 1 2% DUI 1 2% Felony possession of a weapon 1 2% Home invasion 1 2% Robbery 1 2% Technical violation 9 18% TOTAL 50 100%

63
Source of crime data: self reported in interviews Source of arrest data: ICJIA analysis of CHRI data Source of re-incarceration data: IDOC
Time to re-incarceration
On average, the Sheridan graduates in the study spent 738 days in the community (about two years) before returning to IDOC. The range was 40 to 2,096 days (over five-and-a-half years). The median, or middle number, was 593 days (just over a year-and-a half). A majority (82 percent, n=41) of study participants were re-incarcerated for new crimes and 18 percent were re-incarcerated for technical violations (n=9). The number of study participants re-incarcerated for a new crime versus a technical violation is much higher than the state average. In 2004, 52 percent of re-incarcerated inmates were back in prison for new crimes whereas 48 percent were for technical violations (Pew Center on the States, 2011). In this study, the high number of incarcerations for new crimes may simply be due to the sample, which may not be representative of all Sheridan participants, or it could reflect the use of graduated sanctions in the parole supervision process. Figure 31 depicts the types of recidivism experienced by this sample of 50 graduates of the in-prison portion of the Sheridan program. It should be remembered that all participants in the study were re-incarcerated and the sample is not representative of all Sheridan graduates or all Sheridan graduates who are re-incarcerated. Almost all participants in this study self reported committing a crime (78 percent) and 90 percent were arrested. Some re-arrests could result in technical violations. All were re-incarcerated—82 percent for new crimes and 18 percent for technical violations.
Figure 31Percent of sample by recidivism type after Sheridan
0%
10%
20%
30%
40%
50%
60%
70%
80%
90%
100%
Committed a crime Arrested Re-incarcerated
Perc
ent o
f sam
ple Technical
violator
Newoffense

64
Figure 32 illustrates the average length of time in days until recidivating. Again, recidivism is defined as self-reported criminal activity, arrest, or re-incarceration. The average number of days to first crime was 300, to first arrest was 339 days, and to re-incarceration was 739 days.
Figure 32Average time in days to recidivism after Sheridan*
0
100
200
300
400
500
600
700
800
Commit first crime First arrest Re-incarceration
Ave
rage
num
ber o
f day
s
Additional comments Survey respondents were given an opportunity to make general comments. A number of respondents said that they would go back to Sheridan if given the opportunity. Some Sheridan graduates said they liked the program but it was difficult to apply what they had learned when they re-entered the community. One said, “I loved the program, but when you get out the world hits you, like bills and children. You need money to look for a job. It’s rough. I was depressed because I couldn’t help my family.” Several people also emphasized the need to really want to make the change in order to be successful.
“If you are just faking it to make it at Sheridan, you are not ready to change. If you put something in the program, you get something out of it. At Sheridan, you get to find out who you are really are. It changes your thinking so it is not distorted.”
*Of those who self-reported crime, n=39 Of those who were arrested, n=45 Of those who were re-incarcerated, n=50
Source of crime data: self-reported in interviews Source of arrest data: ICJIA analysis of CHRI data Source of re-incarceration data: IDOC

65
Implications for policy and practice The following implications for policy and practice were revealed in this study and could help improve the Sheridan program. Expand eligibility of the Sheridan program The current policy at Sheridan dictates that individuals may participate in the Sheridan treatment program only one time. Graduates of Sheridan are allowed to later go to Southwestern Illinois Correctional Center (SWICC), the other fully-dedicated treatment prison. However, due to the fact that SWICC is a minimum security prison, many Sheridan participants (most requiring a medium security setting) will not qualify for that program. A number of study participants expressed that they would like to return to Sheridan. Given the prevalence of relapse and the higher rates of recidivism among men with substance use issues, it is likely that many will need to undergo treatment more than once and could benefit by again participating in the Sheridan program. Although Sheridan is more expensive than a non-treatment prison, the feasibility of allowing re-incarcerated Sheridan graduates to return to the therapeutic community in some capacity should be explored. One option could include a specialized track within the Sheridan program for these men. A second possibility would be to allow re-incarcerated Sheridan graduates to serve a certain amount of time at the end of their sentence at Sheridan. Further train program stakeholders In order to maximize program benefits, all program stakeholders should have a basic knowledge of substance abuse and therapeutic communities. However, comments from study participants indicated otherwise. While Sheridan does provide cross-training for correctional staff in which they learn about the therapeutic community as well as substance use disorders, it is currently offered once or twice a year and to a limited number of staff. It would be advantageous for all Sheridan correctional staff, parole staff who work with Sheridan parolees, and treatment and community providers to participate in this type of ongoing training. In addition, it is imperative that all community partners (i.e. aftercare provider, TASC case manager, CSAC, the Safer Foundation, parole and any other relevant service provider) communicate with each other to assure a cohesive approach and a unified reentry network. It is important that each provider know what services the participant is receiving, as well as his progression or any setbacks with these services or in his treatment.

66
Make expectations clearer to participants Participants in the program reported lacking information. Many participants reported that they did not fully understand what was internally offered and required at Sheridan as well as the post-release obligations once they left Sheridan. Similarly, a number of clients were unclear regarding the roles of TASC and the Safer Foundation post-release. The Sheridan client orientation may need to be revamped as participants have confusion regarding vendor roles, services, and requirements. IDOC, WestCare, TASC, and the Safer Foundation should give a thorough orientation to all clients upon entry and just prior to clients beginning to utilize their services, including an explicit written description of their programs. Continuous refreshers should also be offered. It is also imperative that the staff who conduct the screening and referrals for Sheridan at the Reception and Classification Centers are unambiguous, accurate, and thorough with potential Sheridan participants on all the program requisites. It would be beneficial if all external community agency representatives—offender’s parole agent, aftercare provider, TASC case manager, and the Safer Foundation representative—were present at the 30-day parole discharge staffing. Just more than half of the study participants said that their specific parole agent did not attend those meetings and it is not certain if external community agencies attend. During this staffing, the details of the individual’s parole plan, placement details, service delivery goals, and objectives are reviewed with the participant in order to achieve a seamless transition into the community (Illinois Department of Corrections, 2006). It is crucial that Sheridan participants have clear and realistic expectations of what each program component requires and offers both pre- and post release. Further prepare graduates to remain crime and substance-free Gauge risk of Sheridan graduates Sheridan does not utilize any standardized risk assessment instrument for post-release supervision or aftercare placement decisions. A standardized risk assessment could help make more systemized aftercare recommendations and aid parole in allotting resources toward offenders who are particularly high-risk. IDOC is part of a recently convened a Risk, Assets, and Needs Assessment (RANA) Task Force that is investigating the possibility of a standardized assessment that would be utilized in post-release supervision for all IDOC facilities including Sheridan. Make Sheridan program applicable to the “real world” Sheridan is a controlled environment; when graduates return to the community, they are faced with temptations and stressors that they did not have to confront while incarcerated. Several study participants cited this as a shortcoming of the Sheridan program. It is crucial that Sheridan find a way to make the in-prison experience pertinent to real world situations. Role playing and detailed reentry and contingency planning may be ways to accomplish this.

67
Add assistance for younger participants This study’s data indicated that younger Sheridan participants are in need of additional post-release preparation. Younger offenders were correlated with relapsing and recidivating sooner and being less engaged in the Sheridan program than older offenders. In a longitudinal study by the National Institute of Mental Health, it was found that brain development, specifically the brain functioning related to reasoning and problem solving, is the last to mature and does not occur until the early twenties suggesting that different treatment and supervision approaches may need to be used with these offenders (2004). Therefore, it would be advantageous to focus special attention and interventions on this population. Presently, WestCare provides a Young Men’s Aggression Management program for Sheridan participants between the ages of 17 and 24. Other enhanced best-practice interventions, including those that address treatment readiness and engagement, criminal thinking, and substance use among young adults, should be included in the program. Post-release, these young offenders may need increased monitoring and support services to help them maintain their sobriety and avoid returning to crime. Address neighborhood challenges This study found that, on average, Sheridan participants returning to the same neighborhood relapsed sooner than those who did not return to the same neighborhood, and that those living in risky neighborhoods—perceived by the respondent as unsafe and/or drug dealing common—relapsed sooner than those living in non-risky neighborhoods. These findings indicate that neighborhoods need to be examined in a systematic way for potential challenges such as widespread drug dealing and high crime rates. For those participants returning to the same neighborhood or risky areas, a special emphasis should be placed on relapse prevention plans and ways to avoid relapse triggers and former hangouts. Latkin (2009) points out that if clinicians had data on neighborhoods to which participants are returning, they could identify potential challenges and work with their clients on how to avoid and manage these environmental triggers. Further prepare graduates to gain employment Not surprisingly, the lack of a job and money was frequently cited as reasons why study participants either relapsed or returned to crime. Sheridan should be commended for incorporating vocational training, employment readiness, and pre-release job fairs into its program model. However, the program should revisit the vocational sectors in which participants are being trained to ensure those sectors have high job demand and are willing to hire ex-offenders. Moreover, community agencies, such as Community Support Advisory Councils and the Safer Foundation, should continue to advocate in the business and legislative arenas for easing the barriers and increasing incentives for hiring ex-offenders.
68
Conclusion Substance abuse is a rampant problem in society and directly associated with criminal activity. Substance abusers pose a significant problem for corrections because an estimated three-fourths of all prisoners are in need of substance abuse treatment (General Accounting Office, 1991); and, while recidivism rates are high among all offenders, they are even higher for those with substance abuse issues (Belenko, 2006). The period immediately following release from prison (reentry) is a particularly challenging one as ex-offenders transition from prison life to the community. Those individuals with substance use disorders have the additional challenge of trying to stay clean and sober. The problem of incarcerating substance users is not only costly, but has a negative impact on society, communities, and families. Sheridan Correctional Center National Model Drug Prison and Reentry Program (Sheridan) is a fully-dedicated modified therapeutic community designed to address the myriad needs of substance abusing offenders. All Sheridan inmates are required to participate in substance abuse treatment, vocational and/or educational training, and employment readiness programming. After prison, all must complete aftercare, or community-based treatment. Prior research has shown reductions in recidivism among Sheridan graduates compared to other prisoners (Olson & Rozhon, 2011; Olson, Rozhon, & Powers, 2009). This study was designed to expand upon prior research by interviewing those who completed the in-prison phase of Sheridan but were subsequently re-incarcerated. The interviews gathered personal information and insights, as well as their opinions of the multiple components of the Sheridan program, aftercare, and parole. Although re-incarcerated, many of the men were very engaged in Sheridan and felt prepared for success after release. A majority of the participants in this study got help with employment and found housing. Most thought Sheridan was more helpful to them than a regular prison. Despite the many benefits and positive views of Sheridan, a majority of the sample relapsed and reported illegal sources of income. The neighborhoods they lived in were many times unsafe and exposed them to drugs and drug dealing. While all of those interviewed may be deemed “unsuccessful” because they were re-incarcerated after Sheridan, long-term benefits from participation in the program were still realized. There is a body of literature that focuses on harm reduction which recognizes that although harmful behaviors continue, individuals can engage in them to a lesser extent or in safer ways. This study found some participants had reductions in criminal activity or substance use. Other gains by Sheridan participants included obtaining and keeping a job and learning to manage money for the first time. This study attempted to address gaps in research on graduates of prison-based treatment post-release by learning about the experiences and views of a sample of graduates from a drug treatment prison who returned to prison. The study took a unique, in-depth look at a sample of Sheridan participants to obtain their perceptions of the program elements. This study, as well as prior research, indicates Sheridan has benefits to its participants, communities, and the state of

69
Illinois. This study provides a better understanding of the Sheridan population and Sheridan program elements, as well as recommendations to build upon its success. This study, however, did not examine graduates of the Sheridan program who were never re-incarcerated. Their insights could provide additional information for program enhancements. The Sheridan program has shown promise and hopefully, this study can further foster its success.

70
References of Justice Statistics American Psychological Association. (2004). Inmate drug abuse treatment slows prison’s
revolving door. Retrieved from http://www.apa.org/research/action/aftercare.aspx. Anonymous. (2002). Prison and beyond: The stigma that never fades. The Economist, 25-27. Aos, S., Miller, M., & Drake, D. (2006). Evidence-based adult corrections programs: What
works and what does not. Olympia, WA: Washington State Institute for Public Policy. Belenko, S. (2006). Assessing released inmates for substance-abuse-related service needs. Crime
and Delinquency, 52(1), 94-113.
Brooks, L.E., Solomon, A.L., Kohl, R., Osborne, J.W.L., Reid, J., McDonald, S.M., & Hoover, H.M. (April 2008). Reincarcerated: The experiences of men returning to Massachusetts prisons. Washington, DC: The Urban Institute.
Bucklen, K.B. (2006). The Pennsylvania’s Department of Corrections parole violator study
(phase 2). Research in Review, 9(4). Bursik, R.J. (1988) Social disorganization and theories of crime and delinquency: Problems and
prospects. Criminology, 26(4): 519-552. Chanhatasilpa, C., MacKenzie, D.L., & Hickman, L.J. (2000). The effectiveness of community-
based programs for chemically dependent offenders: A review of the assessment of the research. Journal of Substance Abuse Treatment, 19, 383-393.
Cohen, M.A. (2001). To treat or not to treat? A financial perspective. In C.R. Hollin (Ed.)
Handbook of Offender Assessment and Treatment. New York, NY: John Wiley & Sons. Connors, G.J., Donovan, D.M., & DiClemente, C.C. (2001). Substance abuse treatment and the
stages of change. New York: Guilford Press. De Leon, G., Melnick, G., Thomas, G., Kressel, D., & Wexler, H.K. (2000). Motivation for
treatment in a prison-based therapeutic community. American Journal of Drug and Alcohol Abuse, 26(1), 33–46.
Esbensen, F. (September 2000). Preventing adolescent gang involvement. Juvenile Justice
Bulletin. Washington, DC: U.S. Department of Justice, Office of Justice Programs, Office of Juvenile Justice and Delinquency Prevention.
Farabee, D., Prendergast, M., Cartier, J., Wexler, H., Knight, K., & Anglin, M.D. (1999).
Barriers to implementing effective correctional drug treatment programs. The Prison Journal, 79, 150-162.

71
Ford, J.M. & Beveridge, A.A. (2006). Neighborhood crime victimization, drug use and drug sales: Results from the "Fighting Back" evaluation. Journal of Drug Issues, 36(2), 393-416.
Fretz, R., Heilbrun, K., & Brown, D. (2005). Outcome research as an integral component of
performance-based offender treatment. Corrections Compendium, Vol. 29(4), 1-4. Gatti, U., Tremblay, R., Vitaro, F., & McDuff, P. (2005). Youth gangs, delinquency and drug
use: A test of the selection, facilitation, and enhancement hypotheses. Journal of Child Psychology and Psychiatry, 46, 1178-1190.
General Accounting Office. (1991, April). Mentally ill inmates: Better data would help
determine protection and advocacy needs. Washington, DC: author. Gerstein, D.R., Datta, R.A., Ingels, J.S., Johnson, R.A., Rasinski, K.A., Schildhouse, S., &
Talley, K. (1997). Final report: National treatment improvement evaluation study. National Opinion Research Center, Chicago, IL.
Glaze, L.E. & Bonczar, T.P. (December 2009). Probation and parole in the United States, 2008.
Washington, DC: Bureau of Justice Statistics. Griffith, J.D., Hiller, M.L., Knight, K., & Simpson, D.D. (1999). A cost-effectiveness analysis of
in-prison therapeutic community treatment and risk classification. The Prison Journal, 79, 352-368.
Hairston, C.F. (1991). Family ties during imprisonment: important to whom and for what?
Journal of Sociology and Social Welfare, 18, 87-104. Illinois Department of Corrections. Department Data. Springfield, IL: author. Retrieved from
http://www.idoc.state.il.us/subsections/reports/department_data/Department%20Data%202005.pdf
Illinois Department of Corrections. (2003). Sheridan national model drug prison & reentry
program: Working to reduce a leading cause of crime in Illinois. Press release. Springfield, IL: author.
Illinois Department of Corrections. (2006). Sheridan Correctional Center national drug prison
and reentry therapeutic community. Integrated standard operation procedure manual. Springfield, IL: author.
Illinois Department of Corrections. (2004). Sheridan National Model Drug Prison & Reentry
Program: Working to reduce a leading cause of crime in Illinois. Press Release. Springfield, IL: author.
Illinois State Police. (2010). Crime in Illinois. Springfield, IL: Author.

72
Incardi, J.A., Martin, S.S., & Butzin, C.A. (2004). Five-year outcomes of therapeutic community treatment of drug-involved offenders after release from prison. Crime and Delinquency, 50, 88-107.
Jones, R.J., Karr, S.P., Olson, B.W., & Urbas, S.M. (2005). Illinois Department of Corrections
statistical presentation 2004, Illinois Department of Corrections. Retrieved from http://www.idoc.state.il.us/subsections/reports/department_data/Department%20Data%202005.pdf
Kachnowski, V. (2005). Returning home Illinois policy brief: Employment and prisoner reentry.
Washington, D.C.: The Urban Institute. Knight, K., Hiller, M.L, Simpson, D.D., & Broome, K.M. (1998). The validity of self-reported
cocaine use in a criminal justice treatment sample. American Journal of Drug and Alcohol Abuse, 24, 647-660.
Knight, K, Simpson, D.D., & Hiller, M.L. (1999). Three-year re-incarceration outcomes for in-
prison therapeutic community treatment in Texas. The Prison Journal, 79, 337-351. Kohl, R., Hoover, H.M., McDonald, S.M., & Solomon, A. (2008) Massachusetts recidivism
study: A closer look at releases and returns to prison. Washington, DC: The Urban Institute Langan, P. A., & Levin, D. J. (2002). Recidivism of prisoners released in 1994 (NCJ 193427).
Washington, DC: Bureau of Justice Statistics, U.S. Department of Justice. Latessa, E.J. (February 24, 2011). Understanding the risk and needs principles and their
application to offender reentry. PowerPoint lecture presented at Second Chance Act Conference, Washington, DC.
Latkin, C. (2009). Identifying neighborhood stressors in assessment of drug treatment continuity
and relapse. The American Journal of Psychiatry, 166, 1207-1208. La Vigne, N.G., Mamalian, C.A., Travis, J., & Visher, C. (2003). A portrait of prisoner reentry
in Illinois. Washington, DC: The Urban Institute. Mallik-Kane, K. & Visher, C.A. (2008). Health and prisoner reentry: How physical, mental, and
substance abuse conditions shape the process of reintegration. Washington, DC: The Urban Institute.
Marks, H. (2009). Risk factors for drug addiction and alcoholism. Retrieved from
http://www.everydayhealth.com/addiction/drug-addiction-and-alcoholism-risk-factors.aspx
Martin, S. S., Butzin, C. A., Saum, S. A., & Inciardi, J. A. (1999). Three-year outcomes of
therapeutic community treatment for drug-involved offenders in Delaware. The Prison Journal, 79, 294-320.

73
McLellan, A.T., Lewis, D.C., O’Brien, C.P., & Kleber, H.D. (2000). Drug dependence, a chronic
medical illness: implications for treatment, insurance, and outcomes evaluation. The Journal of the American Medical Association, 284(13), 1689-1695.
Mears, D.P, Winterfield, L., Hunsaker, J., Moore, G.E., & White, R.M. (2003). Drug treatment
in the criminal justice system: The current state of knowledge. Washington, D.C.: The Urban Institute.
Mitchell, O., Wilson, D.B., & MacKenzie, D.L. (2005). The effectiveness of incarceration-based
drug treatment on criminal behavior. Submitted to the Campbell Collaboration, Criminal Justice Review Group.
Mitchell, O., Wilson, D.B., & MacKenzie, D.L. (2007). Does incarceration-based drug treatment
reduce recidivism? A meta-analytic synthesis of the research. Journal of Experimental Criminology, 3, 353–375.
Mumola, C.J. & Karberg, J.C. (October 2006). Drug use and dependence, state and
federal prisoners, 2004. Washington, DC: U.S. Department of Justice, Office of Justice Programs, Bureau of Justice Statistics.
National Center on Addiction and Substance Abuse. (2010). Behind bars II: Substance abuse
and America’s prison population. New York, NY: Columbia University National Institute on Drug Abuse. (2009). Principles of drug addiction treatment: A research
based guide. Retrieved from www.nida.nih.gov/podat/faqs.html National Institute on Drug Abuse. (2002). Therapeutic community—Research report series
Washington, DC: U.S. Department of Health and Human Services, National Institutes of Health.
National Institute on Drug Abuse. (no date) Retrieved from www.nida.nih.gov/podat/faqs.htm. National Institute of Mental Health. (2004). Imaging study shows brain maturing. Press release.
Bethesda, MD: author. Nielsen, A.L., Scarpitti, F.R., & Inciardi, J.A. (1996). Integrating the therapeutic community and
work release for drug involved offenders: the Crest program. Journal of Substance Abuse Treatment, 13, 349-358.
Nelson, M., Deess, P., & Allen, C. (1999). The first month out: Post-incarceration experiences
in New York City. New York, NY: Vera Institute. Olson, D.E., Juergens, R., & Karr, S. (2004). Impetus and implementation of the Sheridan
Correctional Center Therapeutic Community, Program Evaluation Summary. Chicago, IL: Illinois Criminal Justice Information Authority.

74
Olson, D.E. & Rozhon, J. (2011). A process and impact evaluation of the Sheridan Correctional Center therapeutic community program during fiscal years 2004 through 2010. Chicago, IL: Illinois Criminal Justice Information Authority.
Olson, D. E., Rozhon, J., & Powers, M. (2009). Enhancing prisoner reentry through access to
prison-based and post-incarceration aftercare treatment: experiences from the Illinois Sheridan Correctional Center therapeutic community. Journal of Experimental Criminology, 5(3), 299-321.
Oslin, D.W., Pettinati, H., & Volpicelli, J. R. (2002). Alcoholism treatment adherence: older age
predicts better adherence and drinking outcomes. American Journal of Geriatric Psychiatry, 10(6), 740-747.
Pearson, F.S. & Lipton, D.S. (1999) A meta-analytic review of the effectiveness of corrections-
based treatments for drug abuse. The Prison Journal, 79: 384-410. Pew Center on the States. (2011). State of Recidivism: The Revolving Door of America’s Prisons.
Washington, DC: The Pew Charitable Trusts. RelapsePrevention.org. (no date). Retrieved from http://www.relapseprevention.org Roman, C. G. & Travis, J. (1994). Taking stock: Housing, homelessness, and prisoner reentry.
Washington, DC: the Urban Institute. Sabol, W.J., West, H.C., & Cooper, M. (December 2009). Prisoners in 2008. Washington, DC:
U.S. Department of Justice, Office of Justice Programs, Bureau of Justice Statistics. The Safer Foundation. (no date). Sheridan and SWICC. Retrieved from
http://www.saferfoundation.org/services-programs/sheridanswicc. Satre, D. D., Mertens, J. R., Areán, P. A. & Weisner, C. (2004). Five-year alcohol and drug
treatment outcomes of older adults versus middle-aged and younger adults in a managed care program, Addiction, 99, 1286–1297.
Solomon, A.L., Kachnowski, V., & Bhati, A. (2005). Does parole work? Analyzing the impact of
post- prison supervision on rearrest outcomes. Washington, DC: The Urban Institute. Solomon, A.L., Osborne, J.W.L., Winterfield, L., Elderbroom, B.,Burke, P., Stroker, R. P., Rhine,
E.E., & Burrell, W.D. (2008). Putting public policy first: 13 parole supervision strategies to enhance reentry outcomes. Washington, DC: The Urban Institute.
Travis, J., Solomon, A.L. & Waul, M. (2001). From prison to home: The dimensions and
consequences of prisoner reentry. Washington, DC: The Urban Institute. Visher, C.A. & Courtney, S.M. (2007). One year out: Experiences of prisoners returning to
Cleveland. Washington, DC: The Urban Institute.

75
Visher, C.A., Debus, S., & Yahner, J. (2008). Employment after prison: A longitudinal study of releasees in three states. Research brief. Washington, DC: The Urban Institute.
Visher, C.A, & Farrell, J. (2005) Chicago communities and prisoner reentry. Washington, DC:
The Urban Institute. Visher, C.A. & Travis, J. (2003) Transitions from prison to community: Understanding
individual pathways. Annual Review of Sociology, 29, 89-113. Welch, W.N. (2007) A multisite evaluation of prison-based therapeutic community drug
treatment. Criminal Justice and Behavior, 34, 1481-1498. Wexler, H. K., De Leon, G., Thomas, G., Kressel, D., & Peters, J. (1999). The Amity prison TC
evaluation: Re-incarceration outcomes. Criminal Justice Behavior, 26(2), 147–167.

Appendix A
Map of Illinois Department of Corrections’ adult prisons

77
Appendix B Length of time to recidivism and relapse by DSM-IV-TR diagnoses When entering Sheridan, participants were given a substance use diagnosis by their treatment counselor if they met the appropriate DSM-IV-TR (Diagnostic and Statistical Manual for Mental Disorders, text revision) criteria. All participants in the sample had a dependence diagnosis. In addition, during the interviews, participants were asked to share if they relapsed and how long it was post-Sheridan before relapsing. Relapse was defined as any substance use. Participants also were asked to share if they recidivated and how long after Sheridan before they committed their first offense. Recidivism was defined as any criminal activity or a technical violation that resulted in a return to the Illinois Department of Corrections. Relapse Recidivism DSM-IV-R diagnosis
Months to substance use (self-reported)
Months to criminal activity (self-reported)
Months to IDOC re-admission
n Mean n Mean n Mean Cocaine 14 4.2 10 6.4 14 20.9 Alcohol 11 2.1 9 2.9 12 30.7 Cannabis 9 12.0 10 18.1 12 27.4 Amphetamine 9 3.0 9 6.5 10 19.5 Opioid 1 1.1 1 1.8 Unknown 1 1 1 Total 45 39 50

Illinois Criminal Justice Information Authority300 W. Adams Street, Suite 200
Chicago, Illinois 60606Phone: 312.793.8408
Fax: 312.793.8422TDD: 312.793.4170
Visit us online: www.icjia.state.il.us