community oriented policing problem · pdf fileleadership in the "safety 88...
TRANSCRIPT

COMMUNITY ORIENTED POLICING
&PROBLEM SOLVING
>" C. 0. P. P. S."
RICHARD KIRKLAND, CHIEF OF POLICE
CONTENTS
Acknowledgements
Preface
I Community Oriented Policing and Problem Solving
II January 1992 Citizen Attitude and Opimon Survey
HI Mini-Surveys
-Central Area Day Shift-Traffic Citations-Work Cards-Animal Control

ACKNOWLEDGEMENTS
This publication is a result of the men and women of the Reno Police Department whosededicated service during a difficult period of diminishing resources, increased demands forservice and a rapidly changing environment, transformed our Community Policing philosophyinto a successful and meaningful police service delivery system.
The success of this program cannot be mentioned without including the efforts of ourcommunity. In particular, one of our most involved citizens, Dorothy Newberg, whoseleadership in the "Safety 88 Campaign" resulted in the voters approval for 88 new officers.Additionally, more than 750 community and business members are actively involved inNeighborhood Advisory Groups in an effort to resolve community concerns.
Any program of this magnitude would not be possible without the substantial support of our CityManager, Clay Holstine and members of the City Council. They have and continue toencourage our efforts to form community partnerships and improve police service throughoutthe community.
We are additionally grateful to Dr. Ken Peak, Criminal Justice Department Chairman at theUniversity of Nevada-Reno for his enthusiasm, encouragement and assistance in publishingsegments of our program. Also, Dr. Rosalee Marinelli, Sandra Neese and Mike Havercampfrom the Center for Applied Research at the University of Nevada-Reno for their critical reviewand contributions to the design and methodology of our survey to ensure its validity andreliability.
The individuals who contributed to the writing of this manual cannot go without mention.Deputy Chief Ron Glensor, who completed the majority of writing for this manual and managesour community survey program, and Steve Bigham, the department's statistician assigned toQuality Assurance, who conducts the surveys, analyzes its results and converts complexstatistical information into understandable data to assist my staff with decision-making andproblem solving.
Finally, our appreciation is extended to Darrel W. Stephens, Executive Director of the PoliceExecutive Research Forum, for his editorial assistance and encouragement to tell "Reno'sStory."

PREFACE
This manual, "Community Oriented Policing and Problem Solving", describes the Reno PoliceDepartment's experience in the transition from a traditional law enforcement design toCommunity Policing.
Like many other cities, Reno is faced with a complex environment consisting of fiscalconstraints, rapid change, high technology, added demands for service, increased litigation andthe need for cultural sensitivity. These challenges, and more, have required the policedepartment to reassess its role in the community and its methods of delivering public service.
Our program began on the premise that the community is the key element in our attempt to curbcrime and resolve neighborhood problems. This approach resulted in our development ofNeighborhood Advisory Groups (NAG's) that work with area commanders and officers atidentifying and resolving neighborhood concerns. Our experience with NAG's has proven verysuccessful and has improved the overall satisfaction of both the community and officers.
Problem solving is the backbone of our community policing efforts. All our officers have beentrained in the concepts of Problem Oriented Policing (POP) and, as a result, actively work theirown projects throughout the city.
In order to properly evaluate our success, we created a major Community Opinion Survey in1987. We continue to implement this survey every six months. It serves as a "report card"from residents and provides us with information about our performance, image, public fear,concerns about crime and quality of contact department members. The surveys provide valuableinformation that improves our ability to make decisions of an operational and policy nature. Theresults of each survey are shared with the community and officers so they better understand theirrelationship with one another and how effective that relationship is at mutually solving problems.
We believe Community Policing is the future of policing and an evolution of our past"Wisdom." It holds the greatest potential for effectively dealing with our current environmentand future challenges.
This document was created to stimulate interest and present our experience in dealing moreeffectively with the citizens and visitors to Reno. To date, we have answered over 150 writteninquiries about our program and entertained over 30 site visits by other agencies. If we can bea resource to any individual, group, police department, or city interested in undertaking suchan endeavor, we offer our assistance, experience, and knowledge.
Richard KirklandChief of Police

Community Oriented Policingand
Problem Solving
Deputy Chief Ronald W. Giensor
January 1992

INTRODUCTION
In June 1987, after the public, for the second time in two years, struck down a tax
initiative that would have replenished depleting resources and personnel, a Community Attitude
and Public Opinion Survey conducted by the Reno Police Department (RPD) revealed it had a
serious image problem. Survey data revealed that citizens were generally pleased with the
department's overall performance, but were displeased with its tactics, which they described as
"uncaring and heavy handed."
At the time, the Reno Police Department was driven by a Management by Objectives
(MBO) philosophy. MBO had provided administrators the capability to track the department's
performance through established goals and objectives. Unfortunately, high numbers of arrests
and citations were equated to successful productivity. As a consequence, efficiency had replaced
effectiveness, standardization took priority over creativity, and performance was based solely
on the department's ability to achieve established objectives. Statistics became the driving force
and although objectives were accomplished, the department's image suffered in the eyes of the
community.
The situation was made worse by the passage of a property tax law in 1980 that was
similar to California's Proposition 13. It established a property tax cap allowing only
incremental annual increases of four and one-half percent. The City of Reno had relied heavily
on property tax revenues and the new legislation resulted in immediate budget reductions and
public service cuts. For the next six years, the police department suffered significant personnel
and equipment reductions.
At the same time, jurisdiction increased from 38 to 59 square miles, calls for service

(CFS) increased annually by 8 percent, and population continued on a steady rise from 102,000
to 121,000 residents. The situation had deteriorated to a critical state. Police administrators
were convinced the solution to the problem rested on the department's ability to reverse its poor
image in the community.
In an effort to re-unite the police with the community, a new management philosophy
based on close police/community interaction was implemented. During the 1980's, Community
Oriented Policing was gaining popularity with many municipalities. Reno P.D.'s model,
originally named Community Oriented Policing-Plus (COP+), was designed to improve police
service and solve problems through an interactive process with the community. Within a year
after community policing was implemented, voters approved a long-sought tax initiative that
authorized the hiring of 88 new officers. Subsequent surveys revealed a marked improvement
in the department's performance and image in the community.
In January 1992, Richard Kirkland was appointed as Reno's new Chief of Police. Under
his direction, the department's program was renamed "Community Oriented Policing and
Problem Solving" (COPPS). The name was changed to emphasize the importance of problem
solving in the department's community policing philosophy.
This document begins with an explanation of the basic tenants of Community Policing
and Problem Solving. It then provides a detailed look at the organization, implementation and
distinctive elements of Reno's COPPS program.
THE PRINCIPLES OF COMMUNITY POLICING AND PROBLEM SOLVING
For the past three decades our society has fallen victim to a dramatic increase in crime,
gangs and drugs. Research on preventive patrol, rapid response, crime prevention and detectives

has questioned the effectiveness of traditional policing strategies. It was learned that 8 of 10
calls for service were related more to quality of life concerns than crime (Johnson, 1981). The
myth that the principle police function involved combatting crime and arresting evildoers was
quickly fading. These studies convinced police leaders to re-evaluate traditional strategies which
had been proven to be ineffective.
The tenets of community policing and problem solving have appeared in the literature for
several decades but the terminology and application of these strategies was not commonly known
until the mid-1980's. Three benefits are commonly associated with these new theories:
* Improved delivery of police service* Improved police/community relations
* Mutual resolutions to identifiable problems
Community policing has been referred to as the most significant contribution to policing
in this century. As a professor of Michigan State University stated, "This is the cutting edge
of policing in America today" (Carter, 1989). It is a "rethinking" of traditional policing
strategies which had limited success. It combines efficiency with effectiveness, promotes quality
over quantity, and encourages creative approaches to problem resolution. It is a "bottom-upM
approach where increased discretion and authority is given to the "beat cop" to solve
neighborhood problems. A new partnership emerges between the police and community to
combat crime, reduce fear, maintain order, and improve quality of life in the community
(Michaelson, 1988). Many believe that community policing will assist police in performing the
impossible mandate of "doing more for less."
One of the most common criticisms of policing relates to its basic strategy for providing
service. Traditionally, the police have responded to calls for service (CFS) as separate
incidents. This practice is referred to as "incident-driven policing" and was criticized as reactive
and resulting in short-term solutions. Problem Oriented Policing (POP) teaches officers how to
group incidents and identify the underlying causal factors that are often associated incidents in
hopes of providing long-term solutions.
POP is also concerned with the influence of environmental factors on crime. For
instance, in the past, the police response to a series of burglaries would focus on apprehension.
As a result, a variety of tactics to catch the suspect would be employed such as crime analysis,
extra patrols and plain clothes surveillance. Now, consider the same problem in terms of
environmental influences. Research reveals that lighting has a direct influence on the reduction
of certain crimes. Therefore, in this case, improving or repairing a poor lighting condition may
produce better results and may be more cost effective than the man hours it takes to coordinate
a surveillance or apprehension program.
The Newport News Police Department developed a model for Problem Oriented Policing
that has been replicated by many agencies (Eck, 1987). Its model is most commonly known by
the acronym SARA; Scanning, Analysis, Response and Assessment. This process of problem
solving teaches officers how to identify problems, analyze associated factors, develop appropriate
responses and evaluate the results. POP encourages officers to be creative and innovative
approaches. A main goal of POP is to develop an interactive relationship between the police
and community and to combine resources rather than attempt problem solving independently.
POP is an operational strategy that replaces traditional incident-driven practices. As a
result, it gives life to the Community Policing philosophy. The relationship between COP and
POP was best described by Chris Braiden of the Edmonton Alberta Police Department in Canada

who said, "Problem Oriented Policing walks the talk of Community Policing."
Police departments world-wide have adopted a variety of COP and POP programs. An
equal variety of names are ascribed to the various programs implemented. The Houston Police
Department refers to its program as Neighborhood Oriented Policing; Newport News Police and
San Diego Police call it Problem Oriented Policing (POP); Flint, Michigan adopted Community-
based Policing; Baltimore Police call it Citizen Oriented Police Enforcement (COPE); and Reno
Police has developed Community Oriented Policing and Problem Solving (COPPS).
The Reno Police Department has adopted Community Policing as a philosophy and POP
as a problem solving strategy. The goal of COPPS was to improve police service and
police/community relations. This was evidenced by the department's COPPS motto: "YOUR
POLICE, OUR COMMUNITY."
RENO POLICE DEPARTMENT'S "COPPS" PROGRAM
In its original design, COPPS was implemented as a department-wide philosophy. A
complete reorganization and new management style emerged. A 40 hour training program was
provided to every employee from police clerk to the Chief of Police.
The financial and political situation in Reno demanded a complete change in policing
strategy. It did not allow the designers of COPPS time for incremental implementation. An
immediate and department-wide commitment was necessary if the department was to reverse it
poor image in the community. In retrospect, the department has learned that a department-wide
strategy has many advantages over the specialized team approach. Many agencies that began
programs with officers assigned as community policing specialists are struggling with the
transition to a department-wide program.

The implementation of COPPS resulted in a major change in organizational structure
(Attachment 1). Decentralization of the previous "pyramid structure" brought key units in the
department closer together. This improved communication and accelerated the decision making
process. Two elements of Reno's COPPS program are unique to the concept of other programs
researched. First, Neighborhood Advisory Groups (NAG's). NAG's were developed to enhance
police/community relations. Second, a Quality Assurance Bureau (QA). QA was designed to
conduct internal and external surveys. These survey's serve as "report cards" on community
satisfaction about police service. Both QA and NAG's have contributed immeasurably to the
department's success and their ability to measure the community's satisfaction and are later
discussed in detail.
AREA COMMANDS
Reno was originally reorganized into three geographic operational areas - North, South,
and Central. In a recent reorganization, patrol was further streamlined by combining the North-
Stead and Central Divisions under one command. The Special Services Division provides
administrative support to the two operational areas.
Each area is under the command of a Deputy Chief, who has 24 hour a day responsibility
for an area. This departs from the shift commander structure. The area commander spends a
majority of their time in the community working with citizens, service groups and business.
Lieutenants perform the day to day operations and watch commander functions. Sergeants and
officers are assigned as teams to an area for a minimum of 6 months (one shift bid) and have
the same days off.

NEIGHBORHOOD ADVISORY GROUPS
Originally, COPPS called for the formation of a series of community groups representing
neighborhood areas to meet with police officials at organized meetings. The purpose of the
meetings was to establish meaningful dialogue between the police and the people to discuss their
problems and possible solutions. Supervisors and officers were encouraged to attend and
participated in the agenda.
Officials envisioned one NAG group formed in essentially the same fashion for each area.
But, as the groups formed and citizens provided input about the unique economic, ethnic and
crime concerns of their neighborhoods, three different NAG models emerged. NAGs have been
developed to address each area's particular needs.
North/Stead Model
The North/Stead Area is comprised of the northern portion of the City of Reno beyond
the Truckee River, which essentially divides the City in half. Incorporated elements north of
the Truckee River are included in this area except downtown, which is the Central Area.
The North/Stead Area contains many diverse and varied neighborhoods, ranging from
the predominately lower socio economic section in the Northeast, to the rapidly growing middle
income residential projects in the Northwest. An abandoned military facility (Stead) in the
northernmost section of the area has a mixture of lower/middle income housing, light industry,
and two major retail distribution centers. Several senior citizen housing developments exist
within the area, as well as the University of Nevada with its large student residential population.
Each population segment of the area represents a different need and demand on police service.
As a result of its demographic diversity, the original plan of one NAG representing the
8

area quickly fell by the wayside. The North/Stead NAG model developed, focusing on
delivering the NAG message to existing organizations within the area, which had been
formulated for other purposes. Church groups, PTA groups, neighborhood councils, tenant
associations, booster clubs, senior citizen groups, homeowners' associations, landlord groups,
etc. all became forums for delivering the North/Stead NAG message. The NAG message is
carried to these groups via a newsletter overseen by the Area Commander.
The result has been excellent participation by the citizens. NAG meetings rarely have
less than 20 citizens in attendance and have had as many as 75 people attend. The police have
been able to involve themselves in a wide variety of community centered issues and problems
not previously regarded as needing police attention. Through this model, the North/Stead Area
Commander has been able to develop the police department's expanding role as a "good
neighbor" in the community.
This NAG model remains significantly different from those employed in the other two
areas. Area assigned patrol officers are encouraged to identify groups in the community through
their field duties that could host a NAG type meeting. As such, the patrol officers are
developing a different sense of policing and are becoming instrumental in the department's
ability to service the community from a broader perspective.
South Area Model
The South Area is geographically the largest area of the city and continues to grow
through building and annexation. The demographic make-up of the South Reno area is primarily
upper-middle and upper income residents in the Southwest portion of town. Several exclusive
residential areas, with homes valued in the millions of dollars, are growing rapidly. The

Southeast portion of the city is populated primarily with middle income residents moving into
newly established residential areas. The Southeast area also contains several densely populated
apartment complex areas. One area is heavily populated by minorities, low income residents,
and HUD supported housing. The middle portion of the South area, along a main thoroughfare,
contains the major portion of Reno's shopping and commercial district. Two major regional
shopping malls are also located in this area.
The South Area has essentially remained with the original concept of Neighborhood
Advisory Groups. A mailing list of interested citizens began in 1988 and has grown to an active
mailing list of over 300 residents. The participating residents are usually from the Southwest
portion of town and interested in staying involved in the program. Several members of this
large NAG group have assumed leadership roles and have conducted membership drives,
organized meetings, and served in a liaison capacity between the NAG and local Neighborhood
Watch groups, churches, and other organizations. NAG meetings are organized as social events,
church meetings, and luncheons.
In addition to the large core NAG group, several smaller groups have formed to serve
business and planning needs in the area. The Neil Road business group includes from 15-20
business and property owners in the Neil Road area. This is predominantly a low income, high
minority rental area with increased crime problems. The group meetings focus on problems
such as drugs, youth gangs, evictions of undesirable tenants, and the neighborhood foot patrol
programs. A Neil Road Planning Committee involves up to 15 residents. The City Planning
Department and Police Department are currently involved in a major re-zoning project, the
development of an 18 acre park, a police neighborhood service center (sub-station), and noise
10
abatement from the nearby airport. A South Virginia Street business group includes 15-30
business operators and residents along the South Virginia corridor. This is the large shopping
district in Reno. A large hotel/casino sponsors the meetings and issues include area property
crimes, transients, and drugs.
One reason for the success of the South Area core NAG appears to be the stability of
long time residents living in the Southwest. Another is the free time many of the elderly
individuals have to become involved in the program. These people see the NAG as a social
function where the police provide education and entertainment. For example, at each NAG
meeting, "entertainment" such as police dog demonstrations, drug movies, guest speaker's, etc,
are regular agenda items. The level of participation in the lower income Neil Road area is not
as high as the Southwest. This could be attributed to the transient population and varied work
hours of residents in the Neil Road area.
Central Area Model
The Central Area is the smallest geographic area. Approximately eighty percent of
casino and hotel capacity is located within the Central Area. In addition, the City's two major
hospitals are in the area.
The demographic make-up of the Central Area reflects the City's business/industry base.
It can best be described as the downtown area. The population is highly transient. Because of
the 24-hour nature of gaming, employees and tourists create an ongoing movement of people
through the area. Every day there can be an influx of 10,000 to 60,000 tourists. The Central
Area is also where most of the homeless/transients locate. This is due to the "glitter" of casinos
and the location of several social service agencies.
11

A limited number of individuals do live in the area. There are three or four small
pockets of single family dwellings. These residences are occupied by either renters or elderly
people who have lived there a long time. Many houses are being converted to small professional
offices. Apartments are small complexes, either in the form of multi-level single room
buildings, or two story, 25-50 unit complexes. Many have a high concentration of Hispanic
and Asian families.
During late 1987, a NAG was created for the Central Area. Approximately 25-30
individuals attended the first meeting. The majority of participants were business
owners/representatives, with only two or three actual residents. It became very clear during the
presentation that the issues facing the downtown area were associated more with business than
residential areas. A second meeting was held with the same low number of residents present.
After a period of six months, it was recognized that the area commander would have to be
involved with representatives of the business community on an almost daily basis. Several
business groups were already in existence and the area commander worked closely with those
organizations.
The single most important representative organization was the Downtown Renovation
Agency (DRA). Membership of the DRA includes most of the downtown properties CEO's,
small business owners, and representatives of the Chamber of Commerce. This was an
extremely powerful group, both economically and politically. In addition, the area commander
was a member of the casinos Security Director's Association.
One of the most serious issues confronting the Central Area, and the entire City, is that
of the homeless and transient population. The area commander is a member of the Homeless
12
Coalition, a task force established to evaluate medical/social treatment of indigents and other
committees concerned with the general environment of the area. Many of the groups are
temporary and issue driven.
The Central Area is also the primary focal point for special events. Groups or
individuals sponsoring a special event must complete an application and meet with the
Community Services supervisor to insure public safety issues are addressed. The larger events
require the attention of the Area Commander.
The Central NAG model is one of participation with existing professional organizations.
This has been successful because the members of existing groups have a vested financial interest
in the downtown area. The issues and concerns can be discussed, while insuring that resources
are distributed in an equitable fashion.
Special Services
Special Services provides administrative and operational support for patrol division.
Special Services is concerned with the strategic implementation of programs that support COPPS
in the three areas. It manages all administrative and personnel functions within Patrol. These
include: development and management of patrols budget, FTO program, shift bid, coordination
of grants, traffic division, court liaison program, and SWAT teams.
CHIEF'S ADVISORY GROUPS
In addition to the single Neighborhood Advisory Groups, designers envisioned the need
for several specialized NAG's that would participate directly with the Chief of Police. The
Media Advisory Group, Citizen Advisory Group, and Professional Advisory Group were formed
to meet this need.
13

MEDIA ADVISORY GROUP
The Media Advisory Group was developed with the single purpose of improving
police/media relations. The media was criticized by citizens in the initial Community Attitude
and Confidence survey for "unfair, biased, and sensationalized" reporting of the police in several
incidents. Police officials believed this contributed to the department's poor image. This group
was made up of news directors, assignment editors or general managers of the three local
television stations, news directors from several of the local radio stations and the executive
editor of the local newspaper. It was hoped that this group would help establish meaningful
communications between the department and the media, and provide an equal exchange of ideas,
perceptions, and concerns. Several meetings have taken place and a more cooperative
relationship appears to be occurring.
The creation of a public information officer (PIO) shortly after the implementation of
COPPS alleviated many of the concerns and problems previously experienced between police
and the media. The PIO communicates daily with the media, arranging news conferences and
delivering news releases. The PIO also promotes stories on many community projects and
functions in which the police department is involved.
CITIZEN ADVISORY GROUP
This group consists of a few select NAG members from each neighborhood and ethnic
group. The concept established an executive group that would provide the Chief with an overall
perspective on the progress and status of COPPS. It also allowed the Chief access to some of
the most influential citizens in the city. In turn, these citizens had direct communication with
the Chief of Police.
14

PROFESSIONAL TECHNICAL ADVISORY GROUP
The aim of this group was to invite professionals in the field of law enforcement
throughout the country to Reno, where they could provide technical assistance on the application
of COPPS. In the summer of 1989, a representative from Police Executive Research Forum
(PERF) in Washington D.C. was invited to Reno and presented a Problem Oriented Policing
course to supervisors. Several department members maintain close contact and exchange
information and ideas with PERF staff.
•
QUALITY ASSURANCE
Quality Assurance (QA) unit was created to conduct community surveys. QA conducts
two major Community Attitude and Confidence surveys and 24 mini-surveys a year. It also
manages the department's progress toward achieving accreditation through the Commission on
Accreditation of Law Enforcement Agencies (CALEA). CALEA was formed in 1979 through
the combined efforts of four major law enforcement membership associations. CALEA's goal
is to improve law enforcement by establishing standards and evaluate agencies for accreditation.
The QA section conducts two major Community Attitude and Confidence surveys
annually that consist of 700-800 randomly selected respondents from households. These surveys
were designed to assist the department in understanding the community's attitude toward police
service. The first survey revealed the department had a poor image within the community.
Subsequent surveys have shown a rapid improvement. Each survey is discussed extensively in
Executive Staff and the results are shared with department members, City Council, NAG groups,
and the Chiefs media advisory group. The surveys are considered a "report card" on police
service. The information is used as a tool to "fine tune" the police response to community
problems.
The 24 annual mini-surveys occur at the direction of command staff or at the request of
division heads who want their operation evaluated. As an example: QA conducted a survey of
the Detective Division to evaluate customer satisfaction. It revealed the most frequent complaint
by citizens was the lack of recontact by detectives. The problem was twofold: Officers taking
the original report were advising citizens that detectives would contact them the next day, and
many of the reports taken involved misdemeanor crimes, in which case there was no automatic
follow-up by a detective.
After discussion of the survey in staff, the following solutions were proposed: First,
briefings were used to instruct officers not to tell citizens that detectives would automatically
contact them the next day. Officers were reminded that some cases required three days of
processing, depending upon its classification or solvability factors. The police report form was
changed to a multi-form. Every complainant/victim received a copy of the "facesheet" after
reporting an incident. The facesheet contains important crime information and a case number.
The back of the form contains phone numbers and information on how to follow-up
misdemeanor and other crime cases. A follow-up survey by QA revealed a marked
improvement in citizen satisfaction.
The importance of the police understanding community needs cannot be overstated.
Surveys provide vital information and insight into the public's perception of officer performance
and can be used to evaluate the effectiveness of police-citizen relations. Officers must be careful
that "order" does not become an overriding concern to the point where sensible law is ignored.
Policing efforts must be consistent with community needs and desires. The surveys conducted
16

by QA have helped police officials in evaluating their performance, identifying community
needs, and establishing long-range planning objectives.
PUTTING THE PROBLEM SOLVING THEORY TO PRACTICE
Problem Oriented Policing puts the Community Policing philosophy to practice. The
POP approach offers a new proactive strategy of delivering police service. RPD has experienced
many successes since COPPS began. Each of the three areas has different concerns and, as a
result, their approaches to problem solving have varied.
NORTH/STEAD AREA
•Eviction Program: Several apartment complexes in Northeast Reno were plagued with•
tenants trafficking drugs. Many of the tenants were receiving HUD assistance to live in the
complex. Previous enforcement efforts had been unsuccessful. Police organized meetings with
the representatives of the District Attorney's Office, landlord tenant association and apartment
complex owners. It was evident that the landlords did not know their rights and were concerned
that any attempts toward eviction would result in law suits and claims of harassment. They were
concerned about the deterioration of the properties due to the influx of drugs and prostitution,
but did not know how to deal with the problem.
In reviewing the alternatives, participants discovered that HUD had strict regulations for•
applicants receiving aid. Many of the people suspected of drug sales were in violation of these
guidelines. An eviction program was developed and, in a cooperative effort with all concerned,
11 individuals were evicted. Some will not be eligible to reapply for HUD funding. As a
result, there was a significant reduction in drug related complaints.
*Pat Baker Park: Pat Baker Park is a small neighborhood park that was built in "one
17

day" in the late 1970's by the community in Northeast Reno. The park is referred to as "instant
park" and carries an emotional significance to the citizens who created it. Unfortunately, over
the years it has become a place for drug sales and gang related activity.
Residents complained and demanded more police when dealers took over the park.
Traditionally, the police would assign officers to the area and slowly increase enforcement in
hopes of dispersing the problem. This strategy usually worked for a short time, but the situation
would quickly revert to its beginning when the police presence was removed. At that time,
complaints would increase and the police would respond with a task force making mass arrests.
Even though the police were successful in clearing out drug dealers, arrests usually resulted in
complaints from residents that alleged the police were heavy handed or prejudiced.
When COPPS was implemented, several NAG groups were formed in the Northeast area.
One group representing local ministries was developed to discuss approaches for alleviating the
problem of drugs and gangs. Through a mutual exchange of problem solving ideas, the
ministers' NAG supported the department's enforcement efforts. Numerous arrests were made
of suspected gang members for drug related activities without a single complaint from citizens.
As a result, the community led a "take back the park" march and picnic to celebrate their
success. Police continue to work closely with these groups to monitor the park and
neighborhood.
The Pat Baker Park program was the department's largest COPPS effort at the early
stages of the program's implementation. The Pat Baker Park area had a history of being
politically volatile. As stated, past efforts by the police resulted in citizens' complaints. The
success of this program led to a foundation of cooperation and mutual efforts to problem solving
18

that paved the way for several other future programs.
•Trainer Way Drug Sting: As a result of working with neighborhood NAG's, police
received numerous complaints of "crack houses" on Trainer Way in Northeast Reno. In the
past, cooperation with the police regarding these problems was nonexistent. The NAG groups
promoted a close working relationship between police and community that resulted in mutual
problem solving efforts.
"Operation House Calls" evolved and an undercover black officer from out-of-state was
loaned to the department for assistance. Numerous drug buys were made, as well as arrests.
A NAG group was developed and police worked closely with residents toward a solution to the
problem. This program would not have been possible without the information and cooperation
from NAG members. The success has been enjoyed by all.
•Abandoned Vehicles in Stead: Stead is an abandoned Air Force Base within the City
limits approximately 10 miles north of downtown. It's a small, but rapidly growing, community
of approximately 5,000 residents.
Stead is surrounded by open desert and has always been a favorite dumping ground for
abandoned vehicles, creating an eyesore for residents and a danger for children. Many of the
vehicles were located in the Counties jurisdiction and both agencies tended to overlook the
complaints because they could be blamed on the other. As a result of working with the
North/Stead NAG, a senior officer assigned to the area arranged for towing of over 100 vehicles
from the area. Several NAG members donated tow vehicles and equipment from their own
businesses. The success of this project received positive news coverage and was a positive step
toward improving the police image among Stead residents.
19

•UNR/RPD Jurisdictional Agreement: The University of Nevada, Reno is located at
the north edge of the downtown area. UNR has its own police department (UNRPD). They
have jurisdiction on campus, at several off campus fraternity/sorority houses, and at Job Corps
in Stead. Job Corps is a federal training program for youths. They have security, but use
UNRPD to investigate criminal cases.
In the past, there had been little communication between campus police, Job Corps
security and RPD, even though many of the problems handled by each crossed jurisdictions.
Officers began working with the two other agencies discussing their concerns. Jurisdictional
agreements were developed and periodic meetings were scheduled to encourage communication.
One result of these meetings was a consolidated dispatch between the Reno PD and UNRPD,
For the first time, RPD and UNRPD officers could monitor each other's activity. It's not
uncommon now to find officers covering each other on traffic stops or providing cover on a
serious call. The relationship between the agencies has improved dramatically.
*Patton Drive Footbeat Program: Patton Drive is located near Pat Baker Park and has
been the scene of "drive by shootings" and gang related activity. The same NAG's dealing with
Pat Baker Park's drug and gang problems worked toward a solution on Patton Drive. Footbeats
were immediately assigned to the area. Officers began talking with residents and non-residents
were singled out and questioned about their business. RPD's gang officer identified known
members who were targeted for enforcement action. The shootings and gang activity quickly
subsided. This area is being monitored closely by police.
*Dirt Bike Program: Reno lies at the base of the Sierra Nevada mountains and is
surrounded by large areas of open desert. The Stead, Southwest, and Northwest areas were
20

popular for off-road vehicles and dirt bikes. Noise and dust from the off-road vehicles resulted
in complaints from citizens. Many of the popular areas were in County jurisdiction and the lack
of four wheeled vehicles limited the police department's response to complaints. After
discussing the problem with NAGs from the three areas concerned, the police department
purchased two dirt bikes and assigned officers to respond to complaints in problem areas.
Recently, police responded to a complaint and the dirtbike officers recovered an All-Terrain
Vehicle (ATV) that was stolen from a dealership one day earlier and two arrests were made.
Residents have been very supportive of the program and complaints were significantly reduced.
•Sierra Nevada Job Corps: Job Corps is a federally sponsored employment training
program. Most students are from low-income families and a high proportion of students are
from out of state. Job Corps has always had a poor reputation among officers, and students
have been the subject of many resident complaints about loitering in neighborhoods. Other than
telling the students to "move along" and not loiter, little was done to curb the problem. Police
began meeting with Job Corps staff and security, thus discovering there were positive aspects
of the program. Job Corps had 600 students attending many different training programs,
including law enforcement. The entry requirements for law enforcement students are strict and
they can't have a police record.
As a result of working with Job Corps staff, students have recently been involved in
construction projects at the police facility. The most significant project was the construction of
a Nevada Peace Officers Memorial to honor slain officers. Students have also attended the
dispatch academy for work experience and college credits.
*COMPAS Program: The Comprehensive Mental Health Assessment Program was
21

developed to deal with the mentally ill. Previously, it would take several hours of a police
officer's time to process a mentally ill subject. Now, COMPAS personnel respond to the scene
of mentally ill subjects upon the request of officers. COMPAS works directly with the hospitals
and state mental health institutions. Upon their arrival, the officer is released from the scene
to resume other duties and COMPAS handles all the processing and transportation.
•Telephone Programming: A convenience store in the Northeast section of Reno was
a popular hangout for drug sellers who used the telephone to receive calls from clients.
Enforcement for this type of activity is manpower intensive and time consuming. The store
owner and telephone company were contacted in hopes of solving the problem. It was learned
telephones can be programmed not to receive incoming calls. The dealers quickly disappeared.
Even though the problem was more than likely dispersed to another location, the police accept
this short-term solution when compared to the risks associated with drug sales continuing at the
convenience store which was frequented by teens and children.
SOUTH AREA
•Traffic Team: The most common complaint from citizens throughout the city is
attributed to speeding vehicles and other traffic related problems. Traffic enforcement was
largely carried out by motorcycle officers assigned to district teams and other interested officers.
All officers were trained in use of speed radar guns and relied on this equipment for the majority
of traffic violation citations. Upon completion of radar training, the number of tickets issued
rose rapidly, as did citizen complaints alleging "speed traps."
In order to respond properly to the mounting requests for enforcement, yet at the same
time correct the department's poor image, motors were re-assigned from district teams to a
22

traffic team supervised by one sergeant. Their shifts were adjusted to cover the peak hours
when accidents and violations were occurring. A state funded grant allowed for the purchase
of a computer dedicated to track accidents, citations, and DUI information. Motors were
assigned to enforcement according to identified problem areas and upon citizen request. Traffic
complaints had always been a major complaint of citizens and a frequent topic of discussion at
NAG meetings. The new traffic program, which required personal contact with the complainant
by the officer assigned to the enforcement, resulted in many positive comments by citizens and
NAG members.
Warning citations were also developed as an alternative strategy to enforcement. The
citations are used in certain situations where "fair warning" is considered by the supervisor to
be the better tactic before an enforcement program is implemented. Warning citations can also
be issued at the discretion of an officer in a situation where verbal warning would have resulted.
A radar trailer displaying the speed for the driver of an oncoming vehicle was donated
by the Reno Air Race Association. The trailer has become extremely popular and is requested
for school zones and neighborhoods throughout the city. Funding is being sought for the
purchase of two more trailers in order to meet the demand.
Officers assigned to an area take the additional time necessary to explain to violators the
problem and reason why they received the citation. Although the number of citations increased
substantially since the reorganization of traffic teams, complaints have nearly been eliminated.
•Fish Hatchery Property Project: This property is located in the middle of the Neil
Road area. The Neil Road area consists of several multi-unit apartment complexes. Major
thoroughfares separate apartment complexes from schools and parks, making it difficult and
23

dangerous for children to walk to nearby facilities from home. Residents in the area continually
expressed the need for a local park for the children. Through working with NAGs and the City
Planning Department, a 19-acre abandoned fish hatchery property was located.
City and private entities worked together on the problem. As a result, the Parks
Department earmarked 7 million dollars to build a park. The Truckee Meadows Boys Club is
considering building a facility on the land. The Zoning Department has begun a revision in the
Master Plan to allow the building of a park. The Planning Department has researched a
comprehensive proposal to develop a police substation on the site. A possibility exists that Ford
Foundation money can be acquired to develop the plan at a minimum cost to the City. This has
been one of the most aggressive, positive projects, and one of the best examples of COPPS
philosophy and POP at work.
•Neil Road Foot Patrol: Neil Road is a high density area consisting of low income
apartment and HUD properties. The area has a high ratio of Hispanics and has experienced both
Black and Hispanic gang problems. Police began working with business owners and residents
in the area to discuss problems. Footbeat patrols, with at least one bi-lingual officer, were
assigned to the area. The community support was tremendous. Officers worked closely with
residents and business owners to solve gang and theft problems that plagued the area.
Immediately after footbeats were implemented, overt gang activity subsided.
•Truancy Program: Washoe County has a high rate of dropout among its students.
This problem has received much attention and concern from school officials and parents. A
variety of agencies, including the police department, handled the dropout and truancy problem
independently and with minimal success. The various agencies formed a coalition to resolve the
24

problem. RPD, working with school officials, assigned officers to truancy enforcement 2-4
days a week. All agencies worked together and developed a new truancy policy that included
incentives for good attendance. All truants picked up by police were transported to the
Children's Cabinet, a County facility that makes counseling referrals for juveniles with behavior
and family problems. They were responsible for providing referral services before the student
was returned to school.
A new centralized children's intake center is now under construction. The center was
funded by both private and public resources and is designed to integrate all state, county, and
private agencies. A truancy center will be attached to the facility but operate independently.
The combined efforts of all agencies resulted in a dramatic reduction in truancy.
*MilI and Edison Drag Racing: Mill and Edison are main streets in an industrial area
located in the eastern portion of the City. Over the years it has become a popular teenage
hangout for drinking and drag racing. Previous attempts to alleviate drag racing resulted in
minimal success. The area is remote and any police response was discovered well in advance.
Drag racers assigned perimeter guards with walkie talkies to sound an alarm at any police
response.
As many as 300 teens would congregate to watch the racing. The location was so
popular that temporary stands were erected to sell car parts. Liquor was so prevalent that
business owners set out garbage cans in hopes that some of the trash would be discarded
properly and reduce their clean-up after the weekend. Regardless of the number of citations
written, there was little success in curbing the problem. Police began working with City
engineers, business owners, school district officials, and the Reno Citizens Traffic Advisory
25

Board to resolve the problem. Empty lots were fenced, newly designed "speed bumps" were
installed, and "no parking" zones established. Police worked with local schools who printed
articles in school papers to discourage drinking and drag racing in the area. A form letter,
explaining the problem to parents, was developed and sent to the residence of any juvenile
contacted by police. For the first time, the problem was reduced to isolated incidents.
CENTRAL AREA
•Springtime Enforcement Plan: Reno's downtown tourist season begins in the spring.
As many as 60,000 guests may be present on any weekend. The transient population also
increases (there are estimates of between 200-300 hardcore transients) and minor street crimes
become a concern. Footbeats, bicycle, and dirtbike patrols are implemented in an effort to
maintain order.
•Court Footbeat Program: The downtown businesses and casinos continually make
demands for a higher police presence and increased footbeats. In order to satisfy the downtown
concern and not remove police from the neighborhoods, a program was developed that allows
officers to volunteer for overtime pay walking a footbeat while they are on-call for municipal
court. Previously, police were paid a nominal standby fee while waiting at home. This program
has been very popular with officers and has reduced the complaints by downtown business
owners about the lack of officer presence.
•Special Tax District: As a result of the success of the court footbeat program, casino
and business owners worked with the police department to develop legislation allowing the
downtown business owners to create a special tax district. The special tax district allows
business owners to pay for new officer positions that would be allocated specifically for the
26
downtown area. The law was passed in the last legislature and plans for as many as 28 new
officer positions are being discussed.
*Eyes and Ears Program: The downtown casinos Security Officers Association meets
periodically to discuss common problems. A communications network was established and
provides a direct link between downtown security dispatch and police dispatch. This greatly
enhances the delivery of information to downtown security from the police department.
The Central Area Commander is now a member of the Security Officers Association.
The police have worked with the Association to streamline the communications network and
create a dispatch procedure. Police radios for downtown footbeats have been programmed so
officers now have direct contact with the Security Officers Association base station. The new
procedure has resulted in a more timely response by the police and improved relations with
security personnel.
•Homeless Coalition: Reno has a permanent population estimated at 200-300 "hardcore"
transients. Two major social services are located downtown. Daily they draw a large crowd
of transient and homeless traffic resulting in complaints from downtown business owners. The
police, downtown property owner's association, and social service agencies have dealt with the
problem independently in the past.
A Homeless Coalition, consisting of downtown property owners, member of City
government, social service agencies, hospitals, and the police, was formed to deal with this
concern. A permanent facility outside the downtown area is being planned through contributions
from downtown businesses and the combined sale of social service properties in the downtown
area.
27

Police have also networked with the hospitals and DETOX Center to ensure there is a
consistent approach to dealing with the problem. Enforcement has taken a back seat to planning
and problem solving.
CONCLUSION
Wilson's theory on "broken windows" applied to Reno P.D. as well. (Wilson: 1982)
RPD's "broken window" was their image in the community. Mistakenly, the department
equated their success in attaining MBO objectives with public satisfaction. Police often
misunderstand the needs of communities and rarely do they properly measure success beyond
the simple statistics of an officer's production. RPD's MBO program had degenerated to the
point where statistics drove the organization. It took the defeat of two referendums for more
personnel and a Community Attitude and Confidence Survey to convince the police their image
was poor. The RPD has learned from history they can no longer impose order from the outside.
Order maintenance is the shared responsibility of both the police and the community.
Communities want the opportunity to participate and, in exchange, will offer their support. The
design and implementation of COPPS helped RPD better understand their role in the community.
It solicited police/community cooperation and emphasized a mutual identification of problems
and combining of resources in problem resolution. Effectiveness took priority over efficiency
and improved quality of life was its main goal.
Reno P.D. has embraced its community through the COPPS design. Any initial fear by
the police of interference or citizens attempts to take control of the department, have been set
aside by two years of cooperative efforts in problem solving. The long-term effects of COPPS
are not yet known. Reno P.D. will continue meeting with their NAG groups and conducting
28

bi-annual and mini-surveys in order to monitor their success. Whatever the future might hold,
the department is convinced that COPPS is the most positive and successful approach to policing
in Reno's history. An improved image in the community and a successful referendum providing
88 new officers are just two measures of this success.
•
29

BIBLIOGRAPHY
1. Brown, Lee P., "Community Policing: A Practical Guide for Police Officials." ThePolice Chief. August 1989, 72-82.
2. Carter, David, of Michigan State University, quoted in an article by H. Malcolm, "Citiestry a new approach to police work." N.Y. Times. March 29, 1989.
3. Johnson, T., G. Misner, and Lee Brown, The Police and Society: An Environment forCollaboration and Cooperation. Englewood Cliffs: Prentice Hall, 1981.
4. Eck, John, William Spelman, Diane Hill, Darrell W, Stephens, John R. Stedman, andGerald Murphy, Problem Solving: Problem Oriented Policing in Newport News.Washington D.C.: Police Executive Research Forum, 1987.
5. Michaelson, S., R. Wasserman, and G. Kelling, Emerging Characteristics of CommunityPolicing. Washington D.C.: National Institute of Justice, U.S1 Department of Justice,"Perspectives on Policing," working paper, 1988.
6. Wilson James Q., and George L. Kelling, "Broken Windows: The Police andNeighborhood Safety," The Atlantic Monthly. March 1989, pp 29-38.
30

Reno Police DepartmentCommunity Oriented Policing & Problem Solving
Media AdvisoryGroupChief
OfPolice Citizen/Minority
Advisory GroupsOffice of Chief
Internal AffairsIntelligenceAid-to-Chief
Professional/Technical/Policy Advisory
Group
Support ServicesCommunicationsRecords & I.D.
TrainingResearch & Development
AccreditationQuality Assurance
DetectivesCrime Analysis
osuGang Unit
Special ServicesROP/CAP/SORT
Community ServicesTraffic
North Patrol South Patrol
NeighborhoodAdvisoryGroups
NeighborhoodStations
NeighborhoodAdvisoryGroups
NeighborhoodStations

RENO POLICE DEPARTMENT
CITIZEN ATTITUDE AND OPINION SURVEY
November 1991
Prepared by
Steve BighamQuality Assurance Statistician
Deputy Chief Ronald W. GlensorSurvey Program Manager

INDEX
Background 1-2
Executive Summary 3-4
Acknowledgements 5-6
Demographics 7
Design and Methodology 8-9
Analysis 10-16
Survey Questions and Responses...17-24
Graphs 25-50
BACKGROUND
In May 19 87, the Reno Police Department moved away from atraditional format and adopted a Community-Oriented Policingapproach. Traditional policing has historically been reactive inthe handling of problems, with little emphasis on long termsolutions. The goal of this program was to develop a partnershipbetween the police and the community, resulting in the improvementof the quality of life for all of Reno's citizens. Thedepartment's goal is exemplified by its motto, "Your Police, OurCommunity." Community policing orientations commonly achieve threebenefits, improved delivery of police services, improved communityrelations and mutual resolutions of identifiable problems. TheCommunity policing philosophy combined with the department'sProblem-Oriented Policing approach, allows the Reno PoliceDepartment to not only handle problems, but solve long term issues.
In order to measure the effectiveness of the program an attitudeand public opinion survey was developed. This program wasinitiated in June 1987, with the purpose of providing thedepartment with information about the public's attitude toward thedepartment and specific issues within the community. To assureboth the validity and reliability of the survey, assistance wasobtained from the University of Michigan and the University ofNevada, Reno. The demographic criteria for the survey wasestablished by the University of Michigan. The external review hasbeen accomplished with the assistance of the University of Nevada,Reno. The Political Science Department, Dr. Alan Wilcox, TheCenter for Applied Research, Dr. Sandra Neese, Community HealthSciences, Dr. Rosalie Marinelli, and Dr. Mike Havercamp andCriminal Justice Department, Dr. Ken Peak have all contributed andreviewed the survey. The importance of question construction anddesign, demands both internal and external reviews.
The analysis and interpretation of the data has been accomplishedwith the assistance of Dr. Koh, University of Nevada, Reno,Computer Science Department. Dr. Koh established the computeranalysis system for processing the data. This enabled additionalcomputations to be preformed and helped increase the accuracy ofthe data.
The survey is now recognized as the model program in the UnitedStates, by the Police Executive Research Forum. Other publicationsand requests include:
A. Published by Police Chief Magazine, November 1991.B. Accepted for publication by Police Executive Research
Forum, "Methods, A Primer for Law Enforcement."C. Accepted for publication by the Journal of Criminal
Justice.D. The Reno Police Department has been Invited to speak at
the last two national conferences on Problem-Oriented policing.

E. Requested by the Christopher Commission forimplementation by the Los Angles Police Department as aresult of the Rodney King incident.
F. Requested by the John F. Kennedy school of Government,Harvard University.
G. Requested by New York City Police Department.H. On site visits and request from over 150 agencies across
the United States, Canada, Germany and the UnitedKingdom.
In the four plus years that the Reno Police Department has beeninvolved in Community-Oriented Policing dramatic improvement hasbeen obtained. The department's performance has improved almost 2 0percentage points, city wide. The Reno Police Department's imagewithin the community is up over 45 points. In numerical terms,this represents an definite improvement in the positive opinions ofover 57,000 citizens. The leaders in law enforcement make it clearthat Community-Oriented Policing is the future of policing. Thesuccesses of the Reno Police Department appear to support thatconclusion.

EXECUTIVE SUMMARY
The results from the eighth attitude and public opinion surveyindicate a continued increase in the Reno Police Department'sperformance and image within the community. Of the citizensexpressing an opinion of the department's performance, 93% ratedthe Reno Police Department's performance as good or very good.
The department's rating in dealing with law breakers continues toincrease. Out of every 15 citizens, 14 gave a positive responsetowards the Reno Police Department's dealing with lawbreakers.
One of the biggest improvements occurred in the department's image.Of Reno's population, 87%, had a positive opinion of thedepartment's image. This represents an increase of 7% in sixmonths, and over 40% since the community oriented policing programwas implemented. The citizens clearly approve of the Reno PoliceDepartment's image and the current direction that it is taking, byan overwhelming majority.
The overall feeling of safety in Reno has been affected by theincrease in community gang awareness. Other factors thatinfluenced this rating continue to be an increase in population,and the UCR statistics that were released during the survey. Thereis a direct correlation between safety and police visibility.
The perceived number one problem in Reno was the gang problem. Thenumber of concerned citizens citing this issue tripled fromprevious surveys. Of the citizens expressing an opinion, 78%, arepleased with the department's approach to the gang dilemma. Theoverwhelming suggestion to improve this issue is to increase thepenalties for gang offenses, which of course in not a police issue,but a legislative and judicial issue. An additional third of thepopulation requested increases in educational and communityprograms to combat the problem.
Several programs have been initiated, since the survey, to combatgangs. These include:
1. Community Action Team2. Youth Gang Task force3. Specialized gang training4. Graffiti Removal5. Increase Neighborhood Advisory Group awareness
As in past surveys, the importance of police/citizen interactioncontinues to be a focal point. This interaction not onlyinfluences the citizen on performance and image issues, but also onfiscal issues. A citizen with a positive contact is more likely tovote for an increase in taxes for police services.
The majority of citizens, 93%, were willing to increase taxes, when

faced with the choice of either reducing police services orincreasing their taxes. The citizens would support an additionaltax increase of up to 12 dollars annually for police services.Many specifically stated they would support the increase, only ifthe taxes are guaranteed to be used for police services.
•
-
•

ACKNOWLEDGMENTS
A survey which represents all of Reno's citizens, as this one does,reflects considerable effort and cooperation by many people.Without their help, it would not be possible for a project of thissize to be undertaken.
Special thanks to Dr. Sandra Neese and Dr. Rosalie Marinelli of theUniversity of Nevada, Reno. Dr. Neese and Marinelli evaluated thesurvey's content and impartiality. In addition, they providedpriceless time to help formulate several additional questions thatprovided valuable insight. Their help and assistance providecredibility and improve the accuracy of the results.
The success of a survey revolves around the people who talk to therespondents and record their answers. Our survey takers wererecruited from the University of Nevada, Reno, and the Reno PoliceDepartment's Reserve Officer and Explorer Programs. The Universityof Nevada, Reno's Criminal Justice Department is owed specialthanks for their continuing assistance in recruiting volunteersfrom classes to act as survey takers, and for giving us theopportunity to intrude on their precious class time in the process.
A special recognition goes to the volunteers who donated theirvaluable time to conduct the survey. The department wishes topersonally thank each of these volunteers: John Frey, KathyCaramella, Jose Rivera, Charlotte Garber, Robin Larsen, CarolDoyle, Michele Williams, Raquel Sandoval, Christina Turner, BarbaraArmitage, Chris Harris, Dan Davis, Nancy Jo Weld, StephanieDavidson, Stefanie Powell, Jaime Mantz, James Coffindaffer, ThomasRyan, Kelli Twiddy, Sandra Greenlee, Michelle Duke, ChristineO'Donnel, Holly Coffill, Stephanie Foss, Lance Newlin, Jody Rice,Tanya Folgate, Geoff Davis, Ben Willock, Tina McCarthy, Jack Reed,Roya Ebrahimi, Anne Schebler, Willette Forrester, Therese CiofaloO'Sullivan, Paul Gibson, John Vialpando, Kelli Richards, GregoryMcGee, Kimberly Coveri, Tara Anderson, Ralph Hawkins, Tami Pirkle,George Summerhill III, Robert Shigeta, Michael McDade, Karen Fish,Murray Stravers, Ginger Graves, Norah Dunbar, Michael Zerby, PeterCrofut, Christine O'Flaherty, Natalie Brignand, Kathy Schwebie,Keri Weyl and Ryan Herrick.
No survey can be completed without the many people who were willingto take time out of their busy day to answer the questions put tothem. Those answers were almost always thoughtful and were givenwith the intent of aiding the Reno Police Department. There were709 respondents who took their time to assist the department, andwe give them our most sincere thanks.
Finally, several of the department's employees who spent theirevenings coordinating the survey effort: Kevin Foley, Wally Wolfe,and Steve Bigham. Our appreciation is given to Captain Glensor'sCriminal Justice class at Truckee Meadows Community College which
5

also assisted with the surveys. Lieutenant Bill Bowen and^CadetJustine Marketti coordinated the Explorers that assisted in thesurvey. Cadet Marketti is owed special recognition for alsoassisting in the interview process. Sergeant Roger Clark andOfficer Bruce Mathai coordinated the Reserves that assisted in thesurvey. Without Cadet Marketti, the .Reserves and Explores, thissurvey would not have been a success.
DEMOGRAPHICS
This is the eighth in the series of major surveys. The firstsurvey consisted of 503 respondents and was concluded in June 1987.The second survey was finished in March 1938 and consisted of 703respondents. The third survey consisted of 884 observations andwas concluded on November 1988. The fourth survey was concluded inJune 19 89 and consisted of 720 observations. The fifth surveyconsisted of 701 observations and was completed in April 1990. Thesixth survey was completed in October 1990 and consisted of 731observations. The seventh survey was completed in March 1991 andconsisted of 828 observations. This survey consisted of 708observations and was completed in November 1991. The sample sizewas set at a minimum level to achieve our goal of surveying 1% ofReno's population annually.
The demographics for this survey are very similar to that of pastsurveys. Residents living in the central district represented 7%of the survey, the remaining 93%, were equally divided between thenorth and south areas of town.
The surveys racial breakdown reflects the 1990 census data forReno. The only difference between the census data and this surveyis in the Hispanic population. This was the second survey in whichseveral interviews were conducted in Spanish, to increase thenumber of Hispanic residents surveyed. The Hispanic population isalso the youngest of all the ethnic backgrounds.
Ranges were again used for age and income. This has dramaticallyreduced the number of refusals. The employment category was againexpanded to include students. The voter question measuredregistered voters rather than "did you vote in a specificelection."
•
7

Survey Design and Methodology
This is one of the most important aspects of the survey. Severalquestions have remained constant throughout all eight surveys.These questions provide the department with data that is used fortrend and time series analysis. In addition, new questions areintroduced periodically. When a question is developed severalsteps are undertaken. These steps include:
A. In house reviewB. External reviewC. Pre test the questionnaire
The external review has been accomplished with the assistance ofthe University of Nevada, Reno. The Center for Applied Research,Dr. Sandra Neese, Community Health Sciences, Dr. RosalieMarinelli, and Dr. Mike Havercamp and Criminal Justice Department,Dr. Ken Peak have all reviewed the survey. The importance of thequestion construction and design, demands both internal andexternal reviews.
Every effort is made to assure each area is proportionatelyrepresented. This is accomplished with the assistance of NevadaBell. They provide a list of telephone prefixes that cover theReno area, and the number of residents who are issued each specificprefix. A proportion of residents for each prefix is calculatedand this proportion is applied to the sample population. Randomphone numbers are generated for each prefix. Since more numbersare generated than called, phone numbers within a prefix aredistributed to survey takers randomly. Random calling willminimize the number of residents excluded from the possibility ofbeing selected.
To eliminate a potential bias resulting from interviewing whoeveranswers the telephone the Troldahl and Carter Selection table isapplied to the survey. This table is designed to keep the survey'spopulation consistent with Reno's population in regards to both ageand gender.
Volunteers are used from the Criminal Justice classes at theUniversity of Nevada, Reno. Students are used to reduce any policethreat or interviewer bias in the survey. The interviewer isintroduced to the respondent only as a volunteer from the City ofReno.
Volunteers are provided training before they conduct a survey. Thesurvey questions, respondent selection process, phone lists andsystem hardware are explained thoroughly to each student. Mockphone calls are undertaken to eliminate the possibility of datacontamination because of interviewer bias or confusion.
The actual interviews are observed continuously by the same
8

monitors. This provides consistency and confidence in the process.The monitor not only provides technical assistance to the surveytaker but corrects any possible bias before it can prejudice thedata. Common corrections include reminding the interviewer to readall the verbiage, maintaining the proper order of the questions andcompletely filling out the survey. The surveys were conducted at704 Mill Street. This location was chosen to minimize possibledistractions.
Data is coded into a DBASE XV program immediately after thecompletion of an interview. This method helps assure that theresponses are correctly coded. The same coders are used throughoutthe survey to assure consistency.
Data is then evaluated using the SPSS-PC statistical program. Aconfidence level of 95% is used when analyzing results. Thisanalysis enables data to be evaluated by demographic groups,geographic area, time frame and additional subgroups.
The first step in the analysis is to error check the data. Theevaluation is only as accurate as the data. The first statisticaltest undertaken is a simple frequency distribution. Cross-tabulations and proportions help evaluate and classify the data.Various other tests are then undertaken to provide measures ofcentral tendency, dispersion, distribution and analysis ofvariance.
A sample size of 400 is needed to achieve a 95% confidence level.This assures that independent samples will differ no more than 5%from the general population. Additional surveys are taken toreduce the error margin in the various components and subsets ofthe survey.
Several questions were added to this survey or modified since thelast survey. Contact was broken down into two categories, swornand civilian. This will allow the measurement of civilian contactalso. The word crime was taken out of the number one "crime"problem. This will measure the concerns of the citizen on bothpolice and non-police issues. Several additional questions wereadded to quantify fiscal issues, the gang problem and neighborhoodwatch. The follow-up question on community involvement was changedfrom COP+ to any departmental program.

ANALYSIS
The Support Services Division of the Reno Police Departmentrecently completed the eighth in a continuing series of citizenattitude and opinion surveys. The perceptions the citizens of Renohave about their police department have improved in almost allcategories. This survey, as in past surveys, has stressed bothdesign and methodology. A survey will only provide validinformation when structured and implemented carefully.
The public's opinion of the department's performance increased.The ratio of positive to negative responses was 14.2:1. Thisrepresents an improvement from the last survey of over 4%, andalmost 15% in the past year. This is the second highest score everreceived by the department. Only survey five, April 1990, receiveda higher score.
Of citizens that had an opinion, excluding fair responses, over 93%of the population rated the department's performance as good orvery good. This proportion has continually improved since theoriginal survey rating of 75%. The improvement is statisticallysignificant, which documents the department1s advancement. Whenlooking at the mean score of each survey, the current surveydemonstrated the best results. This survey yielded an averagescore of 3.99. This is on a scale of 1 to 5, with 5 being thehighest possible.
One of the major influencing factors in determining the citizens'perception of performance was contact by a departmental employee.When the contact with a citizen is viewed as positive thedepartment's performance is almost always rated positive. Thenumber of citizens contacted continues to increase. Over 58%of the population is contacted within a two year period, anincrease of over 6%. The results of officer and civilian contactare as follows:
Contact with an officerPos/Neg ratio % Satisfaction
Positive contact 66.7:1 98.5%No contact 18.6:1 94.9%Neutral contact 12.1:1 92.3%Negative contact 1.4:1 57.5%
Contact with a civilianPos/Neg ratio % Satisfaction
Positive contact 30.0:1 96.8%No contact 14.2:1 93.4%Neutral contact 8.0:1 88.9%Negative contact 2.7:1 72.7%
Several other factors influenced the performance rating. Generallyspeaking, the older a citizen is, the better the rating. There was
10

a statistical difference between citizens over fifty-five and thoseunder thirty-five. The younger residents were influenced byunsatisfactory officer attitudes and performance. In addition,this age group would like to see more police officers. The olderresidents were pleased with the management change. Citizens overseventy-five requested less traffic enforcement.
Female residents rated the department's performance higher than didtheir male counterparts. The biggest difference displayed betweenmen and women was in their perception of response time. The scoreswere higher from registered voters than citizens not registered tovote. Citizens who could name a departmental program gave thedepartment a higher performance rating. Those who named a programused the program to evaluate the department, while those who couldnot relied more on the media for their opinions.
All of the areas ranked the department the same with the exceptionof Stead. This area had an 86% satisfaction rate compared to theremainder of the city/ 92% to 95%. The one noticeable differencein the Stead area was an increase in the respondents citing a slowresponse time.
The departmental rating on dealing with lawbreakers continues toimprove. This ratio, 14.4:1, is at an all time high. Of those whoexpressed an opinion, excluding fair responses, over 93% weresatisfied. Events during the survey period magnified the number ofpositive responses to this question.
Again, contact with a departmental employee continues to influencethis question. Citizens with a positive contact rate thedepartment positively 97% of the time, while a negative contactreduces this to under 73%. The lowest assessment comes fromcitizens involved in an accident, who were concerned about responsetime. Their ranking was even lower than those arrested orticketed. In fact the citizens who received a ticket rated thisquestion positive over 92% of the time. Contact with civilianemployees duplicated officer contact.
One of the more surprising correlations occurs between thedepartment's dealing with lawbreakers and whether the citizen couldname a specific departmental program. Those that could, rated thedepartment higher. This reiterates the premise that an informedcitizen is also a supportive citizen. School programs, i.e. DARE,tend to influence the citizen more than enforcement programs, i.e.CAP.
-Several other demographic characteristics also correlate to thisquestion. Education level influences the citizens' rating of thedepartment on this question. The ratings peak with high schoolgraduates and then decline as the respondents' level of educationincreases. The assessment was highest from unemployed residentsand lowest from full time homemakers. Those residents over the age
11

of seventy-five gave the department its lowest rating. Ratingsgenerally increase with age until the respondent reaches seventy-five. The older the citizen the tougher they want the laws anddepartment to be.
The department's image within the community continues to reboundsince the sixth survey. The ratio of positive to negativeresponses was 6.9:1. This figure translates into over an 87%satisfaction level. Quite a dramatic improvement since theoriginal survey, which had only a 41% satisfaction rate. The firstsurvey coincided with the inception of the COP+ philosophy.
Contact was again one of the most important components indetermining the citizens' perception of the department's image.
Mean scorePositive contact 3.82No contact 3.79Neutral contact 3.3 2Negative contact 2.89
The major difference occurs not with or without contact but betweenpositive and negative contact. This survey produced the firstdifference between the type of contact. Those arrested or citedfeel that the department's image is low, when compared to residentswho were contacted for other reasons. Contact by civilianemployees also influences the department's image but not to thesame degree.
Women rated the department's image higher than men. The oneexception was full time homemakers. The older a respondent, thebetter their rating was of the department's image. The departmentis held in higher esteem by older residents. In general, thedepartment receives a benefit when a citizen can name a specificdepartmental program. One exception to this was the Explorerprogram, although only five residents knew of this program.
The majority of the negative responses can be attributed toingrained citizen attitudes and perceived negative officer attitudeand performance. The biggest improvement in image can beattributed to the change in the Reno Police Department's managementand positive media coverage during the past six months.
The image rating was essentially the same in all areas. There weresome differences in the reason for the specific rating. Thenortheast area tended to be more aware of programs and pleased withresponse time and patrolling efforts. The major concern of thisarea deals with brutality. The northwest area was concerned aboutofficer attitudes but pleased with management. Stead area waspleased with officer attitudes but not pleased with response times.The southeast was influenced by both media coverage and responsetime. The southwest called the response time poor and was pleased
12

with the new management.officer1s attitude.
The central area was satisfied with the
The were some differences between the various races. Blackresidents were the lowest at 75% positive. This compares to whiteresidents, 87%, and Hispanic residents at 90%.
The majority of the citizens, 73%, feel that Reno is a safe placeto live. This is a decrease since the last survey, and representsthe lowest score in survey annals. A large majority of this can beattributed to an increase in gang activity and publicity. Inaddition, a larger percentage of residents feel that Reno isbecoming a less safe place to live, than in the last survey.
Several of the demographic characteristics yield differences onsafety. The differences follow:
Percentage thatfeel Reno is safe?
Percentage that feelReno is becoming less safe
MenWomen
Less than 1More than 10
Under 25Over 65
OwnersRenters
EmployedUnemployedRetiredHomemakerStudent
76.5%69.3%
Lived in Reno (years)88.8%68.4%
Age78.0%64.7%
Rent or Own71.7%75.0%
Employment75.1%80.0%61.8%56.0%89.4%
66.3%69.0%
53.6%73.5%
57.0%71.6%
72.1%62.2%
68.6%57.1%72.5%76.9%45.5%
The older residents tend to feel that crime is increasing, whileyounger residents are more concerned about gangs. Residents whohave lived in Reno more than fifteen years feel that both theincreases in the number of transients and the city's populationhave contributed to Reno becoming less safe. Residents who residein houses noticed the population increase, while mobile home andcondo residents attribute the reduction of safety to gangs,transients and an increase in the crime rate.
Citizens who reside in northwest Reno feel the safest among all the
13
areas of Reno. The southeast residents had the lowest feeling ofsafety. Southwest residents recorded the largest decrease in theirfeeling of safety, compared to the previous year. Over 67% of thepopulation feel that Reno is becoming a less safe place to live.Central and Stead observed the smallest amount of change during thepast year.
The number one problem in Reno was gang activity. The past twosurveys have indicated drugs as the number one problem. The numberof residents stating gangs were the number one problem, more thantripled since the last survey. Both theft and narcotics responsesproportionally decreased. Also decreasing was murder, violentcrimes and driving under the influence. The only other categoryshowing an increase was the homeless/transient issue.
Each area of town cited gangs as the number one problem. Howeverthere was less emphasis on gangs in the more affluent districtscompared to apartment/higher crime areas. The Asian community wasthe most concerned about gangs, while the black and Indianpopulation were equally concerned about drug issues. There was nostatistical difference between men and women on this point.Property owners were more concerned about both gangs and theftwhile renters were also distressed about narcotic criminalactivity. As income increases, the respondent's priorities shiftfrom gangs to theft and traffic issues. The more educated therespondent the more likely they will indicate drugs as the numberone problem rather than gangs or theft.
The older the respondent the more concerned about drugs and theless concerned about gang issues. Residents under twenty-five,declared gangs as the number one problem one-half of the time.This compares to retired residents who designated gangs the numberone problem one-quarter of the time. Newer Reno residents are moreconcerned about gangs than older residents. This would seem toindicate that Reno's gang problem is less than other cities.
Citizens were given the opportunity to evaluate the department'shandling of the gang situation. Of citizens expressing an opinion,excluding fair responses, 79%, voiced a positive response. This isoutstanding considering that 86% feel Reno has a gang problem. Thecitizens were given an opportunity to state how the would solve thegang problem. The results follow:
Tougher penalties 157 39.7%More educational programs 88 22.2%More community involvement 58 14.7%More police enforcement 55 13.9%Gang task force 15 3.8%Parental responsibility 15 3.8%Reduce media coverage 8 2.0%
The majority, 82%, feel the best approach to solve this problem is
14
to pursue a community wide approach to the gang problem.
The higher the respondents1 level of education, the more likelythey were to feel that Reno has a gang problem. A largerpercentage of residents residing in mobile homes, regard Reno ashaving a gang problem, compared to all other housingaccommodations. Gangs are more of a concern with women. The olderthe respondent the better they felt the department was handling thecurrent gang crisis.
Citizens were asked whether they would like increased policeservices even if it means an increase in taxes. The majority ofthe respondents, eighty-four percent, were in favor of increasedpolice services. The following question attempted to quantify thisby asking how much they would be willing to pay for increasedpolice services. The pass/fail mark appears to be around twelvedollars annually. Numerous citizens indicated their support wascontingent with the money being specifically earmarked for thepolice department. Several citizens expressed concerns about the"safety 88" money not going to the department as promised. Thechance of passing a tax increase would be improved by guaranteeingthat the new tax money goes to the police department and not thegeneral fund.
Several factors positively correlated to this question.Respondents were more likely to vote for additional taxes if theyknew of a departmental program, are female, employed, and havefinished high school or attended college but not post-graduateschool. A citizen is more likely to support the tax increase andat a higher level if they have had positive contact with an officeror civilian employee. This supports the conclusion of previoussurveys that positive contact translates to tax dollars. Thedepartment has more support from both white and Hispanic citizensand has the least support from Asian residents. The department hasmore support in the middle ranges for both age and income.
The final fiscal question forced respondents to make a choicebetween increased taxes or reduced services. Clearly the citizensof Reno do not want police services reduced. Almost 93% preferredan increase in their taxes over reduced police services.
Once again residents were asked if the department was communityoriented. The department was considered community oriented by 87%of the citizenry. This is an increase of almost 3% since the lastsurvey. Two factors correlated with this question. Those who knewof a departmental sponsored program felt the department wascommunity oriented. By far the most popular program was DARE.More people, 169, have heard of DARE than all the other programscombined. Respondents were more likely to know of a program when,they are in a higher income bracket. Also, the younger they are,the higher level of education and not living in an apartmentcontribute to program awareness. Contact with a civilian employee
15

also influenced this answer.
Only 8% of the population have attended a neighborhood advisorygroup meeting. Almost half of the respondents indicated awillingness to attend a gathering. Of those that have attended,9 3%, felt it was worth their time. Neighborhood advisoryparticipants tend to be older, higher educated and a registeredvoter.
The last question gave respondents an opportunity to comment onanything else concerning the Reno Police Department. Most of thesecomments echoed previously discussed answers. Specific issue andperformance accolades dominated the comments. No one requestedfewer police officers or less patrolling, but 35 respondentsexpressed a desire for more police and increased visibility. Thenew management team and current direction that the department istaking, continues to receive a positive response from thecommunity. Finally, 12 respondents were pleased with theopportunity to express themselves via the survey.
-
16

FREQUENCIES
How long have you lived in Reno?
Less than ons year 4 3One to five years 194Six to ten years 105Eleven to fifteen years 83More than fifteen years 282
What area of Reno do you reside in?
NortheastNorthwestNorth Sub.SoutheastSouthwestCentral
7319940
12122054
How would you rate the Reno Police Department's performanceoverall?
VeryPoorFairGoodVery
Poor
Good
1225112337189
What is it that caused you to give this evaluation of thePolice Department?
Personal experience 109Good officer performance issues 78Good response time 83media issues 53Positive officer attitude 40Poor response time 26Neighborhood patrols and visibility 25Poor officer performance issues 24Poor officer attitudes 24Issues relating to other agencies 19
How would you rate the Police Department in dealing with thosewho break the law?
VeryPoorFairGoodVery
poor
Good
427
128298148
17

Very poorPoorFairGood
1054
168338
6. What is it about how the Police Department deals with thosewho break the law that caused you to give that rating?
Good officer performance issues 128Media coverage 8 6Personal experience 40Good officer attitude 3 3Poor officer performance issues 23Need to get tougher 2 3Issues relating to other agencies 19Good response time 18
7. How would you rate the Reno Police Department's image withinthe community?
10
Very Good 106
What is it about the Department's image that has caused you togive that response?
Media coverage 13 8Citizen's attitude towards police 72Good officer performance issues 53Personal experience 45Good officer attitude 40Positive management 39Poor officer attitude 31Good response time 22Community involvement 21Neighborhood patrols 15Poor officer performance issues 15
Within the past two years, have you come into direct personalcontact with an officer of the Reno Police Department?
Yes 413No 295
18

10. How did your last contact occur?
Social 97Given a citation/arrested 64Given assistance 62Complainant 55Other 44Reported incident 31Involved in an accident 2 4Interviewed 24Arrested 13
11. How would you evaluate the quality of that last contact?
Positive 235Neutral 37Negative 57
12. Is there something specific about that contact that influencedyour opinion?
Yes 238No 82
13. If yes, please explain?
Good officer attitude 108Poor officer attitude 3 5Good officer performance 28Good response time 25Poor officer performance 15
14. Within the past two years, have you come into direct personalcontact with a member of the Reno Police Department, who isnot an officer?
Yes 176No 531
15. With whom was your last contact?
Front desk 45Social 34Other 28Dispatch 26Animal control 2 5Work cards 11Parking attendant 6
19

16. How would you evaluate the quality of that last contact?
Positive 109Neutral 19Negative 19
17. Is there something specific about that contact that influencedyour opinion?
Yes 8 6No 53
18. If yes, please explain?
Good employee attitude 40Good job performance 17Poor employee attitude 8Poor job performance 7Good response time 5
19. Do you feel that Reno is a safe place to live?
Yes 493No 182
20. In the past year has Reno become a more safe or a less safeplace to live?
More safe 52Stayed the same 166Less safe 455
21. Why is that?
GangsCrime is increasingIncreased population growthNo changeIncreasing murder and violent crimesTransientsGood officer job performanceMedia coveragePolice visibility
-rimes
1868376373623171613
20

22. In your opinion, what is the number one problem in Reno?
GangsDrugsHomelessGrowthTheftOther agency issuesMurder and violent crimesDUI/trafficGamblingCity councilFiscal issues
25788604633282121161310
23. How effective has the Reno Police Department been in dealingwith gang issues in the Reno area?
veryPoorFairGoodVery
Poor
Good
315615825173
24. Do you feel that Reno has a gang problem?
Yes 560NO 89
25. How would you deal with gangs and gang issues in Reno?
Tougher penalties 157More educational programs 88More community involvement 58More police enforcement 55Gang task force 15Parental responsibility 15Reduce media coverage 8
26. Do you support expanded police service to meet communitydemand even if it means increased taxes?
Yes 558No 105
27. What is the most you would be willing to spend on additionaltaxes?
None 1675 to 8 dollars 1269 to 12 dollars 13613 to 16 dollars 280
21

28. It is unlikely that the present level of police services canbe maintained by the current tax rate. Would you rather havereduced police services or an increase in taxes?
Reduced services 44Increased taxes 571
29. Do you feel that the Reno Police Department is communityoriented?
Yes 547No 8 5
30. Can you name a specific community program sponsored by theReno Police Department?
Yes 322No 3 67
31. Which program?
DAREPALCOP+Neighborhood WatchOther
16931272570
3 2. Have you ever been involved with one of the Department' sneighborhood advisory groups?
Yes 57No 641
33. Was the meeting worth your time?
Yes 53No 4
34. Would you be interested in attending a meeting?
Yes 266No 329
35. Do you live in a house, apartment, motfile home, or condo?
House . 3 92Apartment 2 06Mobile Home 40Condo 59
22

36. Do you rent or own?
37
Rent 3 3 2Own 3 63
ou currently
EmployedUnemployedRetiredHomemakerStudent
emplo
47232
1162649
3 8. Which of the following categories best describe your totalfamily income during the past year?
Under $20,000 185$20,000 - $29,999 129$30,000 - $39,999 109$40,000 - $49,999 75$50,000 - $59,999 50$60,000 - $69,999 19$70,000 & Higher 55Refused 87
39. What is the highest level of formal education you havereceived?
Less than high school 49High school graduate 2 04Some college 251College graduate 144Post graduate college 47
40. Which one of the following ranges best describes your age?
182636465666
- 25- 35- 45- 55- 65- 75
125162149937263
76 & older 22
41. What was the respondents' gender?
Male 363Female 344
23

42. What is your race?
WhiteBlackHispanicAsianAmerican IndianOther
6061731191111
43. Are you a registered voter?
Yes 493No 203
44. Do you have any additional comments or concerns regarding theReno Police Department?
Good officer performance 41Good RPD management 27Need more patrolling 18Need more police 15Like the surveys 12Fiscal issues 10Get tougher 10Specific issue 10
24

CITIZEN'S OPINION OF PERFORMANCERA TIO OF POSITIVE TO NEGA TIVE RESPONSES
PosIT1VE
RESPoNSES
15 -
10*
5 -
.0-'
/
I I
c
1
/
5
\
/ '
13
>**
1
.6•-—••
-
14— — -
- -}T0f
f
.2
#1 #2 #3 #4 #5
SURVEY# 6 # 7 # 8

CITIZEN'S OPINION OF PERFORMANCEPERCENTAGE WITH A POSITIVE OPINION
100%pERCENTAGE
POSITIVE
90%
80%
7 0 % -
60%
94%
90%89%
93% 93% 93%
# 1 #2 #3 #4 #5 #6
SURVEY#7 #8

DEALING WITH THOSE WHO BREAK THE LAWRA TIO OF POSITIVE TO NEGA TIVE RESPONSES
o#1 #2 #3 #4 #5
SURVEY# 6 # 7 # 8

DEALING WITH THOSE WHO BREAK THE LAWPERCENTAGE WITH A POSITIVE OPINION
100%
pERCENT
P0SIT
VE
90%--
80%
I 70%--
# 1
88% 89% 89%,
92%
# 2 # 3 #4 #5
SURVEY# 6 # 7
94%
# 8

CITIZEN'S OPINION OF THE POLICE IMAGERA TIO OF POSITIVE TO NEGA TIVE RESPONSES
#4 #5
SURVEY# 6 # 7 # 8
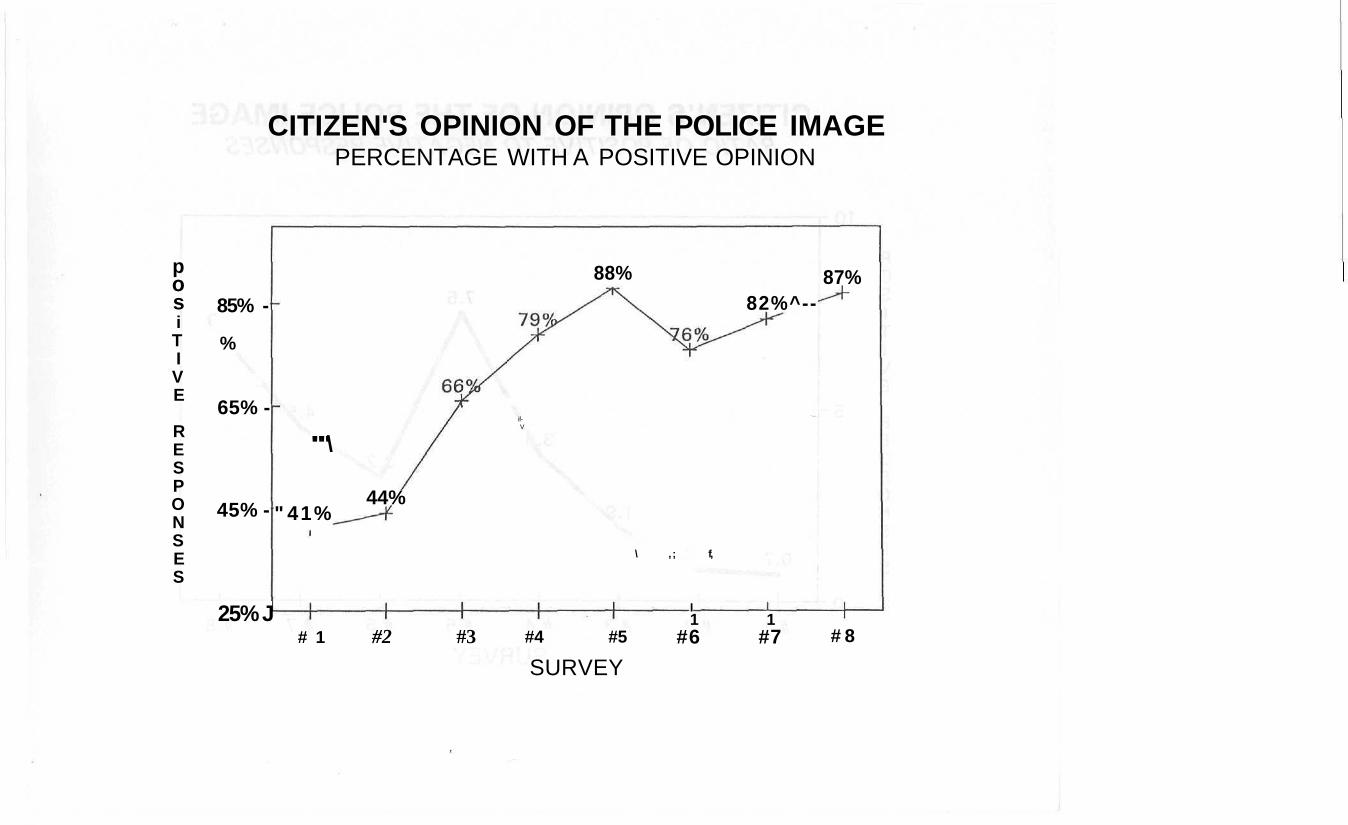
CITIZEN'S OPINION OF THE POLICE IMAGEPERCENTAGE WITH A POSITIVE OPINION
posiTIVE
RESPONSES
85% -
%
' - • • '
65% -
45% -
25% J
'""\
" 41%44%
88%
if-V
\ , ; f,
I1
82%^--
" • • .
1
87%
# 1 #2 #3 #4 #5
SURVEY#6 #7 # 8

CITIZEN'S OPINION OF IMAGEOFFICER CONTACT
GOOD
BOOB
RQSIT!VEJQQN7M}T
PQQB
GOOD
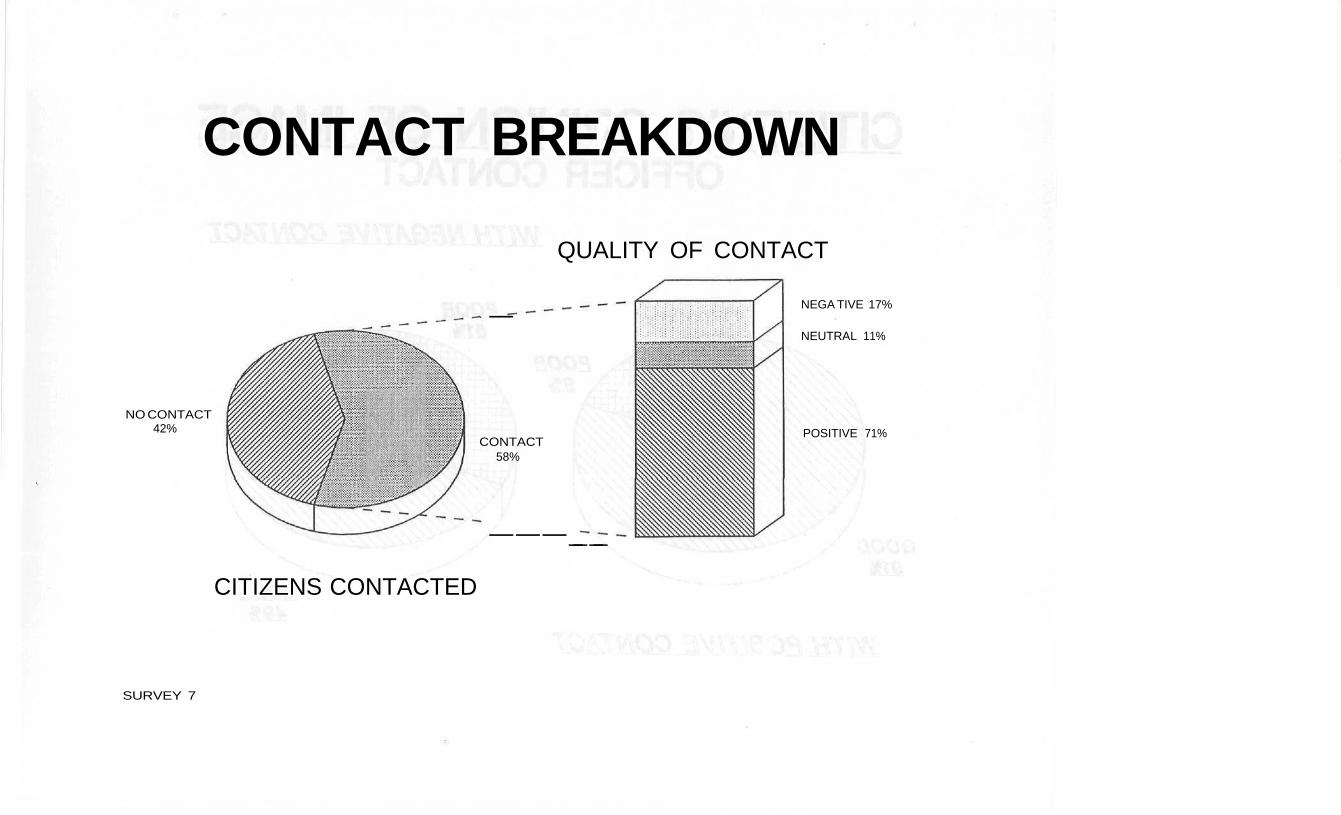
CONTACT BREAKDOWN
NO CONTACT42%
QUALITY OF CONTACT
—
CONTACT58%
— — — __ __
CITIZENS CONTACTED
NEGA TIVE
NEUTRAL
POSITIVE
17%
11%
71%
SURVEY 7

90%
PERCENTAGE
85%
80%
75%
IS RENO SAFE?PERCENTAGE OF POSITIVE RESPONSES
81%
70%#1 #2 #3 #4 #5 #6
SURVEY# 7 # 8

IS RENO SAFEBY DEMOGRAPHIC CHARACTERISTICS
j MALE
| FEMALE
; IN RENO LESS THAN 1
IN RENO MORE THAN 10
/ UNDER 25
/ OVER 65
OWNERS
RENTERS
60
SURVEY 8
-
-
-
-
" • V : : h , :
-
69.3°A
68.4%
64.7%
71
% 70%
76.5% j
88.8%
78% •
7% ;
75% - i,i i
80% 90% 10(

IS RENO SAFEBY AREA OF TOWN
NORTHEAST
NORTHWEST
STEAD
SOUTHEAST
SOUTHWEST
CENTRAL
60%
SURVEY 8
65%
71.6%
71.1%
68.1%
70%
72.5%
72.5%
75%
78%
80% 85%

IS RENO SAFEBY EMPLOYMENT STA TUS
EMPLOYED
UNEMPLOYED
RETIRED
HOMEMAKER
STUDENT
50%
-
-
-
56%
6 1 . 8%
i
75. 1 %
i
80°/c
89
i
.4%
60% 70% 80% 90%SURVEY 8

IS RENO MORE OR LESS SAFEIN THE PAST YEAR
LESS SAFE67.6%
MORE SAFE7.7%
THE SAME24.7%
SURVEY 7

w
-uO
enenm01
ato >
*2 en
00m
o zEl m
O
30m

DEPARTMENTAL PROGRAMS
NAME A SPECIFIC PROGRAM?
YES87%
NO13%
RPD COMMUNITY ORIENTED?
YES47%
NO53%
SURVEY 8

WHICH PROGAM WAS NAMED
^. \ i*i-\fKK,J V ? l l^ •-̂ •••?.
DARE52%
OTHER22%
NEIGHBORHOOD WATCH8%
SURVEY 8

CITIZEN'S VIEWS ON THE GANG PROBLEMHOW TO SOLVE IT
TOUGHER PENALTIES40%
MORE EDUCATION22%
OTHER6%
POLICE ENFORCEMENT18%
MAJOR 8
INVOLVE COMMUNITY15%

RENO POLICE DEALING WITH GANGSOVERALL EFFECTIVENESS
FAIR28%
MAJOR 8
GOOD44%
VERY POOR
POOR5%
VERY GOOD13%

POLICE SERVICESREDUCE SERVICES OR INCREASE TAXES
INCREASE TAXES93%
REDUCE SERVICES7%
MAJOR 8-FISCAL ISSUES

ADDITIONAL TAXESTO EXPAND POLICE SERVICES
100%
50%
0%
NOYES
PASS
5 TO 8 DOLLARS
167
542
PASS
9 TO 12 DOLLARS
293416
FAIL
. . • ] • • ; . • • , • - • • • . - . : • • . • . • .
13 TO 16 DOLLARS
/ 429280 ^ : ; 3
YES NO
MAJOR 8--FISCAL ISSUES

NORTHEAST RENOPERCENTAGE OF POSITIVE RESPONSES
pERCENTAGE
..„,....
IMAGE
, 100%
»• 9 0 %
80%
70%
60%
LAWBREAKERS
PERFORMANCE
'r
-
t f - - . . .
#
83
86
91
i
4
3%
1 %
1 %
#
92
85
85
*
i
5
5%
7%
1 %
\ /V# 6
61.5%
.76.7%80%
/-
z~—~~~/ i"
. . . i •<:- i : ( *;•
I
# 7
84.2%96.7%
93.4% ;
- — - — •
#
86
97
93
*
i
8
5%
8%
3%
SURVEY
PERFORMANCE LAWBREAKERS IMAGE
THREE KEY QUESTIONS

NORTHWEST RENOPERCENTAGE OF POSITIVE RESPONSES
100%p
R 90%C
N 8 0 %
TA 70%GE 60%
IMAGE
LAWBREAKERSPERFORMANCE
-
i
# 4
80%
87.8%88.9%
^ ^
i
# 5
88.2%
86.3%
94.8%
\N.
I
# 6
74.4%
95.4%
94.6%
—-8
• — *
i
# 7
76.6%
91.8%
93%
O8
t
# 8
87%
90.9%93.2%
SURVEY
PERFORMANCE LAWBREAKERS IMAGE
THREE KEY QUESTIONS

STEADPERCENTA GE OF POSITIVE RESPONSES
pERCENTAGE
100%
90%
80%
70%
60%# 4 # 5 # 7 # 8
IMAGE
LAWBREAKERS
PERFORMANCE
79.2%82 .1%88.9%
8 2 . 1 %87.5%93.4%
69.7%88.2%84 .1%
78.9%
90.9%
91.2%
88.5%
88.9%
86.7%
- PERFORMANCE
SURVEY
LAWBREAKERS IMAGE
THREE KEY QUESTIONS

SOUTHEAST RENOPERCENTAGE OF POSITIVE RESPONSES
100%pER 90%C
N 8 0 %
TA 70%G
60%
IMAGE
LAWBREAKERS
PERFORMANCE
m
I
# 4
76.2%
85.7%
92.8%
__-—«-
^ ^ * c — —
i
# 5
91.2%
90.8%
96%
___—^~»-^_—
|
# 6
76.2%
94%
94.4%
n
- — ~ ^ ~ ~ ~
I
# 1
84.5%
90.6%
95.7%
i
# 8
91.1%
95.4%
92.8%
PERFORMANCE
SURVEY
LAWBREAKERS IMAGE
THREE KEY QUESTIONS

SOUTHWEST RENOPERCENTAGE OF POSITIVE RESPONSES
pERCENTAGE
100%
90%
80%
70%
60%
IMAGELAWBREAKERSPERFORMANCE
i
# 4
80.8%84.85%89.1%
-A
I
# 5
90.2%
94.8%
95.3%
.
n81
93
95
* —
i
6
.5%
.2%
. 1 %
•—<
— 1
•-•si-".
#
CO
CO
CO
CO
O
C
O
* •
i
1
9%
8% :[
1 %" ;
Q
• — *
1
# 8
86.3%94.1%
95.4%
SURVEY
PERFORMANCE LAWBREAKERS IMAGE
THREE KEY QUESTIONS

CENTRAL RENOPERCENTAGE OF POSITIVE RESPONSES
pERCENTAGE
100%
90%
80%
70%
60%# 6 # 7
IMAGELAWBREAKERSPERFORMANCE
72.2%
83.3%
86.7%
71.4%
89%
87%
84.1%
87.2%
87.5%
75.7%
88.9%
88.9%
87.5%
93.8%
92.5%
SURVEY
- ® - PERFORMANCE - LAWBREAKERS IMAGE
THREE KEY QUESTIONS
QUALITY ASSURANCE UNITMINI-SURVEYS
Central Area Day ShiftTraffic Citations
Work CardsAnimal Control

Reno Police DepartmentQuality Assurance Unit Survey
February 9, 1990
Department-Citizen Interaction Survey/Central Area - Day Shift
The Quality Assurance Bureau recently conducted the second survey in the Central area ofcommand and this completed survey represents the second of Day shift.
The data used for this survey was obtained from the Department's PLIMS system, using theweek of January 14,1990 through January 20,1990. This survey was completed by the QualityAssurance staff by use of the telephone.
The survey consisted of twenty completed questionnaires. Following are the results of thesurvey:
1) Total completed questionnaires
20
2) Sex
Male: 10
Female: 10
3) Ethnicity
White: 19Indian: 01
4) Age
21-30: 0531-40: 0641-50: 0251-60: 0461-70: 02
5) Results
Refer to attached questionnaire for totals and results.

6) Summary
The question of a lengthy delay before the arrival of an officer was answered"affirmative11 by six (6) respondents. These responses are listed below:
4) 29 minute delay, held 29 minutes by dispatch. The call was a panhandler infront of the business. The panhandler had been in the business and had obtainedmoney from an employee. The officer arrived and cleared with solved at scene.Apparently no crime was committed.
6) 28 minute delay, held 24 minutes by dispatch. The call was a vehicleburglary which had just occurred. As it turned out, it was a GTA and theofficers recovered the vehicle at 9th/Sutro less than an hour after the call wasreceived. The officer cleared with a recovered stolen vehicle.
7) 20 minute delay, held 19 minutes by dispatch. The call was a disturbance ofa loud party in one of the rooms at the Lido Motel. The officer arrived andcleared with a gone on arrival disposition.
12) 22 minute delay, held 16 minutes by dispatch. The call was a CPCrequesting to go to Detox. Negative disturbance.
14) 43 minute delay, held 39 minutes by dispatch. The call was two transientssleeping in the dumpster. Negative disturbance.
15) 8 minute delay, held 3 minutes by dispatch. The call was an unoccupied,recovered stolen vehicle.
With the above listed calls, we feel that Respondent #15 did not have a legitimate complaintabout the length of time before the arrival of an officer. Respondents #4, #6, #7, #12 and #14had legitimate complaints. Their calls were held for excessive lengths of time by dispatch. Itcan not be determined if the delay by dispatch was due to a lack of available units.
Three of the respondents indicated that their call was answered by a recording. Respondent #7related that the dispatcher interrupted the recording after approximately 4 minutes. Respondent#14 related that the dispatcher came on the line after approximately 2 minutes. Respondent #17related that the dispatcher came on the line after approximately 1 minute.
Out of the twenty respondents, seven had some sort of comment concerning the service ofattitude of either the officer or the dispatcher. The comments are listed below:
Respondent #12 stated that she would like to see the officers arrive on scene faster. This callwas a CPC.

Respondent #14 answered "no" to the question of "Are you satisfied with the way that your callwas handled?11 This respondent was displeased because the officer never made contact with her.This call was a CPC.
Respondent #15 answered "no" to the question of "Did the officer convey an impression thatthere was concern for you?" The respondent stated that the officer conveyed the impression of:No big deal—just another call?" This respondent was not satisfied with the way the call washandled, because of the officers attitude. Also, this respondent would like to see a fasterresponse time.
This call was researched and it was found to be a recovered stolen vehicle. The Complainantfound her own vehicle and was disappointed when the officer did not attempt to obtainfingerprints.
Overall this survey had several complaints, but there were also many good comments. Theseven respondents which voiced complaints were either that of not having an officer respondquick enough, or that of the attitude of either the officer or the dispatcher. The most apparentnegative aspect of this survey, other than response time, was the poor attitude of either theofficer or the dispatcher. In regards to the complaints of response time, it cannot be determinedif these delays were due to the lack of available units at the time of the calls. The majority ofthe respondents were very pleased with the contact which was made by the Quality Assurancestaff and were happy with the service they received from the field units and dispatchers. Listedbelow are several of the good comments which were received by the Quality Assurance staffduring the survey:
-Good service from everyone involved.—Very efficient—helpful officer.—Good service.-Very nice dispatcher.-I appreciate having a police department like RPD.-The officers were very concerned.—I never have any problems with RPD. I appreciate the service.—We have a good working relationship with RPD.
Respondent #01:Respondent #02:Respondent #03:Respondent #04:Respondent #05:Respondent #06:Respondent #07:Respondent #08:Respondent #09:Respondent #10:Respondent #11:
—06, 07, 12—03, 12—1210, 12————

Respondent #12:Respondent #13:Respondent #14:Respondent #15:Respondent #16:Respondent #17:Respondent #18:Respondent #19:Respondent #20:
12-1007, 10, 12————
Respondent #2 answered "no" under the question of "Did the officer handle your call in abusinesslike manner?" The respondent stated that the officer had an attitude that the respondentwas "trash." Also, the officer acted as if he did not believe the respondents story. Therespondent would like to see a change in the attitude of police officers.
This call was researched and found to be a GTA. The officer arrived on scene and a report wastaken.
Respondent #4 answered "no" under the question of "Did the dispatcher convey the impressionthat there was concern for you?" The respondent stated that the dispatcher said, "There isprobably nothing that the police can do; but if you insist, we will send an officer." Therespondent felt that this was a very poor attitude for the dispatcher to have. Also, therespondent would like to see a faster response time.
This call was a possible fraud or obtaining money under false pretenses at the Palace Jewelryand Loan. The suspect had extracted money from an employee by relating a "sad story." Theofficer arrived on scene and did not locate the suspect.
Respondent #6 stated that he would like to see the officers arrived on scene faster. This call wasa GTA.
Respondent #7 answered "no" to the question, "Are you satisfied with the way your call washandled?" The respondent stated that the officers took sides with the suspects. Also, therespondent would like to see the officer listen more to the complainant. This call was a partyin a motel, involving 13 college students.
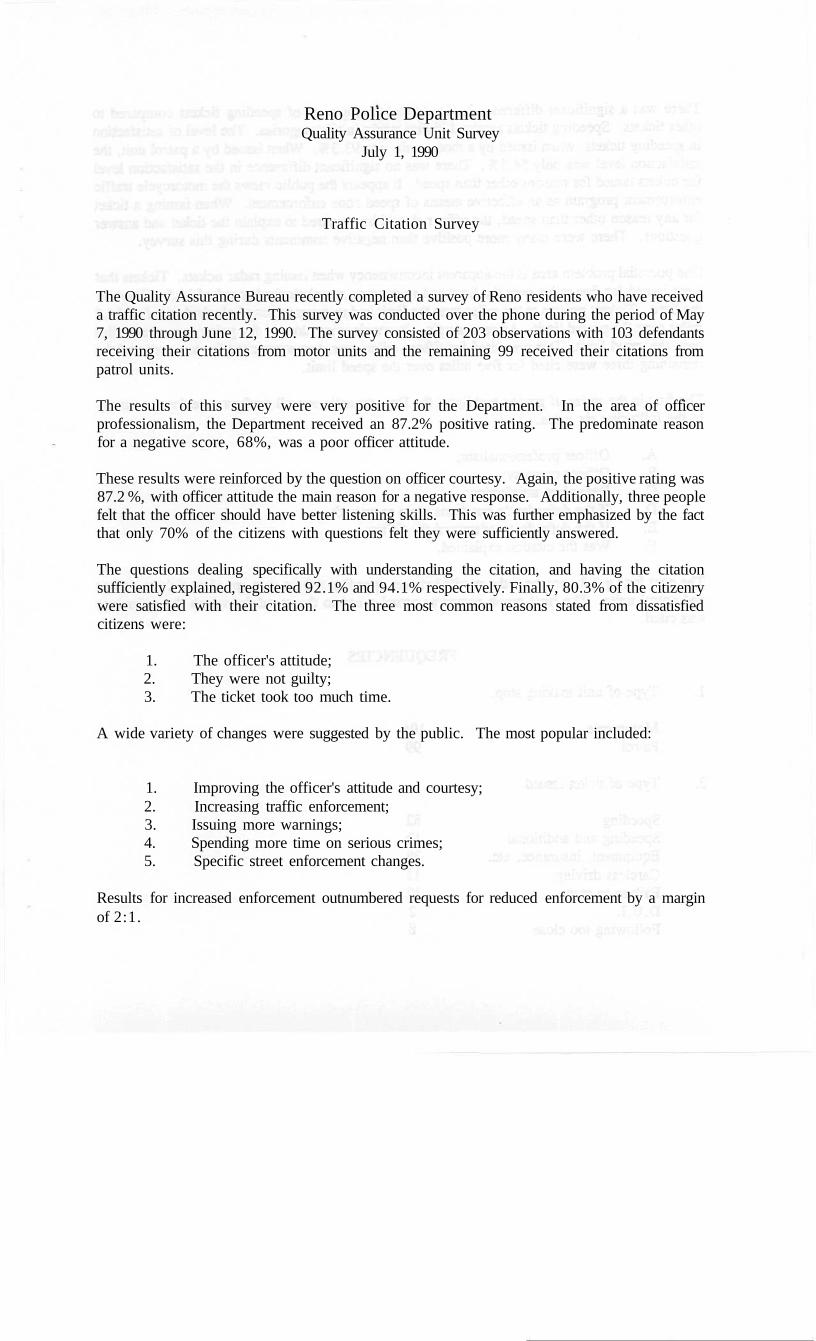
Reno Police DepartmentQuality Assurance Unit Survey
July 1, 1990
Traffic Citation Survey
The Quality Assurance Bureau recently completed a survey of Reno residents who have receiveda traffic citation recently. This survey was conducted over the phone during the period of May7, 1990 through June 12, 1990. The survey consisted of 203 observations with 103 defendantsreceiving their citations from motor units and the remaining 99 received their citations frompatrol units.
The results of this survey were very positive for the Department. In the area of officerprofessionalism, the Department received an 87.2% positive rating. The predominate reasonfor a negative score, 68%, was a poor officer attitude.
These results were reinforced by the question on officer courtesy. Again, the positive rating was87.2 %, with officer attitude the main reason for a negative response. Additionally, three peoplefelt that the officer should have better listening skills. This was further emphasized by the factthat only 70% of the citizens with questions felt they were sufficiently answered.
The questions dealing specifically with understanding the citation, and having the citationsufficiently explained, registered 92.1% and 94.1% respectively. Finally, 80.3% of the citizenrywere satisfied with their citation. The three most common reasons stated from dissatisfiedcitizens were:
1. The officer's attitude;2. They were not guilty;3. The ticket took too much time.
A wide variety of changes were suggested by the public. The most popular included:
1. Improving the officer's attitude and courtesy;2. Increasing traffic enforcement;3. Issuing more warnings;4. Spending more time on serious crimes;5. Specific street enforcement changes.
Results for increased enforcement outnumbered requests for reduced enforcement by a marginof 2:1.

There was a significant difference in the public's acceptance of speeding tickets compared toother tickets. Speeding tickets received higher marks in all categories. The level of satisfactionin speeding tickets, when issued by a motor unit, was 93.3 %. When issued by a patrol unit, thesatisfaction level was only 54.5%. There was no significant difference in the satisfaction levelfor tickets issued for reasons other than speed. It appears the public views the motorcycle trafficenforcement program as an effective means of speed zone enforcement. When issuing a ticketfor any reason other than speed, the officer should be prepared to explain the ticket and answerquestions. There were many more positive than negative comments during this survey.
One potential problem area is the apparent inconsistency when issuing radar tickets. Tickets thatwere issued for five miles over the limit had an average actual clocked speed of 14.5 miles overthe limit. Tickets written at ten miles over the limit had an average actual clocked speed of 14.2miles over the posted limit. As an example, six people were stopped for going seventeen milesover the speed limit. One was cited for fifteen miles over, two were cited for ten over and theremaining three were cited for five miles over the speed limit.
The first in the series of graphs highlights the Department's overall performance for the surveyin the following six areas:
A. Officer professionalism;B. Officer courtesy;C. Defendant satisfaction;D. If the defendant's questions were answered;E. If the defendant understood the ticket:F. Was the citation explained.
The next four graphs compare the results between speeding tickets, non-speeding tickets, motorand patrol units. The final graph compares actual speed to the speed for which the defendantwas cited.
FREQUENCIES
1. Type of unit making stop.
Motorcycle 104
Patrol 99
2. Type of ticket issued.
Speeding 82Speeding and additional 19Equipment, insurance, etc. 38Careless driving 11Failure to stop 12D.U.L 2Following too close 8

Illegal turn 10
Multiple citations w/o speed 21
3. Was the officer professional?
Yes 177No 25
4. Why was the officer not professional?
Rude, poor officer attitudeTook too much timeOfficer didn't know lawsPoor safety in stopShouldn't have been stoppedOfficer didn't listenTicket too severeShould not have been searched
5. Was the officer courteous?
YesNo
6. Why was the officer not courteous:
Rude, poor officer attitudeCould have been friendlierOfficer did not listenShould not have been searched
7. Did the officer explain the citation to you?
Yes 191No 12
8. Did you understand the citation?
Yes 187
No 16
9. Did the officer answer your questions?
Yes 35No 15No questions 153
171212111
17725
19131
D you?

10. Were you satisfied with the incident?
Yes 163
No 39
11. What dissatisfied you?
Just do selective enforcement 1Took too much time 5Not guilty 10Poor officer attitude 17Did not understand ticket 3Too much traffic enforcement 1Response time too slow 1Too many officers on scene 1Should not be searched 2
12. What changes would you like to see made?
None 147Don't just do selective enforcement 1Stop hiding motor units 2More school zone enforcement 2More enforcement 9Issue warnings 6Raise the speed limits 1Use less radar 1Increase speed on Lakeside Drive 1Speed more time on serious crimes 6More consistency in speed limit on 7th St. 2Improve officer attitude 12More enforcement on Keystone 3Fewer school zones on Vassar 1Be quicker when issuing a ticket 1Officers should learn the laws 2Don't search everyone 12nd officer shouldn't approach side of car 1Too many officers at scene 1Use better judgement 1Don't pick on kids 1Review the Right Away law 1Don't be racist 1

15
CITflTIONSRCTURL SPEED RND CITED SPEED
NUMBER OF TICKETS
ID -
0
EfflHCITED 15^^CITED 10ES3CITED 5
10 11 12 13 14 15 16 17 18 19 20 21
RCTURL SPEED OVER POSTED LIMIT

TRRFFIC CITRTIONS
QUESTIONS
PROFESSIONRLISM
COURTEOUS
SRTISFIED
QUESTIONS RNSUERED
UNDERSTRND
CITRTION EXPLRINED
87.2
87.2
80.3
70
92.1
94.1
I I I I I 1 I i l I l l l l I l t l l 1 .... I
65 70 75 80 85 90 95 100PERCENTRGE
PERCENTRGES

TRRFFIC CITRTIONSSPEEDING RND OTHER TICKETS
QUESTIONS
PROFESSIONRLISM
COURTEOUS
SRTISFIED
QUESTIONS RNSUERED
UNDERSTRND
CITRTION EXPLRINED
9777.5
94.180.4
89.1
85.758.7
100
9791.2
l l l I i i i i I i i i t I i t i i i t i i I i I i i I i i i i I i i i i ^SPEEDING65 70 75 80 85 90 95 100 105
PERCENTRGES

TRFFFIC CITflTIONSMOTOR flND PRTROL UNITS
QUESTIONS
PROFESSIONRLISM
COURTEOUS
SRTISFIED
QUESTIONS RNSUERED
UNDERSTRND
CITRTION EXPLRINED
f . • t >• " '
I I I ! I 1 I I I I 1 I 1 1 1 I I I I I
PRTROLMOTOR
65 70 75 80 85 90 95 100 105
PERCENTRGES

eneno
zicnUJ
r- CK *-*
L J CLLD
u (=1
o
ena
enUJ
GS
enLUoa:LU
uLUQ_

SOLUTIONS
1. Package all gaming and liquor forms with a cover sheet, sample attached, and make themaccessible without employee assistance. Only the gaming/liquor form need be done. When anapplication is required, this form is used 9 out of 10 times.
This would reduce the pressure on the center desk and enable applicants to get startedimmediately.
2. Replace the reception desk with a second work station, diagram attached. An applicantspends a majority of his time waiting for his application to be processed. This includes runningthrough NCIC, CJIS, updating PLIMS, collecting fees, fingerprinting and photographing. With11 applicants per hour, 66 minutes of processing time is required to avoid delays. Waiting timecannot be eliminated, by the current system, without a second work station.
This can be accomplished at a reasonable cost. A PLIMS terminal currently costs $1,595, theSperry unit, for NCIC and CJIS, runs approximately $1,400. Other equipment required shouldbe nominal. This new unit should handle the process from approved application to issuing thecard. This will insure delays are reduced and not just shifted.
3. A part-time employee should be added four days a week. This person would coverlunches, 11:00-2:00, Monday, Tuesday, Thursday and Friday. This will keep staffing at fullstrength throughout the day. Waiting time increases over 41 % when the staff starts their lunchhour.
The application of these recommendations should significantly reduce the time it takes to receivea work card. It is estimated that these changes will reduce the total time to receive a card toapproximately 35 minutes. This reduces the waiting time of the applicant by 54%.
•
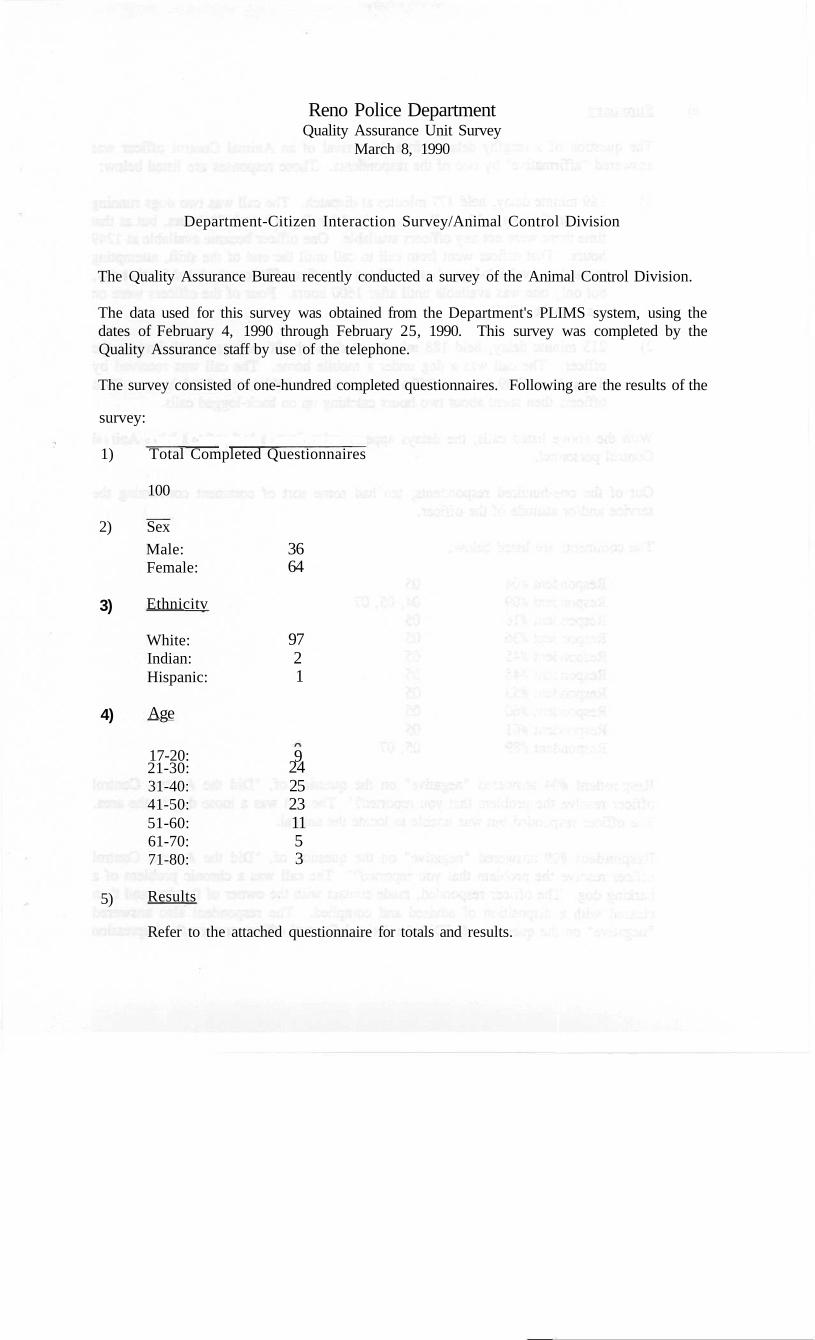
Reno Police DepartmentQuality Assurance Unit Survey
March 8, 1990
Department-Citizen Interaction Survey/Animal Control Division
The Quality Assurance Bureau recently conducted a survey of the Animal Control Division.
The data used for this survey was obtained from the Department's PLIMS system, using thedates of February 4, 1990 through February 25, 1990. This survey was completed by theQuality Assurance staff by use of the telephone.
The survey consisted of one-hundred completed questionnaires. Following are the results of the
survey:
1) Total Completed Questionnaires
100
2) Sex
3)
4)
Male:Female:
Ethnicitv
White:Indian:Hispanic:
Age
17-20:21-30:31-40:41-50:51-60:61-70:71-80:
Results
3664
9721
92425231153
5)
Refer to the attached questionnaire for totals and results.

6) Summary
The question of a lengthy delay before the arrival of an Animal Control officer wasanswered "affirmative" by two of the respondents. Those responses are listed below:
1) 189 minute delay, held 177 minutes at dispatch. The call was two dogs runningloose in the area. The call was received by dispatch at 1101 hours, but at thattime there were not any officers available. One officer became available at 1249hours. That officer went from call to call until the end of the shift, attemptingto catch up on back-logged calls. There were five officers scheduled for that day,but only one was available until after 1600 hours. Four of the officers were onassignments all day.
2) 213 minute delay, held 188 minutes at dispatch, 36 minute travel time by theofficer. The call was a dog under a mobile home. The call was received bydispatch at 0709 hours. Officers were not available until 0930 hours. Twoofficers then spent about two hours catching up on back-logged calls.
With the above listed calls, the delays appear to be from a lack of available AnimalControl personnel.
Out of the one-hundred respondents, ten had some sort of comment concerning theservice and/or attitude of the officer.
The comments are listed below:
Respondent #04Respondent #09Respondent #16Respondent #36Respondent #45Respondent #48Respondent #53Respondent #60Respondent #61Respondent #89
0504,050505050505050505,07
Respondent #04 answered "negative" on the question of, "Did the Animal Controlofficer resolve the problem that you reported?" The call was a loose dog in the area.The officer responded but was unable to locate the animal.
Respondent #09 answered "negative" on the question of, "Did the Animal Controlofficer resolve the problem that you reported?" The call was a chronic problem of abarking dog. The officer responded, made contact with the owner of the dog and thencleared with a disposition of advised and complied. The respondent also answered"negative" on the question of, "Did the Animal Control officer convey the impression

that there was concern for your problem?" The respondent stated that after the officercontacted the owner of the dog and learned that the dog was deaf, the officer sided withdog owner. The officer left the impression that the respondent should take care of theproblem and not bother Animal Control. The respondent also stated "affirmative" to thequestion of, "would you change anything about the way your call was handled?" Therespondent would like to see a change in the officer's attitude.
Respondent #16 answered "negative" on the question of, "Did the Animal Controlofficer resolve the problem that you reported?" The call was a barking dog in the area.The officer responded but was unable to locate the animal. The respondent did not haveany other complaints.
Respondent #36 answered "negative" on the question of, "Did the Animal Controlofficer resolve the problem that you reported?" The call was a contained cat. Theofficer responded and while attempting to place the cat in the truck, the cat got away.The respondent was displeased that the cat escaped. The respondent did not have anyother complaints.
Respondent #45 answered "negative" on the question of, "Did the Animal Controlofficer resolve the problem that you reported?" The call was a dog running loose in thearea. The officer responded but was unable to locate the animal. The respondent didnot have any other complaints.
Respondent #48 answered "negative" on the question of, "Did the Animal Controlofficer resolve the problem that you reported?" The call was a dog running loose in thearea. The officer responded but was unable to locate the animal. The respondent didnot have any other complaints.
Respondent #53 answered "negative" on the question of, "Did the Animal Controlofficer resolve the problem that you reported?" The call was several dogs running loosein the area. The officer responded but was unable to locate the animals. The respondentdid not have any other complaints.
Respondent #60 answered "negative" on the question of, "Did the Animal Controlofficer resolve the problem that you reported?" The call was a rooster flying loose inthe area. The officer responded but was unable to locate the animal. The respondentdid not have any other complaints.
Respondent #61 answered "negative" on the question of, "Did the Animal Controlofficer resolve the problem that you reported?" This call was a dog running loose in thearea. The officer responded but was unable to locate the animal. The respondent didnot have any other complaints.
Respondent #89 answered "negative" on the question of, "Did the Animal Controlofficer resolve the problem that you reported?" This call was several dogs running loosein the area. The officer responded to the area, located the animals and their owners.
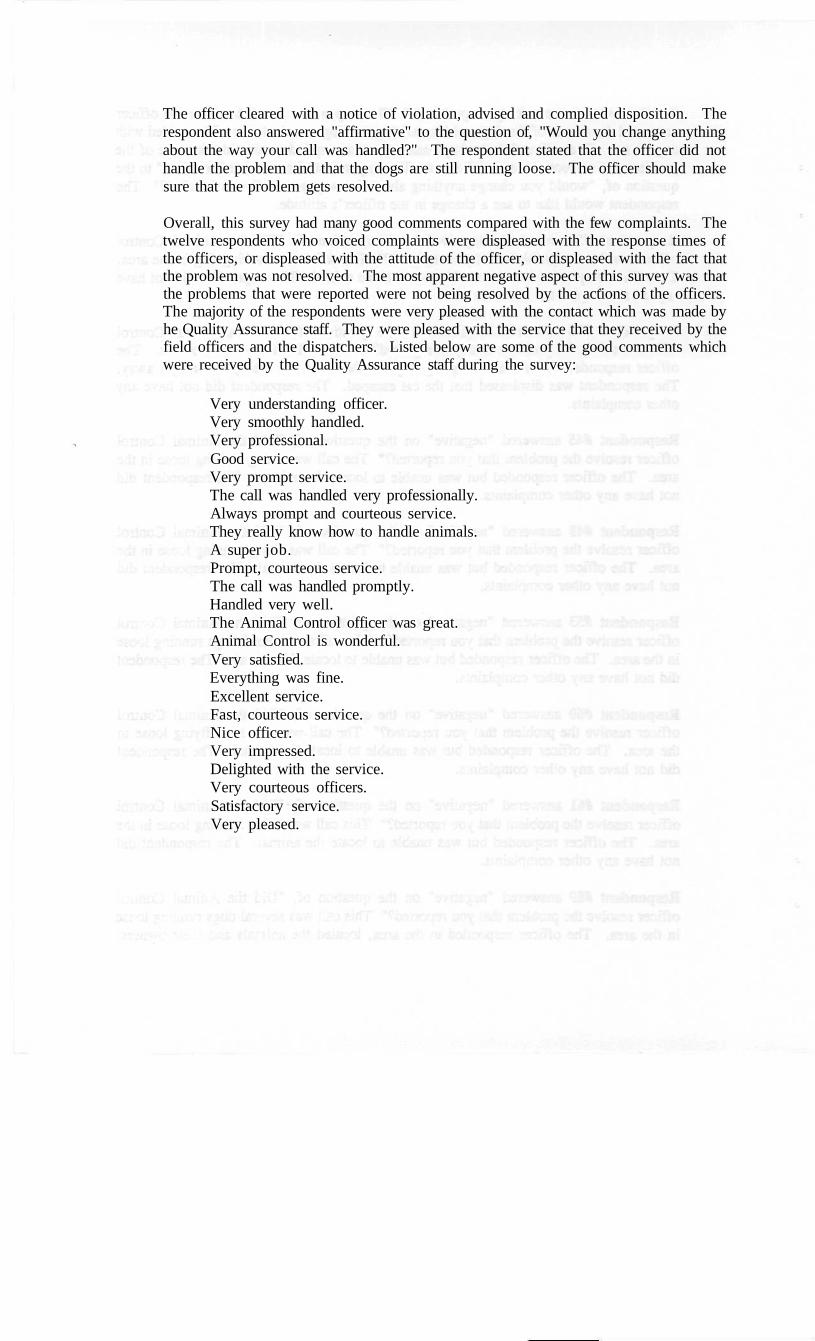
The officer cleared with a notice of violation, advised and complied disposition. Therespondent also answered "affirmative" to the question of, "Would you change anythingabout the way your call was handled?" The respondent stated that the officer did nothandle the problem and that the dogs are still running loose. The officer should makesure that the problem gets resolved.
Overall, this survey had many good comments compared with the few complaints. Thetwelve respondents who voiced complaints were displeased with the response times ofthe officers, or displeased with the attitude of the officer, or displeased with the fact thatthe problem was not resolved. The most apparent negative aspect of this survey was thatthe problems that were reported were not being resolved by the actions of the officers.The majority of the respondents were very pleased with the contact which was made byhe Quality Assurance staff. They were pleased with the service that they received by thefield officers and the dispatchers. Listed below are some of the good comments whichwere received by the Quality Assurance staff during the survey:
Very understanding officer.Very smoothly handled.Very professional.Good service.Very prompt service.The call was handled very professionally.Always prompt and courteous service.They really know how to handle animals.A super job.Prompt, courteous service.The call was handled promptly.Handled very well.The Animal Control officer was great.Animal Control is wonderful.Very satisfied.Everything was fine.Excellent service.Fast, courteous service.Nice officer.Very impressed.Delighted with the service.Very courteous officers.Satisfactory service.Very pleased.