community management benchmarking, presented by rachel happe
TRANSCRIPT
SOCIALMEDIA.ORG/SUMMIT2016ORLANDOJANUARY 25–27, 2016
Community managementbenchmarking: Educate executives,secure budget, and drive engagement
RACHEL HAPPETHE COMMUNITY ROUNDTABLE

Community Management BenchmarkingEducate executives, secure budget, and drive engagement
Rachel HappeCo-Founder, The Community Roundtable@rhappe

Getting executives to care is hard. Benchmarking helps.
What is a community?

www.communityroundtable.com
Community is not:
blogspodcasts
chatforums
Social Media
RSS
videoprofiles
activity feeds

www.communityroundtable.com
Community is:
passion
voices
relationships
ideas
discussions
affinitynetworkspeople
organic
conversation
relationships
collaboration
purpose
missionsupport
emergentgroups

www.communityroundtable.com
Com·mu·ni·ty
Noun
A group of people with unique shared values, behaviors, and artifacts.

www.communityroundtable.com
Communities are powerful because they are how individuals define:
• Behavioral norms
• How to learn
• Values
• Truth
• Identity

What is community management?
www.communityroundtable.com
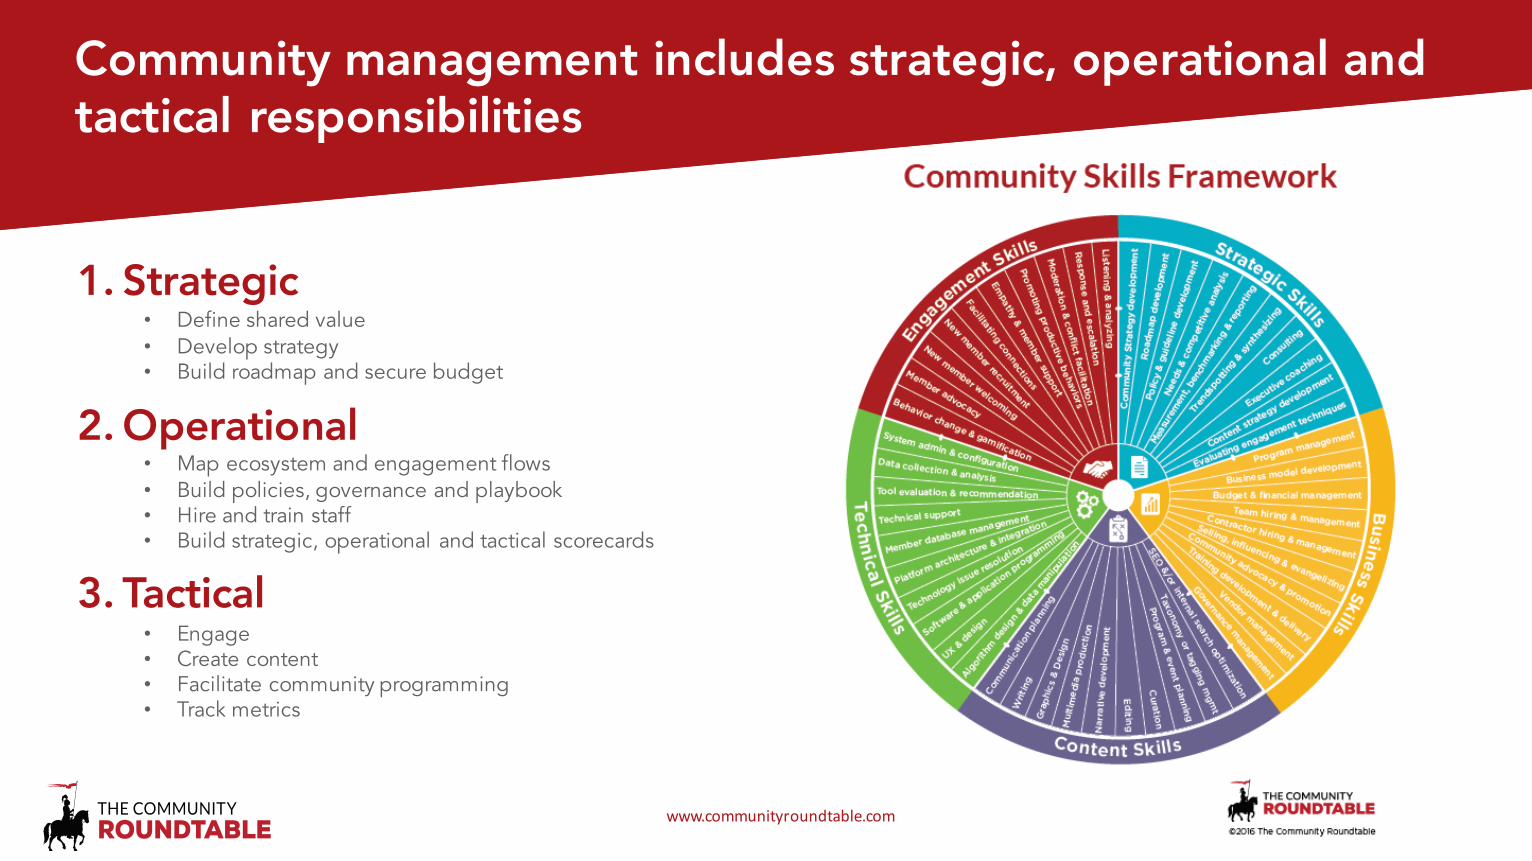
Community management includes strategic, operational and tactical responsibilities
1. Strategic• Define shared value• Develop strategy• Build roadmap and secure budget
2. Operational• Map ecosystem and engagement flows• Build policies, governance and playbook• Hire and train staff• Build strategic, operational and tactical scorecards
3. Tactical• Engage• Create content• Facilitate community programming• Track metrics

Benchmarking Community

www.communityroundtable.com
1.Focuses the ConversationBenchmarking provides concrete and actionable guidance that helps translate your strategic ambition into strategic reality.
2.Injects Unbiased PerspectiveData-driven analysis removes personal or political bias, providing and objective look at performance.
3.Enables Confident Community Decision-MakingBenchmarking tells you where you are and provides the data to make confident decisions about your community’s future.
Why benchmark?

www.communityroundtable.com
What do you benchmark?
Input: ManagementThe approach to building successful communities
Output: BehaviorHow individual communication behavior is changing
Output: ResultsThe value produced by the community; benefits including ROI
Investment
Return
Return
www.communityroundtable.com
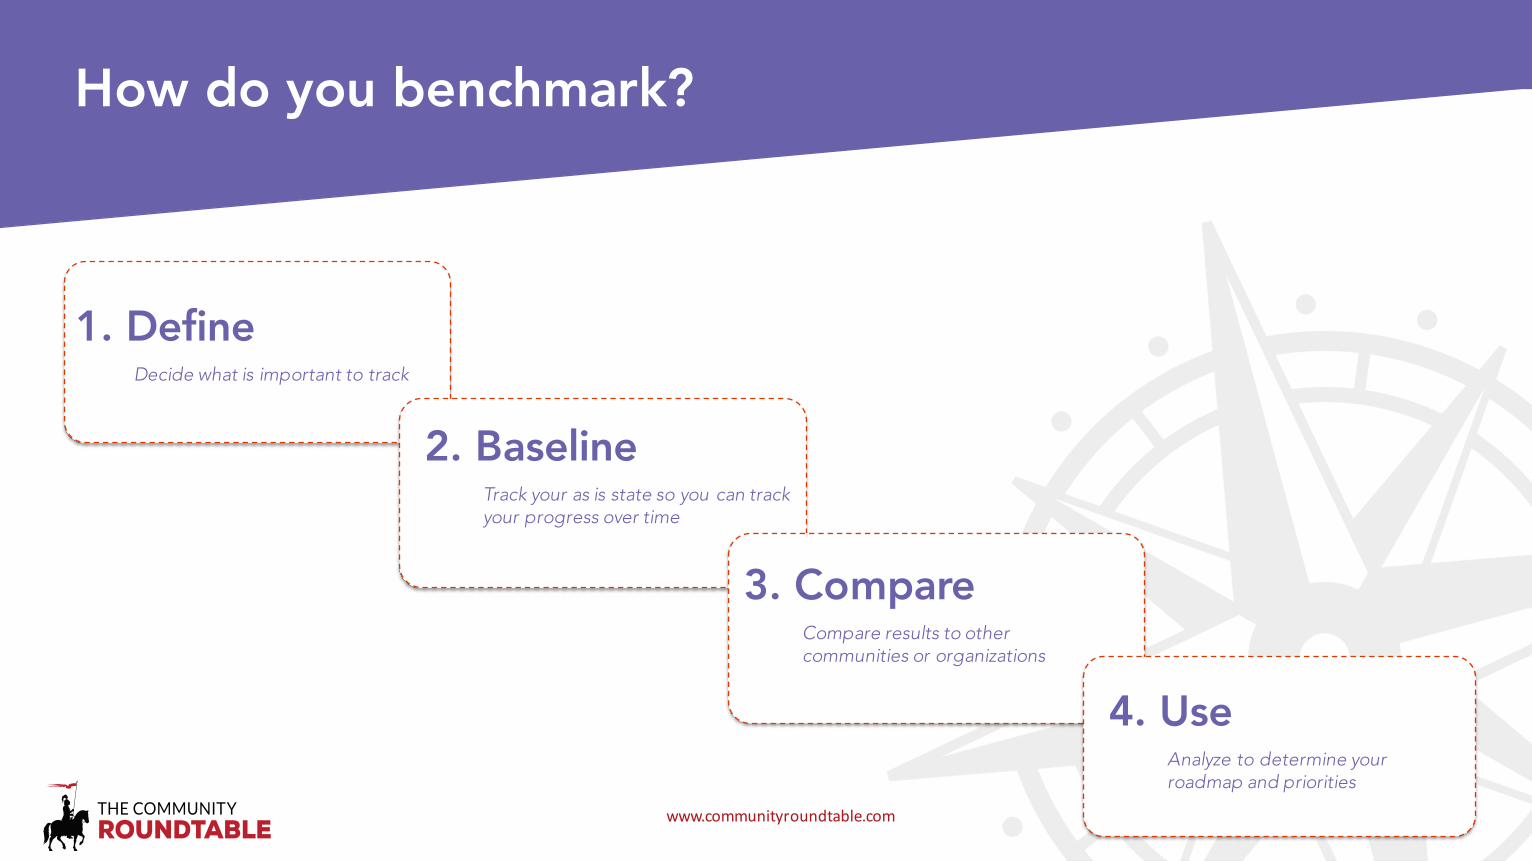
1. DefineDecide what is important to track
2. BaselineTrack your as is state so you can track your progress over time
3. CompareCompare results to other communities or organizations
4. UseAnalyze to determine your roadmap and priorities
How do you benchmark?

www.communityroundtable.com
1. Educating and Selling Stakeholders
2. Planning and Budgeting
3. Prioritizing Resources
Using benchmarking

www.communityroundtable.com
1. Benchmarking is ‘dumb’ to your strategyBenchmarking provides a objective comparison, which is what makes it valuable, but because of that it cannot indicate/evaluate where performance differences are intentional based on your unique context and strategy
2. Trends, not specificsThe best use of benchmarking is to see trends and use those to trigger deeper discussions about your approach – but it cannot define priorities unique to your organization. It is one of many great inputs to a strategic conversation.
Limits of benchmarking

16
Benchmarking Community Management

www.communityroundtable.com
“Goals are for Losers”– Scott Adams
Community management is a system

www.communityroundtable.com
The value of community management
78% of best-in-class community programs can measure their value…
… due to approved strategies and the funded roadmaps needed to implement them
Data from The State of Community Management 2015
STATE OF COMMUNITY MANAGEMENT 37
The research suggests community teams should:
• Focus on metrics tied to key objectives in your community strategy
• Identify those metrics that illustrate the behavior change you’re looking to see as a result of member participation in the community
• Take a thoughtful, proactive approach to measuring the value and ROI of community by collecting data early and tracking change over time
Total members
Total activity
Activemembers
Contributingmembers
Volume ofnew content
Content views/opens/clicks
Questionsanswered
Volume ofcomments
Time to firstresponse
Influenceridentification
New memberactivity
Behavior flowsand conversions
Resolution time
Revenuegenerated
18% 13%
34% 15%
34% 17%
39% 26%
42% 19%
58% 27%
66% 49%
68% 48%
68% 58%
74% 63%
74% 65%
89% 78%
84% 90%
82% 76%
Average
Best-in-Class
61%
39% 33% 42%
22%
78% Able toMeasureValue
Able toMeasureValue
of thoseable toshow ROI
of thoseable toshow ROI
Average Best-in-Class
41% 50%
Average Best-in-Class
TRACKING SPECIFIC METRICS
PERCENT OF C-LEVEL RECEIVING COMMUNITY REPORTS
VALUE AND ROI
While most communities track basic membership and engagement metrics, best-in-class communities are more likely to look at behaviors that evaluate the vibrancy of the community and effectiveness of the community team.
Best-in-class communities are more likely to share community reports with the top levels of the organization – giving executives the opportunity to understand the value of the community to the organization as a whole.
Best-in-class communities are twice as likely to be able to measure value as average communities in this year’s survey, but determining ROI from that remains elusive for the majority of all communities.
STATE OF COMMUNITY MANAGEMENT 23
65%
24%
100%
58%
Approved Strategy
Resourced Roadmap
Approved Strategy
Resourced Roadmap
Average
Best-in-Class
}}
63% of communities with approvedstrategies lack a resourced roadmap
42% of BIC communities with approvedstrategies lack a resourced roadmap
GAP BETWEEN STRATEGY & RESOURCED ROADMAPS:
BUDGET BREAKDOWN:COMMUNITIES WITH DEDICATED BUDGETS:
EXECUTIVES WHO APPROVE BUDGET:
BIC communities are more likely to have an approved strategy – and resources to execute on it.
The biggest elements of community budgets are, not surprisingly, technology and community management resources – BIC communities tend to allocate more of their budgets to community management, but the differences are slight, suggesting maturity is more than where you spend your money.
Over 80 percent of best-in-class communities have their budgets approved by C- or VP-level executives, suggesting alignment with strategic corporate objectives.
70%51%
Best-in-ClassAverage
A majority of community programs have dedicated budgets, a key input to effectively calculating ROI.
32
32
16
94 4 2
Best-in-Class
Average34
26
13
13
54 4
41%
54%
12% 14%10% 11%15% 14%
22%
7%C-Level Senior VP VP Director Other
Average Best-in-Class
100%
90%
80%
70%
60%
50%
40%
30%
20%
10%
0%
The research suggests community teams should:
• Ensure their community strategy is approved, measureable and regularly reviewed as the community matures.
• Develop a community roadmap.
• Define a discrete community budget, even if it is currently part of a larger one.
• Work to educate stakeholders on the investment required and the rewards expected from a successful community approach.

www.communityroundtable.com
Define: The Community Maturity Model
Companies using the CMM to manage their community programs:

www.communityroundtable.com
✔
✔
✔
✔
✔
✔
✔
✔
Compare: Benchmark competencies
Comparing enables you to:
• Question assumptions• Identify gaps• Confirm strengths• Communicate progress• Feel more confident

www.communityroundtable.com
Use: Define goals and build a roadmap

22
Value of Benchmarking Community Management

1. Identifies root cause of engagement issues

2. Enables strategic alignment

3. Captures attention of executive stakeholders
www.communityroundtable.com
Benchmark Yourself!
http://the.cr/socm2016survey

Thank You & Keep in Touch!Rachel Happe
@rhappe
The Community Roundtable
@TheCR
www.communityroundtable.com

Learn more about past andupcoming events
SOCIALMEDIA.ORG/EVENTS
SOCIALMEDIA.ORG/SUMMIT2016ORLANDOJANUARY 25–27, 2016