community knowledge-based design patent map system with efï¬cient
TRANSCRIPT
International Journal of Computer Information Systems and Industrial Management Applications.
c⃝ MIR Labs, www.mirlabs.net/ijcisim/index.html
Community Knowledge-based Design Patent MapSystem with Efficient Dissimilarity VisualizationEngine: Design, Performance, and Applications
Rain Chen1, Chao-Chun Chen2, and Ting-Ting Dai3
1Department of Creative Product DesignSouthern Taiwan University, Tainan, Taiwan
[email protected] (corresponding author)
2Institute of Manufacturing Information and SystemsNational Cheng Kung University, Tainan, Taiwan
3Department of Information Management,Southern Taiwan University, Tainan, Taiwan
Abstract: Patent deployment has become competition strengthfor companies. The intelligence property can keep the com-petition advantage of a company from opponents through thepatent deployment which can be visualized by the patent maptechnique. The patent map is an important strategic tool forestablishing design strategies. Our past efforts studied the visu-alization transformation techniques in design patent map, andthe comparisons of design patents in United States and Taiwan.Of types of patents, design patents occupy a unique patent field,since design patents are not as definitive as other patent fields.Therefore, the construction of design patent map is extremelydifficult. Current commercial patent map systems visualize thepatents according to non-populace attributes, even some sys-tems constrain the number of patent to generate a patent map.Considering these scenarios, such patent map systems are in-sufficient for providing more objective results from populace tosupport more powerful evidences in law courts. A key factorto support the patent map system adopting the populace opin-ions is a fast dissimilarity visualization engine which can trans-late the dissimilarity of patents from the populace opinions toa patent map. This paper presents a GA-based dissimilarityvisualization engine for the above mentioned purpose. We de-sign a set of crossover and mutation operations based on theobservations could generate patent maps with better quality. Acomprehensive set of experiments are conducted, and the re-sults reveal that the GA-based dissimilarity visualization engineindeed speeds up around 50% than the traditional method. Theperformance properties of our proposed method are also stud-ied. Hence, such the engine is quite suitable for impatient userson the internet platform. Finally, we also present a case studyof applying our system prototype to an industry-academy coop-eration project for patent analysis and evasion.Keywords: genetic algorithm; patent map; industry; web technol-ogy; visualization;
I. Introduction
With the arrival of knowledge economy era, enterprises areforced to treat intellectual property rights as efficient strate-gies in enhancing their competitiveness. Enterprises com-monly use patents to achieve certain objects, including sup-porting decision-making, planning the use of new technol-ogy in future research and development, overcoming diffi-culties in some technological steps, purchasing equipment,and performing several intended purposes [9]. The WorldIntellectual Property Organization (WIPO) revealed that 90-95% of all the world’s inventions can be found in patent doc-uments [15, 6]. The patent literature is an enormous tech-nical database. Many works on professional patent systems[10, 20] and patent data analytical techniques [18] are de-veloped to analyze patent data. Some scholars further applypatent documents in different field, such patent knowledgein breast cancer medicine [2], in which authors use patentpaths to establish pharmaceutical management mechanisms[16]. However, because it is difficult to interpret patent liter-ature, professionals in different fields stop short of using theabundant patent data.In order to cope with the great amount of patent documents,Shneiderman [17] proposed the concept of information visu-alization to assist directors of corporations for interpretationsof patent documents. Patent map is a useful tool to exhibitthe technical deployment of specific industries. Through thepatent map technology, corporations can understand the stateof competition or even developmental trends of the industry,so that corporations can establish their own business or de-velopment strategies [15].Notice that the application and protection of patents arebased on the territoriality principle, patent laws in differentcountries could be different, and thus, patents can be clas-sified into many types. For example, in United States, The
ISSN 2150-7988 Volume 5 (2012) pp.326-336
MIR Labs, USA
ISSN 2150-7988 Volume 5 (2013) pp.326-336
United States Patent and Trademark Office (USPTO) offerthree types of patents [19], including utility patents, designpatents, and plant patents. In this work, we focus on designpatents. Design patents tend to be the protection of formsand appearances, thus, comparison of design patents is moredifficult than that of invention patents. The reason is that in-vention patents tend to have objective data for determination,such as temperature or stress; however, design patents tendto be subjective determination, such as creativity and homo-geneity which is still difficult to be evaluated or differentiatedby current computer techniques. Hence, human being playsthe key component to evaluate or differentiate design patents.Therefore, the design patent map system is a human-machinecooperation computation. Such characteristic distinguish ourwork from other works that focus on invention patents [8].Following the above mentioned property about designpatents, we observe many judges on patent infringement aredifferent from populace opinion in practice, because a judg-ment are decreed by only few justices. More and more patentexperts believe in that collecting the populace opinion ofpatents as evidences will assist justices to make more fairjudgments. However, no such system or platform assist bar-risters or patent experts to collect the statistics of populaceopinion of patents so far. According to experts’ experiences[7, 3, 4], such the design patent map system should equip thefollowing two necessary properties.
• The first properties is that users can easily access andconveniently manipulate the system. The easy accessis proportional to the motivation of using the system,and the number of success populace investigation wouldthen increase. Most users has low desire to make thepatent comparisons on the dedicate system and evenwith specified time schedule.
• The second properties is the efficiency and scalability ofvisualization transformation, that is, the system shouldrespond users within acceptable response time. The toolong response time would decrease users’ desire on thesystem.
In many design courses about modern human-interface de-sign experiences, the above two points are also importantrules to increase community interaction on Internet, partic-ularly the cloud-based service [12].In this paper, we proposed a novel design of a commu-nity knowledge-based patent map system with an efficientgenetic algorithm-based dissimilarity visualization engine,which can transform the dissimilarity among patents into atwo-dimensional patent map. Hence, the two-dimensionalpatent map generated based on the patent dissimilarity in-cludes the statistics of common cognition in the community,and the visual patent map is easy to interpret the patent anal-ysis and strategy for product designers. Partial content ofalgorithm design is extended from our primary version [5]presented in a conference. In this work, more related top-ics are covered, such as complete performance study and acase study of how to apply our designed prototype. For thekernel of the patent map system, our proposed method usesa sampling comparison of patents and yet reaches high pre-cision in a genetic-algorithm framework. Thus, the enginecan generate the patent map within acceptable waiting time.
Therefore, the proposed method can be built in a platform forpublic access to increase the acceptance of populace. In addi-tion, our proposed method can be scalable to large number ofpatents in a patent map. In our experiences, we can transformdissimilarity of hundreds of patents in a patent map, however,some commercial software packages allow only less than 100patents, such as SPSS [11]. We also conduct a comprehen-sive set of performance experiments to study the transforma-tion performance, and as well as the characteristics of the ge-netic algorithm to the performance. Our proposed method re-duced around 50% transformation time cost than traditionalmethods. When more patents are transformed in a patentmap, our proposed engine shows more advantage in perfor-mance. Finally, we also present a case study of applying oursystem prototype to an industry-academy cooperation projectsponsored by Creative Service Project of Ministry of Eco-nomic Affairs, Taiwan and Winton Plastics Industries Co.,Ltd1. for patent analysis and evasion. The case study showshow our prototype assists the product designers of Winton tounderstand the patent advantage of their products and patentpressure of product competition.The rest paper is organized as follows. Section II describesthe system architecture. Then, we present the design of theGA-based dissimilarity visualization engine in Section III.Section IV shows the comprehensive set of performancestudy of our proposed method. Next, Section V demonstratesthe prototype of our patent map system. In Section VI, wegive a case study of applying our prototype to our industry-academy project. Finally, we conclude the paper in Sec-tion VII.
II. System Architecture
Figure 1 instantiates the user scenarios according to our con-densed practical experience in design patent map systems.Assume that a number of users (populace) in the communitycontribute their knowledge on comparing the design patentsin the web platform. Since users may not have the sameavailable period for the patent survey, each user can proceedthe comparison any time and anywhere. After comparing apair of patents, the comparison result would be sent back tothe patent database. On the other hand, the administratorscan retrieve the up-to-date patent map which will be auto-matically generated based on the current results of populaceopinions in the patent database by the system.Figure 2 illustrates the reference architecture for transform-ing the dissimilarities of patents into a patent map to visual-ize the differences of patents. Notice that the dissimilaritiesof patents can be transformed to multi-dimensional space.However, in order to be able to clearly identify the differ-ences of patents in the map, most researchers prefer two-dimensional space.For the convenience of public access, the patent map systemis recommended to design by using web technologies. Whileusers access the system, a set of web interface componentsassociated with the functions of the patent map systems in-teract with the users. Two most critical components are pro-vided in a patent map system. The first component, called
1More details about Winton Plastics Industries Co. can refer to its website: http://www.wintontile.com.tw/index.html
327 R. Chen, C. Chen and Dai

patent
database
admin
user
user
user
functions of patent
map system
user
d i
u
patent maintenance
patent map transformation
patent
map display
patent dissimilarity maintenance
patent infringement query
Figure. 1: An illustrative Scenario of populace-used patentmap systems.
interfaces for patent map system
dissimilarity
collector
visual
rendering tool
patent database
patent map
engine
Figure. 2: Reference architecture for populace-used patentmap systems.
dissimilarity collector, is used to collect the dissimilarity ofpatents. The collected dissimilarity of patents are maintainedin the patent database which has complete information ofpatents. The second component, called patent map engine, isused to transform the collected dissimilarity of patents intoa map which visualize the relative dissimilarity of patentsin a two-dimensional space. The map transformed from thedissimilarity of patents is then rendered by the visual render-ing tool into the visual formatted data for displaying in webpages.
III. GA-based Dissimilarity Visualization En-gine
After the dissimilarity matrix of patents are collected, theGA-based similarity visualization engine can generate apatent map which consists of points in a space and the dis-tances of point pairs are similar to the similarity matrix aspossible. Figure 3 shows the flow of our genetic algorithmdesign for dissimilarity visualization engine. The genetic al-gorithm processes as follows.
Step 1. The visualization engine generates the initial popu-lation according to the number of patents in the dissim-ilarity matrix.
Step 2. If the generation counter is less than or equal to thepredefined maximal generation (i.e., max gen), gotoStep 3; else goto Step 6.
Step 3. The individuals are selected to generate new off-springs through the following three operations: 1-parentcrossover, 2-parent crossover, and mutation.
Step 4. Sorting individuals of the old generation and thenew generation according to their mapdist. Only thepredefined size of population are conserved, others arediscarded.
Step 5. The generation counter are increased by one, andthen goto Step 2.
Step 6. Return the best individual as the result.
Step 7. End of the genetic algorithm.
In the following, we describe the components in the abovementioned genetic algorithm in details.
patent
dissimilarity
matrix
GA-based
patent map
engine
generation = 1
generation < = max_gen
N
Y generate new
population
replace old
population
next generation
(generation++)
ouput result of
population
2-parent
crossover
select
patents
mutation1-parent
crossover
initialize
population
patent map
-1 0 1-2
-2
-1
0
1
2
Figure. 3: Genetic algorithm flow for similarity visualizationengine.
Gene representation:A patent map consists of a set of patent locations in a space.In this work, a genotype is a patent map, and a gene is apatent location. Figure 4 shows the gene representation ofthis work. A genotype is an array of genes, and each of whichis represented as a two-dimension point.
1
genotype gi
gene
genotype g1 (0.64, 0.00) (0.61, -1.12) (0.48, 1.27) (0.66, 1.05) (-0.35, -0.25) (-0.96, 0.84)
2 3 4 5 6
1
(x1, y1) (x2 , y2) (x3 , y3) (x4 , y4) (x5 ,y5) (x6 ,y6)
2 3 4 5 6
(Dimensional 1 , Dimensional 2)
example:.
Figure. 4: Illustration of gene representation.
In the traditional method, a measure to identify whether amap is similar enough to the dissimilarity matrix is throughstress, whose basic idea is the accumulation of distance ofeach node pair between the map and the dissimilarity ma-trix. A disadvantage of using stress is that the computationcomplexity is proportional to the number of patents for com-parison. Hence, we devise the mapdist which compares afeature set of node pairs, called signature, in the map com-parison in order to reduce the computation cost. The signa-ture sign can be express as the matrix form whose size is
Community Knowledge-based Design Patent Map System with Efficient Dissimilarity Visualization Engine 328
the same to the dissimilarity matrix. Element (i, j) of signis set to 1 if the dissimilarity of patents i and j needs to becompared in the mapdist; otherwise, element (i, j) is set to0. We define the mapdist as follows.
mapdist =
√√√√∑Ni=1
∑Nj=i+1(Dij − dist′ij)× sign(i, j)∑N
i=1
∑Nj=i+1(dist
′ij)× sign(i, j)
where the square root is just a convenience that givesgreater spread to small values. Given a dissimilarity matrixD, the GA-based similarity visualization engine minimizesmapdist over all point configurations (p1, · · · , pN ) in the 2-dimension space. dist′ij is the distance function of points piand pj , and can be obtained as
dist′ij =N∑i=1
N∑j=i+1
distij × sfm
where sfm =
∑Ni=1
∑Nj=i+1 Dij∑N
i=1
∑Nj=i+1 distij
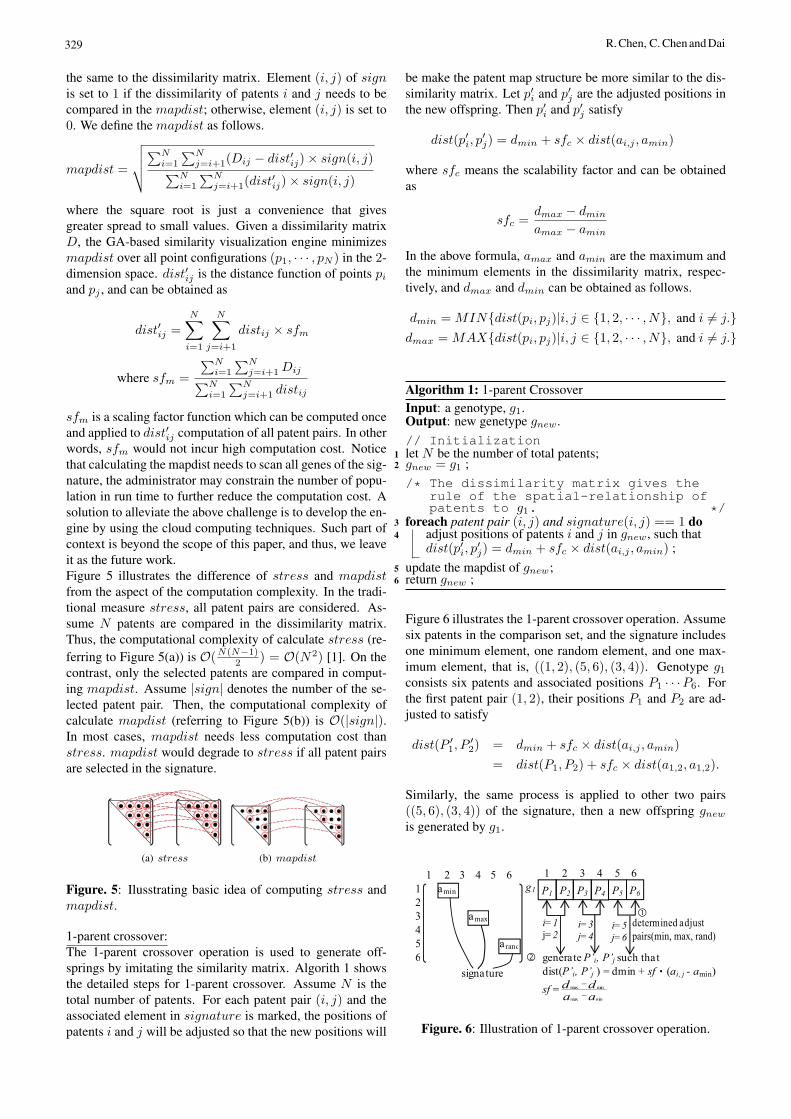
sfm is a scaling factor function which can be computed onceand applied to dist′ij computation of all patent pairs. In otherwords, sfm would not incur high computation cost. Noticethat calculating the mapdist needs to scan all genes of the sig-nature, the administrator may constrain the number of popu-lation in run time to further reduce the computation cost. Asolution to alleviate the above challenge is to develop the en-gine by using the cloud computing techniques. Such part ofcontext is beyond the scope of this paper, and thus, we leaveit as the future work.Figure 5 illustrates the difference of stress and mapdistfrom the aspect of the computation complexity. In the tradi-tional measure stress, all patent pairs are considered. As-sume N patents are compared in the dissimilarity matrix.Thus, the computational complexity of calculate stress (re-ferring to Figure 5(a)) is O(N(N−1)
2 ) = O(N2) [1]. On thecontrast, only the selected patents are compared in comput-ing mapdist. Assume |sign| denotes the number of the se-lected patent pair. Then, the computational complexity ofcalculate mapdist (referring to Figure 5(b)) is O(|sign|).In most cases, mapdist needs less computation cost thanstress. mapdist would degrade to stress if all patent pairsare selected in the signature.
(a) stress (b) mapdist
Figure. 5: Ilusstrating basic idea of computing stress andmapdist.
1-parent crossover:The 1-parent crossover operation is used to generate off-springs by imitating the similarity matrix. Algorith 1 showsthe detailed steps for 1-parent crossover. Assume N is thetotal number of patents. For each patent pair (i, j) and theassociated element in signature is marked, the positions ofpatents i and j will be adjusted so that the new positions will
be make the patent map structure be more similar to the dis-similarity matrix. Let p′i and p′j are the adjusted positions inthe new offspring. Then p′i and p′j satisfy
dist(p′i, p′j) = dmin + sfc × dist(ai,j , amin)
where sfc means the scalability factor and can be obtainedas
sfc =dmax − dmin
amax − amin
In the above formula, amax and amin are the maximum andthe minimum elements in the dissimilarity matrix, respec-tively, and dmax and dmin can be obtained as follows.
dmin = MIN{dist(pi, pj)|i, j ∈ {1, 2, · · · , N}, and i ̸= j.}dmax = MAX{dist(pi, pj)|i, j ∈ {1, 2, · · · , N}, and i ̸= j.}
Algorithm 1: 1-parent CrossoverInput: a genotype, g1.Output: new genetype gnew.// Initialization
1 let N be the number of total patents;2 gnew = g1 ;/* The dissimilarity matrix gives the
rule of the spatial-relationship ofpatents to g1. */
3 foreach patent pair (i, j) and signature(i, j) == 1 do4 adjust positions of patents i and j in gnew, such that
dist(p′i, p′j) = dmin + sfc × dist(ai,j , amin) ;
5 update the mapdist of gnew;6 return gnew ;
Figure 6 illustrates the 1-parent crossover operation. Assumesix patents in the comparison set, and the signature includesone minimum element, one random element, and one max-imum element, that is, ((1, 2), (5, 6), (3, 4)). Genotype g1consists six patents and associated positions P1 · · ·P6. Forthe first patent pair (1, 2), their positions P1 and P2 are ad-justed to satisfy
dist(P ′1, P
′2) = dmin + sfc × dist(ai,j , amin)
= dist(P1, P2) + sfc × dist(a1,2, a1,2).
Similarly, the same process is applied to other two pairs((5, 6), (3, 4)) of the signature, then a new offspring gnewis generated by g1.
1 2 3 4 5 6
1 amin
2
3 amax
4
5 a rand
6
aadd
minmax
minmax
−
−
g1
1
P1 P2 P3 P4 P5 P6
2 3 4 5 6
i= 1
j= 2i= 3
j= 4i= 5
j= 6
�determined adjust
pairs(min, max, rand)
� generate P’i, P’j such that
dist(P’i, P’j ) = dmin + sf (ai, j - amin)
sf =
signature
Figure. 6: Illustration of 1-parent crossover operation.
329 R. Chen, C. Chen and Dai

2-parent crossover:The implementation of 2-parent crossover is depicted in Al-gorithm 2. The 2-parent crossover operation is used to gen-erate offsprings by imitating other better individuals. Eachtime the operation is used, two individuals are randomly se-lected (say, g1 and g2) as the input of the 2-parent crossoveroperation. Assume mapdist1 ≤ mapdist2, that is, g1 drivesg2. g1 give the rule of the spatial-relationship of patents tog2. For each patent, say patent i in g2, this patent is movedto the middle of patents NN(g1, i) and NN(g2, i) in g2, whereNN(gx, i) means the nearest patent of patent i in genotypegx. These modifications on g2 are used to generate a newoffspring. In order to keep the diversity, one individual canbe selected to proceed 2-parent crossover process from firsthalf of the individuals sorted by the mapdist.
Algorithm 2: 2-parent CrossoverInput: two genotypes, g1 and g2 with mapdist mapdist1
and mapdist2, respectively.Output: new genetype gnew.// Initialization
1 Assume mapdist1 ≤ mapdist2, that is, g1 drives g2;/* Patent-wise crossover: in order to
bring the advantage of g1 to g2. *//* That is, g1 give the rule of the
spatial-relationship of patents tog2. */
2 for (i = 1 to N ) do// move g2[i] to the middle of NN(g1[i])
and NN(g2[i]). a1 and a2 are indexkeys
3 a1 = NN(g1, i);4 a2 = NN(g2, i);5 gnew[i] =
(g2[a1].x+g2[a2].x
2 , g2[a1].y+g2[a2].y2
);
6 compute mapdist(gnew);7 return gnew;
Figure 7 shows the basic idea of the 2-parent crossover op-eration. In the example, genotype g1 has lower mapdist thang2, thus, the goal of the operation is to improve the quality ofgenotype g2 by imitating the relationship of nodes in g1. Theoperation would scan each gene of g1 and find out its nearestneighbor (point), and then, adjust the corresponding point ing2 such that its nearest neighbor is the same as that in g1, asshown in the figure.
Mutation:The mutation operation is designed to avoid local optimumwhich is frequent occurred in genetic algorithms. The Gaus-sian mutation is applied to our designed genotypes to gen-erate new offsprings. The detailed steps is shown in Algo-rithm 3. In the beginning, a genotype is considered to pro-ceed the mutation operation by a random filter. If the geno-type is selected, the position of each patent is then adjustedby an offset of a Gaussian random number. Notice that wegenerate a Gaussian random number for each patent to in-crease the diversity of individuals in the genetic algorithm.Figure 8 shows the idea of the mutation operation. For eachgene of a genotype g, the associated point is moved to anearby location with offset generated by a pair of Gaussiannumbers (i.e., for horizontal axis and vertical axis).
genotype g1 (mapdist1= 0.31)
NN(3)
1
(x1, y1) (x2 , y2) (x3 , y3) (x4 , y4) (x5 ,y5) (x6 ,y6)
2 3 4 5 6
genotype g2 (mapdist2 = 0.36)
NN(3)
1
(x1, y1) (x2 , y2) (x3 , y3) (x4 , y4) (x5 ,y5) (x6 ,y6)
2 3 4 5 6
1(0.44, 0.43)
2(0.61, -1.12)
3(0.08, 1.47)
4(-1.44, 0.08)
5
(0.42, 1.57)
6(-0.51, 0.54)
-1 0 1-2
1
2
-2
-1
0
NN
1(0.64, 0)
2(0.61, -1.12)
3(0.48, 1.27)
4(0.66, 1.05)
5(-0.35, -0.25)
6(-0.96, 0.84)
-1 0 1-2
1
2
-2
-1
0
NN
1(0.64, 0)
2(0.61, -1.12)
4
(0.66, 1.05)
5(-0.35, -0.25)
6(-0.96, 0.84)
3(0.155, 0.4)
-1 0 1-2
1
2
-2
-1
0
genotype g’2 (mapdist3= 0.30)
g’2 = g2( mapdist (g1) ≤ mapdist (g1) ) �
�adjust every point in g2 by refering to
the correstponding relationship in g1
such that NN(3) = 5 (hold in g1)
NN(3)
1
(x1, y1) (x2 , y2) (x4 , y4) (x3 , y3) (x5 ,y5) (x6 ,y6)
2 3 4 5 6
Figure. 7: Illustration of 2-parent crossover operation.
Algorithm 3: mutation()Input: genotype g.Output: genotype gnew.// Initialization
1 gnew=null;2 δ=
√min(g);
3 rand seed();4 if (rand() < mutation threshhold) then5 for (i = 1 to N ) do6 gnew[i].x = g[i].x+ (δ ×Gaussian rand());7 gnew[i].y = g[i].y + (δ ×Gaussian rand());8 compute mapdist(gnew);9 else
10 gnew = g;11 return gnew;
Fitness function:Recall that one of the rules of thumb for a website design isto response to users as soon. In order to achieve the goal,we use the fitness function to control the execution time ofthe engine. The fitness function is controlled by a predefinedparameter, called max gen, which stands for the maximalgeneration in the evolution process. More specifically, oncethe generation count reaches max gen, the fitness functionwould terminate the evolution process, and then return thecurrent results in the genetic algorithm.An alternative of the fitness function is designed based onmapdist, and the goal of such design is to generate re-sults whose accuracy between the dissimilarity matrix andthe patent map is within a predefined standard. Administra-tors can revise the design of the fitness function according totheir needs. In this work, we only consider the max gen-based fitness function, and the evaluation of the mapdist-based fitness function is left as one of our future work.
330Community Knowledge-based Design Patent Map System with Efficient Dissimilarity Visualization Engine

(x6 ,y6)
6
(x5 ,y5)
5
(x4 ,y4)
4
(x3 ,y3)
3
(x2 ,y2)
2
(x1 ,y1)
1
Gaussiongenerator
(x1+g11 ,y1+g12)
1genotype g’
(x1+g21 ,y1+g22)
2
(x1 g31,y1+g32)
3
(x1 g41,y1+g42)
4
(x1+g51 ,y1 g52)
5
(x1 g61 ,y1 g62)
6
1g1 (0.64, 0.00) (0.61, -1.12) (0.48, 1.27) (0.66, 1.05) (-0.35, -0.25) (-0.96, 0.84)
2 3 4 5 6
example:
Gaussion generator
1
(0.64 +0.03, 0.00-0.05)
2
(0.61 +0.12, -1.12 -0.13)
3
(0.48 +0.02, 1.27-0.23)
4
(0.66 +0.07, 1.05-0.08)
5
(-0.35+0.04, -0.25-0.02)
6
(-0.96+0.15, 0.84 -0.18
genotype g
g’1
+ + + + +
Figure. 8: Illustration of mutation operation.
IV. Performance Study
In this section, we conduct a comprehensive set of experi-ments for studying the performance characteristics of our de-signed GA-based dissimilarity visualization engine. Beforediscussing the experiment results, we describe the simulationsettings used in the simulation.
A. Simulation Settings
In our simulation, we maintained 100 real patents [8, 3] withtheir related description and basic information in the patentdatabase. According to our experience for different needsof customers, the number of patent set in the experimentsvaries from 20 to 100. Notice that current SPSS cannottransform the dissimilarity visualization with more than 99patents, thus, the experiments show our system has higherscalability. The default signature pattern is (9, 0, 0), whichmeans we select the patent pairs as signature set from 9 min-imum elements in the dissimilarity matrix. Later, we willshow this setting does not favor our performance, thus, theresults should be under fair comparisons. The prototype isbuilt on a general personal computer which equips CPU ofIntel Pentium 4 3200 MHz and 2.5GB RAM. The traditionalmethod for transform the dissimilarity visualization is pro-posed by Kruscal (denoted as Kruscal method) [14, 13], andit is implemented in the simulation for comparison.
B. Experimental Results
Figure 9 shows the first experiment on studying the time con-sumption of the designed GA-based dissimilarity visualiza-tion engine. Our method is compared to the engine based ontraditional multi-dimensional scaling which is implementedbased on Kruscal’s method [14]. From the figure, we cansee our GA-based dissimilarity visualization engine needsonly one half of computation time than that of Kruscal’smethod. The benefit comes from that our method can controlthe computation cost by setting the parameters of initial pop-ulation and maximal generation. In addition, the increasingrate of our method is slower than that of Kruscal’s method.Hence, our method is much more suitable for large numberof patents, and the response time is also acceptable for webenvironment.The second experiment is to study the influence of gener-ations in the genetic algorithm to the mapdist for different
0
100
200
300
400
500
600
20 30 40 50 60 70 80 90 100
execution tim
e (
sec.)
number of patents
GA-basedKruscal method
Figure. 9: Comparison of time consumption between twoengines.
patent sets, and the result is shown in Figure 10. For dif-ferent patent sets, we can see the each curve can performstable within ten generations. This means the designed ge-netic algorithm can obtain the suboptimal results rapidly. Inaddition, we observe the patent set of 100 patents has highermapdist than that of 20 patent. Such result is reasonable be-cause it is more difficult to find a patent map close to a dis-similarity matrix of large number of patents. In the result,the difference between 100 patents and 20 patents is limited,and thus, the quality of generated patent map of 100 patentsis acceptable for most clients.
0.38
0.4
0.42
0.44
0.46
0.48
0.5
1 2 3 4 5 6 7 8 9 10
mapdis
t
number of generations
#(patents)=20#(patents)=40#(patents)=60#(patents)=80
#(patents)=100
Figure. 10: Impact of the generations to mapdist.
The next experiment is to study the quality of the designedgenetic algorithm-based engine compared to that of tradi-tional Kruscal’s method. Figure 11 shows the comparisonresult. In this experiment, we use the stress value as a ba-sis in comparison. This is because mapdist is invented andused only in our method. Thus, the patent map generated byour method is further evaluated to obtain the associated stressvalue. As our above mentioned on the relationship betweenthe mapdist and the number of patent set, we can see thestress values of both methods increase as increasing numberof patents. Even our method has higher stress value than theKruscal’s method, the difference is very limited for varioussizes of patent set. That is, although our method only samples
331 R. Chen, C. Chen and Dai

some patents (signature) to compare to the dissimilarity ma-trix, the generated patent is yet close to that generated by theKruscal’s method. Therefore, applying the sampling mech-anism, mapdist to the genetic algorithm obtains remarkableresults.
0
0.2
0.4
0.6
0.8
1
20 30 40 50 60 70 80 90 100
str
ess
number of patents
GA-basedKruscal method
Figure. 11: Comparison of stress value between two engines.
The last experiment is designed to observe the influence ofthe signature patterns and number of signature to the pro-posed method, and the result is shown in Figure 12. In or-der to obtaining more precise results, we again use the stressvalue as vertical axis, and further evaluate the stress valueof the generated maps in the experimental results. The sig-nature patterns in our experiment covers different situationas possible, thus, distribution of signature pattern includesall minimum values, all random values, all maximum values,and mixed values. From the results, we can see that most sig-nature patterns can reach around 0.4 (while the stress valueof the Kruscal’s method is around 0.35), so, it is very easyfor administrator to choose a signature pattern in our systemfor applications. In addition, we found that signature pattern(X, 0, 0) has worst stress value among all signature patterns.Hence, our experiment setting (9, 0, 0) is not a prejudice toour method in the experiments. In case other signature pat-terns are selected, the better performance results would beobtained.
V. Demonstration
In this section, we demonstrate our prototype whose designare described in previous sections. Then, we also give areal case study about applying this prototype in an industry-academy cooperation project in the next section. In orderto offer convenient access and usage of a design patent mapsystem, we develop the prototype by using web program-ming with a database system. The physical developmentplatform include PHP 5.2.6 based on Apache server 2.2.8,and the patent database is built on MySQL 5.0.51a. Thesedevelopment tools are very popular and can cross platforms,thus, our prototype can be deployed on almost any kindsof general PC platforms which have enough computationcapacity, networking module, and support the above men-tioned tools. Currently, our prototype can be accessed at
0
0.2
0.4
0.6
0.8
1
20 40 60 80 100 120 140 160 180 200
str
ess
number of signature
sig-pattern(X,0,0)sig-pattern(0,X,0)sig-pattern(0,0,X)
sig-pattern(X/2,1,X/2)
Figure. 12: Impact of the different signature patterns (sig-pattern).
http://cis.mis.stut.edu.tw/PTMS/.Figure 13 depicts the patent dissimilarity survey from pop-ulace. Recall that there are two types of patent pair selec-tions in our framework, including the table view and the ma-trix view. In the figure, we show the comparison process bythrough the two types of patent pair selections. The first sub-figure is the screenshot of the patent pair selections by thetable view. A user can select two patents for comparisonsthrough the assistance of thumbnail patent photos, for exam-ple, patents 1 and 6 are selected in the first subfigures. Then,the prototype will guide the user to compare the dissimilar-ity of selected patent pair, as shown in the second subfigure.The third subfigure shows the screenshot that a user can de-termine to select a patent pair by either the table view or thematrix view. the forth subfigure shows the screenshot of thematrix view.Figure 14 shows the patent map with a visual tool. The loca-tion data in the figure are from the patent transformation en-gineFrom the patent map, patents that most participants deemthey are similar are placed closely. For example, patents 11and 5 are very close which means most participants deemthey are very similar.
VI. Case Study: Applying PTMS to PatentAnalysis and Evasion
In this section, we present a real case study of applying ourPTMS to an industry-academy cooperation project which issponsored by Creative Service Project of Ministry of Eco-nomic Affairs, Taiwan and Winton Plastics Industries Co.,Ltd. (Winton for short) under Grant 110527. Winton Co. isone of leading companies in producing ground mats, and de-signs certain products to satisfy market demands every year.Currently, Winton Co. finds some patents of related tech-niques are hold in competitors, and these patents would maketheir invented products involve in the intellectual property is-sues. Due to the lack of patent analysis during the designperiod, Winton Co. either spent costly expense for patent au-thorization or abandoned these new products in past years.Hence, the purpose of this cooperation project is to analyzethe related products and patents, and determine some patentevasion strategies to avoid the patent authorization for their
332Community Knowledge-based Design Patent Map System with Efficient Dissimilarity Visualization Engine

12
table view
matrix viewdissimilarity comparison
dissimilarity
comparison
Figure. 13: Screenshots of the patent dissimilarity comparison.
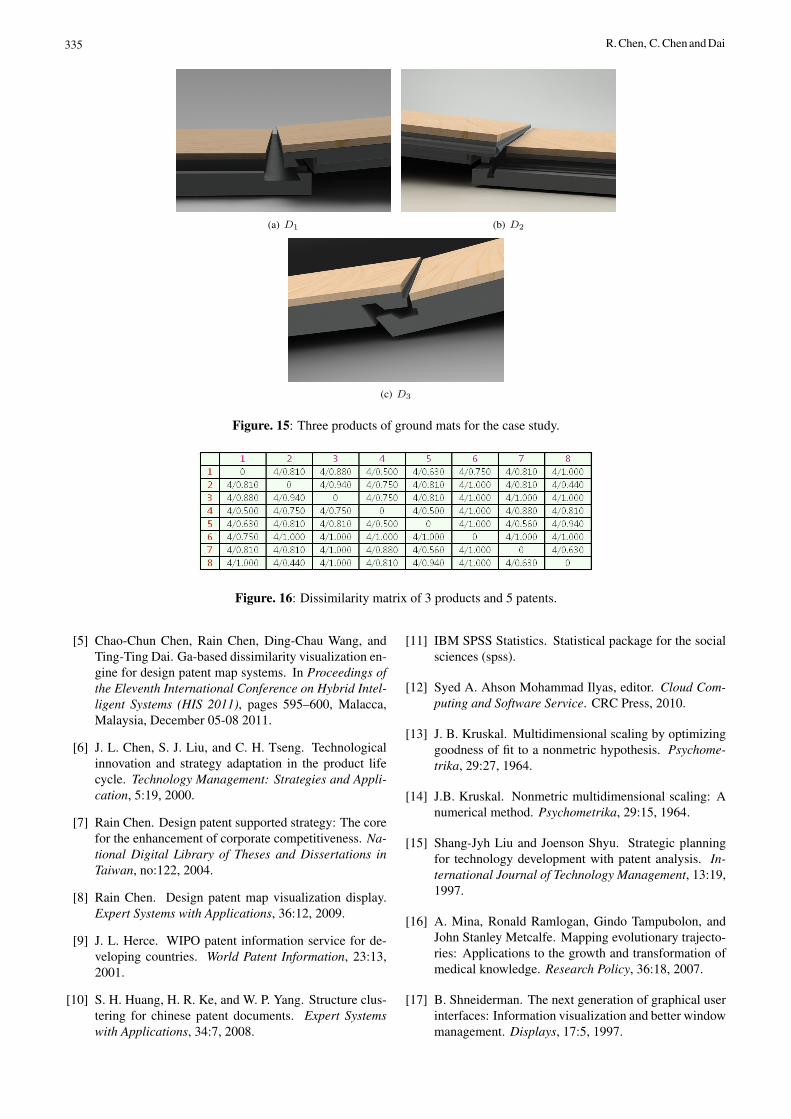
new products by using our proposed PTMS.Figure 15 shows three design products (namely, D1 ∼ D3)out of 15 candidates for patent analysis research in thebusiness meeting hosted by Winton Co. According to ourpatent search report for surveying over 2,000 patents, fiveUS patents are possibly similarly to D1 ∼ D3, includingUS7896571B1 (X1), US2740167 (X2), US7856784B2 (X3),US6516579B1 (X4), US4426820 (X5), where Xi is our as-signed analysis code number to each patent. From our manu-ally search report, X1 ∼ X4 are similar to D1, X5 is similarto D2, and no patent is similar to D3.In order to explore the relationship among the three prod-ucts and five patents by using our proposed PTMS, wecollect the community knowledge for each pair of prod-ucts/patents, and the result is shown in Figure 16. In thefigure, D1/D2/D3/X1/X2/X3/X4/X5 are represented as1, 2, · · · , 8, respectively. Notice that for confidential issues,we only show results of few community members to demon-strate part of our project results. The scale of our actualinvestigation is much greater than that in this case study.After obtaining the above dissimilarity matrix, we can thenobtained the patent map of three products and five patents,as shown in Figure 17. The patent map is generated bythe underlying GA-based dissimilarity visualization engine
presented in previous sections. From the figure, we foundthat these three products and five patents are distributed uni-formly. This indicates that these products and patents arenot similar to each other according to the cognitions of par-ticipant community members. Obviously, such informationobtained from PTMS offers a different viewpoint from theexperts in Winton Co., and thus, these results can be furtherstudied for more details.
Our PTMS also offers additional function for display nearestpatents of a specified patents, as shown in Figure 18. In theexample of the figure, we query for three nearest patents ofD1. Then, PTMS indicates patents 4, 5, and 6 are results withtheir distances to D1 in a table, and uses arrows to clearly in-dicates their relationship in the display area of the web page.Repeating the process, we can learn the three nearest patentsof D2 and D3, respectively. From these results, designers inWinton Co. clearly know the novelty of their products. Inaddition, designers can further understand which product hasmost novelty and suggest the company to apply patents forthis product with the highest priority. These information isalso available for company to manage resources on applyingpatents under the limited budget constraint. Finally, PTMScan be also used to suggest experts certain products that have
333 R. Chen, C. Chen and Dai

patent map
Figure. 14: Screenshots of the patent map display.
least patent pressure of competition.
VII. Conclusions and Future Work
As the increases of industry competitions, patent deploymentbecomes the critical mean of a company to protect the prod-ucts and expand the market. A patent map system can visu-alize the similarity of patents, so that users can easily under-stand the possible infringement according to the generatedpatent maps. In this paper, we proposed a novel commu-nity knowledge-based patent map system equipping with anefficient genetic algorithm-based dissimilarity visualizationengine, which can transform the collected dissimilarity ofpatents into a visual map. Our proposed method is designedbased on the architecture of the genetic algorithm. Further-more, we provide the improved crossover operations andmutation operation, including 1-parent crossover, 2-parentcrossover, and mutation, based on the characteristic of thepatent map systems. Compare to the traditional method, ourproposed method reduces almost 50% time cost. Hence, ourproposed method is quite suitable for online public media,such as world wide web. According to our proposed de-signs, we develop a prototype of the patent map system. Ourprototype is designed by a popular web programming, PHP,and thus, it can be easily ported to platforms of differentoperating systems. We also present a case study of apply-ing our system prototype to an industry-academy cooperationproject. We analyze patent relationship among other relatedpatents and make some patent evasion strategies for their cur-rent products. Through the industry-academy cooperationproject, the product designers of Winton Company can havemore different business strategies for benefiting their prod-ucts from the proposed patent map system.Our future work will continue to study the impact of differ-ent GA-based operations (i.e., crossover and mutation) to the
quality of generated patent maps. More experiments will beconducted to verify the best design of GA-based operations.In addition, we continue to revise the website design basedon the master thesis [21] to increase use experience on oursystem [17]. Currently, our prototype is used in Prof. RainChen’s patent courses. The human-server interface will beimproved according to the students’ feedback.
Acknowledgment
This work was partially supported by National ScienceCouncil of Taiwan and National Cheng Kung University un-der grants NSC100-2221-E-006-267-MY2, NSC100-2221-E-218-049, and D101-13103. Authors thank Prof. Ding-Chau Wang for his contributions on partial design andmaintenance of the web site.
References
[1] M. M. Bronstein, A. M. Bronstein, R. Kimmel, andI. Yavneh. Multigrid multidimensional scaling. Numer-ical Linear Algebra with Applications, 13:23, 2006.
[2] Claudia Canongia, Adelaide Antunes, and Mariade Nazare’ Freitas Pereira. Technological foresight -the use of biotechnology in the development of newdrugs against breast cancer. Technovation, 24:10, 2004.
[3] Alfred Chen and Rain Chen. Design patent map: An in-novative measure for corporative design strategies. En-gineering Management Journal, 19:15, 2007.
[4] Alfred Chen and Rain Chen. A seven-track protec-tion mechanism for design knowledge. IIGSS AcademicPublisher Scientific Inquiry, 8:11, 2007.
334Community Knowledge-based Design Patent Map System with Efficient Dissimilarity Visualization Engine
(a) D1 (b) D2
(c) D3
Figure. 15: Three products of ground mats for the case study.
Figure. 16: Dissimilarity matrix of 3 products and 5 patents.
[5] Chao-Chun Chen, Rain Chen, Ding-Chau Wang, andTing-Ting Dai. Ga-based dissimilarity visualization en-gine for design patent map systems. In Proceedings ofthe Eleventh International Conference on Hybrid Intel-ligent Systems (HIS 2011), pages 595–600, Malacca,Malaysia, December 05-08 2011.
[6] J. L. Chen, S. J. Liu, and C. H. Tseng. Technologicalinnovation and strategy adaptation in the product lifecycle. Technology Management: Strategies and Appli-cation, 5:19, 2000.
[7] Rain Chen. Design patent supported strategy: The corefor the enhancement of corporate competitiveness. Na-tional Digital Library of Theses and Dissertations inTaiwan, no:122, 2004.
[8] Rain Chen. Design patent map visualization display.Expert Systems with Applications, 36:12, 2009.
[9] J. L. Herce. WIPO patent information service for de-veloping countries. World Patent Information, 23:13,2001.
[10] S. H. Huang, H. R. Ke, and W. P. Yang. Structure clus-tering for chinese patent documents. Expert Systemswith Applications, 34:7, 2008.
[11] IBM SPSS Statistics. Statistical package for the socialsciences (spss).
[12] Syed A. Ahson Mohammad Ilyas, editor. Cloud Com-puting and Software Service. CRC Press, 2010.
[13] J. B. Kruskal. Multidimensional scaling by optimizinggoodness of fit to a nonmetric hypothesis. Psychome-trika, 29:27, 1964.
[14] J.B. Kruskal. Nonmetric multidimensional scaling: Anumerical method. Psychometrika, 29:15, 1964.
[15] Shang-Jyh Liu and Joenson Shyu. Strategic planningfor technology development with patent analysis. In-ternational Journal of Technology Management, 13:19,1997.
[16] A. Mina, Ronald Ramlogan, Gindo Tampubolon, andJohn Stanley Metcalfe. Mapping evolutionary trajecto-ries: Applications to the growth and transformation ofmedical knowledge. Research Policy, 36:18, 2007.
[17] B. Shneiderman. The next generation of graphical userinterfaces: Information visualization and better windowmanagement. Displays, 17:5, 1997.
335 R. Chen, C. Chen and Dai

Figure. 17: Patent map of 3 products and 5 patents.
Figure. 18: Query three nearest patents of D1.
[18] Yuen-Hsien Tseng, Chi-Jen Lin, and Yu-I Lin. Textmining techniques for patent analysis. Information Pro-cessing and Management, 43:32, 2007.
[19] USPTO United States Patent and Trademark Office. USpatent law. http://www.uspto.gov, 2008.
[20] Leo Wanner, Baeza-Yates Ricardo, Soren Brugmann,Joan Codina, Barrou Diallo, Enric Escorsa, MarkGiereth, Yiannis Kompatsiaris, Symeon Papadopoulos,Emanuele Pianta, Gemma Piella, Ingo Puhlmann, Gau-tam Rao, Martin Rotard, Pia Schoester, Luciano Ser-afini, and Vasiliki Zervaki. Towards content-orientedpatent document processing. World Patent Information,30:13, 2008.
[21] Bei-Bei Yao. The research on patent map system andinterface planning. National Digital Library of Thesesand Dissertations in Taiwan, page 95, 2010.
336Community Knowledge-based Design Patent Map System with Efficient Dissimilarity Visualization Engine