community impact report · 2020-01-01 · dedicated bus-only lanes would feature concrete roadways,...
TRANSCRIPT

COMMUNITY IMPACT
REPORT
April 2018 Updated January 2020
West Valley Connector Project


Revision Log
Date Description
April 2018 Original report prepared
January 2020 Project schedule update
Fontana General Plan update
Consistency analysis update


Community Impact Report
West Valley Connector Project i
TABLE OF CONTENTS
Executive Summary ............................................................................................................. ix
Introduction .................................................................................................................. 1
1.1 Project Location and Setting ................................................................................ 2
1.2 Purpose and Need ............................................................................................... 2
Project Description ...................................................................................................... 7
2.1 Proposed Project .................................................................................................. 7
2.2 Project Alternatives .............................................................................................. 8
2.2.1 No Build Alternative .................................................................................. 8 2.2.2 Build Alternatives ...................................................................................... 8
2.3 Design Features of Build Alternatives .................................................................. 9
2.3.1 Bus Rapid Transit Stations ....................................................................... 9 2.3.2 sbX Bus Operations ................................................................................ 12 2.3.3 Operations and Maintenance ................................................................. 13
2.4 Implementation Schedule ................................................................................... 15
2.5 Study Area Definition.......................................................................................... 17
2.6 Other Development Projects .............................................................................. 19
Land Use..................................................................................................................... 39
3.1 Existing Land Use .............................................................................................. 39
3.1.1 Affected Environment ............................................................................. 62 3.1.2 Environmental Consequences ................................................................ 64 3.1.3 Avoidance, Minimization, and Mitigation Measures ................................ 83
3.2 Consistency with State, Regional, and Local Plans ........................................... 83
3.2.1 Affected Environment ............................................................................. 83 3.2.2 Environmental Consequences .............................................................. 103 3.2.3 Avoidance, Minimization, and Mitigation Measures .............................. 114
3.3 Parks and Recreation ....................................................................................... 126
3.3.1 Affected Environment ........................................................................... 126 3.3.2 Environmental Consequences .............................................................. 127 3.3.3 Avoidance, Minimization, and Mitigation Measures .............................. 128
Growth ...................................................................................................................... 131
4.1 Regulatory Setting ............................................................................................ 131
4.2 Affected Environment ....................................................................................... 132
4.3 Environmental Consequences ......................................................................... 134
4.4 Avoidance, Minimization, and Mitigation Measures ......................................... 135
Community Character ............................................................................................. 137
5.1 Population and Housing ................................................................................... 137
5.1.1 Affected Environment ........................................................................... 137 5.1.2 Environmental Consequences .............................................................. 150 5.1.3 Avoidance, Minimization, and Mitigation Measures .............................. 154
5.2 Economic Conditions........................................................................................ 155
5.2.1 Affected Environment ........................................................................... 155 5.2.2 Environmental Consequences .............................................................. 158

Community Impact Report
ii West Valley Connector Project
5.2.3 Avoidance, Minimization, and Mitigation Measures ............................. 161 5.3 Community Facilities and Services .................................................................. 161
5.3.1 Affected Environment ........................................................................... 161 5.3.2 Environmental Consequences ............................................................. 195 5.3.3 Avoidance, Minimization, and Mitigation Measures ............................. 196
5.4 Relocations ...................................................................................................... 197
5.4.1 Affected Environment ........................................................................... 197 5.4.2 Environmental Consequences ............................................................. 197 5.4.3 Avoidance, Minimization, and Mitigation Measures ............................. 202
5.5 Environmental Justice ...................................................................................... 204
5.5.1 Regulatory Framework ......................................................................... 204 5.5.2 Affected Environment ........................................................................... 205 5.5.3 Environmental Consequences ............................................................. 213 5.5.4 Avoidance, Minimization, and Mitigation Measures ............................. 216
Traffic/Transportation/Pedestrian/Bicycle Facilities ............................................ 223
6.1 Affected Environmental .................................................................................... 223
6.1.1 Access, Circulation, and Parking .......................................................... 223 6.1.2 Public Transportation ........................................................................... 225
6.2 Environmental Consequences ......................................................................... 227
6.2.1 Access, Circulation, and Parking .......................................................... 227 6.2.2 Public Transportation ........................................................................... 235
6.3 Avoidance, Minimization, and Mitigation Measures ......................................... 238
Cumulative Impacts ................................................................................................. 241
Public Involvement .................................................................................................. 245
References ............................................................................................................... 249
Appendix
Appendix A Census Tract Data ..................................................................................... 253
List of Tables
Table S-1: Summary of Potential Impacts of the No Build and Build Alternatives ................. xii
Table 2-1: Stations along Phase I/Milliken Alignment ........................................................... 11
Table 2-2: Addition Stations to be Constructed as Part of Phase II/Haven Alignment ......... 11
Table 2-3: Study Area Census Tracts ................................................................................... 17
Table 2-4: Land Development Projects within the Project Vicinity ........................................ 19
Table 2-5: Transportation Projects within the Project Vicinity ............................................... 28
Table 3-1: Existing Land Use Categories within 300 Feet of Project Centerline and 0.5
Mile from Proposed BRT Stations and Potential O&M Facility Sites ......................... 39
Table 3-2: Existing Land Use Types within the Study Area .................................................. 61
Table 3-3: Impacts to Land Use under Alternative B ............................................................ 66
Table 3-4: Consistency of West Valley Connector Project with Southern California
Association of Governments Regional Comprehensive Plan and Regional
Transportation Plan/Sustainable Communities Strategy ......................................... 103

Community Impact Report
West Valley Connector Project iii
Table 3-5: Consistency of West Valley Connector Project with County and City
General Plans .......................................................................................................... 115
Table 3-6: List of Parks within 0.5 Mile of the Project Corridor ........................................... 127
Table 4-1: SCAG 2016 RTP/SCS Growth Forecasts .......................................................... 133
Table 5-1: Ethnic Composition ............................................................................................ 142
Table 5-2: Household Characteristics ................................................................................. 147
Table 5-3: Age Distribution .................................................................................................. 149
Table 5-4: Housing Characteristics ..................................................................................... 150
Table 5-5: Potential Full Acquisitions .................................................................................. 152
Table 5-6: Socioeconomic Characteristics .......................................................................... 156
Table 5-7: Community Facilities within 0.5 Mile of the West Valley Connector Corridor .... 183
Table 5-8: Emergency Services within 0.5 Mile of the West Valley Connector Corridor ..... 193
Table 5-9: List of Full Parcel Acquisition (Alternative B) ..................................................... 198
Table 5-10: Federal Poverty Level Guidelines .................................................................... 206
Table 5-11: Environmental Justice (Census Tracts) ........................................................... 207
Table 6-1: Existing Primary Facilities Summary .................................................................. 223
Table 6-2: Existing and Proposed Bikeways ....................................................................... 224
Table 6-3: Parking Conditions ............................................................................................. 225
Table 6-4: WVCC Ridership Summary ............................................................................... 237
Table 6-5: Potential Traffic Operations Mitigation Measures .............................................. 238
List of Figures
Figure 1-1: Project Location Map ............................................................................................ 4
Figure 1-2: Project Vicinity Map .............................................................................................. 5
Figure 2-1: Build Alternatives Map ........................................................................................ 10
Figure 2-2: O&M Facility Conceptual Site Plan ..................................................................... 14
Figure 2-3: Potential Operations and Maintenance Facility Sites ......................................... 16
Figure 2-4: Project Census Tract Study Area Map ............................................................... 18
Figure 2-5: Other Development Projects ............................................................................... 33
Figure 3-1: Existing Land Use Map ....................................................................................... 41
Figure 3-2: Impacts to Land Use under Alternative B ........................................................... 67
Figure 3-3: City of Pomona Strategic Action Areas ............................................................... 88
Figure 3-4: Pomona Envisioned Future Transit Network ...................................................... 89
Figure 3-5: Ontario Transit Plan ............................................................................................ 93
Figure 3-6: Rancho Cucamonga Transit Plan ....................................................................... 96
Figure 3-7: Recommended Circulation Master Plan ........................................................... 100
Figure 5-1: Community Facilities and Services ................................................................... 163
Figure 5-2: Environmental Justice Communities ................................................................. 211
Figure 6-1: Study Intersection Locations ............................................................................. 231

Community Impact Report
iv West Valley Connector Project
This page intentionally left blank.

Community Impact Report
West Valley Connector Project v
LIST OF ACRONYMS
AA Alternatives Analysis
ACS American Community Survey
ADA Americans with Disabilities Act
ARA Agricultural Resource Area
BMPs Best Management Practices
BRT bus rapid transit
Caltrans California Department of Transportation
CEQ Council on Environmental Quality
CEQA California Environmental Quality Act
CFR Code of Federal Regulations
CIR Community Impact Report
CNG compressed natural gas
DOT U.S. Department of Transportation
EA Environmental Assessment
EIR Environmental Impact Report
EO Executive Order
EPD Employment Protection District
ESA Environmentally Sensitive Area
EVVMF East Valley Vehicle Maintenance Facility
FAR floor area ratio
FHWA Federal Highway Administration
FTIP Federal Transportation Improvement Program
GHG greenhouse gas
HHS U.S. Department of Health and Human Services
I Interstate

Community Impact Report
vi West Valley Connector Project
LA Metro Los Angeles County Metropolitan Transportation Authority
LAWA Los Angeles World Airports
mph miles per hour
MSWMP Master Stormwater System Maintenance Program
NEPA National Environmental Policy Act
NPDES National Pollutant Discharge Elimination System
PDT Project Development Team
PM Post Mile
PUSD Pomona Unified School District
RCP Regional Comprehensive Plan
RCTC Riverside County Transportation Commission
ROW right-of-way
RTP Regional Transportation Plan
SBCTA San Bernardino Associated Governments
SB Senate Bill
SCAG Southern California Association of Governments
SCRRA Southern California Regional Rail Authority
SCS Sustainable Communities Strategies
SEA Significant Ecological Area
SR State Route
SWIP Southwest Industrial Park
TMP Traffic Management Plan
TOD Transit-Oriented Development
TSP Transit Signal Priority
UPRR Union Pacific Railroad
U.S.C. United States Code

Community Impact Report
West Valley Connector Project vii
VIP Visual Improvement Plan
VOC volatile organic compound
WVVMF West Valley Vehicle Maintenance Facility


Community Impact Report
West Valley Connector Project ix
EXECUTIVE SUMMARY
This Community Impact Report (CIR) assesses potential impacts to land use, growth,
community cohesion, socioeconomics, and environmental justice issues that could result
from implementation of the West Valley Connector Bus Rapid Transit (BRT) Project (the
project).
The San Bernardino County Transportation Authority (SBCTA), in cooperation with the cities
of Pomona, Montclair, Ontario, Rancho Cucamonga, and Fontana, proposes construction of
the West Valley Connector Project, a 35‐mile‐long BRT project that would provide speed
and quality improvements to the public transit system within the corridor while increasing
ridership. The project is located primarily at the eastern end of Los Angeles County in the
City of Pomona and at the southwestern end of San Bernardino County in the cities of
Montclair, Ontario, Rancho Cucamonga, and Fontana. A No Build Alternative and two build
alternatives, Alternative A and Alternative B, are proposed. Both Alternative A and
Alternative B include the full 35-mile-long BRT corridor and would be constructed in two
phases: Milliken Alignment (Phase 1) and Haven Alignment (Phase 2). Under Alternative A,
no dedicated bus-only lanes are proposed and 60 side-running stations at 33 locations/
major intersections would be constructed. Under Alternative B, 3.5 miles of dedicated bus-
only lanes and center-running stations are proposed in the city of Ontario, which would
require roadway widening to accommodate the implementation of center-running stations.
Alternative B proposes to construct 5 center-running stations and 50 side-running stations at
33 locations/major intersections.
The project is subject to state and federal environmental review requirements because it
involves the use of federal funds from the Federal Transit Administration (FTA). An
Environmental Impact Report (EIR)/Environmental Assessment (EA) is being prepared for
the proposed project in compliance with the California Environmental Quality Act (CEQA)
and the National Environmental Policy Act (NEPA). SBCTA is the CEQA lead agency, and
FTA is the NEPA lead agency. This CIR has been prepared as part of the technical analysis
required to support the EIR/EA.
Land Use
Alternative A would not result in the conversion of existing land uses. Construction of
Alternative B would result in the conversion of existing land uses, such as residential,
commercial, industrial, open space, and public facilities to accommodate the dedicated bus-
only lanes and center-running stations. A total of 263 parcels are anticipated to be impacted
under Alternative B, of which the project may require full acquisition of 37 parcels, partial
acquisition of 168 parcels, temporary construction easements of 54 parcels, and parking
impacts to four parcels that are within city right-of-way (ROW). Approximately 4.22 acres of
Community Impact Report
x West Valley Connector Project
land would be temporarily impacted and 11.01 acres of land would be permanently impacted
to accommodate the proposed project under Alternative B.
The project is generally consistent with the overall goals and policies outlined in plans from
Los Angeles and San Bernardino counties, and the cities of Pomona, Montclair, Ontario,
Rancho Cucamonga, and Fontana.
Growth
The majority of the project alignment falls within the cities’ ROW that is already being utilized
as existing roads. The project is not expected to substantially influence the overall amount
or type of growth. The pattern and rate of population and housing growth would be expected
to remain consistent with the population anticipated by existing General Plans for the
affected cities. The project would not influence growth, and no growth-related impacts are
expected.
Community Character
The project is being built along an existing transportation corridor, which would limit any
division of neighborhoods/communities. Alternative A would not result in any displacements.
Alternative B would displace residential and nonresidential properties, including historic
buildings along Holt Boulevard in Ontario that would result in physical changes that could
permanently alter the character and cohesion of the existing community. However, it is
anticipated that properties will be redeveloped over time with uses more consistent with the
city’s Land Use Element.
Environmental justice populations exist within the study area. However, both build
alternatives would benefit most study area residents, including minority and low-income
populations, by providing improved public transportation services throughout the study area.
The build alternatives would not have disproportionately high or adverse impacts per
Executive Order (EO) 12898 to Non-White, Hispanic or Latino, or low-income populations
within the study area. Populations within the study area would not result in adverse impacts
being predominantly borne by a minority or low-income population, nor would adverse
impacts be appreciably more severe to these populations.
During the construction phase, residents and businesses may be disrupted and
inconvenienced by detours, local road closures, dust, noise, and heavy construction
equipment traffic on existing city streets. These temporary construction impacts would be
addressed in advance by development and implementation of a Transportation
Management Plan (TMP).

Community Impact Report
West Valley Connector Project xi
Displacement and Relocation
Alternative A would not result in any displacements of residential properties or businesses.
Alternative B would require displacement of 14 residential properties (four single-family
residences and 10 multi-unit residences) and 61 businesses (53 commercial businesses
and eight industrial/manufacturing businesses). Research indicates that the availability of
replacement sites is sufficient to relocate the displaced occupants into the replacement area
of the cities of Ontario, Upland, Rancho Cucamonga, Claremont, San Dimas, La Verne,
Pomona, Chino, Eastvale, Jurupa Valley, Fontana, Mira Loma, and Montclair.
Traffic and Transportation/Pedestrian and Bicycle Facilities Access,
Circulation, and Parking
The project would entice commuters and other automobile users to switch to other
transportation modes. Implementation of the project would result in an immitigable increase
in level-of-service (LOS) at up to four (4) and five (5) intersections by 2040 under
Alternatives A and B, respectively.
Alternative A would not result in any on-street parking impacts. Under Alternative B, on-
street parking would be removed along Holt Boulevard between Benson Avenue and
Vineyard Avenue; however, current parking utilization rates show that this would not result in
an adverse effect to on-street parking in the area.
The project would maintain, improve upon, and accommodate planned bicycle and
pedestrian facilities where practicable.
Temporary impacts to circulation and access would result from construction activities,
including potential arterial street closures. A TMP would be developed prior to construction
to address temporary construction impacts. It may also be necessary to place crossing
guards at affected intersections leading to nearby schools when construction activities occur
during school hours.
Public Involvement
Community outreach and participation have been integrated into the project development
process from the outset, including public scoping meetings, alternatives development, and
extensive public and agency stakeholder involvement. Special outreach efforts have
included public briefings, mailers, flier distribution, as well as through e-blasts, a project
website, and social media. Future public involvement includes focused outreach efforts for
affected and adjacent property owners and tenants along the Holt Boulevard roadway
widening segment and public information meetings during circulation of the draft
environmental document and during the final design phase. Door-to-door canvassing will
also be conducted to ensure proper disclosure of information to owners and tenants
regarding the project and upcoming focused outreach meetings.

Community Impact Report
xii West Valley Connector Project
Table S-1: Summary of Potential Impacts of the No Build and Build Alternatives
Potential Impact No Build Alternative Alternative A Alternative B
Land Use
Consistency with the Los Angeles County General Plan
Inconsistent with goals related to transit use and multimodal transportation1
No impact No impact
Consistency with the San Bernardino County General Plan
Inconsistent with goals and policies related to working with agencies to improve traffic conditions, encouraging automobile reduction, and promotion of non-motorized transport1
No impact No impact
Consistency with the City of Pomona General Plan
Inconsistent with goals related to strengthening regional mobility, reducing greenhouse gases (GHGs), promoting transit use, and land use decisions related to future development1
No impact No impact
Consistency with the City of Montclair General Plan
Inconsistent with goals related to improving traffic conditions and promoting public transportation1
No impact No impact
Consistency with the City of Ontario General Plan
Inconsistent with goals related to enhancing public transportation1
Less than 0.1 acre of temporary impact of land in total to accommodate the proposed project.
Approximately 10 acres (temporary impacts) and 5 acres (permanent impacts) of land in the City of Ontario would be impacted to accommodate the proposed project. No adverse impact on land use is anticipated because the project is consistent with adopted land use and transportation plans.

Community Impact Report
West Valley Connector Project xiii
Table S-1: Summary of Potential Impacts of the No Build and Build Alternatives
Potential Impact No Build Alternative Alternative A Alternative B
Consistency with the City of Rancho Cucamonga General Plan
Inconsistent with goals related to providing a more multimodal transportation system1
No impact No impact
Consistency with the City of Fontana General Plan
Inconsistent with goals related to providing a more balanced transportation system1
No impact No impact
Coastal Zone No impact No impact No impact
Wild and Scenic Rivers No impact No impact No impact
Parks and Recreation No impact No impact No impact
Growth
The No Build Alternative is inconsistent with the regional mobility goals in the study area; however, it is not anticipated to influence growth within the study area
No impact No impact
Farmland/Timberland No impact No impact No impact
Community Character and Cohesion
The No Build Alternative is inconsistent with various local agency specific plan projects
No impact
Community character and cohesion would be altered as a result of nonresidential acquisitions, including historic buildings, in Ontario; however, no adverse effect is anticipated as properties are anticipated to be redeveloped over time with uses more consistent with the City’s land use plan.
Emergency Services No impact No impact No impact
Displacements and Relocations
No impact No impact Displacements and relocation of 14 residential properties and 61 businesses.

Community Impact Report
xiv West Valley Connector Project
Table S-1: Summary of Potential Impacts of the No Build and Build Alternatives
Potential Impact No Build Alternative Alternative A Alternative B
Environmental Justice No impact No impact No impact
Traffic and Transportation/Pedestrian and Bicycle Facilities
No changes to transit services.
Normal traffic growth and congestion is expected.
No impact to parking or pedestrian and bicycle facilities.
Improvements to transit services and pedestrian connectivity in the project area.
No impact to parking and bicycle facilities.
Project would result in an adverse impact to traffic LOS that cannot be mitigated at four (4) intersections.
Improvements to transit services and pedestrian connectivity in the project area.
No impact to bicycle facilities.
Project would result in an adverse impact to traffic LOS that cannot be mitigated at five (5) intersections.
On-street parking along Holt Boulevard between Benson Avenue and Vineyard Avenue to be removed.
Cumulative Impacts
The No Build Alternative is inconsistent with local agency goals and policies for multimodal transportation system
No impacts No impacts
1 See Table 3-5 for additional information on the inconsistencies of the No Build Alternative with the City’s General Plan.

Community Impact Report
West Valley Connector Project 1
INTRODUCTION
This Community Impact Report (CIR) analyzes the potential land use, growth, community
cohesion, socioeconomics, and environmental justice impacts along the West Valley
Connector (WVC) Project (the WVC Project or the proposed project). The objectives of this
analysis are to describe the regulatory setting, affected environment, impacts on land use,
growth, community cohesion, socioeconomics, and environmental justice communities that
would result from the project, and mitigation measures that would reduce these impacts.
The San Bernardino County Transportation Authority (SBCTA), in cooperation with the cities
of Pomona, Montclair, Ontario, Rancho Cucamonga, and Fontana, proposes construction of
the WVC Project, a 35-mile-long Bus Rapid Transit (BRT) project that will decrease travel
times and improve the existing public transit system within the corridor.
In January 2017, SBCTA entered into a cooperative agreement with Omnitrans designating
SBCTA as the lead agency for the proposed WVC Project. SBCTA intends to construct the
WVC, which will then be operated by Omnitrans. SBCTA has the authority to allocate
Federal Transit Administration (FTA) funds; however, it does not have the ability to receive
funds directly from FTA. Omnitrans is the direct FTA grantee for the San Bernardino Valley.
As a result, SBCTA and Omnitrans have developed a successful direct recipient/
subrecipient working relationship to deliver projects with FTA funds. The current relationship
allows the delivery of FTA-funded projects that meet FTA requirements without duplicating
staff, assuring the best use of limited public funds available. Omnitrans and SBCTA
executed Memorandum of Understanding (MOU) 15-1001289 in October 2015, setting forth
the roles and responsibilities of the recipient/subrecipient relationship.
The project is subject to state and federal environmental review requirements because it
involves the use of federal funds from the Federal Transit Administration (FTA). An
Environmental Impact Report (EIR)/Environmental Assessment (EA) has been prepared for
the proposed project in compliance with the California Environmental Quality Act (CEQA)
and the National Environmental Policy Act (NEPA). SBCTA is the CEQA lead agency, and
FTA is the NEPA lead agency. This CIR has been prepared as part of the technical analysis
required to support the EIR/EA.
Social, economic, and land use considerations of proposed projects are legally required and
supported by major federal regulations, statutes, policies, technical advisories, and
Executive Orders, including:
• National Environmental Policy Act of 1969 (NEPA)
• 23 United States Code (U.S.C.) 109(h) “Consideration of Economic, Social and
Environmental Effects” (1970)

Community Impact Report
2 West Valley Connector Project
• Federal Highway Administration (FHWA) Technical Advisory 6640.8A (1987), Guidance
for Preparing and Processing Environmental and Section 4(f) Documents
• Executive Order (EO) 12898 on Environmental Justice (February 11, 1994)
• Federal Transportation Administration (FTA) Circular 4703.1
• 42 U.S.C. 4601 et seq. “Uniform Relocation Assistance and Real Property Acquisition
Policies for Federal and Federally Assisted Programs,” as amended, 1987
• The California Environmental Quality Act (CEQA) also requires the consideration of
social and economic impacts of projects that may have a physical change in the
environment.
In addition to field reviews conducted in the potentially affected neighborhoods, or adjacent
to the project area, information in this CIR is based on a review and analysis of demographic
forecasts; 2010-2014 American Community Survey (ACS) 5-year Estimates; regional
economic publications; local and regional community plans and documents; Google Earth
imagery; public comment cards and e-mails received during the scoping period; and
numerous other sources of information available online through the Internet.
1.1 Project Location and Setting
The proposed project is located primarily along Holt Avenue/Boulevard and Foothill
Boulevard, which would connect the cities of Pomona, Montclair, Ontario, Rancho
Cucamonga, and Fontana in the counties of Los Angeles and San Bernardino, California.
The project limits extend from Main Street in the City of Pomona on the west side to Sierra
Avenue in the City of Fontana on the east side and Church Street in the City of Rancho
Cucamonga on the north side to Ontario International Airport on the south side (see
Figures 1-1 and 1-2). The proposed project area is primarily urban, and generalized land
uses include low-, medium-, and medium-high-density residential, commercial, industrial,
open space and recreation, transportation and utilities, agriculture, vacant, public facilities,
airport, educational facilities, and offices.
1.2 Purpose and Need
The purpose of the proposed project is to improve corridor mobility and transit efficiency in
the western San Bernardino Valley from the City of Pomona, in Los Angeles County, to the
City of Fontana, in San Bernardino County, with an enhanced, state-of-the-art BRT system
(i.e., the system that includes off-board fare vending, all-door boarding, transit signal priority
[TSP], optimized operating plans, and stations that consist of a branded shelter/canopy,
security cameras, benches, lighting, and variable message signs).
The proposed project would address the growing traffic congestion and travel demands of
the nearly one million people that would be added to Los Angeles and San Bernardino
County by 2040 per Southern California Association of Government’s (SCAG) 2016
Community Impact Report
West Valley Connector Project 3
Regional Transportation Plan (RTP)/Sustainable Communities Strategy (SCS) growth
forecast. Improved rapid transit along the project corridor would help Omnitrans/SBCTA
achieve its long-range goals to cost effectively enhance lifeline mobility and accessibility,
improve transit operations, increase ridership, support economic growth and redevelopment,
conserve nonrenewable resources, and improve corridor safety.
Recognizing the importance of the WVC transit corridor, SBCTA is proposing a project that
is designed to achieve the following objectives:
• Improve transit service by better accommodating high existing bus ridership.
• Improve ridership by providing a viable and competitive transit alternative to the
automobile.
• Improve efficiency of transit service delivery while lowering Omnitrans’ operating costs
per rider.
• Support local and regional planning goals to organize development along transit
corridors and around transit stations.
The project purpose and objectives stated above would respond to the following needs:
• Current and future population and employment conditions establish a need for higher-
quality transit service.
• Current and future transportation conditions establish a need for an improved transit
system.
• Transit-related opportunities exist in the project area.

Community Impact Report
4 West Valley Connector Project
Figure 1-1: Project Location Map

Community Impact Report
West Valley Connector Project 5
Figure 1-2: Project Vicinity Map

Community Impact Report
6 West Valley Connector Project
This page intentionally left blank.

Community Impact Report
West Valley Connector Project 7
PROJECT DESCRIPTION
2.1 Proposed Project
The WVC Project is a 35-mile-long BRT corridor project located primarily along Holt Avenue/
Boulevard and Foothill Boulevard that would connect the cities of Pomona, Montclair,
Ontario, Rancho Cucamonga, and Fontana in the counties of Los Angeles and San
Bernardino, California. The project proposes limited stops, providing speed and quality
improvements to the public transit system within the corridor. The project includes BRT
stations at up to 33 locations/major intersections and associated improvements, premium
transit service, TSP and queue jump lanes, dedicated lanes, and integration with other bus
routes.
The project alignment consists of two phases. Phase I of the project would construct the
“Milliken Alignment,” from the Pomona Regional Transit Center (downtown Pomona
Metrolink Station) to Victoria Gardens in Rancho Cucamonga. Phase II of the project would
construct the “Haven Alignment,” from Ontario International Airport to Kaiser Permanente
Medical Center in Fontana. The Phase I/Milliken Alignment would begin construction in 2020
and is proposed to have 10-minute peak and 15-minute off-peak headways. Phase II is
intended to be constructed immediately following completion of Phase I, depending on the
availability of funding.
Phase I/Milliken Alignment
Phase I of the project would construct the Milliken Alignment from the western boundary limit
in Pomona to Victoria Gardens in Rancho Cucamonga. In Pomona, the alignment starts
from the Pomona Regional Transit Center station, travels along Holt Avenue and into
Montclair.
In Montclair, the alignment runs on Holt Boulevard between Mills Avenue and Benson
Avenue and into Ontario.
In Ontario, the alignment continues on Holt Boulevard, starting from Benson Avenue, and
then continues to Vineyard Avenue and into Ontario International Airport (loop through
Terminal Way). From the airport, it heads north on Archibald Avenue to Inland Empire
Boulevard and turns right and travels east on Inland Empire Boulevard.
On Inland Empire Boulevard, the alignment goes straight into Ontario Mills (loop through
Mills Circle) and then heads north on Milliken Avenue into Rancho Cucamonga.
In Rancho Cucamonga, the alignment makes a loop into the Rancho Cucamonga Metrolink
Station off Milliken Avenue and then continues up Milliken Avenue and turns east onto
Foothill Boulevard.

Community Impact Report
8 West Valley Connector Project
The alignment continues east on Foothill Boulevard, turns north onto Day Creek Boulevard,
and then terminates with a layover at Victoria Gardens at Main Street. From Victoria
Gardens, the bus line begins a return route by continuing north on Day Creek Boulevard,
turns west onto Church Street, turns south onto Rochester Avenue, and then turns west
back onto Foothill Boulevard.
Phase II/Haven Alignment
Phase II of the project would construct the Haven Alignment, from Ontario International
Airport to Kaiser Permanente Medical Center in Fontana. In Ontario, the alignment makes a
loop through Terminal Way at Ontario International Airport. From the airport, it heads north
on Archibald Avenue to Inland Empire Boulevard and turns right to go east on Inland Empire
Boulevard.
From Inland Empire Boulevard, the alignment turns left to go north up Haven Avenue into
Rancho Cucamonga, then turns right to go east onto Foothill Boulevard and into Fontana.
In Fontana, the alignment continues east on Foothill Boulevard until turning south onto
Sierra Avenue. The alignment follows Sierra Avenue, including a stop at the Fontana
Metrolink Station, and then continues until turning west onto Marygold Avenue, where the
bus line would begin a turn-around movement by heading south onto Juniper Avenue, east
onto Valley Boulevard, and north back onto Sierra Avenue to Kaiser Permanente Medical
Center before heading northward for the return trip.
2.2 Project Alternatives
Many alternatives were considered during the project development phase of the project. A
No Build Alternative and two build alternatives (Alternatives A and B) are being analyzed in
the EIR/EA.
2.2.1 No Build Alternative
The No Build Alternative proposes no improvements to the existing local bus services.
Under the No Build Alternative, the existing local bus service on Routes 61 and 66 would
maintain current service of 15-minute headways (total of four buses per hour in each
direction).
2.2.2 Build Alternatives
Figure 2-1 presents the map of both build alternatives. All design features of both build
alternatives are the same, as described in more details in Section 2.3, with the exception of
the following:

Community Impact Report
West Valley Connector Project 9
Alternative A – Full BRT with no Dedicated Bus-only Lanes
Alternative A would include the 35-mile-long BRT corridor, which is comprised of the Phase
I/Milliken Alignment, Phase II/ Haven Alignment, and 60 side-running stations at up to 33
locations/major intersections. The BRT buses will operate entirely in the mixed-flow lanes.
The right-of-way (ROW) limits and travel lane width vary in other segments of the corridor.
Implementation of Build Alternative A will not require permanent or temporary ROW
acquisition.
Alternative B – Full BRT with 3.5 miles of Dedicated Bus-only Lanes in Ontario
Alternative B would include the full 35-mile-long BRT corridor, which is comprised of the
Phase I/Milliken Alignment, Phase II/Haven Alignment, 3.5 miles of dedicated bus-only
lanes, and five center-running stations and 50 side-running stations at up to 33 locations/
major intersections. The dedicated lanes segment would include two mixed-flow lanes and
one transit lane in each direction and five center-running stations. To accommodate the
dedicated lanes, roadway widening and additional utilities, such as electrical and fiber-optic
lines, would require permanent and temporary ROW acquisition. In addition, some areas of
the project corridor would require reconfiguration, relocation, or extension of adjacent
driveways, curbs, medians, sidewalks, parking lots, and local bus stops.
2.3 Design Features of Build Alternatives
2.3.1 Bus Rapid Transit Stations
BRT stations at 33 locations/major intersections and associated improvements are proposed
to be located approximately 0.5 to 1 mile apart to facilitate higher operating speeds by
reducing dwell time (see Figure 1-2 and Figure 2-1 for station locations). Table 2-1 lists the
BRT stations to be constructed as part of Phase I/Milliken Alignment. Note that under
Alternative A, all 21 stations will be side-running stations. Under Alternative B, five center
platform stations are proposed as follows:
• Holt Boulevard/Mountain Avenue
• Holt Boulevard/San Antonio Avenue
• Holt Boulevard/Euclid Avenue
• Holt Boulevard/Campus Avenue
• Holt Boulevard/Grove Avenue
As part of Phase II/Haven Alignment, an additional 12 side-running stations will be
constructed for both build alternatives as list in Table 2-2.

Community Impact Report
10 West Valley Connector Project
Figure 2-1: Build Alternatives Map

Community Impact Report
West Valley Connector Project 11
Table 2-1: Stations along Phase I/Milliken Alignment
City Stations
Pomona • Pomona Regional Transit Center Station
• Holt Avenue/Garey Avenue
• Holt Avenue/Towne Avenue
• Holt Avenue/Clark Avenue
• Holt Avenue/Indian Hill Boulevard
Montclair • Holt Boulevard/Ramona Avenue
• Holt Boulevard/Central Avenue
Ontario • Holt Boulevard/Mountain Avenue*
• Holt Boulevard/San Antonio Avenue*
• Holt Boulevard/Euclid Avenue*
• Holt Boulevard/Campus Avenue*
• Holt Boulevard/Grove Avenue*
• Holt Boulevard/Vineyard Avenue
• Ontario International Airport
• Inland Empire Boulevard/Archibald Way
• Inland Empire Boulevard/Porsche Way
• Ontario Mills
Rancho Cucamonga • Rancho Cucamonga Metrolink Station
• Foothill Boulevard/Milliken Avenue
• Foothill Boulevard/Rochester Avenue
• Victoria Gardens between North and South Main Street
Note: * denotes the center-running stations to be constructed under Alternative B.
Source: Parsons 2017.
Table 2-2: Additional Stations to be Constructed as Part of Phase II/Haven Alignment
City Stations
Rancho Cucamonga • Haven Avenue/6th Street
• Haven Avenue/Arrow Route
• Haven Avenue/Foothill Boulevard
• Foothill Boulevard/Spruce Avenue
• Foothill Boulevard/Day Creek Boulevard
Fontana • Foothill Boulevard/Mulberry Avenue
• Foothill Boulevard/Cherry Avenue
• Foothill Boulevard/Citrus Avenue
• Foothill Boulevard/Sierra Avenue
• Fontana Metrolink Station
• Sierra Avenue/Randall Avenue
• Sierra Avenue/Kaiser Permanente
Source: Parsons 2017.

Community Impact Report
12 West Valley Connector Project
Side-Running Stations
Side-running stations would typically be located on the far side of an intersection to facilitate
transit priority and to avoid a stopped bus from blocking those turning right from the corridor.
Where curb cuts for driveways and other conditions do not provide enough space along the
curbside for both the San Bernardino Valley Express (sbX) and the local bus on the far side
of the intersection, the local buses would be located on the near side of the intersection.
In the side-running condition, stations may include new or improved shelters with passenger
amenities, or only an sbX-branded pylon with signature light. Proposed shelters would be
approximately 18 feet in length and a width that would fit a 10-foot-wide-minimum sidewalk.
Passenger amenities at the side platform stations would include benches, bicycle racks,
trash receptacles, variable message signs, security cameras, and lighting integrated with the
shelter. There would be no fare collection equipment on the sidewalks or shelters when the
available ROW is less than 10 feet, and the passengers may pay the fee on the bus. Side-
running stations would also include various amenities.
For all stations in Rancho Cucamonga, only an sbX-branded pylon with signature light is
proposed. Should shelters be implemented in the future, coordination between the City of
Rancho Cucamonga and SBCTA would be required to environmentally clear the shelters at
a later time.
Center Platform Stations
As indicated in Section 2.3.1, five center-running platform stations are proposed to be
constructed as part of the Phase I/Milliken Alignment (in Ontario) under Alternative B.
The center-running platform stations would be in the center of the street ROW on a raised
platform with an end-block crossing. Access would be provided by crosswalks at
intersections and Americans with Disabilities Act (ADA)-compliant ramps to the station
platforms. Center-running platforms would be placed as close to the intersection as possible
while still maintaining left-turn pockets, where required.
In the optimum center-running platform configuration, the platform would accommodate a
canopy with its seating area, passenger amenities, fare equipment, and a ramp to comply
with relevant accessibility requirements and provide clearance in front of ticket vending
machines. Stations would include amenities that can be assembled and laid out to suit the
functionality of the station and fit with the surrounding land uses.
2.3.2 sbX Bus Operations
The proposed project would require 18 buses during the Phase I operation and increase to
27 buses for the Phase I and Phase II operation to serve the designed headways and have
sufficient spare vehicles.

Community Impact Report
West Valley Connector Project 13
Under Alternative A, sbX buses would operate entirely in mixed-flow lanes along the
proposed 35 miles of the Phase I and Phase II alignments. For Alternative B, sbX buses
would operate in mixed-flow lanes similar to Alternative A, except where dedicated bus-only
lanes (3.5 miles) are proposed along Holt Boulevard, between Benson Avenue and Vine
Avenue and between Euclid Avenue and Vineyard Avenue, in Ontario.
Roadway sections where the sbX would operate in mixed-flow lanes would generally be
kept as existing conditions, although some modifications, such as relocated curb and gutter,
may be necessary near the stations to provide sufficient room for bus stopping and loading.
Reconstruction of curb and gutters would only be required for the segment where dedicated
bus-only lanes are proposed. Vehicular lanes where the sbX buses would operate in
dedicated bus-only lanes would feature concrete roadways, painted or striped to visually
separate the exclusive lanes from mixed-flow lanes. Transition areas from mixed-flow to
exclusive lanes would be provided at each end of an exclusive lane location. Such
transitions would be clearly marked to separate bus movements from other vehicular traffic.
Reinforced concrete bus pad in the pavement would be placed at all station locations for the
sbX buses.
sbX buses would operate from 6:00 a.m. to 8:00 p.m. with peak headways for 4 hours and
off-peak headways for 10 hours per day for a total span of service of 14 hours per day,
Monday through Friday. From the Pomona Metrolink Transit Center station to Inland Empire
Boulevard, the sbX buses would operate on 10-minute peak headways and 15-minute off-
peak headways. Additional service hours, including weekend service, may be added if
additional operating funds become available in the future.
2.3.3 Operations and Maintenance
Fleet Composition
The proposed project’s fleet would be comprised of 60-foot-long articulated compressed
natural gas (CNG) propulsion buses. sbX buses would hold approximately 96 passengers at
maximum capacity with up to 8 bicycles on board. Today, the average local bus operating
speeds are only 12 to 15 miles per hour (mph), and they are getting slower as corridor
congestion worsens. In calculating run times, it was assumed that the average dwell time at
stations would be 30 seconds (peak service), and average overall speed would be 20 mph.
The average speed for sbX buses would be 18 mph.
Maintenance Requirements and Associated Facilities
Omnitrans operates and maintains its existing bus fleets from two major Operations and
Maintenance (O&M) facilities: East Valley Vehicle Maintenance Facility (EVVMF), located at
1700 W. 5th Street in the City of San Bernardino and West Valley Vehicle Maintenance
Facility (WVVMF), located at 4748 E. Arrow Highway in the City of Montclair. EVVMF is a
Level III facility capable of full maintenance of buses and WVVMF is a Level II facility

Community Impact Report
14 West Valley Connector Project
suitable for light maintenance. Neither facility has sufficient capacity to accommodate the
additional maintenance and storage requirements of the bus fleet associated with the
proposed WVC Project.
The purpose of the new O&M facility is to provide operations and maintenance support to
the existing full-service EVVMF. The new facility would be designed and constructed to
provide Level I service maintenance with a capacity to be upgraded to provide Level II
service maintenance. Heavy repair functions and administrative functions would remain
exclusively with the EVVMF in San Bernardino.
Facility Components
Conceptually, the new O&M facility would be built on an approximate 5-acre site. The Level I
facility would include a parking area, bus washing area, fueling area, and a personnel and
storage building. As needs arise, the facility could be upgraded to provide Level II service,
which will include the addition of a maintenance shop and a larger administrative building.
Landscaping and irrigation would be provided to enhance the comfort of employees and the
appearance of the facility, and to help screen maintenance facilities and operations from
offsite viewpoints within the community. Figure 2-2 shows the conceptual site plan of the
Level II facility.
Figure 2-2: O&M Facility Conceptual Site Plan

Community Impact Report
West Valley Connector Project 15
Depending on the service level to be performed, approximately 50-100 staff would be using
this facility including bus operators and O&M staff.
Potential Sites
Three sites are being considered for the placement of the new O&M facility (see Figure 2-3).
All are owned by the City of Ontario and are located in the industrial zoned area, slightly
more than a mile from the proposed BRT corridor alignment on Holt Boulevard:
• Site 1: 1516 S. Cucamonga Avenue, Ontario (APN 1050-131-03-0000 and APN 1050-
131-02-0000). The current use of this property is public works storage yard. If selected,
the O&M facility will be built at the bottom portion of the parcel encompassing an area of
approximately 6.0 acres.
• Site 2: 1440 S. Cucamonga Avenue, Ontario (APN 1050-141-07-0000). The current use
of this property is compressed natural gas fueling station. If selected, the O&M facility
will utilize the entire parcel encompassing an area of approximately 4.8 acres.
• Site 3: 1333 S. Bon View Avenue, Ontario (APN 1049-421-01-0000 and APN 1049-421-
02-0000). The current use of this property is municipal utility and customer service
center. If selected, the O&M facility will be built at the bottom portion of the parcel
encompassing an area of approximately 6.6 acres.
Buses coming to and from the new facility could use nearby access roads that directly
connect to the BRT corridor such as South Campus Avenue, South Bon View Avenue, and
South Grove Avenue.
The O&M facility will be constructed during the same period as the Phase I/Milliken
Alignment and would be open for operation at the same time as the Phase I alignment.
Construction duration is estimated at 12 months.
2.4 Implementation Schedule
Implementation of the proposed project is planned over the next 5 years and would entail
many activities, including:
• Completion of the environmental compliance phase (March 2020)
• Completion of Preliminary Engineering (March 2020)
• Completion of Final Design (May 2021)
• Completion of O&M facility (December 2023)
• Completion of Construction of Phase I/Milliken Alignment and testing (December 2023)
• System operation (begin revenue operation in December 2023)
• Construction of Phase II/Haven Alignment is scheduled to occur after completion of the
Phase I/Milliken Alignment pending funding availability

Community Impact Report
16 West Valley Connector Project
Figure 2-3: Potential Operations and Maintenance Facility Sites

Community Impact Report
West Valley Connector Project 17
2.5 Study Area Definition
The project study area boundaries vary somewhat, depending on the subject matter being
analyzed. The project study area generally follows the boundaries of the U.S. Census Tracts
traversed by and adjacent to the build alternatives, as depicted in Figure 2-4. This Census
tract study area consists of Census tracts within 0.25 mile from the centerline of the
proposed project. The study area includes an area larger than that directly affected by
project construction and ROW acquisitions to provide a broader picture of the area affected
by the project. The study area also includes populations that may not be directly affected by
the project but may be indirectly affected by project construction and operation. Table 2-3
identifies the Census tracts used in the analysis of the build alternatives.
Table 2-3: Study Area Census Tracts
Build Alternatives
Census Tract 4023.03 Census Tract 15.01 Census Tract 22.07
Census Tract 4026 Census Tract 15.03 Census Tract 23.05
Census Tract 4027.02 Census Tract 15.04 Census Tract 24.01
Census Tract 4027.05 Census Tract 16 Census Tract 24.02
Census Tract 4027.06 Census Tract 18.03 Census Tract 26.01
Census Tract 4028.01 Census Tract 18.13 Census Tract 28.01
Census Tract 4088 Census Tract 20.28 Census Tract 28.03
Census Tract 2.07 Census Tract 20.34 Census Tract 28.04
Census Tract 2.08 Census Tract 20.35 Census Tract 29.01
Census Tract 3.01 Census Tract 20.36 Census Tract 30
Census Tract 3.03 Census Tract 20.37 Census Tract 31.02
Census Tract 3.04 Census Tract 20.38 Census Tract 32
Census Tract 10.02 Census Tract 21.07 Census Tract 33.01
Census Tract 11.01 Census Tract 21.09 Census Tract 33.02
Census Tract 13.12 Census Tract 21.10 Census Tract 127
Census Tract 14 Census Tract 22.04
Source: Parsons, 2018.

Community Impact Report
18 West Valley Connector Project
Figure 2-4: Project Census Tract Study Area Map

Community Impact Report
West Valley Connector Project 19
In addition, for purposes of the impact analysis, community facilities, such as schools,
hospitals, libraries, and places of worship, located within 0.5-mile radius of the project
footprint are included in the community impact analysis. In certain other cases, the
demographic and socioeconomic data are extrapolated at a larger scale because of the way
the information is aggregated, this includes information from whole Census tracts, each of
the five cities (Pomona, Montclair, Ontario, Rancho Cucamonga, and Fontana), and Los
Angeles and San Bernardino counties.
2.6 Other Development Projects
Several other projects are being planned or developed within the project area. Tables 2-4
and 2-5 and Figure 2-5 show foreseeable land and transportation development projects
located within 5 miles of the proposed project alignment and all other land development
projects (e.g., commercial development) located within 2 miles of the proposed project
alignment that would be built within 3 years after the proposed project is implemented. The
list of reasonably foreseeable projects is based on information collected from City websites
and those projects allocated for funding in SCAG’s 2015 Federal Transportation
Improvement Program (FTIP).
The effects of these other projects are used as part of the cumulative impact analysis for the
proposed project (see Section 7.0). Cumulative impacts are those that result from past,
present, and reasonably foreseeable future actions, combined with the potential impacts of
this project. A cumulative effect assessment looks at the collective impacts posed by
individual land use plans and projects. Cumulative impacts can result from individually
minor, but collectively substantial, impacts taking place over a period of time. Long-term
growth projections are also considered because they help identify future actions that could
contribute to potential cumulative impacts.
Table 2-4: Land Development Projects within the Project Vicinity
No.* Project Type/Sponsor/ Location/Status
Summary
1 Old Town La Verne Specific Plan
• Land development project
• City of La Verne
• Located in La Verne
• Adopted in 2013
The plan will establish Old Town La Verne as a distinctive center for La Verne with attractive streets, enjoyable public spaces, historic neighborhoods, lively mixed-used commercial areas, and a variety of housing options.

Community Impact Report
20 West Valley Connector Project
Table 2-4: Land Development Projects within the Project Vicinity
No.* Project Type/Sponsor/ Location/Status
Summary
2 Pomona Corridors Specific Plan
• Land development project
• City of Pomona
• Located in Pomona
• Adopted in 2013
The plan was established to orchestrate private and public investment activities along the Garey Avenue, Holt Avenue, Mission Boulevard, and Foothill Boulevard corridors, and to support and promote the type of investment that will enhance the beauty and vitality of Pomona’s primary commercial corridors.
3 Downtown Pomona Specific Plan
• Land development project
• City of Pomona
• Located in Pomona
• Final EIR approved in 2005
The plan is proposed to facilitate and encourage development of higher-intensity residential uses that would provide a greater range of housing opportunities for a wider variety of lifestyles, while supporting and enhancing existing and future businesses and educational institutions in the heart of downtown Pomona.
4 Park View Specific Plan
• Land development project
• City of Upland
• Located in Upland
• To be implemented between 2013 and 2021
This Specific Plan area is composed of a residential development with a small commercial-retail component. The Specific Plan proposes 355 multi-family attached and 14 detached residential units. The area is bound by Foothill Boulevard, Monte Vista Avenue, and West Arrow Route, just below Central Avenue.
5 College Park Specific Plan
• Land development project
• City of Upland
• Located in Upland
• To be implemented between 2013 and 2021
In 2004, the City of Upland adopted the College Park Specific Plan to encourage mixed-use development in southwest Upland and provide housing opportunities for the Claremont Colleges. The planning area includes 25 acres of residential land that can accommodate approximately 500 housing units. A total of 450 apartment units have been built. An additional 92 small-lot, detached single-family units are planned at a density of 10 units per acre.

Community Impact Report
West Valley Connector Project 21
Table 2-4: Land Development Projects within the Project Vicinity
No.* Project Type/Sponsor/ Location/Status
Summary
6 North Montclair Downtown Specific Plan
• Land development project
• City of Montclair
• Located in Montclair
• Specific Plan approved in 2006
This Specific Plan is a master plan for approximately 150 acres of North Montclair as a mixed-use, transit-oriented district. The project will introduce up to 1,850 new residential units and a variety of mixed-use, small office, local-serving retail, and regional retail uses. The plan is phased through 2020.
In 2014, The Paseos, a 385-unit multi-family residential development at the northeast corner of Monte Vista Avenue and Moreno Street, was completed within the Specific Plan area.
7 Holt Boulevard Specific Plan
• Land development project
• City of Montclair
• Located in Montclair
• Updated in 2013
The plan guides land use development and manages future growth along Holt Boulevard in Montclair.
8 Meredith International Centre Specific Plan
• Land development project
• City of Ontario
• Located in Ontario
• Initial Study prepared in 2014
The Meredith International Centre Specific Plan Amendment Project proposes a mix of industrial, commercial, and residential land uses on approximately 257 acres located in the southeast portion of Ontario within San Bernardino County. The site is generally located north of Interstate 10 (I-10), south of 4th Street, between Vineyard Avenue and Archibald Avenue. The project area is located in between the Southern Pacific Trail and west Arrow Route. Construction activities were initiated in late 2015.
9 Ontario Festival Specific Plan
• Land development project
• City of Ontario
• Located in Ontario
• Approved in 2012
The Ontario Festival Specific Plan is a comprehensive plan for the development of a planned residential site that could accommodate up to 472 dwelling units on approximately 37.6 acres. This project will be located along Inland Empire Boulevard between Archibald Avenue and Turner Avenue, just below Guasti Regional Park.

Community Impact Report
22 West Valley Connector Project
Table 2-4: Land Development Projects within the Project Vicinity
No.* Project Type/Sponsor/ Location/Status
Summary
10 Wagner Properties Specific Plan
• Land development project
• City of Ontario
• Located in Ontario
• Approved in 2010
The Specific Plan addresses the development of 11 parcels, totaling 54.57 acres of eastern Ontario. The plan will guide creation of a commercial center with commercial and residential uses.
11 Ontario Center Specific Plan
• Land development project
• City of Ontario
• Located in Ontario
• Amended in 2006
The Ontario Center site consists of approximately 88 acres of vacant land located at the northerly boundary of the eastern portion of Ontario, south of 4th Street, between Haven Avenue and Milliken Avenue, and less than 0.25 mile north of I-10. The Ontario Center will accommodate up to 2,840,000 square feet of development, including urban commercial, urban residential, garden commercial, and open space elements.
12 The Exchange Specific Plan
• Land development project
• City of Ontario
• Located in Ontario
• Approved in 2003
The Exchange is an approximately 23.60-acre commercial development designed as a destination for customers traveling along I-15, 4th Street, and Inland Empire Boulevard.
13 Tuscana Village Specific Plan
• Land development project
• City of Ontario
• Located in Ontario
• Last amended in 2008
The Tuscana Village Specific Plan encompasses approximately 20 acres 0.25 mile south of the State Route (SR) 60/Milliken Avenue interchange. The plan would construct a pedestrian-oriented urban village, mixed-use development that would provide up to 200 residential uses and 210,830 square feet of commercial uses.
14 Rich-Haven Specific Plan
• Land development project
• City of Ontario
• Located in Ontario
• Approved in 2007
The plan defines uses for 510.6 gross acres for development of a maximum of 4,256 dwelling units and a minimum of 889,200 square feet of regional commercial/office uses. The project site is bound by Riverside Drive, Haven Avenue, Edison Avenue, and Milliken Avenue.
15 West Haven Specific Plan
• Land development project
• City of Ontario
• Located in Ontario
• Last amended in 2008
The West Haven Specific Plan is a comprehensive plan for development of a mixed-used community with planned residential sites that will accommodate 753 dwelling units, a neighborhood center, school, and parks. It is bound by Haven Avenue, Riverside Drive, and Schaefer Avenue.

Community Impact Report
West Valley Connector Project 23
Table 2-4: Land Development Projects within the Project Vicinity
No.* Project Type/Sponsor/ Location/Status
Summary
16 The Avenue Specific Plan
• Land development project
• City of Ontario
• Located in Ontario
• Last amended in 2010
The Avenue Specific Plan will develop approximately 569 gross acres of agricultural operations to include a maximum of 2,606 residential units and 250,000 square feet of retail land use. The plan is bound by Schaeffer Avenue, Carpenter Avenue, Edison Avenue, and Haven Avenue.
17 Parkside Specific Plan
• Land development project
• City of Ontario
• Located in Ontario
• Approved in 2006
Parkside is proposed as a new 250.89-gross-acre planned community that will include up to 1,947 residential units and a 58.47-acre “Great Park.” The site is located between Cucamonga Creek and Archibald Avenue.
18 Grand Park Specific Plan
• Land development project
• City of Ontario
• Located in Ontario
• Approved in 2014
The plan will develop 320.2 gross acres of undeveloped agricultural land to include up to 1,327 residential dwelling units, a high school, an elementary school, and a public community park. The plan area is located east of Archibald Avenue, west of Haven Avenue, south of Edison Avenue, and north of Eucalyptus Avenue.
19 Empire Yards at Rancho Cucamonga Metrolink Station (Empire Lakes Specific Plan)
• Land development project
• SC Rancho Development/ City of Rancho Cucamonga
• Located in Rancho Cucamonga
• Final EIR to amend the Empire Lakes Specific Plan released in 2016
• City of Rancho Cucamonga has adopted the Specific Plan
• Construction is expected to be completed by 2024
The Empire Lakes Specific Plan would develop the privately-owned Empire Lakes Golf Course (160 acres) into a mixed-use, TOD site. The project would include a combination of residential, commercial, recreational, and office uses in an urban setting near transit services, including the Rancho Cucamonga Metrolink Station, and local regional activity centers. The project site is located north of 4th Street, west of Milliken Avenue, east of Cleveland Avenue, and south of 8th Street and the railroad.
20 Foothill Boulevard Visual Improvement Plan
• Land development project
• City of Rancho Cucamonga
• Located in Rancho Cucamonga
• Adopted in 2002
The purpose of the plan is to develop a specification plan that will set forth design concepts for the streetscape improvements within the public ROW and entry areas along the entire length of Foothill Boulevard/Route 66 in Rancho Cucamonga.

Community Impact Report
24 West Valley Connector Project
Table 2-4: Land Development Projects within the Project Vicinity
No.* Project Type/Sponsor/ Location/Status
Summary
21 Victoria Arbors Master Plan
• Land development plan
• City of Rancho Cucamonga
• Located in Rancho Cucamonga
• Amended in 2003
The master plan provides the framework on which the development of a viable, mixed-use village with a series of residential neighborhoods and mixed-use areas interconnected to each other and to a central school/park by a system of paseos and linear parks will develop.
22 Southwest Industrial Park (SWIP)
• Land development project
• City of Fontana
• Located in Fontana
• Amended in 2009
The SWIP Specific Plan is expected to promote economic development and provide opportunities for existing property owners and new businesses. A total of 1,101 acres has been included in the plan since its adoption in 1977. The project area spans both sides of I-10 and is roughly between Etiwanda Avenue and Citrus Avenue.
23 West End Specific Plan
• Land development plan
• City of Fontana
• Located in Fontana
• Amended in 2003
The West End Specific Plan is approximately 1,296 acres bound by East Avenue, the Southern Pacific Rail ROW, Cherry Avenue, Hemlock Avenue, and Foothill Boulevard. It is envisioned to be a mixed-use community, including business, commercial, office, public, and residential spaces.
24 Westgate Specific Plan
• Land development project
• City of Fontana
• Located in Fontana
• Final EIR released in September 2015
The Westgate Specific Plan encompasses 964 acres in northwestern Fontana and will include a maximum of 6,410 residential units and a variety of other uses to create a village-oriented mixed-use development. The project is bound by I-15, Baseline Avenue, and Lytle Creek Road.
25 Ventana at Duncan Canyon Specific Plan
• Land development project
• City of Fontana
• Located in Fontana
• Approved in 2007
The Ventana at Duncan Canyon Specific Plan project area is a 105-acre master-planned, mixed-use community that is adjacent to I-15 on Duncan Canyon Road. It will support a maximum of 842 residential units, more than 100,000 square feet of retail space, and more than 350,000 square feet of office space.

Community Impact Report
West Valley Connector Project 25
Table 2-4: Land Development Projects within the Project Vicinity
No.* Project Type/Sponsor/ Location/Status
Summary
26 Arboretum Specific Plan
• Land development project
• City of Fontana
• Located in Fontana
• Awaiting construction
The Arboretum Specific Plan is located on the northern portion of Fontana and will create a 531.3-gross-acre master-planned community with up to 3,526 residential units. The project is generally bound by Citrus Avenue, Sierra Avenue, Grapeland Street, Duncan Canyon Road, Casa Grande Avenue, and Cypress Avenue.
27 Summit at Rosena Specific Plan
• Land development project
• City of Fontana
• Located in Fontana
• Approved in 2006
The Summit at Rosena is located in the northern portion of Fontana and is at the intersection of Sierra Avenue and Summit Avenue. The 179.8-acre community will support a maximum of 856 dwelling units, mixed-use activity center, elementary school, and open space areas.
28 Fontana Promenade Specific Plan
• Land development project
• City of Fontana
• Located in Fontana
• Approved in 2007
The 125-gross-acre property just south of the Sierra Avenue and I-210 interchange is a master-planned mixed-use community that will offer a variety of retail, office, and residential types and densities.
29 Downtown Fontana Transit-Oriented Development Study
• Land development project
• City of Fontana
• Located in Fontana
• Completed in 2010
The City of Fontana evaluated TOD opportunities near the adjacent Metrolink station. The study researched comparable transit stations across the country to help understand the critical factors to achieve a truly transit-oriented, transit-serving Downtown, identified the market potential that will result in the Downtown serving as a destination for residents, and identified residential prototypes and suitable locations that will help create an urban, transit-oriented place.
Community Impact Report
26 West Valley Connector Project
Table 2-4: Land Development Projects within the Project Vicinity
No.* Project Type/Sponsor/ Location/Status
Summary
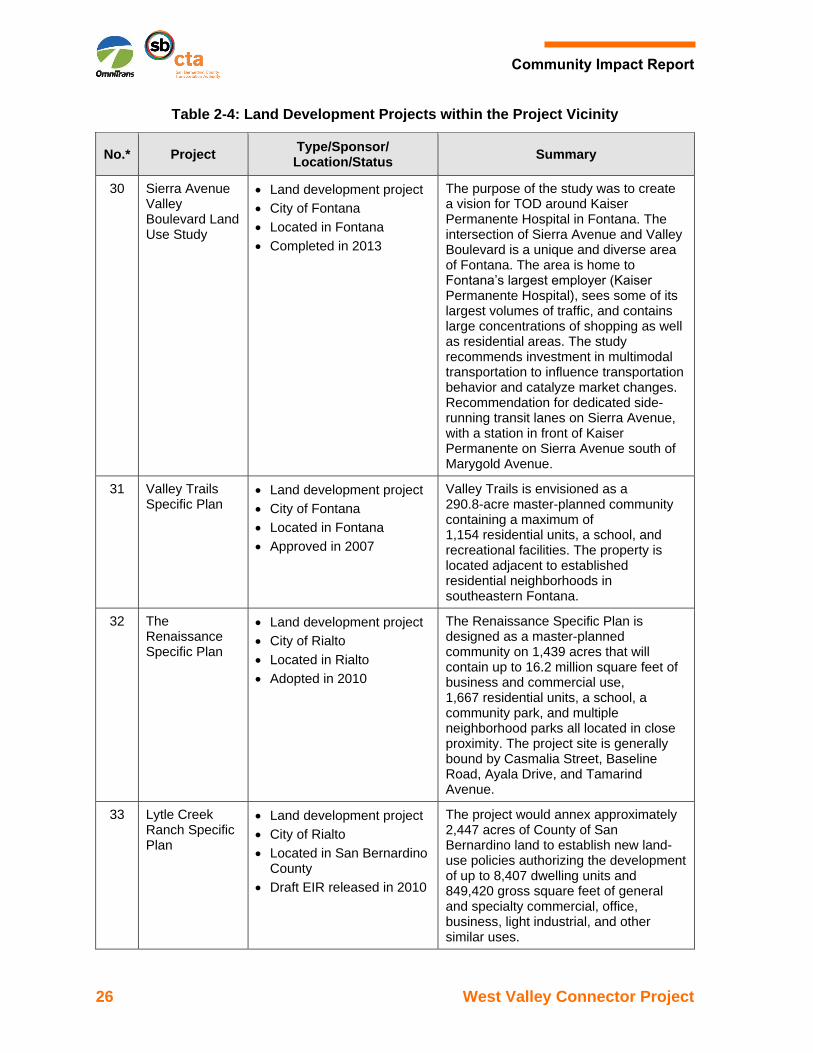
30 Sierra Avenue Valley Boulevard Land Use Study
• Land development project
• City of Fontana
• Located in Fontana
• Completed in 2013
The purpose of the study was to create a vision for TOD around Kaiser Permanente Hospital in Fontana. The intersection of Sierra Avenue and Valley Boulevard is a unique and diverse area of Fontana. The area is home to Fontana’s largest employer (Kaiser Permanente Hospital), sees some of its largest volumes of traffic, and contains large concentrations of shopping as well as residential areas. The study recommends investment in multimodal transportation to influence transportation behavior and catalyze market changes. Recommendation for dedicated side-running transit lanes on Sierra Avenue, with a station in front of Kaiser Permanente on Sierra Avenue south of Marygold Avenue.
31 Valley Trails Specific Plan
• Land development project
• City of Fontana
• Located in Fontana
• Approved in 2007
Valley Trails is envisioned as a 290.8-acre master-planned community containing a maximum of 1,154 residential units, a school, and recreational facilities. The property is located adjacent to established residential neighborhoods in southeastern Fontana.
32 The Renaissance Specific Plan
• Land development project
• City of Rialto
• Located in Rialto
• Adopted in 2010
The Renaissance Specific Plan is designed as a master-planned community on 1,439 acres that will contain up to 16.2 million square feet of business and commercial use, 1,667 residential units, a school, a community park, and multiple neighborhood parks all located in close proximity. The project site is generally bound by Casmalia Street, Baseline Road, Ayala Drive, and Tamarind Avenue.
33 Lytle Creek Ranch Specific Plan
• Land development project
• City of Rialto
• Located in San Bernardino County
• Draft EIR released in 2010
The project would annex approximately 2,447 acres of County of San Bernardino land to establish new land-use policies authorizing the development of up to 8,407 dwelling units and 849,420 gross square feet of general and specialty commercial, office, business, light industrial, and other similar uses.

Community Impact Report
West Valley Connector Project 27
Table 2-4: Land Development Projects within the Project Vicinity
No.* Project Type/Sponsor/ Location/Status
Summary
34 Pepper Avenue Specific Plan
• Land development project
• City of Rialto
• Located in Rialto
• Draft EIR released in 2017
The Pepper Avenue Specific Plan would develop 101.7 acres of mostly vacant land to include a mix of retail, office, and up to 275 multi-family residential land uses. The project site is located east of Eucalyptus Avenue, south of SR-210, west of Meridian Avenue, and north of Walnut Avenue.
35 Foothill Boulevard Specific Plan
• Land development project
• City of Rialto
• Located in Rialto
• Adopted in 2010
Foothill Boulevard stretches for 4 miles through Rialto. The focus of this plan is changing from regional and highway commercial uses to more locally serving community, commercial, and residential uses.
36 Integrated Transit and Land Use Planning for the Foothill Boulevard/ 5th Street/ Baseline Road Corridor
• Land development project
• SBCTA and SCAG
• Located in Rialto
• Completed in 2013
The purpose of the study was to evaluate options for alignments, operating scenarios, and land use scenarios for BRT service along Foothill Boulevard.
37 San Bernardino County Flood Control District’s Master Stormwater System Maintenance Program (MSWMP)
• Flood control facility maintenance
• San Bernardino County Flood Control District
• Located within the San Bernardino County Flood Control District jurisdiction (the project is located in multiple locations along the project corridor and is not shown in Figure 2-13)
• Initial Study prepared in June 2014
The project proposes to implement a comprehensive program to prepare and implement a Maintenance Plan for maintenance of flood facilities throughout San Bernardino County. Types of routine O&M activities include, but are not limited to, removal of excess sediment, debris, and vegetation; stockpiling excess material and debris following removal; maintaining sufficient flow paths; grooming/repairing earthen and improved channel slopes and bottoms; and maintaining culverts and bridges to ensure proper drainage and structural integrity.
*Reference number corresponds to the location of the development project site in Figure 2-5.
Sources: City of Fontana, 2003. City of La Verne, 2013. City of Montclair, 1999. City of Ontario, 2008, City of Pomona, 2014. City of Rancho Cucamonga, 2010. San Bernardino County, 2007.

Community Impact Report
28 West Valley Connector Project
Table 2-5: Transportation Projects within the Project Vicinity
No.* Project Type/Sponsor/ Location/Status
Summary
1 Pomona Americans with Disabilities Act Improvements – Major Street Rehabilitation
• Transportation project
• City of Pomona
• Located in Pomona (the project has work locations throughout Pomona and is not shown in Figure 2-13)
• Plans signed February 2016
The City of Pomona’s Major Street Rehabilitation project provides rehabilitation of 3.57 lane miles of the City’s arterial streets, including parts of Garey Avenue, Indian Hill Boulevard, County Road, San Antonio Avenue, and La Verne Avenue. The project includes removal and replacement of trees; removal and replacement of damaged sidewalk, curbs and gutters; ADA access ramps; removal and relocation of fencing; and construction of new wider sidewalk within existing street ROW as possible without obtaining additional easements.
2 Pomona Americans with Disabilities Act Curb Ramps and Sidewalk Compliance Program
• Transportation project
• City of Pomona
• Located in Pomona (the program has work locations throughout Pomona and is not shown in Figure 2-13)
• Public hearing on the Appeal of Historic Preservation Commission’s Approval of Major Certification of Appropriateness and Design Plan was held in July 2017
The ADA Curb Ramps and Sidewalks Compliance Program is a citywide program to implement ADA improvements, such as curb ramps and detectable warning surfaces.
3 Pomona Americans with Disabilities Act Transition Plan
• Transportation project
• City of Pomona
• Located in Pomona (the plan has projects that are located throughout Pomona and is not shown in Figure 2-13)
• Plan approval signed October 2015
The Pomona ADA Transition Plan outlines City ADA codes and standards, and goals and objectives in making pedestrian facilities within public ROW ADA compliant. The plan includes an inventory of existing public ROW facilities, funding sources, and programs.

Community Impact Report
West Valley Connector Project 29
Table 2-5: Transportation Projects within the Project Vicinity
No.* Project Type/Sponsor/ Location/Status
Summary
4 Los Angeles-San Bernardino Inter-County Transit and Rail Study
• Transportation project
• SCAG
• Located in Claremont, La Verne, Montclair, Ontario, Pomona, Rancho Cucamonga, and Upland (the project is located throughout Los Angeles and San Bernardino counties and is not shown in Figure 2-13)
• Currently underway
The study’s objectives are to understand the market for transit and rail travel in the corridor, including travel to and from Ontario International Airport; estimate potential benefits and costs associated with different transit and rail improvement options for the corridor; and recommend a path forward for cost-effective transit and rail improvements, with a focus on coordinating plans for the Metro Gold Line, Metrolink, and access to Ontario International Airport.
5 Improvement to Transit Access for Cyclists and Pedestrians
• Transportation project
• SBCTA and SCAG
• Located in Montclair, Upland, Rancho Cucamonga, Fontana, Rialto, San Bernardino, and Loma Linda
• Plan completed in 2013
• Currently working on implementing the plan
The plan includes sidewalk improvements around/near six Metrolink stations on the San Bernardino Line and four future E Street sbX BRT stations in the cities of San Bernardino and Loma Linda. The project is designed to improve access to and from stations for local residents and commuters, thereby reducing parking demand and increasing transit ridership.
6 I-10 Corridor Project
• Transportation project
• SBCTA and California Department of Transportation (Caltrans)
• Located in Pomona, Claremont, Montclair, Upland, Ontario, Fontana, Bloomington, Rialto, Colton, San Bernardino, Loma Linda, Redlands, and Yucaipa
• Environmental approval phase completed in 2017
The I-10 Corridor Project is proposed to improve safety and relieve traffic congestion on I-10, 0.4 mile west of White Avenue in Pomona at Post Mile (PM) 44.9 to just east/west of Live Oak Canyon Road in Yucaipa at PM 37.0.

Community Impact Report
30 West Valley Connector Project
Table 2-5: Transportation Projects within the Project Vicinity
No.* Project Type/Sponsor/ Location/Status
Summary
7 I-10/Grove Avenue Interchange Project
• Transportation project
• City of Ontario
• Located in Ontario
• Environmental approval phase expected to be completed in 2018.
The I-10/Grove Avenue Interchange Project proposes to improve on the operational deficiencies of the existing interchange and relieve traffic congestion to accommodate anticipated increases in automobile and truck traffic in the study area. The project would construct a new interchange at Grove Avenue, close the existing I-10/4th street interchange, and include improvements along Grove Avenue and 4th Street near the interchange.
8 Grove Avenue Corridor Project
• Transportation project
• City of Ontario
• Located in Ontario
• Currently in preliminary and environmental document phase
The Grove Avenue Corridor Project proposes to widen Grove Avenue between 4th Street and Holt Boulevard in Ontario. The project would accommodate recent and projected growth in passenger and goods/trucks movement associated with Ontario International Airport and changes in land use since Grove Avenue was originally constructed.
9 Metro Gold Line Foothill Extension Construction Activity: Ontario Airport Extension
• Transportation project
• LA Metro
• Located in Montclair, Upland, and Ontario
• Completion anticipated in 2026
The project would extend the Gold Line approximately 8 miles – from the TransCenter in Montclair, located just east of Monte Vista Avenue and north of Arrow Highway, to Ontario – and terminate the line at Ontario International Airport. Although not formally part of the Foothill Extension Project, the Construction Authority completed a study to understand the feasibility of extending the line from Montclair to the airport in 2008. The Initial Study concluded that extending the line was feasible and provided many potential route options.
10 Ontario Airport Rail Access Study
• Transportation project
• SBCTA
• Located in Ontario
• Completed in 2015
The study evaluated options for transit to Ontario International Airport, including shuttle bus from nearby Metrolink stations, such as Rancho Cucamonga Metrolink Station.
11 ARRIVE Corridor Study
• Transportation project
• SCAG/SBCTA
• Located in Ontario
• Completed in 2015
The study evaluated alternatives for passenger rail service within 0.5 mile of Ontario International Airport and San Bernardino Airport.

Community Impact Report
West Valley Connector Project 31
Table 2-5: Transportation Projects within the Project Vicinity
No.* Project Type/Sponsor/ Location/Status
Summary
12 I-15 Corridor Improvement Project
• Transportation project
• Riverside County Transportation Commission (RCTC) and Caltrans
• Located in Jurupa Valley, Eastvale, Norco, Corona, and Riverside
• Construction to begin in 2018
The project proposes to improve a 14.6-mile-long segment of the I-15 corridor. The proposed project would include the addition of one to two tolled Express Lanes in each direction from Cajalco Road where it crosses I-15 in Corona to just south of the I-15 and SR-60 interchange at Riverside Drive.
13 Customer-Based Ridesharing and Transit Interconnectivity Study
• Transportation project
• SBCTA
• Located throughout San Bernardino County
• Study in progress
This project is studying how to improve shared and active transportation in San Bernardino County. The study examines transit interconnectivity, service gaps and inefficiencies, and costs and funding opportunities. The project is also studying the transit connection between the Rancho Cucamonga Metrolink Station and Ontario International Airport.
14 Foothill Boulevard BRT Study
• Transportation project
• City of Rancho Cucamonga
• Located in Rancho Cucamonga
• Completed in 2013
This study evaluated feasibility and phasing options for BRT service along Foothill Boulevard in Rancho Cucamonga and identified opportunities for station area development. The outcome of discussions with Rancho Cucamonga board members resulted in an agreement that they want median-running dedicated BRT on at least part of the corridor. Recommendation to deviate the planned BRT route at Victoria Gardens.
15 WVC Corridor – Safe Routes to Transit Project
• Transportation project
• OmniTrans
• Located in the cities of Pomona, Montclair, Ontario, Rancho Cucamonga, and Fontana
• Categorical Exemption/ Categorical Exclusion (CE/CE) completed and approved in May 2016
• Expected to start construction January 2018 and completion by January 2019
The project proposes sidewalk and curb ramp improvements, installation of bicycle racks, and restriping of pedestrian crosswalks within 0.5 mile of the proposed WVC stations in the cities of Pomona, Montclair, Ontario, Rancho Cucamonga, and Fontana.

Community Impact Report
32 West Valley Connector Project
Table 2-5: Transportation Projects within the Project Vicinity
No.* Project Type/Sponsor/ Location/Status
Summary
16 Safe Routes to School Project – Fontana Avenue and Arrow Boulevard
• Transportation project
• City of Fontana
• Located in Fontana
• Preliminary Environmental Study approved on August 2016
• Construction scheduled to start early 2018.
The City of Fontana’s Safe Routes to School Project consists of installing sidewalk and bicycle infrastructure. This project is for the installation of 2.2 miles of sidewalk and bicycle infrastructure, where none currently exist, located on Arrow Boulevard and Fontana Avenue. The project includes construction of 5-foot-wide sidewalks, Class II bicycle lanes, curb and gutter, reconstructing ADA-compliant driveways, installing 25 ADA curb ramps, and providing signage and pavement striping.
17 Fontana Grade Crossings Pedestrian Improvement Project
• Transportation project
• SBCTA
• Located in Fontana
• Construction is scheduled to be completed in spring 2018.
The project was initiated by SBCTA and Fontana in February 2015 to construct grade crossing safety enhancements for pedestrians at the existing Sierra Avenue and Juniper Avenue Metrolink at-grade crossings in Fontana.
*Reference number corresponds to the location of the development project site in Figure 2-5.
Sources: City of Fontana, 2003. City of La Verne, 2013. City of Montclair, 1999. City of Ontario, 2008, City of Pomona, 2014. City of Rancho Cucamonga, 2010. San Bernardino County, 2007.

Community Impact Report
West Valley Connector Project 33
Figure 2-5: Other Development Projects (Sheet 1 of 5)

Community Impact Report
34 West Valley Connector Project
Figure 2-5: Other Development Projects (Sheet 2 of 5)

Community Impact Report
West Valley Connector Project 35
Figure 2-5: Other Development Projects (Sheet 3 of 5)

Community Impact Report
36 West Valley Connector Project
Figure 2-5: Other Development Projects (Sheet 4 of 5)

Community Impact Report
West Valley Connector Project 37
Figure 2-5: Other Development Projects (Sheet 5 of 5)

Community Impact Report
38 West Valley Connector Project
This page intentionally left blank.

Community Impact Report
West Valley Connector Project 39
LAND USE
3.1 Existing Land Use
An examination of land use patterns within a given area can effectively convey the general
form of its structure, including where its residents live, work, and recreate.
Existing land uses in the affected area and surrounding region can be used to analyze
potential land use changes or conflicts associated with the proposed transportation project.
Specific topics regarding land use include existing land use patterns, development trends,
and adopted planning goals and policies.
The 35-mile-long project corridor traverses the cities of Pomona, Montclair, Ontario, Rancho
Cucamonga, and Fontana. Existing land uses shown in Figure 3-1 are based on 2012 land
use data from SCAG. Existing land uses include single- and multi-family residential, mobile
homes and trailer parks, general office, commercial and services, public and special use
facilities, education, industrial, transportation and utilities, mixed commercial and industrial,
mixed residential and commercial, open space and recreation, agriculture, vacant, water,
and areas under construction, as defined in Table 3-1. Existing land uses shown in Figure 3-
1 encompasses an area within 300 feet of the centerline of the proposed alignment and
within 0.5 mile from proposed BRT stations and potential O&M facility sites.
Table 3-1: Existing Land Use Categories within 300 Feet of Project Centerline and 0.5 Mile from Proposed BRT Stations and Potential O&M Facility Sites
Land Use Definition Typical Examples
Single-Family Residential
Occupied by single residential dwellings.
Single-family homes.
Multi-Family Residential
Occupied by multiple residential dwellings.
Multi-family homes, duplexes, townhomes, apartments, and condominiums.
Mobile Homes and Trailer Parks
Occupied by residential dwellings. Mobile homes and trailer parks.
Mixed Residential Occupied by single residential dwellings, high and low density.
Single-family and multi-family homes and neighborhoods with townhomes.
General Office A building used for business and professional work.
Business and professional offices.
Commercial and Services
Facilities and business engaged in commerce or service.
Retail stores, strip-malls, hotels and motels.
Public and Special Use Facilities
Facilities owned by public entities that serve the community.
Government buildings, police stations, hospitals, libraries, and community centers.

Community Impact Report
40 West Valley Connector Project
Table 3-1: Existing Land Use Categories within 300 Feet of Project Centerline and 0.5 Mile from Proposed BRT Stations and Potential O&M Facility Sites
Land Use Definition Typical Examples
Education Learning facilities for students. Public and private elementary, middle, and high schools and universities.
Industrial Locations where products are manufactured or produced
Light- and large-scale manufacturing, warehouses, distribution facilities, and storage and use of heavy equipment.
Transportation, Communications, and Utilities
Areas used by or for transportation, communication facilities, and utility facilities.
Airports, railroads, freeways and major roads, power facilities, water storage facilities, improved flood waterways and structures, and maintenance yards.
Mixed Commercial and Industrial
Areas with commercial and industrial uses.
Shops and retail facilities with industry or manufacturing facilities.
Mixed Residential and Commercial
Buildings used for business or professional work with residential dwellings.
Business and professional offices with apartments in the same facility.
Open Space and Recreation
Open space areas are green landscapes without structures and recreation areas are designed for leisure and non-work activities.
Parks and recreational fields (e.g., soccer, baseball, football fields, golf course), cemeteries, and natural environmental resources.
Agriculture Land used for cultivation, raising crops, and livestock.
Farms and vineyards, woodlands, wineries, and ranches.
Vacant Undeveloped lands that typically contain no structures.
Vacant lots and abandoned orchards or vineyards.
Water Open water bodies or area of inundation (high water) and storm water infrastructure.
Open water bodies (e.g. ocean, lake, pond, wetlands). Storm water infrastructure (e.g. catch-basin, detention basin, retention basin)
Under Construction Facilities that were under construction at the time SCAG land use data were collected in 2012. Typically includes a foundation and a graded area with no vegetation.
New buildings or facilities under construction.
Source: SCAG, 2012.

Community Impact Report
West Valley Connector Project 41
Figure 3-1: Existing Land Use Map (Sheet 1 of 10)

Community Impact Report
42 West Valley Connector Project
This page intentionally left blank.

Community Impact Report
West Valley Connector Project 43
Figure 3-1: Existing Land Use Map (Sheet 2 of 10)

Community Impact Report
44 West Valley Connector Project
This page intentionally left blank.

Community Impact Report
West Valley Connector Project 45
Figure 3-1: Existing Land Use Map (Sheet 3 of 10)

Community Impact Report
46 West Valley Connector Project
This page intentionally left blank.

Community Impact Report
West Valley Connector Project 47
Figure 3-1: Existing Land Use Map (Sheet 4 of 10)

Community Impact Report
48 West Valley Connector Project
This page intentionally left blank.

Community Impact Report
West Valley Connector Project 49
Figure 3-1: Existing Land Use Map (Sheet 5 of 10)

Community Impact Report
50 West Valley Connector Project
This page intentionally left blank.

Community Impact Report
West Valley Connector Project 51
Figure 3-1: Existing Land Use Map (Sheet 6 of 10)

Community Impact Report
52 West Valley Connector Project
This page intentionally left blank.

Community Impact Report
West Valley Connector Project 53
Figure 3-1: Existing Land Use Map (Sheet 7 of 10)

Community Impact Report
54 West Valley Connector Project
This page intentionally left blank.
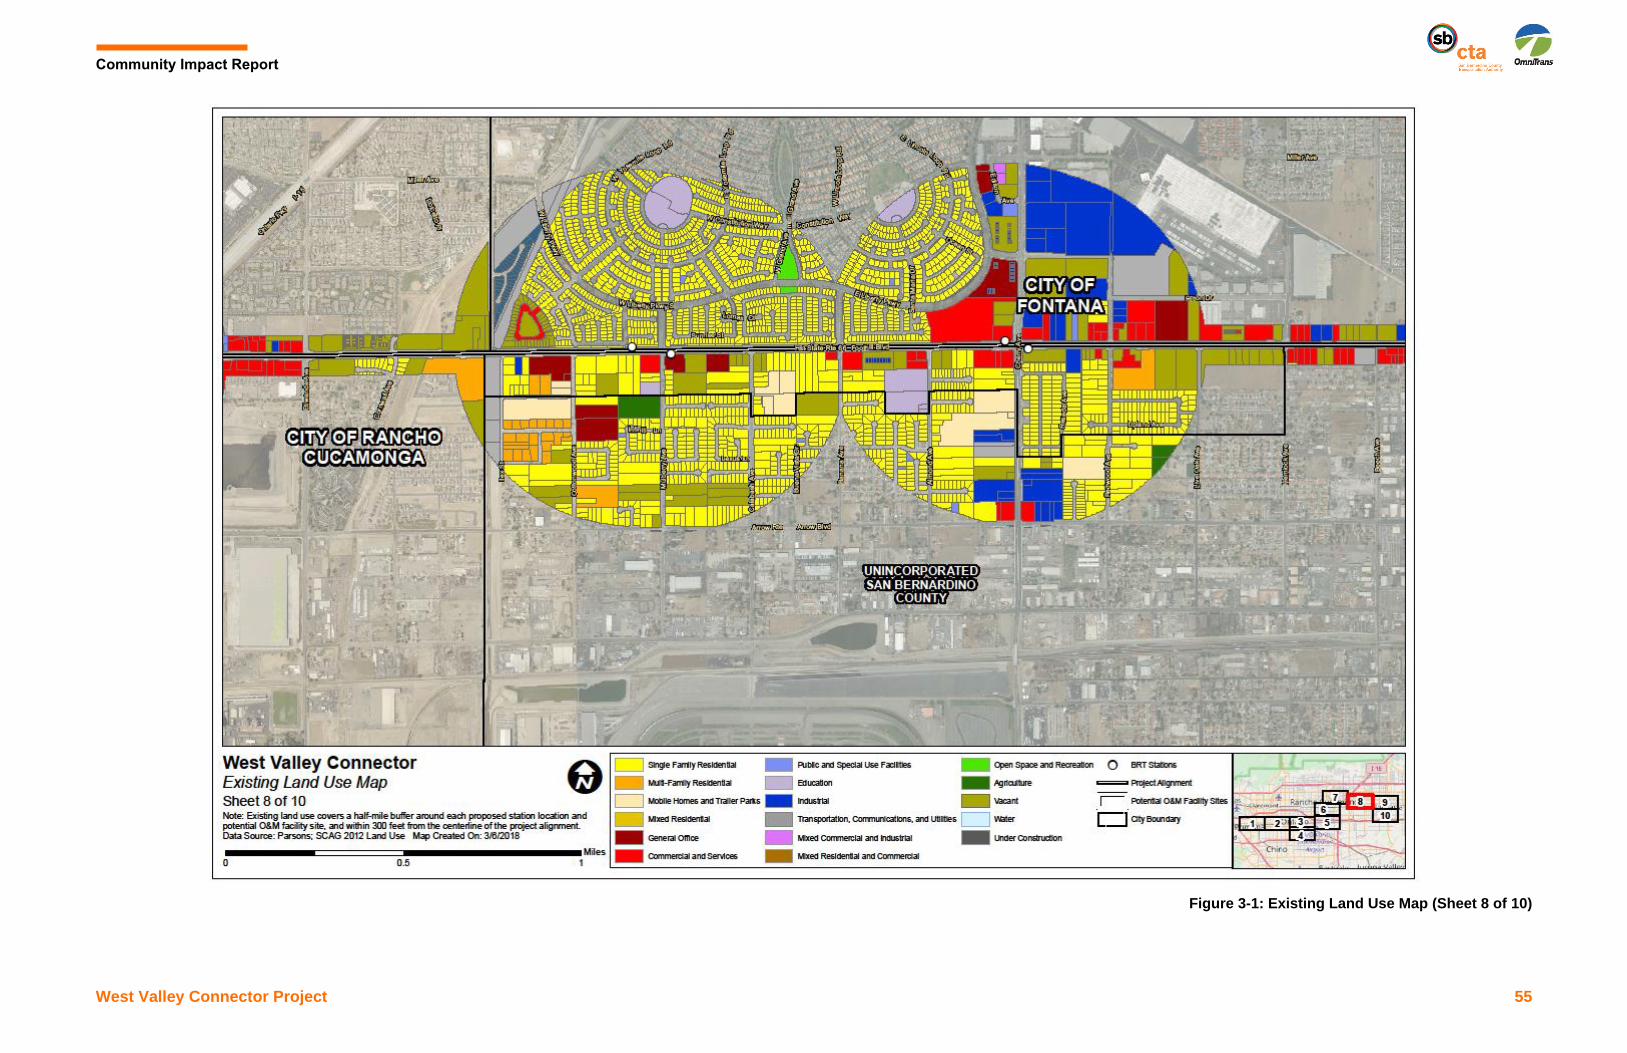
Community Impact Report
West Valley Connector Project 55
Figure 3-1: Existing Land Use Map (Sheet 8 of 10)

Community Impact Report
56 West Valley Connector Project
This page intentionally left blank.

Community Impact Report
West Valley Connector Project 57
Figure 3-1: Existing Land Use Map (Sheet 9 of 10)

Community Impact Report
58 West Valley Connector Project
This page intentionally left blank.

Community Impact Report
West Valley Connector Project 59
Figure 3-1: Existing Land Use Map (Sheet 10 of 10)

Community Impact Report
60 West Valley Connector Project
This page intentionally left blank.

Community Impact Report
West Valley Connector Project 61
Table 3-2 provides a breakdown of the type of land uses by parcel identified within the study
area (defined as the area within 300 feet of the centerline of the proposed alignment and
within 0.5 mile from proposed BRT stations and potential O&M Facility sites) in each city,
including areas of unincorporated San Bernardino County.
Table 3-2: Existing Land Use Types within the Study Area
Land Use
Number of Parcels
Total Parcels
Percent P
om
on
a
Mo
ntc
lair
On
tari
o
Ra
nch
o
Cu
ca
mo
ng
a
Fo
nta
na
Un
inc
orp
ora
ted
Sa
n B
ern
ard
ino
Co
un
ty
Single-Family Residential
2,042 1,231 3,507 1,493 5,830 670 14,773 54.1
Multi-Family Residential
676 565 1,032 1,553 759 25 4,610 16.9
Mobile Homes and Trailer Parks
5 18 10 0 127 7 167 0.6
Mixed Residential 1 0 222 0 0 0 223 0.8
General Office 102 24 387 174 91 3 781 2.9
Commercial and Services
349 192 463 265 541 49 1,859 6.8
Public and Special Use Facilities
163 11 71 43 88 6 382 1.4
Education 28 19 8 8 30 0 93 0.3
Industrial 164 226 415 319 115 81 1,320 4.8
Transportation, Communications, and Utilities
43 38 335 45 50 12 523 1.9
Mixed Commercial and Industrial
0 0 0 120 2 0 122 0.5
Mixed Residential and Commercial
14 0 0 0 0 0 14 0.1
Open Space and Recreation
4 8 103 12 44 0 171 0.6
Agriculture 0 0 23 2 1 3 29 0.1
Water 0 0 0 2 0 0 2 0.01
Under Construction 0 0 0 612 44 0 656 2.4
Vacant 290 46 793 175 256 30 1,590 5.8
Total Parcels 3,881 2,378 7,369 4,823 7,978 886 27,315 100
Source: SCAG, 2012.

Community Impact Report
62 West Valley Connector Project
As shown in Table 3-2, the predominant land uses within the study area are single-family
residences at 54.1 percent followed by multi-family residences at 16.9 percent. Commercial
and services land uses constitute 6.8 percent. According to the County of San Bernardino
Housing Element (2014), residential neighborhoods in San Bernardino County are
comprised of mostly detached single-family units (approximately 71 percent of the total
housing units). The housing stock in San Bernardino County is relatively new, with 50
percent of all units built after 1980; however, historical designated buildings, including
residential units, are located along Holt Boulevard in the City of Ontario.
3.1.1 Affected Environment
The varied existing land uses within the project study area include single- and multi-family
residential, mobile homes and trailer parks, general office, commercial and services, public
and special use facilities, education, industrial, transportation and utilities, mixed commercial
and industrial, mixed residential and commercial, open space and recreation, agriculture,
vacant, water, and areas under construction. The project study area contains several
destination sites, including the Ontario Convention Center, Ontario International Airport,
Ontario Mills, and Victoria Gardens, as well as Metrolink stations, schools, downtown areas
(Pomona, Ontario, and Fontana), and major employers. Medium-high-density residential
uses are clustered along the Holt Boulevard and Foothill Boulevard spine. This mixture of
land uses is conducive to high transit activity between points along the project corridor. As
described in Section 3.2, local land use plans and policies in the cities of the corridor are
supportive of establishing communities that integrate transit and other alternative modes of
transportation into the fabric of planned development.
City of Pomona Land Use
The project corridor in Pomona starts at the Pomona Transit Center, which is surrounded
largely by medical and auto-related uses. Garey Avenue, the primary north-south arterial
adjacent to the transit center, is considered the gateway into Pomona’s Downtown to the
south and is surrounded by civic uses and commercial/retail properties. In addition to the
Transit Center, the YMCA building on Garey Avenue anchors the area. Holt Avenue
between Garey Avenue and Mills Avenue is primarily dominated by older retail and auto-
related uses and the Indian Hill Mall on the eastern end of Pomona.
City of Montclair Land Use
The project corridor in Montclair consists of land uses adjacent to Holt Boulevard between
Mills Avenue and Benson Avenue that are primarily commercial and industrial uses
dominated by older retail and auto-related businesses.

Community Impact Report
West Valley Connector Project 63
City of Ontario Land Use
In Ontario, the project corridor along Holt Boulevard on the east consists of numerous vacant
lots and older commercial uses as one approaches historic downtown Ontario. Most of the
vacant and underused parcels are located along the project corridor east of Sultana Avenue.
Near Ontario International Airport, a few high-density residential developments located
immediately east of Euclid Avenue (a major north-south arterial) close to downtown Ontario
were recently constructed. Hospitality uses dominate the eastern edge of this segment
along Holt Boulevard. The Ontario Convention Center and several hotels are located in the
immediate vicinity of the Holt Boulevard and Vineyard Avenue intersection. These uses are
complemented by surrounding restaurants, auto uses, and Ontario International Airport.
Land uses along Airport Drive, on the northern edge of Ontario International Airport, include
airport parking lots and service roads to the south and railroad tracks to the north. Access to
the airport is from Airport Drive and Archibald Avenue. The former Guasti winery property,
northeast of the airport entry, currently has vacant land surrounding the historic structures
onsite, but it is planned for future mixed-use development that would complement airport
uses. Along Archibald Avenue, there are vacant and industrial properties.
Inland Empire Boulevard is surrounded by multi-family residential developments on the north
side and industrial and commercial uses on the south side. Land uses at the intersection of
Inland Empire Boulevard and Haven Avenue are predominately office buildings, along with a
hotel on the southeast corner and vacant lots on the northwest corner. Inland Empire Boulevard,
near Milliken Avenue, is dominated by restaurants, 5- to 10-story office towers and hotels with
surface parking, the adjacent I-10, Founder’s Garden, a large formal park dedicated to the
founding of Ontario, and Ontario Mills, a major regional shopping center east of Milliken Avenue.
City of Rancho Cucamonga Land Use
In Rancho Cucamonga, the project corridor along Milliken Avenue, between Inland Empire
Boulevard and Fourth Street, is largely dominated by restaurants and retail associated with
Ontario Mills. Medium-high density multi-family residential are located along Milliken Avenue
north of Fourth Street, with mixed-use development and the Rancho Cucamonga Metrolink
Station on the west side of Milliken Avenue. Land uses at the intersection of Milliken Avenue
and Foothill Boulevard comprises primarily of restaurants, strip retail, and hospitality uses.
Along Foothill Boulevard, planned communities include Victoria Gardens and Terra Vista
with commercial uses comprising primarily of restaurants, commercial, small scale and big
box retail. There is some multi-family and single-family housing along Foothill Boulevard,
and undeveloped land. Single-family housing can also be found along Mayten Avenue,
Church Street, and Day Creek Boulevard. Multi-family housing, Victoria Gardens, and other
commercial and retail uses are located along Day Creek Boulevard. The Victoria Gardens
area is a key commercial destination with department stores, a variety of restaurants, and a
movie theater. Victoria Gardens Cultural Center is located within the center as well. Multi-

Community Impact Report
64 West Valley Connector Project
family residential uses surround Victoria Gardens. North of Church Street, land uses are
primarily single-family residences. Several new apartment and townhome developments are
at Church Street and Mayten Avenue, including a senior living center.
Within the project corridor along Haven Avenue, there are vacant lots adjacent at the west
side of Haven Avenue are zoned for light industrial uses. Overall, land uses along Haven
Avenue are predominantly general office, auto-oriented commercial plazas, and light
industrial uses. Approaching the intersection of Haven Avenue and Foothill Boulevard, the
land uses are mostly multi-family residential and large commercial shopping plazas. The
Rancho Cucamonga Superior Court, Rancho Cucamonga Civic Center, and Terra Vista
Town Center are near the Haven Avenue and Foothill Boulevard intersection.
City of Fontana Land Use
The project corridor in Fontana begins from East End Avenue going eastward along Foothill
Boulevard. Along the corridor, general commercial/retail and auto-related activities are the
primary uses, comprised of mechanic shops, restaurants, banks, and some small-scale and
big-box retail. Vacant/undeveloped land dominates the project corridor between Cherry
Avenue and Citrus Avenue. East of Citrus Avenue, along Foothill Boulevard to Sierra
Avenue, major cross streets are lined with commercial uses with single-family and medium-
and high-density housing located behind the commercial.
Turning south onto Sierra Avenue, the project corridor traverses Fontana Civic Center and
the Pacific Electric Bike Trail, followed by Fontana Metrolink Station and historic Downtown
Fontana. Kaiser Permanente Medical Center is the major commercial node on Sierra
Avenue near Valley Boulevard. Other land uses along Sierra Avenue between Foothill
Boulevard and Valley Boulevard include retail, auto-related uses, and vacant/undeveloped
land. Newer high-density residential senior housing fronts Sierra Avenue on both sides
between Ceres Avenue and the UPRR railroad tracks.
The project corridor has a strong market for transit because the corridor is home to several
important employment, educational, and activity centers where public transit demand by
workers, shoppers, students, visitors, and others is concentrated. The project corridor would
provide direct connections between Ontario Mills, Ontario International Airport, Victoria
Gardens, Kaiser Permanente Medical Center, and between three Metrolink stations.
3.1.2 Environmental Consequences
No Build Alternative
The No Build Alternative would not lead to any physical improvements that would convert
existing land uses to transportation uses. The effects of other transportation improvement
projects that are being planned within the project area would be analyzed in separate
environmental documents.

Community Impact Report
West Valley Connector Project 65
Build Alternatives
BRT Corridor
The proposed project would traverse areas where there is a variety of existing residential,
commercial, industrial, and recreational land uses. Alternative A would not result in the
conversion of existing land uses since the proposed project would stay within the city ROW.
Alternative B would result in the conversion of existing land uses to accommodate the
dedicated lanes, which would require roadway widening between Benson Avenue and Vine
Avenue and between Euclid Avenue and Vineyard Avenue in Ontario. Although Alternative
B would mostly stay within city ROW, approximately 11.01 acres of various land uses would
be permanently converted into a transportation use. Project compatibility under both
Alternatives A and B is considered high because the proposed project is located in an urban
setting that would connect major activity centers. Consistency of the proposed project with
established plans and policies is examined in Section 3.2.
Indirect impacts (e.g., changes in regional development and growth-related changes) to land
use patterns are not anticipated with implementation of the build alternatives. The area
subject to ROW acquisition is urbanized, containing few vacant parcels. It is possible that
the presence of a new premium transit service corridor could result in localized changes in
adjacent land parcels; however, the ROW acquisition process would take into account this
potential, and the post-project land use pattern is expected to foster continuing stability to
those land uses through such methods as avoiding unusable small remnant parcels and
providing adequate buffer space for sensitive land uses. Given these considerations,
implementation of any build alternative would not result in indirect adverse effects on land
use.
Alternative A
Implementation of Alternative A would not directly affect public or privately-owned properties
because no ROW acquisition would be needed; however, temporary construction
easements would be required throughout the project corridor.
Alternative B
Implementation of Alternative B would result in conversion of existing land uses and directly
affect public and privately-owned properties to accommodate the 3.5-mile-long dedicated
lanes along Holt Boulevard. In this area (between Benson Avenue and Vineyard Avenue in
Ontario), project compatibility with existing land uses is considered high because the
proposed project is in an urban setting that would connect major activity centers. The
proposed project would generally stay within the city ROW, although Alternative B would
permanently convert approximately 11.01 acres of various land uses to a transportation use.
ROW and construction easements required to construct the project would necessitate partial
and full acquisitions of numerous parcels. As shown in Table 3-3 and Figure 3-2, 263

Community Impact Report
66 West Valley Connector Project
parcels would be affected under Alternative B, specifically for the 3.5-mile-long segment
along Holt Boulevard, to accommodate the dedicated bus-only lanes and center-running
stations. Approximately 4.22 acres of land would be temporarily impacted for construction
easements. Approximately 11.01 acres of land along the dedicated lanes segment would be
permanently converted to a transportation use.
Table 3-3: Impacts to Land Use under Alternative B
Land Use Temporary
Impacts (Acres)
Permanent Impacts (Acres)
Total Number of Impacted
Parcels
Single-Family Residential 0.11 0.36 8
Multi-Family Residential 0.62 0.65 43
Mobile Homes and Trailer Parks 0.07 0.06 4
Mixed Residential 0.05 0.07 3
General Office 0.33 1.49 23
Commercial and Services 0.67 5.15 61
Public and Special Use Facilities 0.13 0.11 4
Industrial 1.02 0.92 54
Transportation, Communications, and Utilities 0.18 0.21 11
Agriculture 0.02 0.04 1
Vacant 1.00 1.95 51
Total 4.22 11.01 263
Source: SCAG, 2012.
However, Alternative B is not anticipated to have an adverse impact on land use when
considered with any other transportation, commercial, industrial, or residential projects
because implementation of the proposed project is consistent with adopted land use and
transportation plans.
O&M Facility
Both alternatives would include construction of an O&M facility to support BRT vehicles
used for BRT service. Three potential sites have been identified for construction of the O&M
facility. The potential sites are located in the City of Ontario within existing city-owned
parcels designated for Industrial use. Site 1, located on 1516 S. Cucamonga Avenue, is
currently used as a public works storage yard. Site 2, located on 1440 S. Cucamonga
Avenue, is currently used as a CNG fueling station. Site 3, located on 1333 S. Bon View
Avenue, is currently used as a municipal utility and customer service center. Construction of
the O&M facility at any of the three potential sites would not result in any changes in existing
land use designation at or around the potential City-owned sites. SBCTA will need to
negotiate for the purchase, lease, or use of either site as the O&M site for the project.

Community Impact Report
West Valley Connector Project 67
Figure 3-2: Impacts to Land Use under Alternative B (Sheet 1 of 8)

Community Impact Report
68 West Valley Connector Project
This page intentionally left blank.

Community Impact Report
West Valley Connector Project 69
Figure 3-2: Impacts to Land Use under Alternative B (Sheet 2 of 8)

Community Impact Report
70 West Valley Connector Project
This page intentionally left blank.

Community Impact Report
West Valley Connector Project 71
Figure 3-2: Impacts to Land Use under Alternative B (Sheet 3 of 8)

Community Impact Report
72 West Valley Connector Project
This page intentionally left blank.

Community Impact Report
West Valley Connector Project 73
Figure 3-2: Impacts to Land Use under Alternative B (Sheet 4 of 8)
Community Impact Report
74 West Valley Connector Project
This page intentionally left blank.
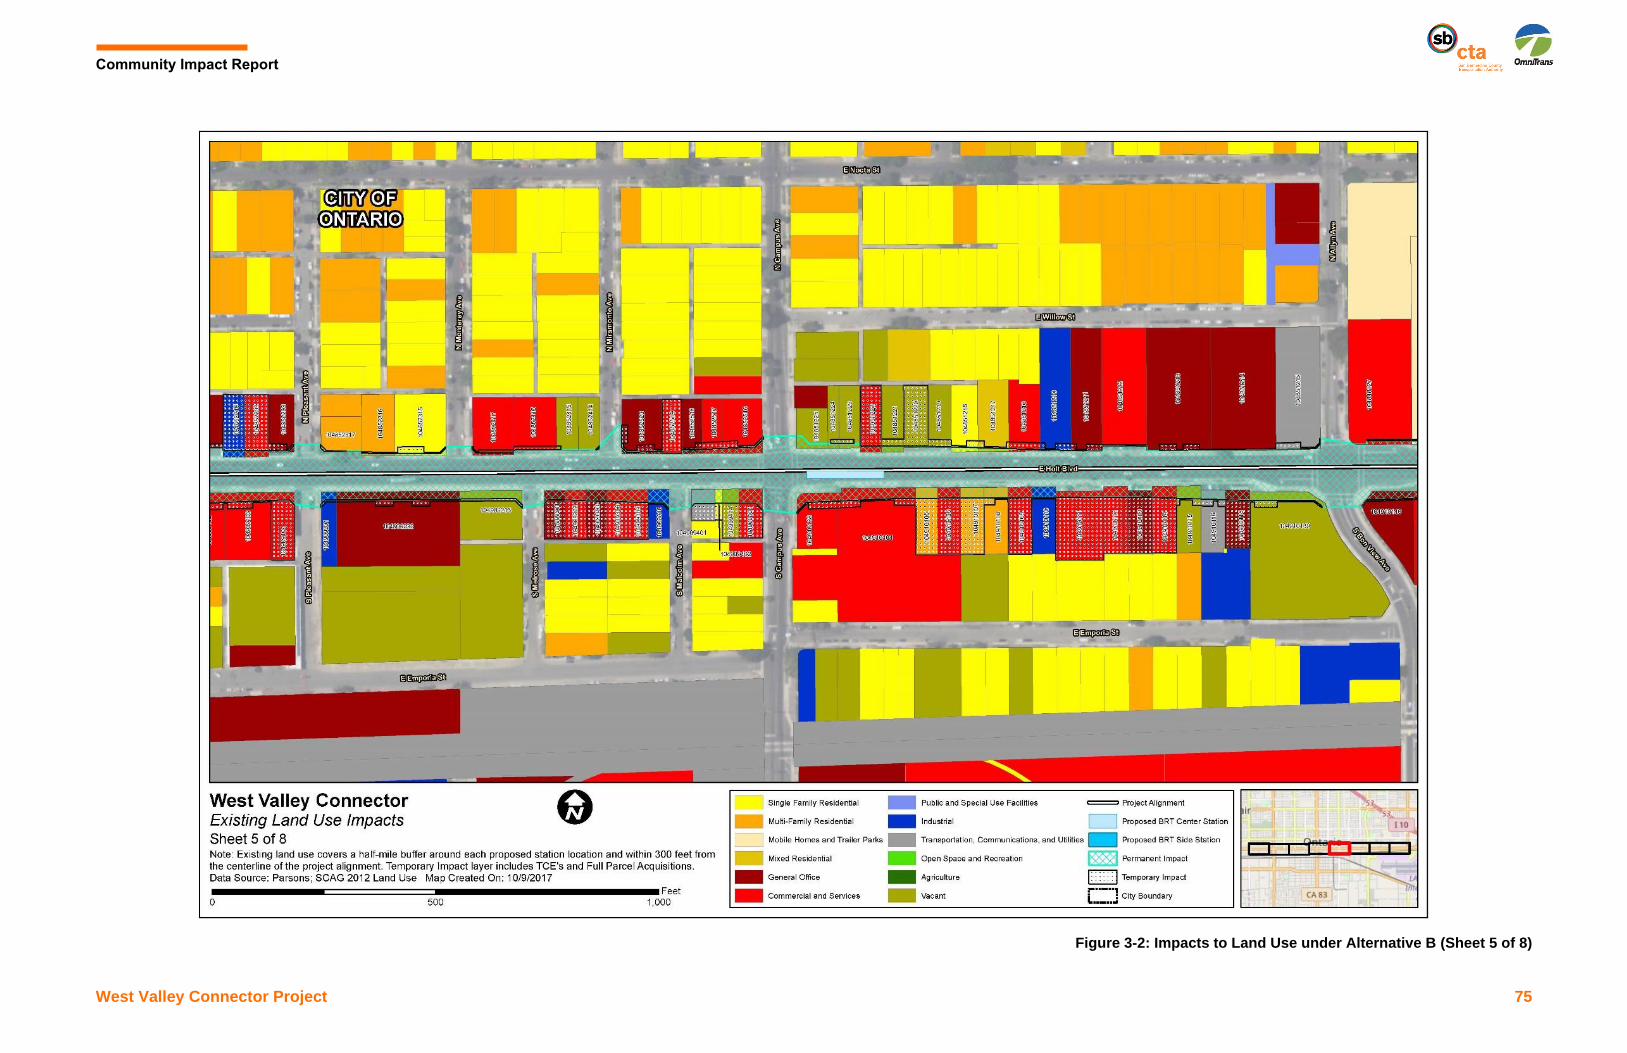
Community Impact Report
West Valley Connector Project 75
Figure 3-2: Impacts to Land Use under Alternative B (Sheet 5 of 8)

Community Impact Report
76 West Valley Connector Project
This page intentionally left blank.

Community Impact Report
West Valley Connector Project 77
Figure 3-2: Impacts to Land Use under Alternative B (Sheet 6 of 8)

Community Impact Report
78 West Valley Connector Project
This page intentionally left blank.

Community Impact Report
West Valley Connector Project 79
Figure 3-2: Impacts to Land Use under Alternative B (Sheet 7 of 8)

Community Impact Report
80 West Valley Connector Project
This page intentionally left blank.

Community Impact Report
West Valley Connector Project 81
Figure 3-2: Impacts to Land Use under Alternative B (Sheet 8 of 8)

Community Impact Report
82 West Valley Connector Project
This page intentionally left blank.

Community Impact Report
West Valley Connector Project 83
3.1.3 Avoidance, Minimization, and Mitigation Measures
There are no available reasonable mitigation measures that would reduce impacts on land
use. The project design of the proposed project will, however, be carried out to minimize
ROW impacts to the extent feasible, being mindful of the need for the project to be
consistent with current and future planned local land uses as identified through the local
government planning process.
3.2 Consistency with State, Regional, and Local Plans
The General Plans and associated Specific Plans, Strategic Plans, and Community Plans
for the cities of Pomona, Montclair, Ontario, Rancho Cucamonga, and Fontana, and the
General Plans for the County of Los Angeles and County of San Bernardino, guide
development within the project study area. The following discussion describes the adopted
plans within the project study area and goals, policies, or objectives that are applicable to
this project. Other relevant plans discussed in this section include the SCAG Regional
Comprehensive Plan, SCAG Regional Transportation Plan (RTP)/Sustainable Communities
Strategy (SCS), and SCAG Compass Blueprint.
3.2.1 Affected Environment
SCAG 2008 Regional Comprehensive Plan
The SCAG Regional Comprehensive Plan (RCP), adopted in 2008, provides a vision for the
Southern California region that addresses future needs while recognizing the
interrelationship between economic prosperity, natural resource sustainability, and quality of
life. Through measured performance, the RCP serves as a voluntary action plan with short-
term guidance and strategic long-term initiatives. The RCP complements SCAG’s Compass
Blueprint and the RTP/SCS, which are also discussed in this document. The following goals
from the RCP are particularly relevant for implementation of the proposed project
Land Use and Housing Chapter: The Land Use and Housing Chapter goals that relate to
the proposed project include:
• Focusing growth in existing and emerging centers and along major transportation
corridors.
• Protecting important open space, environmentally sensitive areas (ESAs), and
agricultural lands from development.
Transportation Chapter: The Transportation Chapter goals that relate to the proposed
project include:
• A more efficient transportation system that reduces and better manages vehicle activity.
• A cleaner transportation system that minimizes air quality impacts and is energy
efficient.

Community Impact Report
84 West Valley Connector Project
SCAG 2016-2040 Regional Transportation Plan/Sustainable Communities
Strategy
The 2016 RTP contains goals and policies that are pertinent to the proposed project, and
the SCS is incorporated into the RTP, per Senate Bill (SB) 375. The SCS will demonstrate
how the region will meet its greenhouse gas (GHG) reduction targets. The RTP/SCS’s vision
is for a thoughtfully planned, maturing region in which people benefit from increased
mobility, more active lifestyles, increased economic opportunity, and an overall higher
quality of life.
The 2016 RTP/SCS maintains a significant investment in public transportation across all
transit modes and also calls for new household and employment growth to be targeted in
areas that are well served by public transportation to maximize the improvements. These
include extensive local bus, rapid bus, BRT, and express service improvements. An
expanded point-to-point express bus network would take advantage of the region’s carpool
and Express Lane network. New BRT service, limited stop service, and increased local bus
service along key corridors, in coordination with transit-oriented development (TOD) and
land use, would encourage greater use of transit for short local trips. The West Valley
Connector Project is included among selected transit capital projects in the RTP.
Among the relevant goals of the RTP/SCS are the following:
• Maximize mobility and accessibility for all people and goods in the region
• Ensure travel safety and reliability for all people and goods in the region.
• Preserve and ensure a sustainable regional transportation system.
• Maximize the productivity of our transportation system.
• Protect the environment and health of our residents by improving air quality and
encouraging active transportation (e.g., bicycling and walking).
• Actively encourage and create incentives for energy efficiency, where possible.
• Encourage land use and growth patterns that facilitate transit and active transportation.
SCAG Sustainability Planning Grant
The fundamental goal of the SCAG Sustainability Planning Grant (formerly known as the
Compass Blueprint) effort is to help the SCAG region build long-lasting partnerships and
foster innovative transportation and land use planning. The Sustainability Planning Grant
Program combines Compass Blueprint assistance for integrated land use and transportation
planning with new Green Region initiative assistance aimed at local sustainability and Active
Transportation assistance for bicycle and pedestrian planning efforts. The program will focus
on voluntary efforts that meet local needs and contribute to implementing the SCS, reduce
GHG emissions, and provide the range of local and regional benefits outlined in the SCS.

Community Impact Report
West Valley Connector Project 85
The following objectives are proposed to provide a framework for local and regional decision
making that improves the quality of life for all SCAG residents. Each objective is followed by
a specific set of strategies and is directly relevant to the proposed project:
• Increase the region’s mobility:
− Encourage transportation investments and land use decisions that are mutually
supportive.
− Encourage TOD.
− Promote a variety of travel choices.
• Enable prosperity:
− Ensure environmental justice regardless of race, ethnicity, or income class.
• Promote sustainability for future generations:
− Develop strategies to accommodate growth that use resources efficiently and
minimize pollution and GHG emissions.
− Preserve rural, agricultural, recreational, and ESAs.
Los Angeles County General Plan
Los Angeles County is bordered to the east by Orange County and San Bernardino County,
to the north by Kern County, and to the west by Ventura County. The county also includes
two offshore islands: Santa Catalina Island and San Clemente Island. The unincorporated
areas of the county account for approximately 65 percent of the total land area of the county
(approximately 2,650 square miles), while the total land area is 4,083 square miles. It
includes the City of Pomona within the proposed project area.
The major policies of the General Plan include expanding Transit-Oriented Districts,
promoting mixed use, expanding Significant Ecological Areas (SEA), creating Employment
Protection Districts (EPDs), and protecting Agricultural Resource Areas (ARAs). The
following General Plan goals are directly relevant to the proposed project.
Goal M 1. Street designs that incorporate the needs of all users.
Goal M 2. Interconnected and safe bicycle- and pedestrian-friendly streets, sidewalks,
paths, and trails that promote active transportation and transit use.
Goal M4. An efficient multimodal transportation system that serves the needs of all
residents.
Goal M5. Land use planning and transportation management that facilitates the use of
transit.

Community Impact Report
86 West Valley Connector Project
Goal C/NR 1. Open space areas that meet the diverse needs of Los Angeles County.
Goal P/R 3. Acquisition and development of additional parkland.
San Bernardino County General Plan (Adopted 2007, Amended 2013)
San Bernardino County is bordered by Los Angeles County, Orange County, and Kern
County on the west; the Colorado River and the states of Arizona and Nevada on the east;
Riverside County on the south; and Inyo County and the southwest corner of Clark County,
Nevada, on the north. The County of San Bernardino includes the following cities located
within the proposed project area: Montclair, Ontario, Rancho Cucamonga, and Fontana.
San Bernardino County, with a land area of 20,106 square miles, is the largest county in the
continental United States. Federal and state agencies own and control most of the county
lands, and only 15 percent of the total land area in San Bernardino County is regulated by
the County Board of Supervisors.
The County identifies itself as a crossroads of global, multimodal transportation, and
commerce, with an abundance of affordable land use and skilled workforce. It also
recognizes its rural and urban amenities.
The following General Plan goals are directly relevant to the proposed project:
Goal CI 1. The County will provide a transportation system, including public transit, which is
safe, functional, and convenient; meets the public’s needs; and enhances the lifestyles of
county residents.
Goal CI 2. The County’s comprehensive transportation system will operate at regional,
countywide, community, and neighborhood scales to provide connectors between
communities and mobility between jobs, residences, and recreational opportunities
Goal CI 3. The County will have a balance between different types of transportation modes,
reducing dependency on the automobile and promoting public transit and alternate modes of
transportation, in order to minimize the adverse impacts of automobile use on the
environment.
Goal CI 4. The County will coordinate land use and transportation planning to ensure
adequate transportation facilities to support planned land use and ease congestion.
Goal CI 5. The County’s road standards for major thoroughfares will complement the
surrounding environment appropriate to each geographic region.
Goal CI 6. The County will encourage and promote greater use of nonmotorized means of
personal transportation. The County will maintain and expand a system of trails for bicycles,

Community Impact Report
West Valley Connector Project 87
pedestrians, and equestrians that will preserve and enhance the quality of life for residents
and visitors.
Goal CI 10. Ensure timely development and the maintenance of adequate service levels for
these facilities to meet the needs of current and future County residents.
Goal CI 13. The County will minimize impacts to stormwater quality in a manner that
contributes to improvement of water quality and enhances environmental quality.
Goal V/CI 1. Ensure a safe and effective transportation system that provides adequate
traffic movement.
City of Pomona
City of Pomona General Plan (Update 2014)
Pomona is surrounded by the cities of Claremont, La Verne, San Dimas, Walnut, Diamond
Bar, Chino, and Montclair. The area contained within the City of Pomona boundaries
comprises 22.84 square miles. Pomona has excellent access, positioned at the confluence
of I-10, State Route (SR)-57, SR-71, and SR-60, as well as two UPRR/Metrolink rail lines.
The City of Pomona General Plan’s guiding themes include maintaining its diverse land
uses, embracing development changes, economic prosperity by way of varied development
patterns, maintaining neighborhood character and cohesion, protecting cultural resources
and open spaces, and public safety.
The General Plan identifies Strategic Action Areas, place types, and high-density uses
adjacent to the proposed project. Figure 3-3 illustrates the General Plan Strategic Action
Areas. The project is adjacent to the following strategic action areas and approaches:
• Downtown Planning Approach: Promote the restructuring of new development into
higher intensity, transit-oriented districts with a mix of uses in a pedestrian-oriented
environment with a wide variety of pedestrian amenities, connected streets, and public
spaces.
• Transit-Oriented District Planning Approach: Promote the restructuring of new
development into higher intensity, higher activity, transit-oriented districts with a mix of
uses in a pedestrian-oriented environment with a wide variety of pedestrian amenities,
connected streets, and public spaces.
• Activity Centers Planning Approach: Retain existing neighborhood centers and
Downtown retail core and support their intensification and mix; encourage the eventual
transition of properties to greater land use efficiency and mixture of complementary
uses; restructure areas in strategic locations to accommodate new or renovated regional
retail centers.

Community Impact Report
88 West Valley Connector Project
• Corridors Planning Approach: Encourage the gradual transition to more pedestrian/
transit-oriented and distinctive building types and site treatments, as well as increasingly
efficient land use.
• Mixed-Use Neighborhoods/Cluster Planning Approach: Encourage the gradual transition
to more pedestrian-oriented and distinctive building types and site treatments that are
increasingly efficient in land use and are compatible with existing adjacent low-density
residential development.
Figure 3-3: City of Pomona Strategic Action Areas
A vital component of the City’s future development pattern intends to support transit stations
and transit corridors around higher intensity nodes with a rich mix of uses. The future vision
for transit corridors, train stations, and transit nodes are defined below and illustrated in
Figure 3-4.
• Holt Avenue: Classified as a Primary Local Transit Corridor.
• Garey Avenue: Classified as a Primary Local Transit Corridor.
• Transit Nodes:

Community Impact Report
West Valley Connector Project 89
− Downtown: The Downtown Pomona Train Station and Transit Center, the western
terminus of the proposed West Valley Connector corridor route. It is a major hub of
transit activity in the city with new residential and workplace development broadening
and expanding activity, reinforcing the need for connectivity, through transit, between
regional transit services in Los Angeles, the San Gabriel Valley, and San
Bernardino/Riverside counties.
− Transit-Oriented Districts: The General Plan envisions districts located at rail stations
to be the most intense and active, followed by smaller nodes located at major
intersections with potential for BRT or equivalent higher capacity bus service.
Figure 3-4: Pomona Envisioned Future Transit Network
The following General Plan goals are directly relevant to the proposed project:
Goal 6B.G2. Locate higher intensity TOD around existing and future Metrolink, Metro Gold
Line, high-speed rail, BRT, and other transit stations.
Goal 6B.G12. Create evenly spaced and well-distributed activity cluster destinations that
anchor the east and west ends of the Holt Avenue corridor and the SR-60/SR-71 to
strengthen the gateway function of these locations.
N

Community Impact Report
90 West Valley Connector Project
Goal 6B.G13. Locate the most intense development along Holt Avenue in clusters that can
take advantage of potential future BRT.
Goal 6B.G14. Continue transformation of the Indian Hill Pomona Unified School District
(PUSD) Center into an active mixed-use, walkable environment.
Goal 7D.G2. Strengthen Pomona’s position as an important regional center through quality
transportation planning.
Goal 7D.G3. Support regional efforts to the extent feasible, to reduce GHG emissions from
cars and light trucks.
Goal 7D.G6. Support the expansion of existing regional transit (bus and light rail) and
development of a statewide high-speed rail network.
Goal 7D.G7. Promote a multimodal transportation system that serves and is served by the
future city structure.
Goal 7D.G9. Expand the choices of available transportation modes to effectively increase
the freedom of movement for Pomona’s residents and reduce reliance on the automobile.
Goal 7D.G13. Promote transportation access and connectivity between neighborhoods,
Downtown, and activity centers.
Goal 7D.G16. Encourage the use of public transportation, especially for commute trips, and
increase citywide transit ridership.
Goal 7D.G18. Make transit centers and facilities more visible and accessible throughout the
community.
Goal 7E.G1. Achieve the City’s vision for Pomona Tomorrow without adverse environmental
impacts that compromise the ability of future generations to meet their needs.
Goal 7E.G10. Contribute to attainment of regional goals by improving ambient air quality
levels within Pomona.
Pomona Corridors Specific Plan (2013). The Pomona Corridors Specific Plan was
established to orchestrate private and public investment activities along the Garey Avenue,
Holt Avenue, Mission Boulevard, and Foothill Boulevard corridors, and to support and
promote the type of investment that will enhance the beauty and vitality of the City’s primary
commercial corridors. One of the specific goals of the plan is to develop the corridors and
connected street network into pedestrian, transit, and bicycle friendly “Complete Streets,”
linked with the City’s promenades, trails, parks, and future transit stations.

Community Impact Report
West Valley Connector Project 91
Downtown Specific Plan (Update 2013). The Downtown Pomona Specific Plan
contains a vision and a practical implementation program to create an appealing Downtown
Shopping, dining, entertainment, and educational district with community facilities serving
the City of Pomona and the region. The plan area consists of 380 acres bound by Holt
Avenue, Towne Avenue, Mission Boulevard, and White Avenue. The Transit Center district
area is well suited for future mixed-use development and features a distinct Spanish Revival
style.
City of Montclair
City of Montclair General Plan (1999)
The western boundary of Montclair is contiguous with the Los Angeles County line, which
also includes the cities of Pomona and Claremont. The City of Upland borders Montclair on
the north and east, while the City of Ontario borders Montclair on the east, and an
unincorporated portion of San Bernardino County forms the border on the south. The
Montclair planning area consists of approximately 6.48 square miles.
Holt Boulevard is designated in the City of Montclair General Plan as a commercial corridor
and a major arterial. Almost 50 percent of Montclair is designated for low-density residential
(3.7 units per acre), very low-density residential (zero to 2 units per acre), and medium-
density residential (8 to 14 units per acre), with some senior housing and planned
development permitted at higher densities. Montclair Plaza and associated land uses
located north of Holt Boulevard along I-10 are designated as Regional Commercial, and
areas south of Holt Boulevard lining the UPRR/Southern Pacific railroad ROW are
designated industrial.
The following General Plan goals are directly relevant to the proposed project:
Goal LU-1.1.4. Participate in and support regional activities of SCAG, SBCTA, City/County
Planning Commissioners Conference, and other such agencies.
CE-1.1.0. To promote a circulation and transportation system, including freeways, all
classes of streets, accommodations for public mass transportation and pedestrian
walkways, and bicycle routes that will serve traffic needs efficiently and safely, and be
attractive in appearance.
CE-1.1.10. Promote the provision of public modes of transportation between strategic
locations such as the Montclair Plaza Shopping Center, and other traffic generators, such as
the Montclair Transcenter and potential Metrolink station on the Riverside Line.
Goal AQ-2.0.0. To achieve a diverse and efficient ground transportation system which
generates the minimum feasible pollutants.
Community Impact Report
92 West Valley Connector Project
Holt Boulevard Specific Plan (1991). The Holt Boulevard Plan planning area extends
approximately 2.2 miles along Holt Boulevard from Mills Avenue on the west to Benson
Avenue on the east. Improvements to the boulevard’s physical appearance aim to bring
commercial, retail, and auto-related uses back to this area of Montclair.
City of Ontario
City of Ontario General Plan (2007)
Ontario is comprised of approximately 50 square miles. It is bordered by unincorporated San
Bernardino County, cities of Montclair, Upland, Rancho Cucamonga, and Fontana to the
north; and City of Chino and Riverside County to the south. I-10, I-15, and SR-60 run
through the city limits.
Updated in 2010, the vision of the Ontario General Plan, or the Ontario Policy Plan, includes
goals and policies to create and maintain distinct neighborhoods and activity centers;
encourage diverse residential uses; a mix of employment, retail, entertainment, community,
and recreational services; and world-class airport, which are connected through a unified
mobility system.
Most of the West Valley Connector corridor is designated in the Land Use Plan for Mixed
Use, General Commercial, Hospitality, and Business Park. The proposed project would pass
through eight separate mixed-use designations. Densities range from 14 to 125 dwelling
units per acre, and intensities range from 1.0 to 3.0 floor area ratio (FAR) in mixed-use
corridors.
A BRT corridor is shown in the General Plan along Holt Boulevard, from Benson Avenue to
Vineyard Avenue, to the future Multimodal Transit Center, which would serve Metro Gold
Line, high-speed rail, Metrolink, and bus services. The BRT then turns north on Archibald
Avenue, from Guasti Road to Inland Empire Boulevard, and west on Fourth Street, from
Milliken Avenue to Etiwanda Avenue. North-south BRT corridors are shown crossing the
West Valley Connector corridor on Euclid Avenue and Haven Avenue. A future downtown
Metrolink Station is shown on Euclid Avenue just south of Holt Boulevard. Existing bus
transfer centers are on Holt Boulevard/Euclid Avenue and Inland Empire Boulevard/Milliken
Avenue.
Figure 3-5 shows Ontario’s transit plan.
The following General Plan goals and/or policies are directly relevant to the proposed
project:
Goal M3. A public transit system that is a viable alternative to automobile travel and meets
basic needs of the transit dependent.

Community Impact Report
West Valley Connector Project 93
Goal M3-4. BRT Corridors. We work with regional transit agencies to implement BRT
service to target destinations and along corridors.
Goal M5. A proactive leadership role to help identify and facilitate implementation of
strategies that address regional transportation challenges.
Goal CE1-12. Circulation. We continuously plan and improve public transit and
nonvehicular circulation for the mobility of all, including those with limited or no access to
private automobiles.
Figure 3-5: Ontario Transit Plan
Goal CD1-4. Transportation Corridors. We will enhance our major transportation corridors
within the city through landscape, hardscape, signage, and lighting.
Goal CD3. Vibrant urban environments that are organized around intense buildings,
pedestrian and transit areas, public plazas, and linkages between and within developments
that are conveniently located, visually appealing and safe during all hours.
Goal CD3-7. Transit Stops. We require transit stops be well lit, safe, appealing to, and
accessible by pedestrians.

Community Impact Report
94 West Valley Connector Project
Meredith International Centre Specific Plan (Adopted 1981, Updated 2008). The
Meredith International Centre Specific Plan is a major mixed-use development on
approximately 250 acres. A key amenity to the project is the Cucamonga/Guasti Regional
Park, which occupies the northeast corner of the site. It is bound by I-10 to the south,
Archibald Avenue to the east, Fourth Street to the north, and Vineyard Avenue to the west in
the City of Ontario. The land uses proposed for the plan are primarily office, hotel, and retail/
commercial with some residential uses.
Ontario Festival Specific Plan (Adopted 2012). The Ontario Festival Specific Plan is
a comprehensive plan for the development of a planned residential site that could
accommodate up to 472 dwelling units on approximately 37.6 acres. This project would be
located along Inland Empire Boulevard between Archibald Avenue and Turner Avenue, just
below Guasti Regional Park.
Wagner Properties Specific Plan (Adopted 1982, Amended 2012). The Wagner
Properties Specific Plan contains approximately 54 acres. The plan is to guide creation of a
commercial center with commercial and residential uses. It is bound by I-10 to the south,
Turner Avenue to the west, Fourth Street to the north, and Haven Avenue to the east in
Ontario. A looped circulation network encouraging public transit opportunities will be
included with the individual site plan.
Ontario Center Specific Plan (Amended 2006). The Ontario Center Specific Plan
consists of a mix of uses, including commercial, residential, and open space, covering 549
acres. It is bound by I-10 to the south, Turner Avenue to the west, Fourth Street to the north,
and Milliken Avenue to the east in Ontario. The plan represents an integrated, balanced
urban form with the inclusion of a looped circulation network encouraging public transit
opportunities, as well as pedestrian walkways and bicycle routes.
Ontario Mills Specific Plan (Adopted 1996). The Ontario Mills Specific Plan consists
primarily of commercial and office land uses and encompasses approximately 251 acres. It
is generally bound by Fourth Street to the north, Milliken Avenue to the west, I-15 to the
east, and I-10 to the south in Ontario. The site is located at the interchange of two freeways,
frontage on major arterials, and within close proximity of the Ontario International Airport.
The plan specifies that all parcel maps and site plans proposed in the area will be submitted
to SBCTA for review. Bus turnouts and shelter facilities will be provided as required by
SBCTA.
Guasti Plaza Specific Plan (Adopted 1996, Updated 2011). The Guasti Plaza
Specific Plan area has a long history as an Italian agricultural/agrarian, working
environment. It is bound by I-10 to the north, Turner Avenue to the east, Old Guasti Road to
the south, and Archibald Avenue to the west in Ontario. It is approved for the exclusive

Community Impact Report
West Valley Connector Project 95
development of light industrial uses. The plan includes the provision of bus turnouts and bus
shelters on the south sides of Guasti Road.
Holt Boulevard Mobility and Streetscape Strategic Plan (2013). This strategic plan
for Ontario applies to a 5-mile stretch of Holt Boulevard from the west city limits at Benson
Avenue to the connector ramps of I-10. The Ontario Plan classifies Holt Boulevard as a six-
lane arterial, with a proposed ROW of 120 feet. The plan accommodates alternative modes
of transportation, including potential BRT concepts.
Transpark Specific Plan (Adopted 1981, Updated 2008). This specific plan, located
in the southeastern corner of G Street and Turner Avenue in Ontario, plans for a 35-acre
business park that is nearly built out with a mixture of low-rise office buildings, light
industrial, and distribution uses.
The Exchange Specific Plan (Adopted 2003, Amended 2007). This approximately
23.60-acre commercial development is planned as a destination location for customers and
visitors traversing Ontario along I-15 or traveling on 4th Street and Inland Empire Boulevard.
Crossroads Business Park (Adopted 1990, Amended 2009). This specific plan
encompasses 305.3 acres of planned light industrial uses in the northeastern portion of
Ontario and is generally bounded by Ontario Mills Parkway and I-10 to the south; Day Creek
Channel to the west; Etiwanda Avenue to the east; and Fourth Street to the north.
City of Rancho Cucamonga
City of Rancho Cucamonga General Plan (2010).
Rancho Cucamonga is located at the base of the San Gabriel Mountains in western San
Bernardino County and is bound by the cities of Upland, Ontario, Fontana, the San
Bernardino National Forest, and parts of unincorporated areas of San Bernardino County.
Major transportation facilities in and near the city include SR-210, I-15, I-10, Foothill
Boulevard, and the Ontario International Airport.
Rancho Cucamonga’s General Plan emphasizes protection of existing residential
neighborhoods and targets new residential, office, and commercial growth along major
corridors. Rancho Cucamonga celebrates its storied heritage while fostering a spirit of
innovation and enterprise, reflected by the City’s commercial, industrial, and service
providers. A variety of neighborhood and community centers meet local and regional needs.
The General Plan guides the City’s vision of tomorrow and defines the steps necessary to
maintain the high quality of life on a sustainable level into the future.
The General Plan recommends relocating the Metrolink Station to Haven Avenue to provide
more convenient access to employment centers and to allow coordination with bus transit,
including a possible BRT route along Haven Avenue. The timing and certainty of this

Community Impact Report
96 West Valley Connector Project
relocation are unknown. The plan also recognizes the need to increase bicycle, trail, and
pedestrian use and recommends policies to expand those networks. Three major transit
corridors – an east-west transit spine along Foothill Boulevard, an east-west spine along 4th
Street between Milliken Avenue and Etiwanda Avenue at the southern boundary of the city,
and a north-south transit spine along Haven Avenue – are designated as bus rapid transit
lines in the General Plan. BRT could operate along these corridors. Milliken Avenue and 4th
Street, west of Milliken Avenue, are designated as Secondary Transit Corridors. The City’s
transit plan is shown in Figure 3-6.
Figure 3-6: Rancho Cucamonga Transit Plan

Community Impact Report
West Valley Connector Project 97
The following General Plan goals are directly relevant to the proposed project:
Goal LU-4: Establish a pedestrian-friendly Foothill Boulevard corridor that facilitates transit
use and provides a range of commercial destinations to serve both local and regional needs.
Goal LU-12: Foster a variety of travel routes that are enjoyable ways to experience Rancho
Cucamonga.
Goal CM-1: Provide an integrated and balanced multimodal transportation network of
Complete Streets to meet the needs of all users and transportation modes.
Goal CM-2: Plan, implement, and operate transportation facilities to support healthy and
sustainable community objectives.
Goal CM-3: Provide a transportation system that includes connected transit, bicycle, and
pedestrian networks.
Goal CM-5: Require that new development mitigate transportation impacts and contribute to
the improvement of the City’s transportation system.
Goal PS-4: Provide a high level of public safety services throughout Rancho Cucamonga.
Goal PS-11: Reduce the volume of pollutants generated by motorized vehicles.
Rancho Cucamonga City Development Code (Amended 1999). The Development
Code describes and guides the zoning districts in Rancho Cucamonga and establishes the
development requirements, standards, guidelines, and policies for the city.
Rancho Cucamonga Foothill Boulevard BRT Corridor Study (2013). This SCAG
study prepared for the City of Rancho Cucamonga provides recommendations on regulatory
documents and design concepts to promote multimodal travel, including transit, along the
entire length of Foothill Boulevard from Grove Avenue on the west to East Avenue on the
east. The BRT study emphasized the distinction between the mobility of Historic Route 66,
where “personal, individual mobility was king and considered an outward sign of freedom
and individuality,” and the perspective of today’s mobility needs and wants. Alternative
modes of mobility go hand in hand with alternative modes of experiencing the public realm
within a unique and intimate corridor. The study closely coincides with the Omnitrans
System-Wide Transit Corridor Plan but varies with the extension of BRT service to Victoria
Gardens and turns the route back south along Etiwanda Avenue to Foothill Boulevard.
Industrial Area Specific Plan (Amended 2016). This 5,000-acre area is bound on the
north by Foothill Boulevard, on the south by San Bernardino Avenue, on the west by Baker
Avenue, and on the east by East Avenue. The plan guides the development of the City of
Rancho Cucamonga’s industrial base. It is divided into three zones and 19 subareas. The

Community Impact Report
98 West Valley Connector Project
subareas represent specific land use characteristics and development constraints that are
handled on a subarea basis rather than through the application of broadly applied
development standards. The purpose of the specific plan is to establish specific standards
and guidelines that will be used for development throughout the City’s industrial area.
Industrial Area Specific Plan Sub-Area 18 Plan (Empire Lakes Specific Plan)
(2016). This Specific Plan would develop the privately-owned 160-acre Empire Lakes Golf
Course that is bound on the south by 4th Street, on the east by Milliken Avenue, on the
north by 8th Street and the railroad, and on the west by Cleveland Avenue. This area would
be developed to include a combination of residential, commercial, recreational, and office
uses in an urban setting near transit services, including the Rancho Cucamonga Metrolink
Station, and local regional activity centers. The intent of this mixed-use, transit-oriented
development project is to reduce the reliance on automobiles and encourage walking,
bicycling, and the use of mass transit such as Metrolink.
Foothill Boulevard Specific Plan (Adopted 1987). This specific plan placed
importance on Foothill Boulevard’s function as a commercial corridor. It implements a
blueprint for future development along Foothill Boulevard with the added intention of
enhancing the historical significance of Route 66 (Foothill Boulevard). The plan identified
Foothill Boulevard as an essential element of the regional roadway system and placed a
traffic volume burden on Foothill Boulevard, directly affecting its mixed-use development
potential. In 1999, the Rancho Cucamonga Development Code was amended to incorporate
the Foothill Boulevard Specific Plan, which is no longer a stand-alone document.
Foothill Boulevard Visual Improvement Plan (VIP) (Adopted 2002). The purpose
of the Foothill Boulevard/Historic Route 66 VIP is to develop a design specification plan that
would set forth design concepts for the streetscape improvements within the public ROW
and entry areas along the entire length of Route 66 in Rancho Cucamonga.
Terra Vista Community Plan (Amended 1995). The Terra Vista Community Plan is
centrally located in Rancho Cucamonga and encompasses 1,321 acres. It is comprised of
four distinct neighborhoods, with a greenway serving as the backbone connector. The area
is planned for a mix of residential and commercial uses, with a large concentration of
commercial and office uses along Foothill Boulevard and Haven Avenue that serves as a
community-wide activity center. The plan includes a suggested internal transit route within
Terra Vista that connects the key travel destinations and activity centers within the project.
These internal transit routes will conveniently connect to external regional and citywide bus
routes and stops at major intersections around and through Terra Vista.
Victoria Community Plan (Adopted 1981). The Victoria Community Plan is generally
bound by Etiwanda Avenue to the east, I-15 and Foothill Boulevard to the south, Deer Creek
and Day Creek Channel to the west, and SR-210 to the north. The plan area encompasses

Community Impact Report
West Valley Connector Project 99
2,150 acres and provides a series of residential villages and a vibrant mixed-use urban
center, designed around a central spine called Victoria Park Lane. The Victoria Community
Plan includes the Victoria Arbors Master Plan and the Victoria Gardens Master Plan. Foothill
Boulevard is designated for Regional Bus Circulations with connections serving the local
community at Foothill Boulevard and Day Creek Boulevard.
Victoria Arbors & Victoria Gardens Master Plans (January 2002). Victoria
Gardens is the mixed-use center of the Victoria Arbors community, which is defined as Area
4 (Victoria Lakes Village) of the Victoria Community Plan. Victoria Gardens Master Plan
introduces a diverse mixture of uses that includes retail, office, hotel, residential, civic, and
cultural activities surrounding the heart of Victoria Gardens, the successful regional retail
environment of its shopping center. The result of the master plan is a vibrant downtown
atmosphere with a traditional Main Street framework.
City of Fontana
City of Fontana General Plan (2003)
Fontana is positioned as a gateway into southern California’s economy and the Inland
Empire from I-15. I-10, SR-66, and SR-210 also run through the city.
Fontana can play an important role in linking to the critical goods movement system known
as the Alameda Corridor East due to the City’s level of rail service. With a large amount of
undeveloped land and its incorporated boundaries and sphere of influence, Fontana has
many opportunities for developing its economy.
The Recommended Circulation Master Plan, illustrated in Figure 3-7 includes the following:
• Foothill Boulevard and Sierra Avenue are both designated as major highways.
A regional network of multimodal transportation facilities, including an improved citywide
public transit system, is provided that ensures the safe and efficient movement of
vehicles, people, and goods throughout the City of Fontana and to and from the region,
and provides mobility to all city residents and helps reduce vehicular trips citywide.
− Provide appropriate transportation terminal facilities for inter-city and regional travel
by public and private transportation modes.
− Continue to support the regional bus system to provide intra-city service, inter-city
service to major employment centers, and connection to other regional transportation
transfer points.
− To encourage transit ridership and transportation demand management including
carpooling, required vanpool parking spaces, plan for the provision of additional
transportation centers to be used as a park-and-ride for ridesharing, high-occupancy
vehicle lanes, regional bus and passenger rail services.

Community Impact Report
100 West Valley Connector Project
Figure 3-7: Recommended Circulation Master Plan

Community Impact Report
West Valley Connector Project 101
− Recognize alternative and private transportation services (vans, buses, shuttles,
taxis and limousines) as an integral part of public transportation.
− Where needed and appropriate, require new development to provide transit facilities
and accommodations, such as bus shelters and turn-outs, consistent with regional
agency plans and existing and anticipated demands.
− Encourage commuters and employers to reduce vehicular trips by offering incentives
such as reduced-price transit passes and preferential parking for ridesharing.
The following General Plan goals are directly relevant to the proposed project:
Land Use Goal #3: Our community is developing in a unified, orderly, logical,
environmentally sound manner, which ensures that the city is unified and accessible to all
residents, and results in economically sound commercial areas, vibrant neighborhoods, and
jobs rich centers.
Land Use Goal #5: Our downtown is a vibrant, pedestrian-friendly, economically healthy,
safe, convenient and accessible district that serves as the true heart and focal point of the
community.
Circulation Goal #1. A balanced transportation system for Fontana is provided that meets
the mobility needs of current and future residents and ensures the safe and efficient
movement of vehicles, people, and goods throughout the city.
Circulation Goal #2. A regional network of multimodal transportation facilities, including an
improved citywide transportation system, is provided that ensures the safe and efficient
movement of vehicles, people, and goods throughout the City of Fontana and to and from
the region, and provides mobility to all city residents and helps reduce vehicular trips
citywide.
Circulation Goal #3. A circulation system is provided that reduces conflicts between
commercial trucking, private/public transportation, and land uses.
Community Design Goal #4. We have a vibrant, identifiable downtown that serves the
diverse needs of its residents and readily attracts visitors.
Air Quality Goal #2. Our city has a diverse and efficiently operated ground transportation
system that generates the minimum feasible pollutants.
City of Fontana General Plan (2018)
Since the Notice of Preparation (NOP) for the WVC Project was circulated, the City of
Fontana adopted a new General Plan in November 2018. The following General Plan vision,
principle, and goals are directly relevant to the proposed WVC project:

Community Impact Report
102 West Valley Connector Project
General Plan Vision for the Future
• Fontana is the Inland Empire’s opportunity city.
• Fontana welcomes everyone and offers a high quality of life.
• Fontana embraces lifelong learning.
• Our diversified economy has good jobs for Fontana residents, so they can work where
they live.
• Our system of parks and natural open spaces, community centers, and recreational
opportunities is second to none in the Inland Empire.
• Our revitalized downtown is a neighborhood; an arts, culture, and entertainment center;
and a walkable district of shopping and services.
• We take advantage of more transportation choices.
• We have become one of the healthiest and most sustainable cities in San Bernardino
County.
• Fontana 5.0 is a complete and flourishing community of opportunity.
General Plan Principle:
• Connect people and places by providing safe and efficient transportation choices,
including pedestrian, bicycle, and transit opportunities, along with well-maintained
streets, to connect people to city destinations.
Community Mobility and Circulation Goal:
• Local transit within the City of Fontana is a viable choice for residents, easily accessible,
and serving destinations throughout the City.
Downtown Area Plan
• Goal 1 – Foothill Blvd Gateway
• Goal 2 – South Sierra Ave Gateway
West End Specific Plan (Update 2003). The West End Specific Plan contains
approximately 1,296 acres in Fontana and is bound on the west by East Avenue, on the
north by the Southern Pacific Rail ROW above Baseline Avenue, on the east by Cherry
Avenue, and on the south by Foothill Boulevard. The plan is for a mixed-use community,
including a business park, commercial/office areas, industrial, and 3,549 residential dwelling
units. Land uses and intensities are logically placed near basic public facilities and services
in such a relationship to their user groups as to promote maximum opportunity for transit
usage.
Northgate Specific Plan (1984). The Northgate Specific Plan is an 87-acre mixed-use
specific plan bounded by Miller Avenue on the north, Oleander Avenue on the east, Foothill

Community Impact Report
West Valley Connector Project 103
Boulevard on the south, and Citrus Avenue on the west. The plan is an internally oriented
mixed-use community that includes residential, commercial, and open space uses.
Southwest Industrial Park (SWIP) Specific Plan (1984). The project area is located
in the southwest portion of Fontana between I-10 and the San Bernardino/Riverside county
lines. The Specific Plan is generally bounded by Jurupa Avenue on the south, Etiwanda
Avenue on the west, the County line on the north, and Citrus Avenue on the east.
3.2.2 Environmental Consequences
This section evaluates the consistency of the No Build Alternative and build alternatives with
the adopted goals, policies, or objectives of relevant local and regional planning documents
described above.
SCAG. The SCAG RTP primarily spotlights the need to maximize the productivity of the
transportation system through increasing the region’s mobility in a manner that is
sustainable for future generations. The project would be consistent with the SCAG regional
goals because it would enhance transit access by providing a premium service that
connects users to key regional transportation connectors, while reducing auto trips, vehicle
miles traveled, and air emissions, thereby improving air quality, reducing GHG emissions,
and promoting energy efficiency. In addition, growth would be managed because the project
would support TOD and mixed land use development around station areas. Consistency
with SCAG plans and polices are identified in Table 3-4.
Table 3-4: Consistency of West Valley Connector Project with Southern California Association of Governments Regional Comprehensive Plan and Regional
Transportation Plan/Sustainable Communities Strategy
Goal/Policy
Project Consistent with Plan, Goal, Objective, or
Policy Consistency Analysis
No Build Alternative
Build Alternatives
SCAG 2008 RCP
Land Use and Housing Chapter: Focusing growth in existing and emerging centers and along major transportation corridors.
Consistent Consistent The build alternatives would improve transit service and support land use and transportation integration policies in existing and local plans. The No Build Alternative would not induce growth because there would be no construction.
Land Use and Housing Chapter: Protecting important open space, ESAs, and agricultural lands from development.
Consistent Consistent The build alternatives would avoid open space impacts. No open space, ESAs, or agricultural lands would be affected as a result of the No Build Alternative.

Community Impact Report
104 West Valley Connector Project
Table 3-4: Consistency of West Valley Connector Project with Southern California Association of Governments Regional Comprehensive Plan and Regional
Transportation Plan/Sustainable Communities Strategy
Goal/Policy
Project Consistent with Plan, Goal, Objective, or
Policy Consistency Analysis
No Build Alternative
Build Alternatives
Transportation Chapter: A more efficient transportation system that reduces and better manages vehicle activity.
Inconsistent Consistent Transit use would increase with the build alternatives, which would result in a reduction of auto trips and VMT, and create opportunities for residents to have alternative means of transportation. Under the No Build Alternative, traffic conditions would continue to worsen without implementation of the proposed project.
Transportation Chapter: A cleaner transportation system that minimizes air quality impacts and is energy efficient.
Inconsistent Consistent Transit use would increase with the build alternatives, which would result in a reduction of auto trips, VMT, and air emissions, thereby improving air quality and promoting energy efficiency. Under the No Build Alternative, traffic conditions would continue to worsen, resulting in continued degradation of air quality and decreasing energy efficiency.
SCAG 2016-2040 RTP/SCS
Goal: Maximize mobility and accessibility for all people and goods in the region.
Inconsistent Consistent The build alternatives would help improve mobility of residents by providing access to key activity centers along the corridor. Implementation of the project would also provide opportunities for intermodal transfers to Metrolink stations and the Pomona Transit Center to connect with various cities within the region. Under the No Build Alternative, traffic conditions would continue to worsen without implementation of the proposed project.

Community Impact Report
West Valley Connector Project 105
Table 3-4: Consistency of West Valley Connector Project with Southern California Association of Governments Regional Comprehensive Plan and Regional
Transportation Plan/Sustainable Communities Strategy
Goal/Policy
Project Consistent with Plan, Goal, Objective, or
Policy Consistency Analysis
No Build Alternative
Build Alternatives
Goal: Ensure travel safety and reliability for all people and goods in the region.
Inconsistent Consistent The build alternatives would ensure safety and reliability (on-time performance). The 35-mile-long project alignment would provide a fast and reliable service with TSP and exclusive lanes to traverse portions of the project corridor. Under the No Build Alternative, traffic conditions would continue to worsen without implementation of the proposed project, thereby worsening safety and trip reliability.
Goal: Preserve and ensure a sustainable regional transportation system.
Inconsistent Consistent The build alternatives would serve as a sustainable transportation system in the project corridor cities by reducing travel time, easing congestion, and decreasing automobile reliance. Stations located in the 3.5-mile-long dedicated bus corridor under Alternative B would include a considerable amount of landscaping. Station components would include the use of local and recycled/recyclable materials, and finishes with low volatile organic compound (VOC) emissions. Under the No Build Alternative, existing transit services would continue to degrade as road conditions worsen.
Goal: Maximize the productivity of our transportation system.
Inconsistent Consistent With implementation of the build alternatives, improving average bus speeds and limiting the number of stops would create a stronger sense of reliability, leading to more efficient operations and would allow Omnitrans to serve more passengers at a lower cost per passenger. Under the No Build Alternative, traffic conditions would continue to worsen without implementation of the proposed project.

Community Impact Report
106 West Valley Connector Project
Table 3-4: Consistency of West Valley Connector Project with Southern California Association of Governments Regional Comprehensive Plan and Regional
Transportation Plan/Sustainable Communities Strategy
Goal/Policy
Project Consistent with Plan, Goal, Objective, or
Policy Consistency Analysis
No Build Alternative
Build Alternatives
Goal: Protect the environment and health of our residents by improving air quality and encouraging active transportation (i.e., nonmotorized transportation, such as bicycling and walking).
Inconsistent Consistent Transit use would increase with the build alternatives, which would result in a reduction of auto trips, VMT, and air emissions, thereby improving air quality and promoting energy efficiency. Under the No Build Alternative, traffic conditions would continue to worsen without implementation of the proposed project, thereby increasing air quality impacts and decreasing energy efficiency.
Goal: Actively encourage and create incentives for energy efficiency, where possible.
Inconsistent Consistent See above response.
Goal: Encourage land use and growth patterns that facilitate transit and nonmotorized transportation
Inconsistent Consistent The build alternatives would provide enhanced transit support, which would support TOD and mixed-use land development around station areas, though such future development is dependent on market conditions. No changes to transit or nonmotorized transportation would result from the No Build Alternative.
SCAG Sustainability Planning Grant
Increase the region’s mobility: Encourage transportation investments and land use decisions that are mutually supportive.
Inconsistent Consistent The build alternatives would improve transit service and support land use and transportation integration policies in existing and local plans. No changes to transit or nonmotorized transportation would result from the No Build Alternative.
Increase the region’s mobility: Encourage TOD.
Inconsistent Consistent The build alternatives would provide enhanced transit support, which would support TOD and mixed-use land development around station areas. No changes to transit or nonmotorized transportation would result from the No Build Alternative.

Community Impact Report
West Valley Connector Project 107
Table 3-4: Consistency of West Valley Connector Project with Southern California Association of Governments Regional Comprehensive Plan and Regional
Transportation Plan/Sustainable Communities Strategy
Goal/Policy
Project Consistent with Plan, Goal, Objective, or
Policy Consistency Analysis
No Build Alternative
Build Alternatives
Increase the region’s mobility: Promote a variety of travel choices.
Inconsistent Consistent The build alternatives would increase transit reliability, making it a viable alternative to automobile use, thus serving as another transportation alternative for users. No changes to transit or nonmotorized transportation would result from the No Build Alternative.
Enable Prosperity: Ensure environmental justice regardless of race, ethnicity, or income class.
Consistent Consistent Neither the build alternatives nor the No Build Alternative would result in an impact to any environmental justice populations.
Promote sustainability for future generations: Develop strategies to accommodate growth that uses resources efficiently and minimize pollution and GHG emissions.
Inconsistent Consistent The build alternatives would minimize GHG emissions by reducing VMT, auto trips, and air emissions. The No Build Alternative would not develop additional methods for accommodating growth or minimizing pollution or GHG emissions.
Promote sustainability for future generations: Preserve rural, agricultural, recreational, and ESAs.
Consistent Consistent The build alternatives would avoid open space impacts. No rural, agricultural, recreational, or ESAs would be affected as a result of the No Build Alternative.
City and County General Plans. The build alternatives are generally consistent with each
of the county and city general plans. These plans anticipate growth within the study area
and have adopted goals to provide more multimodal transportation accessibility for residents
to reduce automobile reliance and to reduce impacts associated with automobile reliance.
Some of the plans specifically refer to the establishment of BRT services along corridors
included in the build alternatives. Transit use would increase with implementation of the
project and strengthen efforts to improve the quality of life for area residents and
businesses, thus satisfying many goals of planning for a more multimodal transportation
system.
The project would provide inter-connectivity of residential uses with key activity centers and
uses along the project corridor. The project would provide intermodal transfers to various

Community Impact Report
108 West Valley Connector Project
Metrolink stops, the Pomona Transit Center, and Ontario International Airport. Transit stops
would be located at major existing activity centers or in areas with potential for transit-
supportive uses. The proposed project would improve air quality by reducing auto trips and
vehicle miles traveled, and create opportunities for residents to have an alternative means of
transportation. The vehicles, as well as stations, would be designed to be accessible to all
users. The build alternatives would construct new stations and enhance existing ones to be
lit, safe, and appealing through the provision of elements such as shelter, lighting fixtures,
and branding.
Many of the existing and local regional land use and transportation planning policies actively
promote transit-supportive policies, including TOD. The project could also serve as a
catalyst for revitalization and stimulate joint development and TOD in the future, particularly
near stations. In turn, new development could foster increased transit usage, although the
intensity of such developments is speculative at this time. Overall, the project would have a
beneficial impact by providing a new transportation mode and by encouraging residents to
live and work in or adjacent to the station areas in the future. As such, the build alternatives
are generally consistent with the goals of regional and local planning documents, particularly
with goals associated with improved transit services. Consistency with county and city
general plans is discussed in Table 3-5. (This table does not include a discussion of
consistency with the 2018 Fontana General Plan. Rather, a separate discussion is provided
below.)
Consistency with 2018 Fontana General Plan
The proposed WVC Project does not conflict with the Fontana General Plan Vision for the
Future, rather, the project would provide more transportation choices and make the City
more sustainable (by providing alternatives to single-occupant automobiles).
The WVC Project also supports the General Plan principle for “connect(ing) people and
places by providing safe and efficient transportation choices, including pedestrian, bicycle,
and transit opportunities, along with well-maintained streets, to connect people to city
destinations”.
In the 2018 Fontana General Plan, there are no goals and policies in the Community and
Neighborhoods, Housing, Conservation, Open Space, Parks and Trails, Public and
Community Services, Infrastructure and Green Systems, Noise and Safety, Sustainability
and Resilience, Economy, Education, and Workforce Development and Land Use, Zoning,
and Urban Design chapters that specifically relate to the WVC Project. Thus, the WVC
Project would not conflict with these chapters of the General Plan. Relevant goals, policies,
and actions in the 2018 Fontana General Plan include:

Community Impact Report
West Valley Connector Project 109
Building a Healthier Fontana
Policies
• Support transit efforts that reduce residents’ need for automobile-based travel.
• Strongly encourage efforts to improve the safety of all roadway users, especially
pedestrians and bicyclists.
Actions
G. Revise roadway standards to incorporate complete streets principles into all of the City’s
roadway classifications.
I. Enhance existing streets of all types by adding shade structures or shade trees to
improve the walking comfort of existing neighborhood streets.
K. Develop traffic-calming policies, such as clearly marked bike and pedestrian zones, bike
boulevards, bulb-outs, median islands, speed humps, traffic circles, speed tables, center
island narrowings, raised crosswalks, blinking crosswalks, chicanes, chokers, raised
intersections, realigned intersections, and textured pavements, among other effective
enhancements.
In accordance with these policies and actions, the WVC Project would improve transit
opportunities in Fontana with project features that would promote the safety of all roadway
users. The project would include shade structures and shade trees, dedicated bus stops,
and marked crosswalks. Thus, the WVC Project would not conflict with the Building a
Healthier Fontana chapter of the General Plan.
Community Mobility and Circulation
Policies
• Provide roadways that serve the needs of Fontana residents and commerce, and that
facilitate safe and convenient access to transit, bicycle facilities, and walkways.
• Make land use decisions that support walking, bicycling, and public transit use, in
alignment with the 2016–2040 RTP/SCS.
Actions
H. Encourage the provision of amenities such as seating, lighting, and signage (including
real-time arrival information) at bus stops, shuttle stops, and the Metrolink station to
increase rider comfort, safety, and convenience.
I. Collaborate with employers, the school districts, Omnitrans, and other agencies to
develop and expand programs to reduce dependence on single-passenger auto use and
develop shared shuttle services, or provide transit passes, or partner with Omnitrans to
provide service to employment areas with multimodal transit stations.

Community Impact Report
110 West Valley Connector Project
L. Make land use decisions that support walking, bicycling, and public transit use.
O. Explore the potential for multi-way boulevard segments along Livable Corridors.
• As revitalization and redevelopment occur along Sierra Avenue and Foothill Boulevard,
explore opportunities to provide bus pull-outs or side access lanes in private property,
keeping middle lanes for through traffic
Policies
• When constructing or modifying roadways, design the roadway space for use by all
users when feasible, including motor vehicles, buses, bicyclists, mobility devices, and
pedestrians, as appropriate for the context of the area.
Goal – Local transit within the City of Fontana is a viable choice for residents, easily
accessible and serving destinations throughout the City.
Policies
• Maximize the accessibility, safety, convenience, and appeal of transit service and transit
stops.
• Promote concentrated development patterns in coordination with transit planning to
maximize service efficiency and ridership.
Actions
A. Work with Omnitrans to improve service and expand service to underserved parts of
Fontana.
C. Support efforts to decrease wait times for local buses to a maximum of 15 minutes on
heavily traveled corridors.
D. Provide easy transit access to grocery stores, schools, health facilities, and other
necessary destinations and services by public transportation.
F. Work with Metrolink and Omnitrans to enhance pedestrian and bicycle accessibility to
stations and safety, comfort and convenience at transit stations and stops, as well as
train crossings.
H. Ensure that public transportation facilities are fully accessible to people with disabilities.
I. Implement consistent design standards for transit shelters, benches, lighting, bicycle
parking, and other improvements for transit stops that are aesthetically pleasing and
consistent with community character.
J. Enhance way-finding signage along walkways to direct pedestrians to transit stops.

Community Impact Report
West Valley Connector Project 111
K. Encourage the provision of amenities such as seating, lighting, and signage (including
real-time arrival information) and bicycle parking areas at bus stops, shuttle stops, and
the Metrolink station to increase rider comfort, safety, and convenience.
M. Create a Bus Stop Master Plan to include bus shelters and other amenities and
improvements for accessing and using bus stops.
Policies
• Provide a transportation network that is compatible with the needs of commerce and
those who live, work and shop in mixed-use areas.
• Encourage mixed-use and commercial developments that support walking, bicycling,
and public transit use while balancing the needs of motorized traffic to serve such
developments.
Actions
D. Optimize traffic flow through the use of coordinated and synchronized traffic signals.
The goals, policies, and actions of the Community Mobility and Circulation chapter support
the increased use of transit services in Fontana. The WVC would provide an alternative
transit system in Fontana to reduce automobile use. The WVC would be operated by
Omnitrans and would provide a maximum headway of 15 minutes on heavily traveled
corridors during peak hours. It would also provide seating, lighting, and signage, including
real-time arrival information, at proposed bus stops for safety, comfort, and convenience.
The WVC alignment would improve access to grocery stores, schools, health facilities, and
other necessary destinations. In addition, the WVC would support existing and future mixed-
use developments along Foothill Boulevard and Sierra Avenue. The creation of a multiway
boulevard segment on Sierra Avenue would support transit services on this roadway and
would accommodate enhanced bus stops along the outside lanes of Sierra Avenue. Thus,
the WVC would comply with the Community Mobility and Circulation chapter of the General
Plan.
Downtown Area Plan
Guiding Principles
• Connect people and places.
Policies
• Support regional transit initiatives that provide enhanced access to the Downtown Area.
• Ensure that transportation and utility infrastructure keeps pace with infill development so
that the neighborhood character and quality steadily improves over time.

Community Impact Report
112 West Valley Connector Project
• Ensure that future street improvements to Foothill and Arrow Boulevards and Sierra
Avenue improve the appearance and pedestrian environment while accommodating
traffic flows.
• Concentrate higher development intensities within 0.25 mile of planned transit stops,
with shared parking arrangements when feasible.
Placemaking Strategy – Gateway Corridors
The Foothill Boulevard and Sierra Avenue Corridors have the potential to act as "funnels"
bringing local and regional visitors to the Downtown.
• Goal 1 – Foothill Blvd Gateway
• Goal 2 – South Sierra Ave Gateway
Actions
Pedestrian and Bicycle Amenities: Prioritize bicycle parking, car-sharing and bike-sharing
services, sheltered bus stops, widened sidewalks, and mid-block pedestrian crossings in the
segments from Chaffey College to Downtown in support of increased student/pedestrian
activity.
Market "mode-shift" alternatives in support of Downtown: Identify strategies, branding, and
incentives that will influence "mode-shift" away from passenger vehicles and encourage
greater use of Metrolink, Omnitrans, local public transit, pedestrian, and bicycle routes to
bring new customers to Downtown.
Transit Stop Improvements: The City will work collaboratively with Omnitrans and property
owners adjacent to planned bus station locations to design safe, comfortable pedestrian
access and waiting areas surrounded by neighborhood-serving commercial uses that help
provide a secure 18-hour environment.
Consistent with the principles, goals, strategies, and actions in the Downtown Area Plan, the
WVC Project would “Connect people and places” by facilitating the travel of people to and
from the Downtown area of the City. The WVC Project would serve as a means of bringing
local and regional visitors to the Downtown through Foothill Boulevard and Sierra Avenue,
implementing the City’s Placemaking Strategy for Gateway Corridors.
While the Conceptual Illustrative Plan for Sierra Avenue within the Downtown Core and for
the Sierra Avenue Transformation shows four travel lanes, with a landscaped median, and
on-street (curbside) parking and planters on both sides, it does not preclude the use of
Sierra Avenue by buses. Thus, having the WVC Project run on Sierra Avenue would not
conflict with the Downtown Area Plan. Rather, the Street Furnishings section for Goal 1 – A
Livable Public Realm of the Downtown Area Plan (page 27) mentions bus stops as part of a
well-furnished public realm in the Downtown core.

Community Impact Report
West Valley Connector Project 113
While the conceptual layout and cross section of proposed improvements for the Sierra
Avenue Transformation (page 30) does not specifically show planned bus stops between
Orange Way and Seville Street, the transformation discussion (page 31) mentions bus
shelters as street furniture that would “contribute to a safe, comfortable pedestrian (and
retail) environment”. This assumes buses would run along Sierra Avenue.
Goal 1 for the Foothill Blvd Gateway (page 68) states that "future regional-serving bus
transit is anticipated along Foothill Boulevard in the near future and streetscape
improvements to serve bus and public transit users." This is consistent with the proposed
WVC Project.
Goal 2 for the South Sierra Ave Gateway (page 70) states that “Sierra and Merrill Avenues
will serve as the face of the college, with convenient pedestrian entrances, new bus stops,
and bicycle routes” and associated actions to encourage the use of public transit services.
Actions under this goal include prioritizing sheltered bus stops and encouraging greater use
of Metrolink, Omnitrans, and local public transit. The WVC Project would help implement this
goal.
The early action items (page 76) also includes transit stop improvements that talks about the
City working with Omnitrans and property owners adjacent to planned bus station locations
on the design of safe, comfortable pedestrian access and waiting areas. Again, the WVC
Project will be done in coordination with the City and Omnitrans.
Thus, the WVC Project would not conflict with the Downtown Area Plan chapter of the
General Plan.
As stated above, the build alternatives are generally consistent with each of the County and
City General Plans. These plans anticipate growth within the study area and have adopted
goals to provide more multimodal transportation accessibility for residents to reduce
automobile reliance and to reduce impacts associated with automobile reliance. Many of the
existing and local regional land use and transportation planning policies actively promote
transit supportive policies, including Transit Oriented Development (TOD). The proposed
project could also serve as a catalyst for revitalization and stimulate joint development and
TOD in the future, particularly near stations.
This remains applicable with the 2018 Fontana General Plan. As discussed above, no
conflict with the relevant goals, policies, and actions in the 2018 Fontana General Plan
would occur with the proposed project because the WVC Project would utilize the same
route that existing buses use, and no to minimal ROW acquisition in Fontana is needed by
the project. Should the City preclude the use of Sierra Avenue by buses in the future,
SBCTA, Omnitrans, and the City would likely work on alternative bus routes to relocate
existing bus routes at that time. If the WVC Project is operating at that time, relocation would
include the use of alternative streets for the WVC Project. If the WVC Project is not yet in

Community Impact Report
114 West Valley Connector Project
operation, alternative alignments would be explored before the WVC is constructed and
operated in the city.
The City’s Land Use Plan shows the lands along Foothill Boulevard and Sierra Avenue,
where the WVC Project is proposed are primarily designated as Walkable Mixed Use
Corridor & Downtown, Public Facilities, and General Commercial. These would generally
allow similar land uses as the previous land use designations (prior to adoption of the 2018
General Plan and associated Land Use Plan). The Walkable Mixed Use designation is
intended to provide flexibility in developments “along the Sierra and Foothill corridors with
planned transit stops.” The WVC Project would support existing and future developments in
these areas by providing alternative transportation options and more convenient bus transit
services for residents, employees, and patrons.
The Hierarchy of Streets in Fontana (Exhibit 9.2 of the General Plan) shows Foothill
Boulevard as a Modified Major Highway and Sierra Avenue as a Major Highway. Mobility
(Exhibit 9.3 of the General Plan) shows Foothill Boulevard and Sierra Avenue as Omnitrans
routes. The Strategic Policy Map (Exhibit 15.7 of the General Plan) shows that bus stops are
planned along Foothill Boulevard and Sierra Avenue, consistent with the proposed
alignment for the WVC Project. The WVC Project would not conflict with the (Modified) Major
Highway designation of Foothill Boulevard and Sierra Avenue and would maintain bus
routes on Foothill Boulevard and Sierra Avenue. Because the General Plan does not
specifically call out restrictions to bus routes along Foothill Boulevard and Sierra Avenue,
the WVC Project would not conflict with the 2018 Fontana General Plan.
Specific Plans. The build alternatives are generally consistent with each of the Specific
Plans discussed in Section 3.2.1. Implementation of the project would promote transit use
and provide transit connectivity to the various plan areas. Though the project may lead to
minor adjustments to transit designations or land uses in some specific plans, these
modifications would not significantly alter the original intentions of the goals and purposes of
those plans. Many of the plans actively promote transit-supportive policies and could also
serve as a catalyst for revitalization and stimulate development, assisting in the realization
of plan goals.
3.2.3 Avoidance, Minimization, and Mitigation Measures
The build alternatives have been designed to minimize inconsistencies with State, regional,
and local plans and programs to the extent feasible. During final design, efforts will continue
minimize impacts of both build alternatives to avoid existing built land uses to the extent
practicable while adhering to transit design and operational criteria to maintain a safe
roadway. For acquisitions that cannot be reasonably avoided, fair and just compensation
under the Uniform Relocation Assistance and Real Property Acquisition Policies Act of
1987, as amended would be provided to those affected properties. No other avoidance,
minimization, and mitigation measures are proposed related to land use and planning.

Community Impact Report
West Valley Connector Project 115
Table 3-5: Consistency of West Valley Connector Project with County and City General Plans
Goal/Policy
Project Consistent with Plan, Goal, Objective, or Policy
Consistency Analysis No Build
Alternative Build
Alternatives
Los Angeles County General Plan
Goal M 1. Street designs that incorporate the needs of all users.
Consistent Consistent With the No Build Alternative and build alternatives, existing street designs would be maintained for most of the corridor. Any modifications would be designed to meet the needs of potential users, to the greatest extent possible.
Goal M 2. Interconnected and safe bicycle- and pedestrian-friendly streets, sidewalks, paths, and trails that promote active transportation and transit use.
Inconsistent Consistent Under the build alternatives, new ADA-compliant sidewalks would be constructed in the immediate station locations and sidewalks along the dedicated lane segment along Holt Boulevard, thereby increasing opportunities for safer walking and access to transit use. The No Build Alternative would not improve any of these facilities.
Goal M4. An efficient multimodal transportation system that serves the needs of all residents.
Inconsistent Consistent The build alternatives would enhance the public transit system in the project area, providing a system that is more safe, functional, and convenient for the public through the provision of project features. The No Build Alternative would not enhance the public transit system.
Goal C/NR 1. Open space areas that meet the diverse needs of Los Angeles County.
Consistent Consistent No open space would be affected within Los Angeles County with implementation of the build alternatives because project improvements would be limited to transportation facilities. The No Build Alternative would not result in any impacts to open space.

Community Impact Report
116 West Valley Connector Project
Table 3-5: Consistency of West Valley Connector Project with County and City General Plans
Goal/Policy
Project Consistent with Plan, Goal, Objective, or Policy
Consistency Analysis No Build
Alternative Build
Alternatives
Goal P/R 3. Acquisition and development of additional parkland.
Consistent Consistent None of the alternatives are anticipated to have impacts to parkland nor would new parks likely be affected because most of the project ROW is within existing transit routes.
San Bernardino County General Plan
Goal CI 2. The County’s comprehensive transportation system will operate at regional, countywide, community, and neighborhood scales to provide connectors between communities and mobility between jobs, residences, and recreational opportunities
Consistent Consistent The build alternatives would promote interconnectivity of residential uses with commercial centers, civic uses, open spaces, educational facilities, and recreational uses. The project improves upon existing transit facilities; as such, connectivity even with the No Build Alternative would exist, albeit to a lesser degree.
Goal CI 3. The County will have a balance between different types of transportation modes, reducing dependency on the automobile and promoting public transit and alternate modes of transportation, in order to minimize the adverse impacts of automobile use on the environment.
Inconsistent Consistent The build alternatives would create opportunities for residents to have an accessible means of transit that would reduce auto trips and VMT, thus reducing congestion and air pollution. Under the No Build Alternative, automobile use would continue to increase.
Goal CI 5. The County’s road standards for major thoroughfares will complement the surrounding environment appropriate to each geographic region.
Inconsistent Consistent The build alternatives would be designed to conform to the General Plan’s roadway designations as stated in the Circulation Element of the General Plan. Barring its conformity under a separate project, no changes to the roadways would occur under the No Build Alternative.

Community Impact Report
West Valley Connector Project 117
Table 3-5: Consistency of West Valley Connector Project with County and City General Plans
Goal/Policy
Project Consistent with Plan, Goal, Objective, or Policy
Consistency Analysis No Build
Alternative Build
Alternatives
Goal CI 6. The County will encourage and promote greater use of nonmotorized means of personal transportation. The County will maintain and expand a system of trails for bicycles, pedestrians, and equestrians that will preserve and enhance the quality of life for residents and visitors.
Inconsistent Consistent Under the build alternatives, new ADA-compliant sidewalks would be constructed in the immediate station locations and sidewalks along the dedicated lane segment along Holt Boulevard, thereby increasing opportunities for safer walking. The No Build Alternative would not enhance or expand nonmotorized transportation facilities.
Goal CI 13. The County will minimize impacts to stormwater quality in a manner that contributes to improvement of water quality and enhances environmental quality.
Consistent Consistent BMPs would be incorporated into the proposed project design to comply with the County Municipal Stormwater NPDES Permit. No changes to stormwater would result from the No Build Alternative.
City of Pomona General Plan
Goal 6B.G2. Locate higher intensity transit oriented development around existing and future Metrolink, Metro Gold Line, High-Speed Rail, BRT, and other transit stations.
Inconsistent Consistent The build alternatives would provide a quality BRT system and associated transit systems that would serve as nodes around which the city may locate future TODs. The No Build Alternative would not encourage TOD.
Goal 6B.G12. Create evenly spaced and well-distributed activity cluster destinations that anchor the east and west ends of the Holt Avenue corridor and the SR-60/SR-71 to strengthen the gateway function of these locations.
Inconsistent Consistent The build alternatives would traverse the Holt Avenue corridor in this area, transporting users in and out of the Pomona, thus strengthening the gateway function of this location. Activity clusters would likely remain the same under the No Build Alternative.
Goal 6B.G13. Locate the most intense development along Holt Avenue in clusters that can take advantage of potential future BRT.
Inconsistent Consistent The build alternatives would provide the BRT system around which development along Holt Avenue can cluster. The No Build Alternative would not implement a BRT system.

Community Impact Report
118 West Valley Connector Project
Table 3-5: Consistency of West Valley Connector Project with County and City General Plans
Goal/Policy
Project Consistent with Plan, Goal, Objective, or Policy
Consistency Analysis No Build
Alternative Build
Alternatives
Goal 6B.G14. Continue transformation of the Indian Hill PUSD Center into an active mixed-use, walkable environment.
Inconsistent Consistent The build alternatives would provide a transit stop at the Indian Hill PUSD Center, thereby contributing to the transformation of the center into an active mixed-use, walkable environment. The No Build Alternative would not encourage mixed-use development.
Goal 7D.G3. Support regional efforts to the extent feasible, to reduce GHG emissions from cars and light trucks.
Inconsistent Consistent The project would create opportunities for residents to have an accessible means of transit that would reduce auto trips and VMT, thus reducing congestion and air pollution. The No Build Alternative would not reduce GHG emissions.
Goal 7D.G6. Support the expansion of existing regional transit (bus and light rail) and development of a statewide high-speed rail network.
Inconsistent Consistent The build alternatives would expand the existing regional transit system. The No Build Alternative would not expand regional transit service.
Goal 7D.G7. Promote a multimodal transportation system that serves and is served by the future city structure.
Inconsistent Consistent The build alternatives would provide a quality transit system that would enhance the current multimodal transportation system in Pomona. The No Build Alternative would not enhance the multimodal transportation system.
Goal 7D.G9. Expand the choices of available transportation modes to effectively increase the freedom of movement for Pomona’s residents and reduce reliance on the automobile.
Inconsistent Consistent See above response.

Community Impact Report
West Valley Connector Project 119
Table 3-5: Consistency of West Valley Connector Project with County and City General Plans
Goal/Policy
Project Consistent with Plan, Goal, Objective, or Policy
Consistency Analysis No Build
Alternative Build
Alternatives
Goal 7D.G13. Promote transportation access and connectivity between neighborhoods, Downtown, and activity centers.
Inconsistent Consistent The build alternatives would promote interconnectivity of residential uses with commercial centers, civic uses, open spaces, educational facilities, and recreational uses. The No Build Alternative would not promote connectivity between neighborhoods and activity centers.
Goal 7D.G16. Encourage the use of public transportation, especially for commute trips, and increase citywide transit ridership.
Inconsistent Consistent The build alternatives would provide a public transportation system that is safer and more reliable through the provision of enhanced bus stations, shorter headways, and TSP. The No Build Alternative would not alter the existing public transportation system in the corridor.
Goal 7D.G18. Make transit centers and facilities more visible and accessible throughout the community.
Inconsistent Consistent The build alternatives would construct new stations and enhance existing ones to include elements such as shelter, lighting fixtures, and branding making them more visible. Improvements in the general vicinity of stations would make them more accessible to all potential users.
Goal 7E.G1. Achieve the City’s vision for Pomona Tomorrow without adverse environmental impacts that compromise the ability of future generations to meet their needs.
Inconsistent Consistent The build alternatives would enhance the City of Pomona’s vision for a multimodal transportation system while simultaneously reducing congestion and air pollution. The No Build Alternative would not enhance the City’s vision.

Community Impact Report
120 West Valley Connector Project
Table 3-5: Consistency of West Valley Connector Project with County and City General Plans
Goal/Policy
Project Consistent with Plan, Goal, Objective, or Policy
Consistency Analysis No Build
Alternative Build
Alternatives
Goal 7E.G10. Contribute to attainment of regional goals by improving ambient air quality levels within Pomona.
Inconsistent Consistent The build alternatives would create improved opportunities for residents to have an accessible means of transit that would reduce auto trips and VMT, thus reducing congestion and air pollution. The No Build Alternative would not improve ambient air quality.
City of Montclair
Goal LU-1.1.4. Participate in and support regional activities of SCAG, SBCTA, City/County Planning Commissioners Conference, and other such agencies.
Consistent Consistent Coordination is ongoing between the multiple regional and local government agencies involved in the proposed project to provide improved transit services through the jurisdictions located in the project area.
CE-1.1.0. To promote a circulation and transportation system, including freeways, all classes of streets, accommodations for public mass transportation and pedestrian walkways, and bicycle routes that will serve traffic needs efficiently and safely, and be attractive in appearance.
Inconsistent Consistent The build alternatives would accommodate public mass transportation and pedestrian improvements that would improve mobility and accessibility along the project corridor. Travel behaviors would likely remain the same under the No Build Alternative.
CE-1.1.10. Promote the provision of public modes of transportation between strategic locations such as the Montclair Plaza Shopping Center, and other traffic generators, such as the Montclair Transcenter and potential Metrolink station on the Riverside Line.
Inconsistent Consistent The build alternatives would provide a high-quality public transportation mode servicing the Metrolink station on the San Bernardino Line. The No Build Alternative would not provide such connectivity via one cohesive singular public transportation route.

Community Impact Report
West Valley Connector Project 121
Table 3-5: Consistency of West Valley Connector Project with County and City General Plans
Goal/Policy
Project Consistent with Plan, Goal, Objective, or Policy
Consistency Analysis No Build
Alternative Build
Alternatives
Goal AQ-2.0.0. To achieve a diverse and efficient ground transportation system which generates the minimum feasible pollutants.
Inconsistent Consistent The project would create opportunities for residents to have an accessible means of transit that would reduce auto trips and VMT, thus reducing congestion and air pollution. Under the No Build Alternative, pollutant emissions would continue to increase over time.
City of Ontario
Goal M3. A public transit system that is a viable alternative to automobile travel and meets basic needs of the transit dependent.
Inconsistent Consistent The build alternatives would provide a more accessible means of transit for households near the project corridor. Decreased headways and improved reliability would help establish public transportation as a viable alternative to automobile travel. The existing transit system would not be a viable alternative under the No Build Alternative.
Goal M3-4. BRT Corridors. We work with regional transit agencies to implement BRT service to target destinations and along corridors.
Inconsistent Consistent The build alternatives would establish a BRT corridor within Ontario, including 3.5 miles of dedicated, center-running BRT lanes along Holt Boulevard. No coordination would occur under the No Build Alternative.
Goal CE1-12. Circulation. We continuously plan and improve public transit and nonvehicular circulation for the mobility of all, including those with limited or no access to private automobiles.
Inconsistent Consistent Public transit mobility would be improved with the build alternatives. More than 4,400 households with no access to an automobile in the study area corridor would have access to improved public transit service provided by the build alternatives. Under the No Build Alternative, existing transit services and resident travel behavior would likely stay the same.

Community Impact Report
122 West Valley Connector Project
Table 3-5: Consistency of West Valley Connector Project with County and City General Plans
Goal/Policy
Project Consistent with Plan, Goal, Objective, or Policy
Consistency Analysis No Build
Alternative Build
Alternatives
Goal CD1-4. Transportation Corridors. We will enhance our major transportation corridors within the city through landscape, hardscape, signage, and lighting.
Inconsistent Consistent Signage, lighting, and other pedestrian improvements in and around the planned bus stations would be included with the build alternatives. No such improvements would occur under the No Build Alternative.
Goal CD3. Vibrant urban environments that are organized around intense buildings, pedestrian and transit areas, public plazas, and linkages between and within developments that are conveniently located, visually appealing and safe during all hours.
Inconsistent Consistent The build alternatives would provide linkages between key activity centers within Ontario and provide visually appealing and safe transit stops. The No Build Alternative would not contribute to the vibrancy of the existing built environment.
Goal CD3-7. Transit Stops. We require transit stops be well lit, safe, appealing to, and accessible by pedestrians.
Inconsistent Consistent All planned transit stops associated with the build alternatives would be visually appealing and include a shelter/canopy, emergency phone, security cameras, a bench, light fixtures, trash can, and branded pylon. No transit stop improvements would take place with the No Build Alternative.
City of Rancho Cucamonga
Goal LU-4: Establish a pedestrian-friendly Foothill Boulevard corridor that facilitates transit use and provides a range of commercial destinations to serve both local and regional needs.
Consistent Consistent The build alternatives would provide a premium public transportation service along Foothill Boulevard in Rancho Cucamonga that would be in line with the City’s goal of establishing the corridor as a pedestrian-friendly destination. Under the No Build Alternative, existing Route 66 services would continue without any transit improvements.

Community Impact Report
West Valley Connector Project 123
Table 3-5: Consistency of West Valley Connector Project with County and City General Plans
Goal/Policy
Project Consistent with Plan, Goal, Objective, or Policy
Consistency Analysis No Build
Alternative Build
Alternatives
Goal LU-12: Foster a variety of travel routes that are enjoyable ways to experience Rancho Cucamonga.
Inconsistent Consistent The build alternatives would run along Milliken Avenue, Haven Avenue, and Foothill Boulevard in Rancho Cucamonga, providing a more enjoyable and convenient experience for residents and visitors trying to reach various destinations within the city. Under the No Build Alternative, connectivity along multiple primary arterials would require transfers.
Goal CM-1: Provide an integrated and balanced multimodal transportation network of Complete Streets to meet the needs of all users and transportation modes.
Inconsistent Consistent The build alternatives would increase multimodal connectivity along the project corridor. The No Build Alternative would not change existing conditions.
Goal CM-2: Plan, implement, and operate transportation facilities to support healthy and sustainable community objectives.
Inconsistent Consistent Community objectives relevant to this project include facilitating bicycling and walking, reducing total VMT, and using low/zero-emission vehicles. The build alternatives would create opportunities for residents to have an accessible means of transit that would help contribute to meeting a community objective of reducing auto trips and VMT, thus reducing congestion and air pollution. In addition, the project would connect to key destinations within the city, thus helping to facilitate bicycling and walking. The project’s fleet would be comprised of 60-foot-long articulated CNG propulsion buses. No new features would be implemented under the No Build Alternative.

Community Impact Report
124 West Valley Connector Project
Table 3-5: Consistency of West Valley Connector Project with County and City General Plans
Goal/Policy
Project Consistent with Plan, Goal, Objective, or Policy
Consistency Analysis No Build
Alternative Build
Alternatives
Goal CM-3: Provide a transportation system that includes connected transit, bicycle, and pedestrian networks.
Inconsistent Consistent Implementation of the build alternatives would not discontinue any existing sidewalk and bike trail networks or substantially limit existing plans to expand the networks. Where possible, the existing network would be improved to encourage pedestrians and bicyclists to use the West Valley Connector. Project buses would hold up to 8 bicycles on board.
Goal CM-5: Require that new development mitigate transportation impacts and contribute to the improvement of the City’s transportation system.
Consistent Consistent The build alternatives would relieve congestion along the project corridor while relieving some air pollution associated with automobile usage. Implementation of a Traffic Management Plan (TMP) and advance noticing to businesses, residents, and emergency service providers would minimize transportation impacts during the construction phase. The proposed project also plans to implement a mitigation measure at the Day Creek Boulevard/Foothill Boulevard intersection to minimize traffic congestion that would occur during project operation phase.
No new features would be implemented under the No Build Alternative, and the City’s transportation system would continue to become more congested under the No Build Alternative.

Community Impact Report
West Valley Connector Project 125
Table 3-5: Consistency of West Valley Connector Project with County and City General Plans
Goal/Policy
Project Consistent with Plan, Goal, Objective, or Policy
Consistency Analysis No Build
Alternative Build
Alternatives
Goal PS-4: Provide a high level of public safety services throughout Rancho Cucamonga.
Consistent Consistent Coordination with local public safety providers would ensure that their operations would not be disrupted under the build alternatives. No changes to public safety services would be associated with the No Build Alternative.
Goal PS-11: Reduce the volume of pollutants generated by motorized vehicles.
Inconsistent Consistent The build alternatives would relieve congestion along the project corridor while relieving some air pollution associated with automobile usage. Congestion would likely increase under the No Build Alternative.
City of Fontana
Land Use Goal #3: Our community is developing in a unified, orderly, logical, environmentally sound manner, which ensures that the city is unified and accessible to all residents, and results in economically sound commercial areas, vibrant neighborhoods, and jobs rich centers.
Consistent Consistent The build alternatives would provide improved public transit services that would make key destinations within Fontana and surrounding areas more accessible to residents. The corridor would also support future economic development and TOD opportunities. Such developments could happen with the No Build Alternative.
Land Use Goal #5: Our downtown is a vibrant, pedestrian-friendly, economically healthy, safe, convenient and accessible district that serves as the true heart and focal point of the community.
Consistent Consistent The build alternatives would run through the heart of downtown Fontana, providing a premium public transit service to the district. Improvements to downtown can happen apart from this project under the No Build Alternative.
Circulation Goal #1. A balanced transportation system for Fontana is provided that meets the mobility needs of current and future residents and ensures the safe and efficient movement of vehicles, people, and goods throughout the city.
Inconsistent Consistent The build alternatives would create opportunities for residents to have an accessible means of transit that would reduce auto trips and VMT, thus reducing congestion and air pollution. Reliance on the automobile would continue under the No Build Alternative.

Community Impact Report
126 West Valley Connector Project
Table 3-5: Consistency of West Valley Connector Project with County and City General Plans
Goal/Policy
Project Consistent with Plan, Goal, Objective, or Policy
Consistency Analysis No Build
Alternative Build
Alternatives
Circulation Goal #2. A regional network of multimodal transportation facilities, including an improved citywide transportation system, is provided that ensures the safe and efficient movement of vehicles, people, and goods throughout the City of Fontana and to and from the region, and provides mobility to all city residents and helps reduce vehicular trips citywide.
Inconsistent Consistent See above response.
Circulation Goal #3. A circulation system is provided that reduces conflicts between commercial trucking, private/ public transportation and land uses.
Consistent Consistent None of the alternatives would conflict with commercial trucking, land uses, or other transportation, rather by relieving congestion along the corridor, the build alternatives should complement such activities.
Community Design Goal #4. We have a vibrant, identifiable downtown that serves the diverse needs of its residents and readily attracts visitors.
Consistent Consistent All of the build alternatives run through the heart of downtown Fontana, providing a premium public transit service to the district.
Air Quality Goal #2. Our city has a diverse and efficiently operated ground transportation system that generates the minimum feasible pollutants.
Inconsistent Consistent The build alternatives would create opportunities for residents to have an accessible means of transit that would reduce auto trips and VMT, thus reducing congestion and air pollution. Travel behavior would stay the same under the No Build Alternative.
3.3 Parks and Recreation
3.3.1 Affected Environment
The study area for parks and recreational facilities includes those resources located within a
0.5-mile radius of the project corridor. Table 3-6 lists each park within 0.5 mile of the project
corridor. Figure 5-1 Community Facilities Map in Section 5 (Community Facilities and

Community Impact Report
West Valley Connector Project 127
Services) shows the location of where park and recreational facilities are located within the
project area.
Table 3-6: List of Parks within 0.5 Mile of the Project Corridor
Pomona
Memorial Park
Centennial Park
Garfield Park
Montclair
Sunset Park
Saratoga Park
Kingsley Park
Ontario
James R. Bryant Park
Euclid Avenue Parkway
Ontario Dog Park
Nugent’s Park
Sam Alba Park
Veterans Memorial Park
James Galanis Park
Carpenter’s Union Park
Cucamonga-Guasti Regional Park
Ontario Motor Speedway Park
Bon View Park
Rancho Cucamonga
Ralph M. Lewis Park
West Greenway Park
Victoria Arbors Park
Milliken Park
Garcia Park
Mountain View Park
Fontana
Patricia Murray Park
McDermott Sports Complex & McDermott Park West
Northgate Park
Bill Marin Park
Cypress Park
Seville Park
Miller Park
Santa Fe Park
Veteran’s Park
Jack Bulik Park
Source: Google, 2016.
3.3.2 Environmental Consequences
No Build Alternative
Because there would be no construction or operation of the proposed BRT service with this
alternative, no impacts to parkland would occur.

Community Impact Report
128 West Valley Connector Project
Build Alternatives
BRT Corridor
Preliminary design of the build alternatives has been undertaken to avoid impacts to
parkland. Based on the preliminary design, park and recreational facilities within the study
area would not be affected by any of the proposed build alternatives. Ontario Dog Park,
located 250 feet southeast from the intersection of Holt Boulevard/Vine Avenue, is the
closest park to be located near major construction activities for the dedicated bus-only lanes
segment under Alternative B. No direct or indirect impacts to the Ontario Dog Park are
anticipated.
O&M Facility
Both alternatives would construct a new O&M facility to serve BRT vehicles used for the
project. None of the three potential sites for the O&M facility would impact parkland. Bon
View Park is situated closest to the potential sites for the O&M facility, located approximately
500 feet northwest of Site 3 at 1333 Bon View Avenue. No direct or indirect impacts to Bon
View Park are anticipated.
3.3.3 Avoidance, Minimization, and Mitigation Measures
None of the alternatives would impact any park or recreational facilities, therefore, no
avoidance, minimization, and mitigation measures are proposed.

Community Impact Report
West Valley Connector Project 129
This page intentionally left blank.


Community Impact Report
West Valley Connector Project 131
GROWTH
Growth-related impacts are defined as the relationship between a proposed transportation
project and growth within the affected project area. It is often defined as the measurable
increase in population, housing, and/or employment that can be reasonably attributable to
implementation of a given project. An example would be construction of a new
transportation facility in a completely undeveloped area, thereby creating a means and
motivation for new development to occur in the previously undeveloped area.
The growth-related impacts assessment process examines the relationship of the proposed
project to economic and population growth or to construction of additional housing in the
project area. It focuses on the potential for a project to facilitate or accelerate development
beyond that already planned, or to cause a shift in growth from elsewhere in the region.
Many factors other than a project’s construction could impact the amount, location, and rate
of growth in a project study area, including things such as:
• Market demand for new development;
• The availability of other means of access;
• Developable land;
• National and regional economic trends;
• The availability of other infrastructure, such as water and sewer systems;
• Governmental policies; and
• Climate.
4.1 Regulatory Setting
The Council on Environmental Quality (CEQ) regulations, which established the steps
necessary to comply with NEPA, requires evaluation of the potential environmental
consequences of all proposed federal activities and programs. This provision includes a
requirement to examine indirect consequences that may occur in areas beyond the
immediate influence of a proposed action and at some time in the future. The CEQ
regulations, 40 Code of Federal Regulations (CFR) 1508.8, refer to these consequences as
secondary impacts. Secondary impacts may include changes in land use, economic vitality,
and population density, which are all elements of growth.
CEQA also requires the analysis of a project’s potential to induce growth. CEQA Guidelines,
Section 15126.2(d), require that environmental documents “…discuss the ways in which the
proposed project could foster economic or population growth, or the construction of
additional housing, either directly or indirectly, in the surrounding environment…”

Community Impact Report
132 West Valley Connector Project
Under NEPA and CEQA, growth inducement is not necessarily considered detrimental,
beneficial, or environmentally significant. Typically, the growth inducing potential of a project
is considered significant if it fosters growth or a concentration of population in excess of
what is assumed in relevant master plans, land use plans, or in projections made by
regional planning agencies. Significant growth impacts could be manifested through the
provision of infrastructure or service capacity to accommodate growth beyond the levels
currently permitted by local or regional plans and policies. In general, growth induced by a
project is considered a significant impact if it directly or indirectly affects the ability of
agencies to provided needed public services, or if it can be demonstrated that the potential
growth significantly affects the environment in some other way.
4.2 Affected Environment
This section uses information from the 2016 RTP (SCAG, 2016), the West Valley Connector
Traffic and Transportation Study Report (Iteris, 2017), and the County Population Estimates
(California Department of Finance, 2016).
Regional Growth
The project study area, as well as all of Southern California, has experienced dramatic
growth in the last 30 years, and this trend is expected to continue. During the past several
decades, the SCAG region, including Orange, Imperial, Riverside, San Bernardino, Los
Angeles, and Ventura counties, has been one of the fastest-growing regions in the nation.
Between 1950 and 1970, the population doubled in size, growing at a rate of 5 percent per
year (California Department of Finance, 2016). Between 1980 and 1990, the region’s
population grew by more than 25 percent, to 14.6 million (California Department of Finance,
2016). Between 1990 and 2000, the region’s population grew by nearly 15 percent, to 16.5
million (California Department of Finance, 2016). By 2015, Los Angeles County’s population
reached 10,147,070 persons and San Bernardino County’s population reached 2,116,461
persons and are ranked the 1st and 5th most populated county of the state’s 58 counties,
respectively (California Department of Finance, 2016). Additional population and
employment growth within the study area is expected to take place through the natural
increase and redevelopment of existing land uses or infill development of vacant parcels. As
discussed in the SCAG’s 2016-2040 RTP/SCS, SCAGs vision for growth in the region
involves the close integration between transportation and land use planning, in order to
avoid the haphazard distribution of projects that leads to isolated communities without easy
access to public transportation and other key destinations. SCAG’s vision of integrated
transportation and land use hopes to guide growth in a sustainable manner, such as high
quality transit areas, that simultaneously enhances mobility and quality of life.

Community Impact Report
West Valley Connector Project 133
Local Growth
As housing has become more expensive and buildable land scarce in the Los Angeles
metropolitan region, San Bernardino County, including the project corridor cities, has
experienced a significant growth in population. Ontario has seen its population grow 28
percent between 2003 and 2016; while all other cities have grown by at least 14 percent in
the same time frame (SCAG, 2016). Much like SCAG’s vision, the general consensus
among study area cities is the need to promote a more sustainable community that
integrates land use, housing, and transportation policies to diversity existing land uses
through infill development and developing a multimodal transportation network. This
includes the identification of key corridors around which to focus the distribution and
intensity of land uses around.
Data is dispensed at the city and county level for SCAG’s Integrated Growth Forecast. This
data provides a snapshot of the future population, households, and employment
opportunities within the project study area from 2016 to 2040. Table 4-1 presents a
summary of SCAG growth forecast data for Los Angeles and San Bernardino counties and
the cities of Pomona, Montclair, Ontario, Rancho Cucamonga, and Fontana indicating how
population, households, and employment are expected to increase from 2008 to 2035. Data
in Table 4-1 indicates that the cities of Ontario and Fontana have the greatest forecasted
growth in all three areas, population, housing, and employment.
Table 4-1: SCAG 2016 RTP/SCS Growth Forecasts
County of
Los Angeles
County of San
Bernardino
City of Pomona
(LA County)
City of Montclair
(SB County)
City of Ontario
(SB County)
City of Rancho
Cucamonga (SB
County)
City of Fontana
(SB County)
Population 2016
10,212,962 2,135,800 155,650 37,550 181,950 172,000 202,550
Population 2020
10,326,200 2,197,400 160,800 37,900 197,600 173,900 204,900
Population 2040
11,514,800 2,731,300 190,400 42,700 258,600 204,300 280,900
% Change 12 24 18 13 31 17 37
Households 2016
3,403,120 653,660 41,000 9,900 51,700 56,250 51,550
Households 2020
3,493,700 687,100 43,400 10,200 58,300 57,100 53,500
Households 2040
3,946,600 854,300 51,100 11,600 75,300 73,100 74,000
% Change 13 24 18 14 29 28 38
Employment 2016
4,493,604 740,960 57,800 16,950 103,300 76,100 51,200

Community Impact Report
134 West Valley Connector Project
Table 4-1: SCAG 2016 RTP/SCS Growth Forecasts
County of
Los Angeles
County of San
Bernardino
City of Pomona
(LA County)
City of Montclair
(SB County)
City of Ontario
(SB County)
City of Rancho
Cucamonga (SB
County)
City of Fontana
(SB County)
Employment 2020
4,662,500 789,500 60,500 17,400 129,300 82,300 55,400
Employment 2040
5,225,800 1,028,100 67,200 19,000 175,400 104,600 70,800
% Change 12 30 11 9 36 27 28
Source: SCAG, 2016.
4.3 Environmental Consequences
No Build Alternative
The No Build Alternative proposes no change to the project area and would not result in any
growth inducing impacts.
Build Alternatives
The counties and cities in the proposed project study area control land use development
through their general plans, zoning, and other land use ordinances, therefore,
implementation of the proposed project would not result in changes to land use in the project
area.
Permanent Impacts of the Proposed Project
As described above, the regional project area has experienced rapid population, housing,
and employment growth in recent decades. This growth is associated with existing and
future land uses, development, and economic growth. The region is projected to continue to
experience population growth, which is expected to occur with or without implementation of
the build alternatives. The build alternatives, including the potential sites proposed for the
new O&M facility common to both alternatives, are expected to accommodate existing,
approved and planned growth in the area, but are not expected to influence the amount,
timing, or location of growth in the area.
The build alternatives would accommodate current and future residents and businesses by
providing a public transportation service on already existing roads. Since the proposed
project does not include residential or commercial land uses, it would be speculative to
determine direct or indirect impacts related to growth (e.g., changes in general plan and
zoning designations to adjacent parcels, etc.). As discussed in Section 3.2, the project is
consistent with existing and future planned uses along the project corridor. As such, the

Community Impact Report
West Valley Connector Project 135
implementation of the proposed project would not result in significant impacts related to
growth inducement.
Temporary Impacts of the Proposed Project
The proposed project would generate construction-related jobs that would benefit the local
area. It is anticipated that the majority of workers filling the construction jobs would reside
within or live in relative proximity to the project area. The temporary jobs generated by
construction of the proposed project are not anticipated to alone result in a demand for
additional housing or cause unplanned growth in the project area.
4.4 Avoidance, Minimization, and Mitigation Measures
The build alternatives are not expected to influence the amount, timing, or location of growth
in the area, therefore no specific avoidance, minimization, and mitigation measures are
proposed.

Community Impact Report
136 West Valley Connector Project
This page intentionally left blank.

Community Impact Report
West Valley Connector Project 137
COMMUNITY CHARACTER
5.1 Population and Housing
This section discusses the potential impacts to neighborhoods/communities and housing as
a result of the project implementation and identifies measures to minimize or mitigate those
impacts.
5.1.1 Affected Environment
Regional Characteristics
Southern California is shaped by a sprawling physical landscape and the postwar era
development pattern dominated by single-family houses located on large suburban lots. The
inhabitants of the region have largely relied on the automobile as a primary means of
transportation. However, in the 21st century, housing trends are gradually shifting towards
smaller-lot single-family houses and multi-family housing near shopping, transit services,
and other amenities. Currently, 55 percent of the Southern California’s homes are detached
single-family houses. Over the next 20 years, it is projected that an additional 1.5 million
homes will be added, of which 67 percent will be multifamily housing (SCAG RTP, 2016).
The rapid and sustained growth of the region’s population has put a strain on the regional
infrastructure. Road and highways are becoming increasingly congested, contributing to the
already poor regional air quality. Neighborhoods are becoming more and more expensive as
the demand for housing has overtaken the supply (SCAG RTP, 2016). As a result, SCAG is
seeking to prioritize development in areas primed for transit investments. Currently, more
than five million residents live within one mile of these “high quality transit areas” (HQTAs).
Additionally, 30 percent and 38 percent of regional households and employment,
respectively, are located in these prime transit investment areas (SCAG RTP, 2016).
Overall, the region is slowly making a shift in character from one that relies heavily on the
automobile for commutes from suburbs to job centers, to one that situates residents in
higher density environments coupled with the provision of high quality public transportation
as a means of commuting to locations of employment.
Neighborhoods/Communities
The cities of Pomona, Montclair, Ontario, Rancho Cucamonga, and Fontana contain
neighborhoods with diverse population characteristics. Throughout the project corridor, the
neighborhoods comprise suburban residential enclaves, urban multi-family dwellings, golf
course estates, commercial corridors, entertainment centers, and healthcare complexes.
The following is a brief profile description of the various neighbors located along the project
corridor.

Community Impact Report
138 West Valley Connector Project
City of Pomona
• Downtown Pomona: Located in the center of Pomona, this neighborhood is generally
bound by Holt Boulevard to the north, White Avenue to the west, and Towne Avenue to
the east. Downtown Pomona features the Pomona Transit Center, which is the western
terminus of the project corridor. Directly south of the transit center is the downtown area,
which is comprised of civic uses and commercial/retail properties.
• Indian Hill: The Indian Hill neighborhood in eastern Pomona is generally bound by South
Mills Avenue to the east, 1st Street to the South, Kingsley Avenue to the north, and San
Antonio Avenue to the west. The neighborhood is primarily made up of small- to
medium-sized multi and single-family residential residences. Holt Avenue, which runs
through the center of the neighborhood, is surrounded by older retail and auto-related
uses and the Indian Hill Mall.
City of Montclair
• Sunsweet: The Sunsweet neighborhood is bound by Kingsley Street to the north and
State Street to the south in Montclair. Holt Boulevard runs through the center of the
neighborhood, and is primarily bordered by older retail, auto-related uses, and numerous
vacant lots. To the south of Holt Boulevard are industrial uses and the San Bernardino
Metrolink rail line. The northern area of the neighborhood consists primarily of multi- and
single-family residences.
City of Ontario
• West Ontario: This neighborhood is generally bound by Benson Avenue to the west and
San Antonio Avenue to the east. The project corridor passes through an area of
commercial uses in the West Ontario neighborhood. North of the project corridor are
primarily multi- and single-family residences, while to the south is a mix of different
industrial uses.
• Downtown District: The Downtown District neighborhood is generally bound on the west
and east by San Antonio and Campus avenues. The historic downtown neighborhood
runs along Euclid Avenue in the north-south direction and features a variety of
commercial uses. Ontario City Hall, the Museum of History and Art, and the Ontario
Amtrak Station are also located in this neighborhood. Located immediately east of Euclid
Avenue are a few newer high-density residential developments.
• North Ontario: The North Ontario neighborhood is east of the Downtown District and
extends to Grove Avenue. Along Holt Boulevard in this neighborhood, there are a
multitude of vacant and underused parcels, particularly along the south side of the
street. Overall, the makeup of the neighborhood is similar to the West Ontario
neighborhood.
• Ontario International Airport: The airport neighborhood is dominated by the airport and
related facilities. To the north of the neighborhood, there are a variety of hospitality uses,

Community Impact Report
West Valley Connector Project 139
including the Ontario Convention Center, and several hotels in the immediate vicinity of
the Holt Boulevard and Vineyard Avenue intersection. These uses are also
complemented by surrounding restaurants and auto uses.
• Ontario Center: North of I-10 and the Ontario International Airport, the Ontario Center
offers a multitude of commercial and retail services, entertainment facilities (Citizen’s
Bank Arena), light industrial uses, and multi-family residences. The neighborhood is
generally bound by Milliken Avenue to the east, Vineyard Avenue to the west, and 4th
Street to the north. Included in the neighborhood is the Cucamonga-Guasti Regional
Park, which provides 160 acres for outdoor recreation in an urban setting. Founder’s
Park, a large formal park dedicated to the founding of the City of Ontario, is also located
in this neighborhood.
• Ontario Mills: Ontario Mills is located north of I-10 and is bound by Milliken Avenue, 4th
Street, and I-15 to the east. The neighborhood contains the Ontario Mills regional
shopping center, as well as other office and commercial uses.
City of Rancho Cucamonga
• Industrial Area: This neighborhood is bounded to the north by Foothill Boulevard, to the
south by San Bernardino Avenue, to the west by Baker Avenue, and to the east by East
Avenue. The Industrial Area includes a sub-area that features an 18-hole golf course
and the Rancho Cucamonga Metrolink Station off Milliken Avenue. Along with the
multitude of existing light industrial uses, the City is integrating a wide range of
commercial, office, and high-density residential developments into the neighborhood.
The northern portion of the neighborhood near Foothill Boulevard includes a commercial
node, comprised primarily of restaurants, strip retail, and hospitality uses.
• Terra Vista: The Terra Vista Neighborhood runs on the north side of Foothill Boulevard
between Haven Avenue and Rochester Avenue. A greenway runs through the middle of
the primarily single-family residential neighborhood. The area contains residential and
commercial uses, with a large concentration of commercial and office uses along Foothill
Boulevard and Haven Avenue.
• Victoria Gardens: The Victoria Gardens neighborhood runs along Foothill Boulevard and
is bound by East Avenue to the east and Base Line Road to the north. A variety of
restaurants, commercial uses, and small-scale and big-box retail are located along
Foothill Boulevard within the neighborhood. The western portion of the neighborhood is
comprised primarily of multi- and single-family residential. The east end features the
Victoria Gardens mixed-use urban village which includes a variety of commercial uses, a
performing arts/cultural center, and accompanying multi-family residential units.
City of Fontana
• West End: The West End Neighborhood is a primarily residential area bordered by
Foothill Boulevard, Cherry Avenue, Baseline Avenue, and East Avenue. The

Community Impact Report
140 West Valley Connector Project
neighborhood serves as the west entrance into Fontana and includes more than 3,000
residential units, mostly single-family. In addition, there are two elementary schools, an
intermediate school, a variety of open space, and neighborhood-serving commercial and
office spaces on the outer areas.
• Auto Club Speedway: This neighborhood is south of Foothill Boulevard between East
Avenue and Citrus Avenue. The focal point of the neighborhood is the Auto Club
Speedway. Common throughout the neighborhood is vacant and undeveloped parcels.
In between the vacant parcels, there are various industrial uses, mobile home parks, and
some single-family residential homes.
• Rancho Fontana: This neighborhood in the northwest portion of the city is bounded by
Walnut Street to the north, Redwood Avenue to the west, Citrus Avenue to the east, and
Foothill Boulevard to the south. The southwest quadrant of the neighborhood contains
some industrial uses, including a Target Corporation Distribution Center and the Fontana
Department of Industrial Center. East of the industrial area is a neighborhood comprised
primarily of single-family residences. In all, more than 2,300 dwelling units are located in
the Rancho Fontana Neighborhood.
• Northgate: The Northgate Neighborhood is north of Foothill Boulevard and is bound to
the east and west by Citrus Avenue and Sierra Avenue. The neighborhood features
some general commercial uses adjacent to Foothill Boulevard, but otherwise it consists
mostly of single-family homes with some multi-family developments.
• Downtown: Downtown Fontana runs along Sierra Avenue and extends approximately
from Foothill Boulevard to Ceres Avenue. Outside of the Downtown core is a mix of
single- and multi-family residences, as well as some small-scale and big-box retail. At
the center are the historic Downtown Fontana area, the Fontana Civic Center, the
Fontana Lewis Library, the Pacific Electric Bike Trail, and a mix of different retail uses.
The intersection of Sierra Avenue and Ceres Avenue acts as an entry gateway into the
Downtown Neighborhood. The Fontana Metrolink Station, as well as some newer high-
density senior housing is located on both sides of Sierra Avenue.
• Central Fontana: The Central Fontana neighborhood generally extends from Ceres
Avenue to I-10. The area features commercial uses that line major streets with single-
family and higher-density housing located on streets behind the commercial areas.
Fontana High School is in the western portion of the neighborhood. The intersection of
San Bernardino Avenue and Sierra Avenue features a concentration of medium- to high-
density residential and commercial developments. The Kaiser Permanente Medical
Center is the focus of a node of commercial uses on Sierra Avenue near Valley
Boulevard.
Demographic Data
Elements of community cohesion can be found in the U.S. Census Bureau 2010-2014
American Community Survey (ACS) 5-Year Estimates demographic data used to profile

Community Impact Report
West Valley Connector Project 141
project area communities. Table 5-1 through Table 5-3 summarize some key descriptive
data.
Population
As shown in Table 5-1, Fontana has the largest population of all study area cities, at over
200,000 residents, but only the third in terms of people per square mile, or population
density. Montclair, while having the lowest total population size, has the highest density with
approximately 6,830 residents per square mile. Ontario has the lowest population density
with 3,337 people per square mile. The total population within the project study area is
284,621.
Ethnicity
Ethnic homogeneity is often associated with a higher degree of community cohesion. Table
5-1 shows the ethnic composition of the study area counties and cities. Based on the 2010-
2014 American Community Survey, the largest racial category in the study area is Hispanic
or Latino, at 67 percent. This is much higher than Hispanic or Latino county averages of
48.1 percent and 50.5 percent for Los Angeles County and San Bernardino County,
respectively. Of the study area cities, Rancho Cucamonga serves is an outlier, with only
36.1 percent of the City’s population identifying as either Hispanic or Latino. Rancho
Cucamonga was once again an outlier when analyzing the White population, with a
39.8 percent of the population identifying as White, while the rest of the study cities were
around 15 percent. Rancho Cucamonga also includes the largest percentage of population
that identifies as Asian (12.0 percent) or Two or More Races (3.2 percent). The Black or
African American populations in all study area cities are fairly similar, range from 4.1 to
9.2 percent. In the study area, nearly a quarter of residents identify to the Census as “some
other race,” which is higher than the averages for both counties. Other racial categories did
not represent a large proportion of the population in all study area cities, ranging from zero
to 1 percent.

Community Impact Report
142 West Valley Connector Project
Table 5-1: Ethnic Composition
Total Population
White (%)
Black or African
American (%)
American Indian or Alaskan
(%)
Asian (%)
Native Hawaiian or Pacific Islander
(%)
Some Other Race (%)
Two or More Races
(%)
Hispanic or Latino
(%)
County
County of Los Angeles
9,974,203 2,712,983
(27.2) 802,132
(8.0) 18,207 (0.2)
1,377,333 (13.8)
23,921 (0.2)
24,807 (0.3)
215,647 (2.2)
4,797,592 (48.1)
County of San Bernardino
2,078,586 660,447 (31.8)
170,307 (8.2)
7,479 (0.4)
133,270 (6.4)
6,465 (0.3)
45,644 (2.2)
45,644 (2.2)
1,049,686 (50.5)
City
Pomona 151,142 19,088 (12.6)
10,730 (7.1)
366 (0.2)
13,804 (9.1)
348 (0.2)
337 (0.2)
1,610 (1.1)
104,859 (69.4)
Montclair 37,685 5,847 (15.5)
1,530 (4.1)
40 (0.1)
3,638 (9.7)
331 (0.9)
99 (0.3)
393 (1.0)
25,807 (68.5)
Ontario 166,892 28,646 (17.2)
9,313 (5.6)
261 (0.2)
8,177 (4.9)
287 (0.2)
262 (0.2)
2,795 (1.7)
117,151 (70.2)
Rancho Cucamonga
170,170 67,697 (39.8)
14,384 (8.5)
227 (0.1)
20,382 (12.0)
248 (0.2)
227 (0.1)
5,510 (3.2)
61,495 (36.1)
Fontana 201,355 31,188 (15.5)
18,560 (9.2)
317 (0.2)
11,773 (5.9)
839 (0.4)
349 (0.2)
4,118 (2.1)
134,211 (66.7)
Study Area
Study Area* 284,621 47,018 (16.5)
19,970 (7.0)
594 (0.2)
20,952 (7.4)
496 (0.2)
367 (0.1)
4678 (1.6)
190,546 (67.0)
Census Tract 4023.03
4,676 574
(12.3) 345 (7.4)
3 (0.1)
161 (3.4)
0 (0)
0 (0)
25 (0.5)
3,568 (76.3)
Census Tract 4026.00
7,624 1,694 (22.2)
488 (6.4)
109 (1.4)
374 (4.9)
0 (0)
0 (0)
50 (0.7)
4,909 (64.4)
Census Tract 4027.02
6,344 445 (7.0)
379 (6.0)
0 (0)
105 (1.7)
0 (0)
0 (0)
31 (0.5)
5,384 (84.9)

Community Impact Report
West Valley Connector Project 143
Table 5-1: Ethnic Composition
Total Population
White (%)
Black or African
American (%)
American Indian or Alaskan
(%)
Asian (%)
Native Hawaiian or Pacific Islander
(%)
Some Other Race (%)
Two or More Races
(%)
Hispanic or Latino
(%)
Census Tract 4027.05
3,536 697
(19.7) 245 (6.9)
0 (0)
114 (3.2)
0 (0)
0 (0)
50 (1.4)
2,430 (68.7)
Census Tract 4027.06
4,242 207 (4.9)
396 (9.3)
0 (0)
487 (11.5)
0 (0)
0 (0)
50 (1.2)
3,102 (73.1)
Census Tract 4028.01
5,240 104 (2.0)
25 (0.5)
0 (0)
100 (1.9)
0 (0)
6 (0.1)
18 (0.3)
4,987 (95.2)
Census Tract 4088.00
3,917 571
(14.6) 323 (8.2)
40 (1.0)
355 (9.1)
0 (0)
62 (1.6)
78 (2.0)
2,488 (63.5)
Census Tract 2.07
4,859 543
(11.2) 0
(0) 0
(0) 426 (8.8)
0 (0)
0 (0)
0 (0)
3,890 (80.1)
Census Tract 2.08
4,667 1,096 (23.5)
29 (0.6)
0 (0)
352 (7.5)
0 (0)
0 (0)
0 (0)
3,190 (68.4)
Census Tract 3.01
9,124 547 (6.0)
406 (4.4)
8 (0.1)
689 (7.6)
320 (3.5)
0 (0)
168 (1.8)
6,986 (76.6)
Census Tract 3.03
7,364 938
(12.7) 196 (2.7)
0 (0)
322 (4.4)
0 (0)
0 (0)
118 (1.6)
5,790 (78.6)
Census Tract 3.04
6,182 827
(13.4) 144 (2.3)
24 (0.4)
1,093 (17.7)
0 (0)
32 (0.5)
53 (0.9)
4,009 (64.8)
Census Tract 10.02
5,951 741
(12.5) 241 (4.0)
0 (0)
130 (2.2)
0 (0)
0 (0)
9 (0.2)
4,830 (81.2)
Census Tract 11.01
3,357 488
(14.5) 105 (3.1)
22 (0.7)
129 (3.8)
0 (0)
0 (0)
128 (3.8)
2,485 (74.0)
Census Tract 13.12
5,192 881
(17.0) 434 (8.4)
0 (0)
688 (13.3)
59 (1.1)
7 (0.1)
37 (0.7)
3,086 (59.4)
Census Tract 14.00
2,893 540
(18.7) 221 (7.6)
0 (0)
182 (6.3)
9 (0.3)
0 (0)
125 (4.3)
1,816 (62.8)

Community Impact Report
144 West Valley Connector Project
Table 5-1: Ethnic Composition
Total Population
White (%)
Black or African
American (%)
American Indian or Alaskan
(%)
Asian (%)
Native Hawaiian or Pacific Islander
(%)
Some Other Race (%)
Two or More Races
(%)
Hispanic or Latino
(%)
Census Tract 15.01
3,620 248 (6.9)
42 (1.2)
0 (0)
5 (0.1)
0 (0)
0 (0)
15 (0.4)
3,310 (91.4)
Census Tract 15.03
3,666 214 (5.8)
0 (0)
0 (0)
60 (1.6)
0 (0)
0 (0)
92 (2.5)
3,300 (90.0)
Census Tract 15.04
5,513 434 (7.9)
477 (8.7)
0 (0)
309 (5.6)
0 (0)
10 (0.2)
87 (1.6)
4,196 (76.1)
Census Tract 16.00
6,388 186 (2.9)
9 (0.1)
16 (0.3)
28 (0.4)
10 (0.2)
0 (0)
0 (0)
6,139 (96.1)
Census Tract (18.03)
2,853 694
(24.3) 151 (5.3)
99 (3.5)
85 (3.0)
0 (0)
0 (0)
0 (0)
1,824 (63.9)
Census Tract (18.13)
4,995 236 (4.7)
344 (6.9)
7 (0.1)
36 (0.7)
0 (0)
63 (1.3)
6 (0.1)
4,303 (86.1)
Census Tract 20.28
5,100 2,053 (40.3)
428 (8.4)
0 (0)
314 (6.2)
0 (0)
0 (0)
124 (2.4)
2,181 (42.8)
Census Tract 20.34
14,955 4,975 (33.3)
1,455 (9.7)
0 (0)
3,574 (23.9)
0 (0)
70 (0.5)
161 (1.1)
4,720 (31.6)
Census Tract 20.35
6,584 2,471 (37.5)
685 (10.4)
0 (0)
930 (14.1)
0 (0)
0 (0)
420 (6.4)
2,078 (31.6)
Census Tract 20.36
11,539 4,031 (34.9)
1,653 (14.3)
24 (0.2)
2,135 (18.5)
0 (0)
0 (0)
381 (3.3)
3,315 (28.7)
Census Tract 20.37
8,068 2,196 (27.2)
1,021 (12.7)
126 (1.6)
1,031 (12.8)
38 (0.5)
0 (0)
217 (2.7)
3,439 (42.6)
Census Tract 20.38
5,860 1,181 (20.2)
1,359 (23.2)
0 (0)
832 (14.2)
0 (0)
0 (0)
123 (2.1)
2,365 (40.4)
Census Tract 21.07
4,864 1,729 (35.5)
477 (9.8)
0 (0)
172 (3.5)
0 (0)
5 (0.1)
172 (3.5)
2,309 (47.5)

Community Impact Report
West Valley Connector Project 145
Table 5-1: Ethnic Composition
Total Population
White (%)
Black or African
American (%)
American Indian or Alaskan
(%)
Asian (%)
Native Hawaiian or Pacific Islander
(%)
Some Other Race (%)
Two or More Races
(%)
Hispanic or Latino
(%)
Census Tract 21.09
4,598 827
(18.0) 1,020 (22.2)
15 (0.3)
495 (10.8)
0 (0)
33 (0.7)
226 (4.9)
1,982 (43.1)
Census Tract 21.10
7,246 1,641 (22.6)
509 (7.0)
53 (0.7)
1,864 (25.7)
0 (0)
0 (0)
393 (5.4)
2,786 (38.4)
Census Tract 22.04
6,548 673
(10.3) 305 (4.7)
0 (0)
250 (3.8)
0 (0)
0 (0)
83 (1.3)
5,237 (80.0)
Census Tract 22.07
4,789 1,340 (28.0)
1,044 (21.8)
0 (0)
202 (4.2)
0 (0)
7 (0.2)
10 (0.2)
2,186 (45.6)
Census Tract 23.05
10,456 1,550 (14.8)
1,104 (10.6)
0 (0)
765 (7.3)
0 (0)
61 (0.6)
432 (4.1)
6,544 (62.6)
Census Tract 24.01
9,886 569 (5.8)
203 (2.1)
0 (0)
93 (0.9)
10 (0.1)
0 (0)
158 (1.6)
8,853 (89.6)
Census Tract 24.02
8,571 492 (5.7)
388 (4.5)
0 (0)
133 (1.6)
0 (0)
4 (0)
37 (0.4)
7,517 (87.7)
Census Tract 26.01
11,125 1,257 (11.3)
790 (7.1)
1 (0)
1,019 (9.2)
0 (0)
0 (0)
66 (0.6)
7,992 (71.8)
Census Tract 28.01
5,684 532 (9.4)
563 (9.9)
0 (0)
102 (1.8)
0 (0)
0 (0)
74 (1.3)
4,413 (77.6)
Census Tract 28.03
4,032 413
(10.2) 175 (4.3)
36 (0.9)
97 (2.4)
0 (0)
0 (0)
0 (0)
3,311 (82.1)
Census Tract 28.04
5,460 300 (5.5)
416 (7.6)
0 (0)
39 (0.7)
0 (0)
0 (0)
19 (0.3)
4,686 (85.8)
Census Tract 29.01
4,002 481
(12.0) 92
(2.3) 0
(0) 0
(0) 13
(0.3) 0
(0) 20
(0.5) 3,396 (84.9)
Census Tract 30.00
3,259 422
(12.9) 302 (9.3)
0 (0)
33 (1.0)
7 (0.2)
0 (0)
114 (3.5)
2,381 (73.1)

Community Impact Report
146 West Valley Connector Project
Table 5-1: Ethnic Composition
Total Population
White (%)
Black or African
American (%)
American Indian or Alaskan
(%)
Asian (%)
Native Hawaiian or Pacific Islander
(%)
Some Other Race (%)
Two or More Races
(%)
Hispanic or Latino
(%)
Census Tract 31.02
5,292 410 (7.7)
79 (1.5)
0 (0)
0 (0)
19 (0.4)
0 (0)
17 (0.3)
4,767 (90.1)
Census Tract 32.00
8,812 1,443 (16.4)
383 (4.3)
11 (0.1)
26 (0.3)
0 (0)
0 (0)
169 (1.9)
6,780 (76.9)
Census Tract 33.01
5,188 455 (8.8)
172 (3.3)
0 (0)
133 (2.6)
11 (0.2)
7 (0.1)
15 (0.3)
4,395 (84.7)
Census Tract 33.02
6,256 1,185 (18.9)
135 (2.2)
0 (0)
44 (0.7)
0 (0)
0 (0)
31 (0.5)
4,861 (77.7)
Census Tract 127.00
4,244 1,487 (35.0)
212 (5.0)
0 (0)
439 (10.3)
0 (0)
0 (0)
76 (1.8)
2,030 (47.8)
*Study area includes all Census tract listed in Table 2-3, See Appendix A, Table A-1 for Census Tract data breakdown.
Source: 2010-2014 American Community Survey 5-Year Estimates
Note: Percentages may be greater than 100% due to rounding.

Community Impact Report
West Valley Connector Project 147
Household Characteristics
Table 5-2 shows selected household characteristics of the study area counties, cities, and
Census tracts. According to the U.S. Census Bureau definition, a household consists of all
people who occupy a housing unit regardless of relationship. A family consists of two or
more people (one of whom is the householder) related by birth, marriage, or adoption
residing in the same housing unit. As shown in Table 5-2, there are 77,465 households in
the project study area, with an average household size of 3.76 persons, which is higher than
county averages. Only the City of Fontana has a higher average overall at 4.06 persons per
household.
Table 5-2: Household Characteristics
Total
Population Total
Households
Average Household
size
Median Household
Income
Households with no vehicle
availability (%)
County
County of Los Angeles
9,974,203 3,242,391 3.02 $55,870 317,126
(9.8)
County of San Bernardino
2,078,586 607,604 3.34 $54,100 34,969 (5.8)
City
City of Pomona 151,142 38,894 3.77 $48,993 1,950 (3.9)
City of Montclair 37,685 10,336 3.60 $48,767 872 (8.4)
City of Ontario 166,892 45,680 3.64 $54,156 2,064 (4.5)
City of Rancho Cucamonga
170,170 55,410 3.01 $77,061 2,812 (7.2)
City of Fontana 201,355 49,438 4.06 $64,995 2,213 (4.0)
Study Area
Census Tracts* 284,621 77,465 3.76 $52,016 4,668 (6.0)
*Study area includes all Census tract listed in Table 2-3, See Appendix A, Table A-2 for Census Tract data breakdown.
Source: 2010-2014 American Community Survey 5-Year Estimates
Within the study area, there are 4,668 households without an automobile readily available,
or approximately 6.0 percent. These households are more likely to be dependent on public
transportation for travel. Broadening the analysis to the project corridor cities, there are
9,911 households without an automobile, or approximately 5.8 percent, much like San

Community Impact Report
148 West Valley Connector Project
Bernardino County averages. In Los Angeles County, on the other hand, almost 10 percent
of residents do not have access to an automobile.
According to 2010-2014 American Community Survey 5-Year Estimates data, most study
area residents use their car to drive to work (90 percent), which is comparable to San
Bernardino County’s 91 percent (ACS, 2014). Only 1.7 percent of county residents use
public transportation to commute to work, while approximately 3 percent of study area
residents utilize public transportation and a means of getting to work (ACS, 2014). Over
80 percent of residents in the area who use public transportation as a means of commuting
to work have travel times of more than half an hour (ACS, 2014). If their travel time to work
is less half an hour, then study area residents are more likely to use some other form of
transportation. The study area’s public transportation decisions are comparable to the other
areas studied for the proposed action.
Age
The transit-dependent population is largely comprised of the population under age 18 and
age 65 and older. The distribution of age groups is relatively constant among project corridor
cities and affected Census tracts, as reflected in Table 5-3. The transit-dependent working-
class population of the cities through which the proposed project would operate, defined as
those falling between the age range of 18 to 64, constitutes between 59 and 64 percent of
the population, similar the county averages. The percentage of Census tract study area
residents who represent the working class is similar with approximately 63.9 percent. The
elderly, defined as those above the age of 65, comprises 6.8 percent of the population,
which is lower than county and city averages, except for Fontana, where the elderly
population is 6.1 percent. Of the study area cities, Montclair has the highest elderly
population with 10.4 percent, while Fontana, as mentioned previously, has the lowest with
6.1 percent. Meanwhile, the proportion of study area youth, defined as those 17 years old
and under, is 29.3 percent, which is slightly higher than the surrounding cities except
Fontana, where the youth population is 33.9 percent.

Community Impact Report
West Valley Connector Project 149
Table 5-3: Age Distribution
Total (Percentage)
Median Age Population < 18
(%) Population 18-64
(%) Population > 65
(%)
County
Los Angeles County
2,639,637 (26.5)
6,184,673 (62.0)
1,149,893 (11.5)
35.3
San Bernardino County
650,781 (31.3)
1,228,043 (59.1)
199,762 (9.6)
32.2
City
Pomona 47,633 (31.5)
90,756 (60.0)
12,753 (8.4)
30.4
Montclair 10,936 (29.0)
22,817 (60.5)
3,932 (10.4)
33.2
Ontario 52,948 (31.7)
101,213 (60.6)
12,731 (7.6)
31.2
Rancho Cucamonga
46,596 (27.4)
108,331 (63.7)
15,243 (9.0)
35.2
Fontana 68,303 (33.9)
120,706 (59.9)
12,346 (6.1)
30.0
Study Area
Census Tracts* 83,519 (29.3)
181,902 (63.9)
19,200 (6.8)
30.4
*Study area includes all Census tract listed in Table 2-3, See Appendix A, Table A-3 for Census Tract data breakdown.
Source: U.S. Census Bureau, 2016.
Housing Characteristics
Housing characteristics are described in Table 5-4. Within the Census tract study area, the
majority of housing units are renter occupied at 50.6 percent, similar to the Los Angeles
County average (53.6 percent), but significantly higher than the average for San Bernardino
County (39.1 percent) and higher than among the five study area cities. Approximately
55.8 percent of study area residents live in single-family homes, which is more comparable
to the Los Angeles County Average of 50.4 percent than the 70.5 percent of San Bernardino
County residents who reside in single-family homes. Correspondingly, the amount of study
area residents who reside in multi-family housing units (39.6 percent) is higher than the San
Bernardino County average (23.7 percent), and lower than the Los Angeles County average
(48.1 percent). All study area cities have single-family home occupancy rates of ranging
between 58 and 64 percent, except for Fontana, which has a single-family home occupancy
rate of 78.6 percent.

Community Impact Report
150 West Valley Connector Project
Table 5-4: Housing Characteristics
Total Occupied Housing
Units
Tenure Type
Owner (%)
Renter (%)
Single-Family
Housing (%)
Multi-family Housing
(%)
Mobile Home
(%)
County
Los Angeles County
3,242,391 1,503,915
(46.4) 1,738,476
(53.6)
1,634,133
(50.4)
1,558,369 (48.1)
49,889 (1.5)
San Bernardino County
607,604 370,032 (60.9)
237,572 (39.1)
428,373 (70.5)
144,208 (23.7)
35,023 (5.8)
City
Pomona 38,894 20,468 (52.6)
18,426 (47.4)
24,340 (62.6)
12,893 (33.1)
1,661 (4.3)
Montclair 10,336 6,214 (60.1)
4,122 (39.9)
6,064 (58.7)
3,474 (33.6)
798 (7.7)
Ontario 45,680 24,991 (54.7)
20,689 (45.3)
27,260 (59.7)
16,375 (35.8)
2,045 (4.5)
Rancho Cucamonga
55,410 35,388 (63.9)
20,022 (36.1)
35,435 (64.0)
18,615 (33.6)
1,360 (2.5)
Fontana 49,438 32,413 (65.6)
17,025 (34.4)
38,878 (78.6)
9,548 (19.3)
1,012 (2.0)
Study Area
Census Tracts*
77,465 37,942 (49.0)
39,213 (50.6)
43,264 (55.8)
30,665 (39.6)
3,536 (4.6)
*Study area includes all Census tract listed in Table 2-3, See Appendix A, Table A-4 for Census Tract data breakdown.
Source: U.S. Census Bureau, 2016.
5.1.2 Environmental Consequences
The following identifies the potential impacts of the proposed project on the existing
communities and neighborhoods. Potential impacts associated with the project could include
the following:
• Restricting access or otherwise altering the way in which a community uses its
facilities; and
• Acquisition and/or displacement of community serving businesses and residents.
No Build Alternative
The No Build Alternative would maintain the current level of transit service along the project
corridor. The project would not be constructed; therefore, no impacts to community
character and cohesion would result from the No Build Alternative.

Community Impact Report
West Valley Connector Project 151
Permanent Impacts
BRT Corridor
Common to All Build Alternatives
The build alternatives would provide BRT service along a 35-mile-long corridor through five
cities. Local service on portions of Omnitrans Route 61 and 66 would continue at 60-minute
headways with 10-minute Rapid bus service in mixed-flow operation. Local service on the
portions of Route 61 and 66 not covered by the Rapid alignment would be equilibrated to the
demand on those portions of the route, with likely headways of 30 minutes for Route 61 and
20 minutes for Route 66. A more cohesive transit system would result from the project
because of more frequent service, new signage, improved pedestrian and bicycle facilities,
and connections with nearby intermodal land uses that would provide an integrated transit
rider experience, improving access to community centers and businesses along the corridor.
Stations would be designed in consultation with local jurisdictions to maximize cohesion of
the project with its surroundings.
With improved transit service along the project corridor, the build alternatives would provide
a benefit for the local communities. Residents would have improved access to community
facilities and businesses, and connections to the Metrolink system. Improved transit services
and anticipated higher transit ridership within the project corridor, may support increased
business activity in the study area providing benefits to corridor retail, service, restaurant,
and entertainment uses. Those employed in the study area would benefit from the improved
transit service through a more reliable and faster commute via transit.
Since the proposed BRT system would follow existing transportation corridors, neither of the
build alternatives would divide an established community or disrupt existing community
character. Minor changes to the community’s visual character and quality may occur as a
result of the build alternatives and associated stations. Implementation of the BRT system
would require some pavement widening and construction of new transit stops with new
lighting and signage.
Alternative A
Alternative A would not have any impacts not discussed in the ‘Common to All Build
Alternatives’ discussion above.
Alternative B
While no property acquisitions would be required for Alternative A, Alternative B would
require full and partial acquisitions of various nonresidential properties in the City of Ontario
(see Table 5-5).
Property acquisitions along Holt Boulevard between Benson Avenue and Vineyard Avenue
would result in the displacement of 61 established businesses. While efforts would be made

Community Impact Report
152 West Valley Connector Project
to relocate affected businesses in close proximity to their current location, the loss of
established businesses could have a minor affect to the local community character and
cohesion if the businesses were regular gathering spots of residents, or provided a unique
service to the community. See Section 5.4 for further discussion of property acquisition and
relocation.
Table 5-5: Potential Full Acquisitions
Type Alternative A Alternative B Single-Family Residence 0 4
Multi-Family Residence 0 10
Retail 0 33
Service 0 28
General Office 0 0
Light Industrial 0 0
Total Displaced Residents1 0 113
Total Displaced Employees2 0 61 – 1,220
1 Estimate for total number of displaced residents based on 2010 U.S. Census Data of average household size of 2.63. The actual numbers of affected occupants would be identified at the time of residential interviews, if conducted.
2 It is estimated the majority of businesses impacted are small employers and would have between 1 to 20 employees.
Source: OPC, 2017
Alternative B would include a dedicated center-running lane along Holt Boulevard, between
Benson Avenue and Vineyard Avenue, which would restrict left-turn movements for
motorists. The restricted turn movements would require motorists, including area residents,
to drive longer distances and take alternative routes to reach their destinations. The
dedicated BRT lanes would require the addition of new traffic signals to intersections along
the effected portion of Holt Boulevard, which would provide improved and safer pedestrian
connections in the area.
O&M Facility
Both alternatives would include construction of an O&M facility to support BRT vehicles
used for BRT service. Three potential sites have been identified for construction of the O&M
facility. Site 1, located on 1516 S. Cucamonga Avenue, is currently used as a public works
storage yard. Site 2, located on 1440 S. Cucamonga Avenue, is currently used as a CNG
fueling station. Site 3, located on 1333 S. Bon View Avenue, is currently used as a municipal
utility and customer service center. All three sites are owned by the City of Ontario and are
designated for Industrial use. SBCTA is expected to coordinate with the City of Ontario in its
site selection process. The O&M facility would not require additional property acquisitions
other than the three City-owned sites identified (see Section 2.3.3, Potential Sites) such that

Community Impact Report
West Valley Connector Project 153
it would displace existing population and housing. As such, no impact to population and
housing is expected as a result of the O&M facility.
Temporary Impacts
BRT Corridor
The build alternatives would be constructed almost entirely within existing transportation
ROW or on adjacent sidewalks. While some temporary construction easements may be
required for curb removal and utility connection work, access to local neighborhoods,
facilities, and businesses along the corridor would be maintained throughout the
construction period. Residences along the corridor are generally set back from the corridor,
behind commercial property. Generally, temporary impacts associated with the build
alternatives involve construction-related disruptions related to the operation of construction
equipment, including noise and vibration, light and glare, and fugitive dust emissions. In
addition, partial and/or complete lane and sidewalk closures would be required.
Construction-related impacts would generally be minor for a limited duration between 2018
and 2020, and localized as construction moves along the corridor, resulting in
inconveniences to motorists, pedestrians, businesses and residences in the immediate
vicinity of the construction activities.
Construction of the 3.5-mile-long stretch of dedicated transit lane along Holt Boulevard
associated with Alternative B, would require widening of the existing roadway in order to
accommodate two mixed-flow traffic lanes and one transit lane in each direction. In addition,
five center-running stations would be constructed in median in this area. Construction of this
segment has the potential to result in short-term effects to the surrounding neighborhood
and adjacent businesses due to temporary road closures and detours. Construction
activities are expected to include grading, excavation, road detours, and temporary road
closures.
Because through traffic and bicycle and pedestrian circulation would be maintained in each
direction during construction, project construction would not result in any new barriers or
otherwise impede community interaction. Temporary construction easements would be
required but they would not result in the displacement of any people, housing, or
businesses. Construction work is not anticipated to result in effects severe enough to
appreciably affect business transactions. The Transportation Management Plan (TMP)
would be developed prior to project approval to address temporary construction impacts in
advance. It may also be necessary to place crossing guards at affected intersections leading
to nearby schools when construction activities occur during school hours.
O&M Facility
Both alternatives would include construction of an O&M facility to support BRT vehicles
used for BRT service. The three potential sites that have been identified for construction of

Community Impact Report
154 West Valley Connector Project
the O&M facility are in an industrial area. Temporary impacts associated with construction of
the O&M facility would include noise, vibration, light and glare, and fugitive dust emissions.
The construction-related impacts would generally be minor for a limited duration between
2018 and 2020.This has the potential to result in short-term effects to the adjacent
businesses. Construction work is not anticipated to result in effects severe enough to
appreciably affect business transactions.
5.1.3 Avoidance, Minimization, and Mitigation Measures
The following measures will be implemented under the build alternatives to minimize and/or
mitigate community impacts.
ACQ-1. A Real Estate Acquisition Management Plan (RAMP) shall be developed
adhering to the requirements pertaining to land acquisition for projects funded
by FTA as prescribed in Volume 49 CFR Part 24, Uniform Relocation
Assistance and Real Property Acquisition Policies Act for Federal and
Federally Assisted Programs, and the California Relocation Assistance Act,
1970. All real property acquired for the project will be appraised to determine
fair market value. Just compensation, which shall not be less than the
approved appraisal, will be made to each displaced property owner.
Displacees who have met eligibility requirements will be provided relocation
assistance payments and advisory assistance in accordance with the Federal
Uniform Relocation Assistance and Real Property Acquisition Policies Act of
1970, as amended.
The RAMP will address the need to have relocation specialists who have prior
experience working with people who may have special needs, especially the
elderly, disabled, and low-income population groups. It will also specify that
one or more of the relocation specialists be fluent in Spanish. Additionally, the
plan will address coordinating with the local Section 8 Housing Authority on
the availability of vouchers and other options for displaced low-income
households who may face immediate financial hardships.
The RAMP will address in advance of potential relocations of minority-owned
businesses the need to coordinate with organizations such as the Inland
Empire Region of the California Hispanic Chamber of Commerce, Asian
Business Association – Inland Empire, and the Black Chamber of Commerce
of the Inland Empire, to identify resources that may be of help to such
businesses. The potential application of property lease-back options to allow
small businesses to continue to function as long as feasible after acquisition
will also be explored in the RAMP.

Community Impact Report
West Valley Connector Project 155
ACQ-2: Transportation for displaced persons to inspect potential relocation housing
will be offered at no cost should they be unable to use their own means of
transportation. This offer shall be extended to senior citizens, disabled
people, and any transit-dependent individuals or households
CI-TRA-1 SBCTA or its contractor shall prepare a TMP in cooperation with local
municipalities prior to construction. The TMP will be submitted with the
construction plan to the police and fire departments of affected cities prior to
commencement of construction activities. The TMP will outline necessary
street closures and detours. In addition, detours around construction areas
will be identified for bicyclists and pedestrians. Signs will be posted to direct
bicyclists and pedestrians to intersections where they may cross. A restriction
on large-size trucks shall be imposed to confine travel to and from the
construction site during off-peak commute times.
CI-TRA-2 Business access shall be maintained at all times during construction, and
work will be scheduled to avoid unnecessary inconvenience to the public and
abutting property owners. Undue delays in construction activities will be
avoided to reduce the public’s exposure to construction.
5.2 Economic Conditions
5.2.1 Affected Environment
According to the California County-Level Economic Forecast 2015-2040, Los Angeles County
is the largest county in California in terms of population, with 10.1 million people and 4.2
million wage and salary jobs. In 2014, there was a strong employment growth observed in
the labor market, though it was slightly slower than the broader Southern California region.
Employment growth in the county was led by education and healthcare (+38,400 jobs),
leisure and hospitality (+25,300 jobs), and professional and business services (+14,700).
Northern Los Angeles County (Santa Clarita and Antelope Valleys) serve as the fastest
growing areas of the county due to the large amount of buildable land available in the area.
San Bernardino County, along with Riverside County, comprises the Inland Empire, one of
the fastest-growing metro areas of the state and nation from 1997 to 2006. In 2014, total
employment increased by 4.4 percent, compared to just 2.6 percent in the state. Virtually all
major sectors were characterized by job growth. Over the long term, the Inland Empire is
expected to experience greater growth than the coastal counties, due largely to the
availability of land at lower costs (Caltrans, 2015).
Table 5-6 provides some key socioeconomic characteristics of the study area.

Community Impact Report
156 West Valley Connector Project
Table 5-6: Socioeconomic Characteristics
Total
Population
In Labor Force over
16 (%)
Per Capita Income
Individuals Below
Poverty Level (%)
Unemployed in Labor
Force (%)
Total Households
Average Family Size
Median Family Income
Families below
poverty level (%)
County
Los Angeles County
9,974,203 5,113,315
(51.3) $27,987
1,805,868 (18.4)
564,669 (11.0)
3,242,391 3.69 $62,289 317,522 (14.6)
San Bernardino County
2,078,586 944,000 (45.4)
$21,384 389,037 (19.2)
131,293 (13.9)
607,604 3.83 $59,626 70,427 (15.3)
City
Pomona 151,142 69,490 (46.0%
$17,041 33,247 (22.0)
8,975 (12.9)
38,894 4.22 $50,475 7,715 (18.4)
Montclair 37,685 18,075 (48.0)
$17,881 7,123 (18.9)
2,168 (12.0)
10,336 4.06 $51,184 1,192 (14.7)
Ontario 166,892 84,120 (50.4)
$18,601 30,316 (18.2)
10,948 (13.0)
45,680 4.14 $56,017 5,121 (14.8)
Rancho Cucamonga
170,170 91,984 (54.1)
$31,528 13,045 (7.7)
9,749 (10.6)
55,140 3.53 $88,529 1,850 (6.1)
Fontana 201,355 97,453 (48.4)
$19,685 32,133 (16.0)
14,222 (14.6)
55,140 4.36 $66,795 5,708 (13.9)
Study Area
Census Tracts*
284,621 135,821 (47.7)
$17,782 56,727 (19.9)
18,310 (13.3)
77,465 3.76 $53,824 9,918 (18.7)
*Study area includes all Census tract listed in Table 2-3, See Appendix A, Table A-5 for Census Tract data breakdown.
Source: U.S. Census Bureau, 2016.

Community Impact Report
West Valley Connector Project 157
Employment
According to the 2010-2014 American Community Survey 5-Year Estimates, 13.7 percent of
study area residents in the labor force are unemployed. This is comparable to the San
Bernardino County unemployment rate of 13.9 percent, but higher than the Los Angeles
County rate of 11.0 percent. The City of Fontana has the highest unemployment rate of
study corridor cities at 14.6 percent. Of those that are over the age of 16 within the study
area, 47.7 percent are part of the civilian labor force. This is higher than the San Bernardino
County average and lower than that of Los Angeles County. Among study corridor cities,
Rancho Cucamonga has the highest percentage of participation in the labor force (54.1
percent), while Fontana has the largest population of working citizens (97,453).
Income
According to 2010-2014 American Community Survey 5-Year Estimates data, the cities of
Pomona, Montclair, Ontario, and Fontana share similar per capita income averages, ranging
from $17,041 to $19,685, as shown in Table 5-6. Each of these four cities has per capita
incomes that are lower than the countywide averages of $27,987 and $21,384 for Los
Angeles and San Bernardino counties, respectively. The City of Rancho Cucamonga,
however, is an outlier, with an average per capita income significantly higher than the others
at $31,528. The per capita income in the study area is $17,782, which is much lower than
the two county averages and lower than any of the study area cities. However, there are a
few areas of the study area, particularly Census Tracts 20.28, 20.34, 20.35, and 20.36,
which have per capita incomes of over $30,000 (Appendix A, Table A-5).
Table 5-6 indicates that the median family income for the cities of Pomona, Montclair,
Ontario, and Fontana are all approximately $2,000 higher than their respective median
household incomes presented previously in Table 5-2. In comparison, the difference
between median family income and median household income is between $5,000 to $7,000
for the two study area counties and $11,000 for Rancho Cucamonga. One factor likely
contributing to the lower per capita income in Pomona, Montclair, Ontario, and Fontana is
the larger family sizes in those cities.
Poverty
The U.S Department of Health and Human Services (HHS) establishes the poverty
threshold on an annual basis. A family is considered low-income if its income is at or below
the HHS poverty threshold. In 2016, the poverty threshold for an average family size of four
was $24,300. As shown in Table 5-6, the average family size in the study area is 4.18 with a
corresponding median family income averaging $53,824, which is well above the HHS
established poverty threshold. While the study area as a whole is not considered to be at the
poverty level based on the HHS poverty threshold, 18.7 percent of families within the study
area are living below the federal poverty level as shown in Table 5-6. Compared to

Community Impact Report
158 West Valley Connector Project
14.6 percent and 15.3 percent of sub poverty level families in Los Angeles and San
Bernardino counties, respectively, the proportion of the population in the study area cities
living in poverty are similar, with the exception of the City of Rancho Cucamonga
(6.1 percent). At 18.4 percent, the City of Pomona has the highest percentage of families
living below the poverty level.
Mobility
Most study area residents use their car to drive to work (90 percent), which is comparable to
San Bernardino County’s 91 percent. Only 1.7 percent of county residents use public
transportation to commute to work, while approximately 2.8 percent of study area residents
utilize public transportation and a means of getting to work (American Community Survey
2014). According to 2010-2014 American Community Survey 5-Year Estimates Census
data, over 80 percent of residents in the area who use public transportation as a means of
commuting to work have travel times of more than half an hour. If their travel time to work is
less than half an hour, then study area residents are more likely to use some other form of
transportation. The study area’s public transportation decisions are comparable to other
SBCTA/Omnitrans service areas.
5.2.2 Environmental Consequences
No Build Alternative
The No Build Alternative would result in no material change in transit service and no change
in availability of jobs and overall economic conditions of the study area.
Permanent Impacts
BRT Corridor
Common to All Build Alternatives
The build alternatives would provide BRT service between several key regional destinations
with existing transit services, increasing bus service significantly as compared to present
conditions. The increased connectivity would result in time savings. Area residents and
workers would benefit from more reliable travel times and shorter bus headways, and
improved connectivity to regional transit facilities contributing to a net increase in economic
productivity. The addition of a new transit corridor may also potentially serve as a catalyst for
development within the project area which may stimulate the creation of jobs. Enhanced real
estate values and redevelopment opportunities are possible in areas surrounding the
stations.
Alternative A
No direct business activity impacts would result from implementation of Alternative A
because no businesses would be acquired.

Community Impact Report
West Valley Connector Project 159
Alternative B
Because 61 nonresidential displacements would result from the implementation of
Alternative B, a small portion of employees along the corridor could be affected. If a
business was relocated, but an employee did not choose or was unable to work at the new
business location, they could lose their employment. There may be a few instances where
relocated employees would be forced to travel further to their place of employment, resulting
in higher commuting costs. These employees could experience financial hardship as a result
of their place of employment being displaced. The project’s Real Estate Acquisition
Management Plan (RAMP) would fully comply with the Uniform Relocation Assistance and
Real Property Acquisition Policies Act, including providing relocation assistance payments
and counseling to persons and businesses affected by displacements resulting from the
project.
As discussed in Section 5.4, Relocations, and in further detail in the Draft Relocation Impact
Report, there are 61 nonresidential acquisitions that may be acquired as a result of
Alternative B. Based on current market research, there are comparable locations where
these businesses can be re-established. Relocation assistance payments and counseling
would be provided to persons and businesses subject to replacement in accordance with the
Uniform Relocation Act, as amended, and in conformance with all applicable regulations.
With feasible relocation options available, the economic impacts associated from
displacement of 61 nonresidential properties would not result in an adverse impact to the
study area.
Property taxes are levied on the assessed value of a privately-owned property. When
properties are permanently acquired for new transit facility ROW, the property tax base is
reduced. The removal of business operations and the acquisition of ROW for Alternative B
would result in the loss of property tax revenue for the City of Ontario. The City of Ontario’s
adopted property tax budget for 2015-2016 is $44,750,000 (Ontario, 2015). Given the size of
the annual budget, it is not anticipated that the removal of 61 nonresidential properties from
the tax roll would result in a significant decrease in the overall property tax revenue.
The proposed project would not create any permanent financial repercussions to the
economy of the proposed project corridor or surrounding area as a result of the proposed
project. No permanent secondary impacts would occur in the study area or nearby
communities. Beneficial impacts associated with improved public transportation service and
capacity could indirectly increase economic productivity along the project corridor and spur
further economic investment in the area.
O&M Facility
Both alternatives would include construction of an O&M facility to support BRT vehicles
used for BRT service. Three potential sites have been identified for construction of the O&M

Community Impact Report
160 West Valley Connector Project
facility. Site 1, located on 1516 S. Cucamonga Avenue, is currently used as a public works
storage yard. Site 2, located on 1440 S. Cucamonga Avenue, is currently used as a CNG
fueling station. Site 3, located on 1333 S. Bon View Avenue, is currently used as a municipal
utility and customer service center. All three sites are owned by the City of Ontario and are
designated for Industrial use. Construction of the O&M facility at Site 3, if selected, would
occur at the bottom portion of the parcel and avoid the existing customer service center
located on the north side of APN 1049-421-01-0000 and APN 1049-421-02-0000.
Construction of the O&M facility is not expected to result in displacement of businesses. As
such, no change in availability of jobs and overall economic conditions of the study area is
expected.
Temporary Impacts
BRT Corridor
During construction, access to businesses could be affected by street or driveway closures.
These street closures and subsequent detours could temporarily delay goods shipment,
affect business parking, and impede business access. The presence of construction
equipment and the temporary removal of signage could diminish the visibility of businesses
from local roadways. Access to some businesses situated in the immediate vicinity of the
project corridor could be restricted; however, access would be maintained at all times during
construction.
Construction of either build alternative could have a beneficial economic impact.
Construction could include purchases of local materials, goods and services required for
construction, and employment of local workers. The increased economic activity would also
prompt secondary economic activity such as construction-related business and economic
income is spent in sectors throughout the regional economy. Though the project would
result in increased short-term local employment and business activity, no permanent
employment or increase in business activity is anticipated as a result of construction
activities.
Temporary impacts should have little or no impact on property values in the project area
because the project would be constructed along an existing ROW, business access would
be maintained throughout construction, and temporary impacts would end when
construction of the proposed project is finalized.
O&M Facility
Both alternatives would include construction of an O&M facility to support BRT vehicles
used for BRT service. Three potential sites have been identified for construction of the O&M
facility. All three potential sites are located in an industrial area. There are no anticipated
street closures or detours during construction of the O&M facility. Access to surrounding
businesses is expected to remain at their current levels. The O&M facility is not expected to

Community Impact Report
West Valley Connector Project 161
result in increased or decreased economic activities for surrounding business. No
permanent or temporary employment numbers are anticipated as a result of construction
activities. Temporary impacts should have little to no impact on property values because
business access would be maintained throughout construction, and temporary impacts
would end when construction of the O&M facility is complete.
5.2.3 Avoidance, Minimization, and Mitigation Measures
Implementation of ACQ-1, ACQ-2, CI-TRA-1, and CI-TRA-2 would minimize economic
impacts within the study area.

Community Impact Report
162 West Valley Connector Project
5.3 Community Facilities and Services
5.3.1 Affected Environment
Community Facilities

Community Impact Report
West Valley Connector Project 163
Many community facilities and services are located near in the project corridor (

Community Impact Report
164 West Valley Connector Project
Figure 5-1), including fire protection and emergency medical services, law enforcement,
schools, and other public facilities (e.g., libraries, city halls, and post offices) that may be
affected by implementation of the proposed project. Table 5-7 and Table 5-8 lists the
community facilities located within 0.5 mile of the proposed West Valley Connector Project.
The identification numbers associated with each community facility in Table 5-7 and 5-8
correspond to the feature numbers in Figure 5-1.
The Pomona Civic Center, Ontario Civic Center, Ontario Convention Center, Ontario
International Airport, and Fontana Civic Center are all key community-serving facilities that
would be served by the proposed project.

Community Impact Report
West Valley Connector Project 165
This page intentionally left blank.

Community Impact Report
166 West Valley Connector Project
Figure 5-1: Community Facilities and Services (Sheet 1 of 10)

Community Impact Report
West Valley Connector Project 167
This page intentionally left blank.

Community Impact Report
168 West Valley Connector Project
Figure 5-1: Community Facilities and Services (Sheet 2 of 10)

Community Impact Report
West Valley Connector Project 169
This page intentionally left blank.

Community Impact Report
170 West Valley Connector Project
Figure 5-1: Community Facilities and Services (Sheet 3 of 10)

Community Impact Report
West Valley Connector Project 171
This page intentionally left blank.

Community Impact Report
172 West Valley Connector Project
Figure 5-1: Community Facilities and Services (Sheet 4 of 10)

Community Impact Report
West Valley Connector Project 173
This page intentionally left blank.

Community Impact Report
174 West Valley Connector Project
Figure 5-1: Community Facilities and Services (Sheet 5 of 10)

Community Impact Report
West Valley Connector Project 175
This page intentionally left blank.

Community Impact Report
176 West Valley Connector Project
Figure 5-1: Community Facilities and Services (Sheet 6 of 10)

Community Impact Report
West Valley Connector Project 177
This page intentionally left blank.

Community Impact Report
178 West Valley Connector Project
Figure 5-1: Community Facilities and Services (Sheet 7 of 10)

Community Impact Report
West Valley Connector Project 179
This page intentionally left blank.

Community Impact Report
180 West Valley Connector Project
Figure 5-1: Community Facilities and Services (Sheet 8 of 10)

Community Impact Report
West Valley Connector Project 181
This page intentionally left blank.

Community Impact Report
182 West Valley Connector Project
Figure 5-1: Community Facilities and Services (Sheet 9 of 10)

Community Impact Report
West Valley Connector Project 183
This page intentionally left blank.

Community Impact Report
184 West Valley Connector Project
Figure 5-1: Community Facilities and Services (Sheet 10 of 10)

Community Impact Report
West Valley Connector Project 185
This page intentionally left blank.

Community Impact Report
186 West Valley Connector Project
Table 5-7: Community Facilities within 0.5 Mile of the West Valley Connector Corridor
ID No.
Facility Name Address Map Sheet
No.
Religious Facilities
16 Bethel Assembly of God Church
9134 Mango Avenue, Fontana, CA 92335 Sheet
10 of 10
17 Calvary Baptist Church 9444 Mango Avenue, Fontana, CA 92335 Sheet
10 of 10
18 Ontario Spanish Seventh Day Adventist Church
316 W. B Street, Ontario, CA 91762 Sheet 3 of 10
19 Church of Christ 126 W. E Street, Ontario, CA 91762 Sheet 3 of 10
20 Church of God 686 S. Garey Avenue, Pomona, CA 91776
Sheet 1 of 10
21 Church of God of Montclair 10127 Ramona Avenue, Montclair, CA 91763
Sheet 2 of 10
22 Church of Secondo d'Asti Catholic Church
250 N. Turner Avenue, Ontario, CA 91761
Sheet 5 of 10
23 Community Church of God 628 William Street, Pomona, CA 91768 Sheet 1 of 10
24 Community Faith Center 8621 Juniper Avenue, Fontana, CA 92335
Sheet 9 of 10
25 Evangelical Assembly of God Church
705 S. Cypress Avenue, Ontario, CA 91762
Sheet 2 of 10
26 First American Baptist Church
8282 Upland Avenue, Fontana, CA 92335 Sheet 9 of 10
27 Purpose Church 601 N. Garey Avenue, Pomona, CA 91768
Sheet 1 of 10
28 Crosspoint Community Church
17244 Randall Avenue, Fontana, CA 92335
Sheet 10 of 10
29 First Christian Church 424 W. Holt Boulevard, Ontario, CA 91762
Sheet 3 of 10
30 First Church of Christ Scientist
599 N. Main Street, Pomona, CA 91768 Sheet 1 of 10
31 First Church of God 1233 E. Kingsley Avenue, Pomona, CA 91767
Sheet 1 of 10
32 First Presbyterian Church 401 N. Gibbs Street, Pomona, CA 91767 Sheet 1 of 10
33 First Presbyterian Church 9260 Mango Avenue, Fontana, CA 92335 Sheet
10 of 10
34 First United Methodist Church
9116 Sierra Avenue, Fontana, CA 92335 Sheet
10 of 10
35 Fontana Christian Center 14796 Arrow Route, Fontana, CA 92335 Sheet 8 of 10
36 Fontana Community Church 8316 Sierra Avenue, Fontana, CA 92335 Sheet 9 of 10
37 Fontana First Assembly of God Church
16580 San Bernardino Avenue, Fontana, CA 92335
Sheet 10 of 10

Community Impact Report
West Valley Connector Project 187
Table 5-7: Community Facilities within 0.5 Mile of the West Valley Connector Corridor
ID No.
Facility Name Address Map Sheet
No.
38 Living Way Christian Fellowship
16725 Valencia Avenue, Fontana, CA 92335
Sheet 9 of 10
39 Fontana Seventh Day Adventist Church
9236 Palmetto Avenue, Fontana, CA 92335
Sheet 10 of 10
40 Gloria Dei Lutheran Church 17220 Merrill Avenue, Fontana, CA 92335
Sheet 9 of 10
41 Heritage Church of the Nazarene
16866 Seville Avenue, Fontana, CA 92335
Sheet 9 of 10
42 Indonesian Seventh Day Adventist Church
422 N. Monterey Avenue, Ontario, CA 91764
Sheet 3 of 10
43 Korean Church of Pomona Valley
904 E. D Street, Ontario, CA 91764 Sheet 3 of 10
44 Lighthouse Ministry Community Church
8552 Rosena Avenue, Fontana, CA 92335
Sheet 9 of 10
45 Victory Outreach Pomona 177 W. Monterey Avenue, Pomona, CA 91767
Sheet 1 of 10
46 North Towne Christian Church
817 N. Towne Avenue, Pomona, CA 91767
Sheet 1 of 10
47 Our Lady of Guadalupe Roman Catholic Church
710 S Sultana Avenue, Ontario, CA 91761
Sheet 3 of 10
48 Our Lady of Lourdes Catholic Church
10191 Central Avenue, Montclair, CA 91763
Sheet 2 of 10
49 Pilgrim Congregational Church
600 N. Garey Avenue, Pomona, CA 91767
Sheet 1 of 10
50 Pilgrim Holiness Church 524 E. Pasadena Street, Pomona, CA 91767
Sheet 1 of 10
51 Pioneer Free Will Baptist Church
515 N. Allyn Avenue, Ontario, CA 91764 Sheet 3 of 10
52 Plum Avenue Baptist Church 312 E. Nevada Street, Ontario, CA 91761 Sheet 3 of 10
53 Primera Iglesia Church 709 S. Plum Avenue, Ontario, CA 91761 Sheet 3 of 10
54 Pomona Four Square Gospel Church
480 W. Monterey Avenue, Pomona, CA 91768
Sheet 1 of 10
55 Rock of Faith Foursquare 323 W. B Street, Ontario, CA 91762 Sheet 3 of 10
56 Community of Christ 315 W. Sunkist Street, Ontario, CA 91762 Sheet 3 of 10
57 Sacred Heart Church 12704 E. Foothill Boulevard, Rancho Cucamonga, CA 91739
Sheet 7 of 10
58 Saint George Catholic Church
505 N. Palm Avenue, Ontario, CA 91762 Sheet 3 of 10
59 Saint Joseph Catholic Church
17080 Arrow Boulevard, Fontana, CA 92335
Sheet 9 of 10
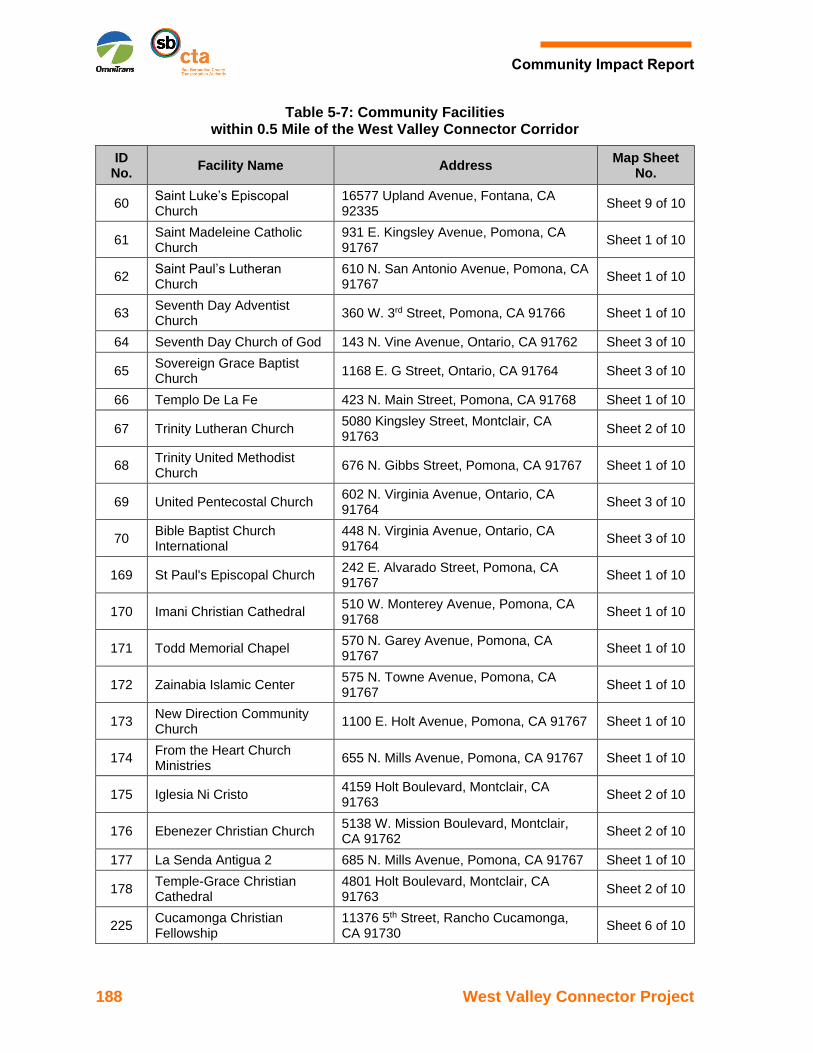
Community Impact Report
188 West Valley Connector Project
Table 5-7: Community Facilities within 0.5 Mile of the West Valley Connector Corridor
ID No.
Facility Name Address Map Sheet
No.
60 Saint Luke’s Episcopal Church
16577 Upland Avenue, Fontana, CA 92335
Sheet 9 of 10
61 Saint Madeleine Catholic Church
931 E. Kingsley Avenue, Pomona, CA 91767
Sheet 1 of 10
62 Saint Paul’s Lutheran Church
610 N. San Antonio Avenue, Pomona, CA 91767
Sheet 1 of 10
63 Seventh Day Adventist Church
360 W. 3rd Street, Pomona, CA 91766 Sheet 1 of 10
64 Seventh Day Church of God 143 N. Vine Avenue, Ontario, CA 91762 Sheet 3 of 10
65 Sovereign Grace Baptist Church
1168 E. G Street, Ontario, CA 91764 Sheet 3 of 10
66 Templo De La Fe 423 N. Main Street, Pomona, CA 91768 Sheet 1 of 10
67 Trinity Lutheran Church 5080 Kingsley Street, Montclair, CA 91763
Sheet 2 of 10
68 Trinity United Methodist Church
676 N. Gibbs Street, Pomona, CA 91767 Sheet 1 of 10
69 United Pentecostal Church 602 N. Virginia Avenue, Ontario, CA 91764
Sheet 3 of 10
70 Bible Baptist Church International
448 N. Virginia Avenue, Ontario, CA 91764
Sheet 3 of 10
169 St Paul's Episcopal Church 242 E. Alvarado Street, Pomona, CA 91767
Sheet 1 of 10
170 Imani Christian Cathedral 510 W. Monterey Avenue, Pomona, CA 91768
Sheet 1 of 10
171 Todd Memorial Chapel 570 N. Garey Avenue, Pomona, CA 91767
Sheet 1 of 10
172 Zainabia Islamic Center 575 N. Towne Avenue, Pomona, CA 91767
Sheet 1 of 10
173 New Direction Community Church
1100 E. Holt Avenue, Pomona, CA 91767 Sheet 1 of 10
174 From the Heart Church Ministries
655 N. Mills Avenue, Pomona, CA 91767 Sheet 1 of 10
175 Iglesia Ni Cristo 4159 Holt Boulevard, Montclair, CA 91763
Sheet 2 of 10
176 Ebenezer Christian Church 5138 W. Mission Boulevard, Montclair, CA 91762
Sheet 2 of 10
177 La Senda Antigua 2 685 N. Mills Avenue, Pomona, CA 91767 Sheet 1 of 10
178 Temple-Grace Christian Cathedral
4801 Holt Boulevard, Montclair, CA 91763
Sheet 2 of 10
225 Cucamonga Christian Fellowship
11376 5th Street, Rancho Cucamonga, CA 91730
Sheet 6 of 10

Community Impact Report
West Valley Connector Project 189
Table 5-7: Community Facilities within 0.5 Mile of the West Valley Connector Corridor
ID No.
Facility Name Address Map Sheet
No.
226 Apostolic Church 8719 Center Avenue, Rancho Cucamonga, CA 91730
Sheet 6 of 10
227 Mountain View Baptist Church
8440 Maple Place #105, Rancho Cucamonga, CA 91730
Sheet 6 of 10
228 Abundant Living Family Church
10900 Civic Center Drive, Rancho Cucamonga, CA 91730
Sheet 7 of 10
229 Calvary Faith Center Church 8301 Elm Avenue #600, Rancho Cucamonga, CA 91730
Sheet 7 of 10
230 Mountainview Faith Community Church
7986 Haven Avenue, Rancho Cucamonga, CA 91730
Sheet 7 of 10
231 The Church of Jesus Christ of Latter-Day Saints
8280 Utica Avenue #150, Rancho Cucamonga, CA 91730
Sheet 7 of 10
232 Calvary Chapel of Rancho Cucamonga
10700 Town Center Drive, Rancho Cucamonga, CA
Sheet 7 of 10
233 Vine Church 8351 Elm Avenue #108, Rancho Cucamonga, CA 91730
Sheet 7 of 10
234 Summit Ridge Church 11830 Sebastian Way, Rancho Cucamonga, CA 91730
Sheet 7 of 10
235 Purpose Church Rancho Cucamonga
12005 Jack Benny Drive, Rancho Cucamonga, CA 91739
Sheet 7 of 10
236 The Neighborhood Vineyard Church
11966 Jack Benny Drive Suite 104, Rancho Cucamonga, CA 91739
Sheet 7 of 10
237 Shield of Faith Family Church Fontana
13815 E. Foothill Boulevard, Fontana, CA 92335
Sheet 8 of 10
238 Rock Christian Church 14622 E. Foothill Boulevard, Fontana, CA 92335
Sheet 8 of 10
239 Great I Am 14189 E. Foothill Boulevard #102, Fontana, CA 92335
Sheet 8 of 10
240 Ministerios Tesoros Escondidos
8430 Cherry Avenue, Fontana, CA 92335 Sheet 8 of 10
241 Under His Wings Christian Fellowship
7950 Cherry Avenue #111, Fontana, CA 92336
Sheet 8 of 10
242 The Universal Church 8020 Citrus Avenue, Fontana, CA 92336 Sheet 9 of 10
243 Iglesia Cristiana El Sembrador CRC
8380 Cypress Avenue, Fontana, CA 92335
Sheet 9 of 10
244 Holy Spirit Power Ministries 7863 Sierra Avenue, Fontana, CA 92336 Sheet 9 of 10
245 Cornerstone Baptist Church 7716 Sierra Avenue, Fontana, CA 92336 Sheet 9 of 10
246 Kingdom Hall of Jehovah's Witnesses
10005 Cypress Avenue, Fontana, CA 92335
Sheet 10 of 10
Libraries
71 Fontana Lewis Library 8437 Sierra Avenue, Fontana, CA 92335 Sheet 9 of 10

Community Impact Report
190 West Valley Connector Project
Table 5-7: Community Facilities within 0.5 Mile of the West Valley Connector Corridor
ID No.
Facility Name Address Map Sheet
No.
72 Ovitt Family Community Library
215 E. C Street, Ontario, CA 91764 Sheet 3 of 10
73 Pomona Public Library 625 S. Garey Avenue, Pomona, CA 91766
Sheet 1 of 10
74 Law Library for San Bernardino County
8409 Utica Avenue, Rancho Cucamonga, CA 91730
Sheet 6 of 10
75 Rancho Cucamonga Public Library
12505 Cultural Center Drive, Rancho Cucamonga, CA 91739
Sheet 7 of 10
Post Offices
76 Downtown Station Ontario Post Office
123 W. Holt Boulevard, Ontario, CA 91762
Sheet 3 of 10
77 Fontana Post Office 8282 Sierra Avenue, Fontana, CA 92335 Sheet 9 of 10
78 Ontario Post Office 1555 E. Holt Boulevard, Ontario, CA 91761
Sheet 3 of 10
79 Pomona Post Office 580 W. Monterey Avenue, Pomona, CA 91769
Sheet 1 of 10
Train Stations
80 Fontana Train Station 16777 Orange Way, Fontana, CA 92335 Sheet 9 of 10
81 Ontario Train Station 198 E. Emporia Street, Ontario, CA 91764
Sheet 3 of 10
82 Pomona Train Station 100 W. Commercial Street, Pomona, CA 91768
Sheet 1 of 10
83 Rancho Cucamonga Train Station
11208 Azusa Court, Rancho Cucamonga, CA 91730
Sheet 6 of 10
Schools
84 Pomona Catholic High School
533 W. Holt Avenue, Pomona, CA, 91768 Sheet 1 of 10
85 Western University of Health Sciences
309 E. 2nd Street, Pomona, CA 91766 Sheet 1 of 10
86 Saint Pauls School 242 E. Alvarado Street, Pomona, CA 91767
Sheet 1 of 10
87 San Antonio Elementary School
855 E. Kingsley Avenue, Pomona, CA 91767
Sheet 1 of 10
88 Kingsley Elementary School 1170 Washington Avenue, Pomona, CA 91767
Sheet 1 of 10
89 Village Academy High School
1444 E. Holt Avenue, Pomona, CA 91767 Sheet 1 of 10
90 Park West High School 1460 E. Holt Avenue, Suite #100, Pomona, CA 91767
Sheet 1 of 10

Community Impact Report
West Valley Connector Project 191
Table 5-7: Community Facilities within 0.5 Mile of the West Valley Connector Corridor
ID No.
Facility Name Address Map Sheet
No.
91 Lehigh Elementary School 10200 Lehigh Avenue, Montclair, CA 91763
Sheet 2 of 10
92 Montera Elementary School 4825 Bandera Street, Montclair, CA 91763
Sheet 2 of 10
93 Kingsley Elementary School 5625 Kingsley Street, Montclair, CA 91763
Sheet 2 of 10
94 University of La Verne College of Law
440 N. Allyn Avenue, Ontario, CA 91764 Sheet 3 of 10
95 Ray Wiltsey Middle School 1450 E. G Street, Ontario, CA 91764 Sheet 3 of 10
96 Mariposa Elementary School 1605 E. D Street, Ontario, CA 91764 Sheet 3 of 10
97 Ontario Center School 835 N. Center Avenue, Ontario, CA 91764
Sheet 5 of 10
98 Argosy University Inland Empire
3401 N. Centre Lake Drive, #200, Ontario, CA 91761
Sheet 5 of 10
99 Platt College Ontario 3700 Inland Empire Boulevard, #400, Ontario, CA 91764
Sheet 5 of 10
100 Coyote Canyon Elementary School
7889 Elm Avenue, Rancho Cucamonga, CA 91730
Sheet 7 of 10
101 Terra Vista Elementary School
7497 Mountain View Drive, Rancho Cucamonga, CA 91730
Sheet 7 of 10
102 Sacred Heart Parish School 12676 E. Foothill Boulevard, Rancho Cucamonga, CA 91739
Sheet 7 of 10
103 Perdew Elementary School 13051 Miller Avenue, Etiwanda, CA 91739
Sheet 8 of 10
104 West Heritage Elementary School
13690 W. Constitution Way, Fontana, CA 92336
Sheet 8 of 10
105 East Heritage Elementary School
14250 E. Constitution Way, Fontana, CA 92336
Sheet 8 of 10
106 Almond Elementary School 8172 Almond Avenue, Fontana, CA 92335
Sheet 8 of 10
107 Almeria Middle School 7723 Almeria Avenue, Fontana, CA 92336
Sheet 9 of 10
108 Tokay Elementary School 7846 Tokay Avenue, Fontana, CA 92336 Sheet 9 of 10
109 Fontana Middle School 8425 Mango Avenue, Fontana, CA 92335 Sheet 9 of 10
110 Chaffey College 16855 Merrill Avenue, Fontana, CA 92335
Sheet 9 of 10
111 Desert Sands Charter High School
17244 Randall Avenue, Fontana, CA 92335
Sheet 10 of 10
112 Randall Pepper Elementary School
16613 Randall Avenue, Fontana, CA 92335
Sheet 10 of 10

Community Impact Report
192 West Valley Connector Project
Table 5-7: Community Facilities within 0.5 Mile of the West Valley Connector Corridor
ID No.
Facility Name Address Map Sheet
No.
113 Westech College 9460 Sierra Avenue, Fontana, CA 92335 Sheet
10 of 10
114 Cypress Elementary School 9751 Cypress Avenue, Fontana, CA 92335
Sheet 10 of 10
115 Upland Christian Academy 10900 Civic Center Drive, Rancho Cucamonga, CA 91730
Sheet 7 of 10
116 Lincoln Elementary School 440 N. Allyn Avenue, Ontario, CA 91764 Sheet 3 of 10
185 Our Lady of Lourdes School 5303 Orchard Street, Montclair, CA 91763
Sheet 2 of 10
Daycares
117 Kids First Christian Day Care
250 S. Parcels Street, Pomona, CA 91766
Sheet 1 of 10
118 Peace of Mind Preschool 240-250 S. Parcels Street, Pomona CA 91766
Sheet 1 of 10
119 YMCA Child Care Connection
676 N. Gibbs Street, Pomona, CA 91767 Sheet 1 of 10
120 Head Start-State Preschool 1460 E. Holt Avenue, #128, Pomona, CA 91767
Sheet 1 of 10
121 Inland Early Steps Services 1824 E. Elma Court, Ontario, CA 91764 Sheet 3 of 10
122 Tutor Time 3333 Concourse Street, #1201, Ontario, CA 91764
Sheet 5 of 10
123 Good Steward Day Care 9229 Utica Avenue, #160, Rancho Cucamonga, CA 91730
Sheet 6 of 10
124 Montessori Child Development
8196 Mulberry Avenue, Fontana, CA 92335
Sheet 8 of 10
125 Fontana KinderCare 16149 E. Foothill Boulevard, Fontana, CA 92335
Sheet 9 of 10
126 Weekday Nursery School 8316 Sierra Avenue, Fontana, CA 92335 Sheet 9 of 10
127 All Start Academy Inc. 10022 Palmetto Avenue, Fontana, CA 9235
Sheet 10 of 10
Regional Shopping Centers
128 Ontario Mills Mall 1 Mills Circle, Ontario, CA 91764 Sheet 5 of 10
129 Victoria Gardens 12505 N. Main Street, #200, Rancho Cucamonga, CA 91739
Sheet 7 of 10
179 Stater Bros. Markets
1045 N. Garey Avenue, Pomona, CA 91767
Sheet 1 of 10
180 Walgreens 495 E. Holt Avenue, Pomona, CA 91767 Sheet 1 of 10
181 Cardenas Market and other retail shops
690 E. Holt Avenue, Pomona, CA 91767 Sheet 1 of 10
182 Rite Aid 611 E. Holt Avenue, Pomona, CA 91767 Sheet 1 of 10

Community Impact Report
West Valley Connector Project 193
Table 5-7: Community Facilities within 0.5 Mile of the West Valley Connector Corridor
ID No.
Facility Name Address Map Sheet
No.
183 El Super and other retail shops
1575 E. Holt Avenue, Pomona, CA 91767 Sheet 1 of 10
184 Orchard Plaza
4480 Holt Boulevard, Montclair, CA 91763
Sheet 2 of 10
186 Stater Bros. Markets and other retail shops
646 W. Holt Boulevard, Ontario, CA 91762
Sheet 3 of 10
187 Ontario Gateway Center
4400 Ontario Mills Parkway, Ontario, CA 91764
Sheet 5 of 10
188 Marketplace at Ontario Center
951 N. Milliken Avenue, Ontario, CA 91764
Sheet 5 of 10
190 Valley Indoor Swap Meet 1600 Holt Boulevard, Pomona, CA 91767 Sheet 1 of 10
207 Foothill Marketplace
E. Foothill Boulevard and I-15, Rancho Cucamonga, CA 91739
Sheet 7 of 10
208 Terra Vista Town Center
10808 E. Foothill Boulevard #160, Rancho Cucamonga, CA 91730
Sheet 7 of 10
213 Foothill Plaza
16920 E. Foothill Boulevard, Fontana, CA 92336
Sheet 9 of 10
214 Fontana Village Shopping Center
16981 E. Foothill Boulevard, Fontana, CA 92335
Sheet 9 of 10
215 Stater Bros. Markets 8228 Sierra Avenue, Fontana, CA 92335 Sheet 9 of 10
216 Citrus Shopping Center
16108 E. Foothill Boulevard, Fontana, CA 92335
Sheet 9 of 10
219 Vineyard Valley Shopping Center
Valley Boulevard and Sierra Avenue, Fontana, CA 92335
Sheet 10 of 10
220 Palm Court Shopping Center
16920 Slover Avenue, Fontana, CA 92337
Sheet 10 of 10
221 Sierra Plaza South Shopping Center
9954 Sierra Avenue, Fontana, CA 92335 Sheet
10 of 10
222 Inland Empire Center
16721 Valley Boulevard, Fontana, CA 92335
Sheet 10 of 10
Civic Centers
130 Pomona Civic Center 400 Civic Center Plaza, Pomona, CA 91766
Sheet 1 of 10
131 Ontario Civic Center 303 E. B Street, Ontario, CA 91764 Sheet 3 of 10
132 Fontana Civic Center 8353 Sierra Avenue, Fontana, CA 92335 Sheet 9 of 10
206 Rancho Cucamonga Civic Center
10500 Civic Center Drive, Rancho Cucamonga, CA 91730
Sheet 7 of 10
Hospitality
133 Ontario Convention Center 2000 E. Convention Center Way, Ontario, CA 91764
Sheet 3 of 10

Community Impact Report
194 West Valley Connector Project
Table 5-7: Community Facilities within 0.5 Mile of the West Valley Connector Corridor
ID No.
Facility Name Address Map Sheet
No.
134 Citizens Bank Arena 4000 Ontario Center, Ontario, CA 91764 Sheet 5 of 10
Airport
135 Ontario International Airport 2500 E Airport Drive, Ontario, CA 91761 Sheet 5 of 10
Golf Courses
136 Empire Lakes Golf Course (To be redeveloped as mixed-use)
11015 6th Street, Rancho Cucamonga, CA 91730
Sheet 6 of 10
Parks
137 Memorial Park 502 E. Franklin Avenue, Pomona, CA 91766
Sheet 1 of 10
138 Centennial Park 246 S. Gibbs Street, Pomona, CA 91776 Sheet 1 of 10
139 Garfield Park 501-599 Arboleda Way, Pomona, CA 91766
Sheet 1 of 10
140 Sunset Park 4351 Orchard Street, Montclair, CA 91763
Sheet 2 of 10
141 Saratoga Park 5363 Kingsley Street, Montclair, CA 91763
Sheet 2 of 10
142 Kingsley Park 5575 Kingsley Street, Montclair, CA 91763
Sheet 2 of 10
143 James R. Bryant Park 632 W. D Street, Montclair, CA 91763 Sheet 2 of 10
144 Euclid Avenue Parkway 331 N. Euclid Avenue, Ontario, CA 91762 Sheet 3 of 10
145 Ontario Dog Park 415 W. Transit Street, Ontario, CA 91762 Sheet 3 of 10
146 Nugent’s Park 225 S. Euclid Avenue, Ontario, CA 91762 Sheet 3 of 10
147 Sam Alba Park 550-598 S. Cherry Avenue, Ontario, CA 91761
Sheet 3 of 10
148 Veterans Memorial Park 1235 E. D Street, Ontario, CA 91764 Sheet 3 of 10
149 James Galanis Park 1263-1271 E. Nocta Street, CA 91764 Sheet 3 of 10
150 Carpenter’s Union Park 3250 E. Shelby Street, Ontario, CA 91764 Sheet 5 of 10
151 Cucamonga-Guasti Regional Park
800 N. Archibald Avenue, Ontario, CA 91764
Sheet 5 of 10
152 Ontario Motor Speedway Park
915 N. Center Avenue, Ontario, CA 91764
Sheet 5 of 10
153 Ralph M. Lewis Park 7898 Elm Street, Rancho Cucamonga, CA 91730
Sheet 7 of 10
154 West Greenway Park 7889 Elm Avenue, Rancho Cucamonga, CA 91730
Sheet 7 of 10
155 Milliken Park 7699 Milliken Avenue, Rancho Cucamonga, CA 91730
Sheet 7 of 10

Community Impact Report
West Valley Connector Project 195
Table 5-7: Community Facilities within 0.5 Mile of the West Valley Connector Corridor
ID No.
Facility Name Address Map Sheet
No.
156 Mountain View Park 11701 Terra Vista Parkway, Rancho Cucamonga, CA 91730
Sheet 7 of 10
157 Victoria Arbors Park 7429 Arbor Lane, Rancho Cucamonga, CA 91739
Sheet 7 of 10
158 Garcia Park 13150 Garcia Drive, Rancho Cucamonga, CA 91730
Sheet 8 of 10
159 Patricia Murray Park 8040 Jamestown Circle, Fontana, CA 92336
Sheet 8 of 10
160 McDermontt Sports Complex& McDermontt Park West
7846 S. Heritage Circle, Fontana, CA 92336
Sheet 8 of 10
161 Northgate Park 7800 Celeste Avenue, Fontana, CA 92336
Sheet 9 of 10
162 Bill Martin Park 7881 Juniper Avenue, Fontana, CA 92336
Sheet 9 of 10
163 Cypress Park 8380 Cypress Avenue, Fontana, CA 92336
Sheet 9 of 10
164 Seville Park 16501-16549 Seville Avenue, Fontana, CA 92336
Sheet 9 of 10
165 Miller Park 17004 Arrow Boulevard, Fontana, CA 92336
Sheet 9 of 10
166 Santa Fe Park 16823-16849 Orange Way, Fontana, CA 92335
Sheet 9 of 10
167 Veteran’s Park 17255 Merrill Avenue, Fontana, CA 92335
Sheet 9 of 10
168 Jack Bulik Park 16851 Filbert Street, Fontana, CA 92335 Sheet 1 0 of 10
205 Epicenter/Adult Sports Complex
8408 Rochester Avenue, Rancho Cucamonga, CA 91730
Sheet 7 of 10
247 Bon View Park 1010 S. Bon View Ave, Ontario, CA 91761
Sheet 4 of 10
Emergency Services
In addition to places of worship, schools, and parks, there are eight fire stations, four police
stations, and 26 hospitals or clinics located within 0.5 mile of the project alignment, as

Community Impact Report
196 West Valley Connector Project
shown in

Community Impact Report
West Valley Connector Project 197
Figure 5-1. Table 5-8 lists these emergency service related facilities. Hospitals or Clinics
include hospitals, urgent care facilities, as well as medical facilities listed as clinics.
Table 5-8: Emergency Services within 0.5 Mile of the West Valley Connector Corridor
ID No. Facility Name Address Map Sheet No.
Fire
1 Ontario Fire Station Number 1 425 East "B" Street, Ontario, CA 91764 Sheet 3 of 10
2 Ontario Fire Station Number 8 3429 E. Shelby Street, Ontario, CA 91761
Sheet 5 of 10
3 Montclair Fire Station Number 2 10825 Monte Vista Avenue, Montclair, CA 91763
Sheet 2 of 10
4 Rancho Cucamonga Fire Station #4
11297 Jersey Boulevard, Rancho Cucamonga, CA 91730
Sheet 6 of 10
5 Fontana - Station 71 16980 Arrow Boulevard, Fontana, CA 92335
Sheet 9 of 10
6 Fontana - Station 73 14360 Arrow Boulevard, Fontana, CA 92335
Sheet 8 of 10
7 Los Angeles County Fire Station Number 181
590 South Park Avenue, Pomona, CA 91766
Sheet 1 of 10
8 Los Angeles County Fire Station Number 183
710 North San Antonio, Pomona, CA 91767
Sheet 1 of 10
Police
9 City of Fontana Police Department
17005 Upland Avenue, Fontana, CA 92335
Sheet 9 of 10
10 Pomona Police Department 490 W Mission Boulevard, Pomona, CA 91766
Sheet 1 of 10
11 Rancho Cucamonga Police Department
10510 Civic Center Drive, Rancho Cucamonga, CA 91730
Sheet 7 of 10
12 (855) Rancho Cucamonga CHP Office
9530 Pittsburgh Avenue, Rancho Cucamonga, CA 91730
Sheet 6 of 10
Hospitals or Clinics
13 Kindred Hospital - Ontario 550 N. Monterey Avenue, Ontario, CA 91764
Sheet 3 of 10
14 Kindred Hospital - Rancho 10841 White Oak Avenue, Rancho Cucamonga, CA 91730
Sheet 7 of 10
15 Kaiser Permanente - Fontana Medical Center
9961 Sierra Avenue, Fontana, CA 92335 Sheet 10 of 10
189 Rite Medical Clinic Urgent Care 502 W. Holt Avenue, Pomona, CA 91768 Sheet 1 of 10
191 California Medical Clinic 402 E. Holt Boulevard, Ontario, CA 91761
Sheet 3 of 10
192 Pomona Youth & Teens Clinic 502 W. Holt Avenue, Pomona, CA 91768 Sheet 1 of 10
193 Clinica Medica Familiar De 10563 S. Mills Avenue, Montclair, CA 91763
Sheet 1 of 10

Community Impact Report
198 West Valley Connector Project
Table 5-8: Emergency Services within 0.5 Mile of the West Valley Connector Corridor
ID No. Facility Name Address Map Sheet No.
194 DBH Walk-In Clinics 2940 Inland Empire Boulevard, Ontario, CA 91764
Sheet 5 of 10
195 California Health Clinic 5461 Holt Boulevard #H, Montclair, CA 91763
Sheet 2 of 10
196 Tuan Le Medical Clinic 1151 E. Holt Avenue #Q, Pomona, CA 91767
Sheet 1 of 10
197 Healthcare Medical Clinic 822 N. Garey Avenue, Pomona, CA 91767
Sheet 1 of 10
198 Merced Medical Clinic 240 S. Main Street, Pomona, CA 91766 Sheet 1 of 10
199 Urban Medical Clinic 586 E. Mission Boulevard, Pomona, CA 91766
Sheet 1 of 10
200 Molina Medical Clinic - Pomona 887 E. 2nd Street, Pomona, CA 91766 Sheet 1 of 10
201 Health Clinic Salud and Familia 1019 E. Holt Avenue, Pomona, CA 90767
Sheet 1 of 10
202 Pomona Valley Hospital Medical Center
9190 Haven Avenue, Rancho Cucamonga, CA 91730
Sheet 6 of 10
203 Concentra Urgent Care 9405 Fairway View Place, Rancho Cucamonga, CA 91730
Sheet 6 of 10
204 Rancho Cucamonga VA Clinic 8599 Haven Avenue #102, Rancho Cucamonga, CA 91730
Sheet 6 of 10
209 Hampton Medical Clinic 7777 Milliken Avenue #120, Rancho Cucamonga, CA 91730
Sheet 7 of 10
210 Mountain View Urgent Care 8250 White Oak Avenue, Rancho Cucamonga, CA 91730
Sheet 7 of 10
211 Foothill Family Medical Clinic 13677 E. Foothill Boulevard #Q, Fontana, CA 92335
Sheet 8 of 10
212 West Point Medical Center 7774 Cherry Avenue, Fontana, CA 92336
Sheet 8 of 10
217 Metropolitan Family Clinic 7965 Sierra Avenue, Fontana, CA 92336 Sheet 9 of 10
218 El Carmen Medical Clinic 16980 E. Foothill Boulevard, Fontana, CA 92335
Sheet 9 of 10
223 California Medical Clinic 16701 Valley Boulevard, Fontana, CA 92335
Sheet 10 of 10
224 Clinica Medica Familiar 9790 Sierra Avenue, Fontana, CA 92335 Sheet 10 of 10
Fire protection and emergency services are jointly provided by the respective jurisdictions
and the County, depending on the location of the emergency. In addition, each municipality
contracts its emergency service transportation services to private ambulance companies.

Community Impact Report
West Valley Connector Project 199
5.3.2 Environmental Consequences
No Build Alternative
The No Build Alternative would maintain the current level of transit service along the project
corridor. The project would not be constructed; therefore, the existing multimodal
transportation system would not be improved. Emergency response times in the area would
be expected to continue to worsen as congestion increases.
Permanent Impacts
BRT Corridor
Common to All Build Alternatives
Because the project would operate within the existing transportation ROW and none of the
community or emergency service facilities would be relocated as a result of the build
alternatives, no long-term operational effects on identified community and emergency
service facilities would occur. Emergency vehicles would be unrestricted in their ability to
access any property along the project corridor. With implementation of a build alternative,
transit service would be improved, thereby improving access to community facilities.
Alternative A
Alternative A would not result in any property acquisitions. Permanent impacts to community
facilities are not anticipated.
Alternative B
Alternative B would permanently impact 0.09 acre of the U.S. Post Office at 1555 E. Holt
Boulevard in the City of Ontario. Although the acquisition area would affect the sidewalk and
reduce a landscaped area of the property, it would not inhibit existing operation of postal
services at the property.
O&M Facility
The three potential sites for the O&M facility are located within existing City-owned parcels.
No impacts to community facilities are expected from construction of the O&M facility at
Sites 1 and 2. Site 3 is currently being used as a utility and customer services center for the
Ontario Municipal Utilities Company. Impacts to the customer services center are expected
to be avoided given that proposed plans call for the O&M facility to be constructed at the
bottom half of this parcel, avoiding the customer services center located on the north side of
APN 1049-421-01-0000 and APN 1049-421-02-0000. As such, permanent impacts to
community facilities resulting from construction of the O&M facility are not anticipated.

Community Impact Report
200 West Valley Connector Project
Temporary Impacts
BRT Corridor
The build alternatives could affect access to community facilities and businesses during
construction. These disruptions would be related primarily to operation of construction
equipment in the area, partial and/or complete lane closures, noise and vibration, light and
glare, and fugitive dust emissions. Because project construction activities would be
temporary, no long-term or permanent adverse effects on nearby community facilities are
expected to result. Nonetheless, efforts would be made to regularly inform the community
about construction activities through implementation of the TMP (CI-TRA-1) proposed as
part of the project. Construction activities would be coordinated with local police and fire
departments to ensure that emergency service response times remain unaffected during
construction. The TMP would require coordination and development of alternate emergency
response routes as needed. Similarly, the TMP would require maintenance of emergency
access to all properties throughout the construction period. It may also be necessary to
place crossing guards at affected intersections leading to nearby schools when construction
activities occur during school hours.
In addition, under Alternative B, a 0.07-acre TCE would be required at the U.S. Post Office
at 1555 E. Holt Boulevard in the City of Ontario that would affect landscaping and driveway
access. Although the TCE may temporarily reduce driveway access, the easement would be
limited in scope and would not inhibit U.S. Postal Service or public utilization of that
driveway. The driveway would be reconfigured and new landscaping would be incorporated
after the conclusion of the temporary use.
O&M Facility
Both alternatives would include construction of an O&M facility to support BRT vehicles
used for BRT service. Three potential sites have been identified for construction of the O&M
facility. All three sites are located in an industrial area of the City of Ontario. Disruptions in
access to community facilities and businesses during construction are not anticipated;
however, construction equipment could result in noise and vibration, light and glare, and
fugitive dust emissions. Because project construction activities would be temporary, and the
potential sites are located in an industrial area away from community facilities, no long-term
or permanent adverse effects on nearby community facilities are expected to result. No
TCEs are required during construction of the O&M facility.
5.3.3 Avoidance, Minimization, and Mitigation Measures
Project impacts to community facilities would not inhibit existing uses or operation of
services. Implementation of measure CI-TRA-1 would minimize potential impacts to
emergency service response times during construction.

Community Impact Report
West Valley Connector Project 201
5.4 Relocations
5.4.1 Affected Environment
The analysis of project-related relocations is focused on the portion of the project alignment
with dedicated BRT lanes where the dedicated lanes would require roadway widening and
permanent right-of-way acquisition. This area encompasses part of the city of Ontario along
the north and south sides of Holt Boulevard between Benson Avenue and Vine Avenue and
between Euclid Avenue and Vineyard Avenue. The portion of Holt Boulevard with the
dedicated lanes predominantly consists of commercial and industrial land uses with some
mixed use, multi-family and single-family residential land uses interspersed. It is anticipated
that the following displacements shall occur:
• Single-family residential units on the south side of Holt Boulevard between Campus
Avenue and Bon View Avenue.
• Mixed use single / multi-family residential and commercial / industrial units on the south
side of Holt Boulevard between North Monterey Avenue to just east of Bon View
Avenue.
• Miscellaneous commercial retail, restaurants, and office uses on both sides of Holt
Boulevard throughout the entire dedicated lanes segment of the project alignment.
5.4.2 Environmental Consequences
No Build Alternative
The No Build Alternative would maintain the current level of transit service in the study area.
Under the No Build Alternative, the project would not be constructed, and no relocations
would be required.
Build Alternatives
BRT Corridor
Alternative A
Implementation of Alternative A would not directly affect public or privately-owned properties
because no right-of-way acquisition would be needed and therefore, no relocations would be
required.
Alternative B
Implementation of Alternative B and the dedicated BRT lane along Holt Boulevard would
require roadway widening and permanent right-of-way acquisition resulting in relocation of
residential, commercial, and industrial/manufacturing uses. Based on 30% preliminary
engineering design, 37 parcels are being proposed for full acquisition under Alternative B. A
single parcel may have multiple residential properties and/or commercial business

Community Impact Report
202 West Valley Connector Project
properties. Within the 37 parcels, there are 14 residential properties and 61 nonresidential
properties, including 53 commercial businesses and 8 industrial/manufacturing businesses.
Partial acquisition of 168 parcels is also being considered, which consists of narrow slivers
of additional ROW to accommodate bus stations and minor roadway widening. Partial
acquisitions would include residential and commercial business properties. In addition,
Alternative B would require TCEs of 54 parcels, and would impact 3 parcels of parking
facilities within the City ROW. The discussion provided below for Alternative B consist of
acquisition properties that would result in relocation of residents and business. Table 5-9
below shows a list of proposed parcel acquisition under Alternative B.
Table 5-9: List of Full Parcel Acquisition (Alternative B)
APN1 Address2 Business Name2 Use Type2 ROW
Impacts3
101114111 925 W. Holt Boulevard Vacant Full parcel acquisition
104852209 523 E. Holt Boulevard A Little John's Appliances Shopping centers
Full parcel acquisition
523 E. Holt Boulevard B Botanica El Salvador Shopping centers
Full parcel acquisition
523 E. Holt Boulevard C Herbalife Club Ponte Saludable Hoy
Shopping centers
Full parcel acquisition
104852210 517 E. Holt Boulevard Vacant Full parcel acquisition
104852519 639 E. Holt Boulevard Nissi Market Place Retail sales Full parcel acquisition
104901105 739 W. Holt Boulevard Amigos Speedo Liquor Shopping centers
Full parcel acquisition
741 W. Holt Boulevard Pupuseria Gladys Restaurant
Shopping centers
Full parcel acquisition
104901106 739 W. Holt Boulevard Parking lot Full parcel acquisition
104851220 727 E. Holt Boulevard Donut Palace Retail sales Full parcel acquisition
104851222 717 E. Holt Boulevard 1 Stop Electronics Sales and Services
Retail sales Full parcel acquisition
104906301 204 E. Holt Boulevard Three Star Janitorial Warehouse
Automotive uses
Full parcel acquisition
104906302 214 E. Holt Boulevard Vacant Full parcel acquisition
104906303 220 E. Holt Boulevard Rojas Enterprise Retail sales Full parcel acquisition
104906304 222 E. Holt Boulevard Unit A
Rojas Enterprise Retail sales Full parcel acquisition
104906304 222 E. Holt Boulevard Unit B
4 Paws Boutique Retail sales Full parcel acquisition

Community Impact Report
West Valley Connector Project 203
Table 5-9: List of Full Parcel Acquisition (Alternative B)
APN1 Address2 Business Name2 Use Type2 ROW
Impacts3
104906305 226 E. Holt Boulevard ABBA Insurance Services
Retail sales Full parcel acquisition
228 E. Holt Boulevard Scissors Hair Salon Retail sales Full parcel acquisition
230 E. Holt Boulevard Enrique Income Tax Retail sales Full parcel acquisition
104906602 444 E. Holt Boulevard Floor Covering Inc Retail sales Full parcel acquisition
104909101 500 E. Holt Boulevard Los Amigos Mexican Food
Retail sales Full parcel acquisition
504 E. Holt Boulevard Jasmines Beauty Salon Retail sales Full parcel acquisition
504 E. Holt Boulevard Computer & TV Repair Retail sales Full parcel acquisition
506 E. Holt Boulevard Rositas Income Tax Retail sales Full parcel acquisition
510 E. Holt Boulevard 99 Cent Plus Menos Discount
Retail sales Full parcel acquisition
104909104 526 E. Holt Boulevard Unit A
Huera's Party Supply & Rental
Retail sales Full parcel acquisition
527 E. Holt Boulevard Unit B
Unique Bouquets Retail sales Full parcel acquisition
528 E. Holt Boulevard Unit C
Huera's Party Supply & Rental
Retail sales Full parcel acquisition
104909301 616 E. Holt Boulevard Residential single-family
Full parcel acquisition
104909302 624 E. Holt Boulevard Christina's Bakery Panaderia
Shopping centers
Full parcel acquisition
Exito Beauty Salon Shopping centers
Full parcel acquisition
104909303 630 E. Holt Boulevard Parking lot Full parcel acquisition
104909304 Vacant Full parcel acquisition
104909306 636 E. Holt Boulevard AVR Van Rental Retail sales Full parcel acquisition
104909307 Vacant Full parcel acquisition
104909309 640 E. Holt Boulevard Xavier's Batteries Retail sales Full parcel acquisition
104909401 652 E. Holt Ave Vacant Full parcel acquisition

Community Impact Report
204 West Valley Connector Project
Table 5-9: List of Full Parcel Acquisition (Alternative B)
APN1 Address2 Business Name2 Use Type2 ROW
Impacts3
104909402 654 E. Holt Boulevard E-Z Finance Auto Sales Vacant Full parcel acquisition
104909404 664 E. Holt Boulevard Cagles Appliance Center
Retail sales Full parcel acquisition
666 E. Holt Boulevard Cagles Appliance Center
Retail sales Full parcel acquisition
104909414 660 E. Holt Boulevard Vacant Full parcel acquisition
104910105 728 E. Holt Boulevard Residential single-family
Full parcel acquisition
730 E. Holt Boulevard #1
Residential single-family
Full parcel acquisition
730 E. Holt Boulevard #1
Residential single-family
Full parcel acquisition
730 E. Holt Boulevard #3
Residential single-family
Full parcel acquisition
730 E. Holt Boulevard #4
Residential single-family
Full parcel acquisition
730 E. Holt Boulevard #5
Residential single-family
Full parcel acquisition
732 1/2 E. Holt Boulevard
Residential single-family
Full parcel acquisition
104910106 736 E. Holt Boulevard Las Rosales Smoke Grill Retail sales Full parcel acquisition
740 E. Holt Boulevard Residential single-family
Full parcel acquisition
104910107 744 E. Holt Boulevard Regia Flowers Retail sales Full parcel acquisition
745 E. Holt Boulevard Cals Mini Mart Retail sales Full parcel acquisition
742 E. Holt Boulevard Residential single-family
Full parcel acquisition
104910109 754 E. Holt Boulevard Vacant Full parcel acquisition
104910111 766 E. Holt Boulevard Griffith Radiator Services
Retail sales Full parcel acquisition
104910112 802 E. Holt Boulevard J & V Auto Parts & Accessories
Retail sales Full parcel acquisition
104910113 810 E. Holt Boulevard Basic Auto Repair Automotive uses
Full parcel acquisition
104910114 814 E. Holt Boulevard Dance Studio Retail sales Full parcel acquisition

Community Impact Report
West Valley Connector Project 205
Table 5-9: List of Full Parcel Acquisition (Alternative B)
APN1 Address2 Business Name2 Use Type2 ROW
Impacts3
104910118 828 E. Holt Boulevard Raul's Auto Trim Automotive uses
Full parcel acquisition
Alonso's Barber Retail sales Full parcel acquisition
104913105 930 E. Holt Boulevard Zapateria California Retail sales Full parcel acquisition
932 E. Holt Boulevard Unit A
Navas Beauty Salon & Barber
Retail sales Full parcel acquisition
932 E. Holt Boulevard Unit B
Residential single-family
Full parcel acquisition
932 E. Holt Boulevard Unit C
Residential single-family
Full parcel acquisition
932 E. Holt Boulevard Unit D
Residential single-family
Full parcel acquisition
932 E. Holt Boulevard Unit E
Residential single-family
Full parcel acquisition
932 E. Holt Boulevard Unit F
Residential single-family
Full parcel acquisition
Notes 1 Assessor Parcel Number (APN). Multiple addresses may be associated with a single APN. 2 Addresses, business names, and land use type were field verified in June 2016. 3 ROW impact description corresponds with labels on project impact exhibits.
Source: OPC, 2017.
Alternative B would require the relocation of 14 residential units, including four single-family
residences and 10 multi-unit residences. Based on preliminary analysis provided in the Draft
Relocation Impact Report (OPC, 2017) prepared for the project, all the affected residential
displacements are tenant occupied rather than owner occupied. It is estimated that average
number of persons affected is 2.63 per household for a total of 113 persons. The actual
numbers of affected occupants would be identified at the time of residential interviews, if
conducted.
The total non-residential displacements is 61, including 53 commercial businesses and eight
industrial/manufacturing businesses. Of those 61 non-residential displacements, seven are
strip commercial, 33 are small shop-center businesses, one regional center, 10 single
structure businesses, and 10 mixed-use facilities.
O&M Facility
Both alternatives would include construction of an O&M facility to support BRT vehicles
used for BRT service. Three potential sites have been identified for construction of the O&M
facility, all of which are owned by the City of Ontario. Site 1, located on 1516 S. Cucamonga

Community Impact Report
206 West Valley Connector Project
Avenue, is currently used as a public works storage yard. Site 2, located on 1440 S.
Cucamonga Avenue, is currently used as a CNG fueling station. Site 3, located on 1333 S.
Bon View Avenue, is currently used as a municipal utility and customer service center. While
the proposed O&M facility would be constructed at the bottom portion of the parcel
containing the customer service center, the existing customer service center may be
removed. If relocation is required, the City will manage the relocation.
5.4.3 Avoidance, Minimization, and Mitigation Measures
Those displaced tenants who have met eligibility requirements will be provided relocation
assistance payments and advisory assistance in accordance with the Federal Uniform
Relocation Assistance and Real Property Acquisition Policies Act of 1970 (URA) and the
proposed project’s Real Estate Acquisition Management Plan (RAMP). Relocation
assistance may include replacement housing payments, payments for moving expenses,
and non-recurring closing costs associated with purchasing replacement housing.
Under the Relocation Assistance Program, advisory assistance and referrals are provided to
comparable replacement sites that are Decent, Safe, and Sanitary (DS&S). Part of the
DS&S requirements include providing replacement sites that are functionally equivalent to
the displacement dwelling, and within the financial means of the displaced person.
A replacement dwelling rented by a displaced person is considered to be within his/her
financial means if, after receiving rental assistance under this part, the person's monthly rent
and estimated average monthly utility costs for the replacement dwelling do not exceed the
person's base monthly rental for the displacement dwelling.
A displaced residential tenant or owner occupant may be entitled to a replacement housing
payment in the form of a rental assistance payment up to $7,200, or for owner-occupants, a
replacement housing payment of up to $31,000. Additional assistance may be provided
under the provisions of the Last Resort Housing Program.
Homeowners may qualify to receive a purchase price differential payment, reimbursement
for non-recurring costs incidental to the purchase of a replacement property, and an interest
differential if the replacement dwelling loan interest rate is higher than the interest rate for
the displacement dwelling, subject to eligibility requirements.
Tenants may qualify for a rental assistance payment if the cost to rent a comparable
replacement dwelling is greater than the displacement dwelling rent. Alternatively, an eligible
tenant may elect to use the Relocation Assistance Program for down payment assistance to
purchase a replacement dwelling and/or to pay non-recurring closing costs associated with
the purchase of replacement property.
The replacement area analyzed is located within a 15-mile radius of the dedicated lanes
segment of Alternative B. Adequate relocation resources exist within the replacement area

Community Impact Report
West Valley Connector Project 207
of the cities of Ontario, Upland, Rancho Cucamonga, Claremont, San Dimas, La Verne,
Pomona, Chino, Eastvale, Jurupa Valley, Fontana, Mira Loma, and Montclair for all potential
relocation displacements, including residential owners/tenants, non-residential
owners/tenants, and non-profit organizations. While the replacement area is located outside
the proposed project area, research indicates that the replacement area is comparable in
terms of public facilities, services, and amenities. A Draft Relocation Impact Report (OPC,
2017) has been prepared under a separate cover, which analyzes the availability of
replacement property for residents and businesses affected by the project.
The following measures are proposed to minimize project impacts related to relocation of
residents and businesses:
ACQ-1 A RAMP shall be developed adhering to the requirements pertaining to land
acquisition for projects funded by FTA as prescribed in Volume 49 CFR
Part 24, Uniform Relocation Assistance and Real Property Acquisition
Policies Act for Federal and Federally Assisted Programs, and the California
Relocation Assistance Act, 1970. All real property acquired for the project will
be appraised to determine fair market value. Just compensation, which shall
not be less than the approved appraisal, will be made to each displaced
property owner. Displacees who have met eligibility requirements will be
provided relocation assistance payments and advisory assistance in
accordance with the Federal Uniform Relocation Assistance and Real
Property Acquisition Policies Act of 1970, as amended.
The RAMP will address the need to have relocation specialists who have
prior experience working with people who may have special needs, especially
the elderly, disabled, and low-income population groups. It will also specify
that one or more of the relocation specialists be fluent in Spanish.
Additionally, the plan will address coordinating with the local Section 8
Housing Authority on the availability of vouchers and other options for
displaced low-income households who may face immediate financial
hardships.
The RAMP will address in advance of potential relocations of minority-owned
businesses the need to coordinate with organizations such as the Inland
Empire Region of the California Hispanic Chamber of Commerce, Asian
Business Association – Inland Empire, and the Black Chamber of Commerce
of the Inland Empire, to identify resources that may be of help to such
businesses. The potential application of property lease-back options to allow
small businesses to continue to function as long as feasible after acquisition
will also be explored in the RAMP.

Community Impact Report
208 West Valley Connector Project
ACQ-2 Transportation for displaced persons to inspect potential relocation housing
will be offered at no cost should they be unable to use their own means of
transportation. This offer shall be extended to senior citizens, disabled
people, and any transit-dependent individuals or households.
5.5 Environmental Justice
In the transportation context, environmental justice ensures that under-served communities
participate in the planning and decision making for transportation investments and that their
concerns and needs are incorporated into plans and policies with the objective that the
resulting system can better serve all of its users. Public agencies are also obligated to
disclose any adverse impacts of transportation plans, programs, and projects that fall
disproportionately on low-income and minority communities, to rigorously examine
alternatives that could eliminate or reduce the severity of such effects, and to ensure that
these communities receive an equitable distribution of the benefits of transportation
investments.
The following section identifies the environmental justice (EJ) populations within the study
area and presents the impact determinations regarding the likelihood that disproportionately
high and adverse impacts would be experienced by minority and low-income populations
under either build alternative. Minority populations are any readily identifiable groups of
minority persons (non-White) who live in geographic proximity that would be similarly
affected by the proposed project. The Environmental Protection Agency (EPA) defines a
minority as all but Non-Hispanic White Alone individuals (EPA, 2016). Low-income
populations are defined as those whose household income falls at or below the HHS poverty
guidelines.
5.5.1 Regulatory Framework
EO 12898: EO 12898, Federal Actions to Address Environmental Justice in Minority
Populations and Low-Income Populations, signed on February 11, 1994, calls on federal
agencies to identify and address any disproportionately high and adverse human health or
environmental effects of federal programs, policies, and activities on minority and low-
income populations to the greatest extent practicable and permitted by law. The Order
directs federal actions, including transportation projects, to use existing law to avoid
discrimination based on race, color, or national origin and to avoid disproportionately high
and adverse impacts on minority and low-income populations. These are often referred to as
environmental justice populations.
FTA Circular 4703.1: FTA Circular 4703.1, Environmental Justice Policy Guidance for
Federal Transit Administration Recipients (Circular), went into effect on August 15, 2012.
The purpose of the Circular is to assist FTA funding recipients such as Omnitrans in fulfilling

Community Impact Report
West Valley Connector Project 209
the intent of EO 12898. The general environmental justice principles embedded in EO
12898 and the Circular can be summarized as:
• Avoid, minimize, or mitigate disproportionately high and adverse human health and
environmental effects, including social and economic effects, on minority populations
and low-income populations;
• Ensure the full and fair participation by all potentially affected communities in the
transportation decision-making process; and
• Prevent the denial of, reduction in, or significant delay in the receipt of benefits by
minority and low-income populations.
5.5.2 Affected Environment
Impacts and benefits of transportation projects result from the physical placement of
transportation-related infrastructure and facilities, and also from their ability to improve or
impede access to neighborhoods. The inclusion of an environmental justice analysis
ensures that under-served communities are identified and that outreach is conducted to
encourage such communities to participate in the planning and decision making for
transportation investments, and that their concerns and needs are incorporated into plans
and policies with the objective that the resulting transportation system can better serve all of
its users. Public agencies are obligated to disclose any adverse impacts of transportation
plans, programs, and projects that fall disproportionately on low-income and minority
communities. They must examine alternatives that could eliminate or reduce the severity of
such effects and to ensure that minority and low-income communities receive an equitable
distribution of the benefits of transportation investments.
Methods for Identifying Minority and Low-Income Populations
FTA Circular 4703.1, Environmental Justice Policy Guidance for Federal Transit
Administration Recipients (Circular), went into effect on August 15, 2012. The purpose of the
Circular is to assist FTA funding recipients in fulfilling the intent of EO 12898.
Minority population is defined by Circular 4703.1 as:
• American Indian and Alaskan Native
• Asian
• Black or African-American
• Hispanic or Latino
• Native Hawaiian or Other Pacific Islander
FTA guidance indicates minority populations should be identified (a) where the minority
population of the affected area exceeds 50 percent or (b) where the minority population
percentage in the affected area is less than 50 percent but “meaningfully greater” than the
percentage than that of the next larger geographical unit of analysis.

Community Impact Report
210 West Valley Connector Project
Low-income populations are defined as any individual or household with income at or
below the federal poverty level established by the U.S. Department of Health and Human
Services (DHHS) guidelines. The DHHS guidelines use household size and correlated
income to determine poverty status. As suggested by Circular 4703.1, all households whose
median income is at or below 150 percent of the poverty-level guidelines were considered
low-income as shown in Table 5-10, below.
No numerical threshold has been established by FTA for defining a low-income community,
but this study follows the convention applied in other planning contexts in which 10 percent
or greater above a larger geographical baseline, such as a countywide service area, may be
used to satisfy what is intended by the term a “meaningful greater” percentage.
Accordingly, as 28.1 percent of households in both Los Angeles County and San Bernardino
County’s fall within the poverty level, if the low-income population percentage in a study
area census tract equaled or exceeded 38.1 percent, then that community was considered
low-income for purposes of the analysis.
Table 5-10: Federal Poverty Level Guidelines
Persons in Household Poverty Guideline
(100%) Poverty Guideline
(150%)
1 $11,770 $17,655
2 $15,930 $23,895
3 $20,090 $30,135
4 $24,250 $36,375
5 $28,410 $42,615
6 $32,570 $48,855
7 $36,730 $55,095
8 $40,890 $61,335
Note: The 2015 HHS Poverty Guidelines only reflect price changes through calendar year 2014; accordingly, they are most closely equal to the Census Bureau American Community Survey 5-Year Estimate (2010-2014).
Source: U.S. Department of Health and Human Services, 2016.
Environmental Justice Communities
Table 5-11 indicate the percentages of minority populations and low-income populations for
Los Angeles and San Bernardino counties, the overall study area, and each affected
Census tract. As the demographic data show, most of the study area is comprised of
minority residents. Each of the Census tracts in the project corridor contains more than 50
percent minority population; therefore, they are considered environmental justice
communities by the federal definition. The distribution of minority populations within the
corridor, however, is not uniform, with 7 of the 45 Census tracts having a lower overall

Community Impact Report
West Valley Connector Project 211
percentage of minority residents than that of the larger countywide SBCTA/Omnitrans
service area of Los Angeles and San Bernardino counties. In general, the highest
concentrations of minority residents are in the eastern and western portions of the West
Valley Connector corridor study area.
As Table 5-10 shows, the Hispanic/ Latino population is dispersed throughout the study area
corridor, notably with two Census tracts exceeding 85 percent of the total population in
Pomona, three in Ontario, and five in Fontana. As shown previously in Table 5-1, the largest
percentage of Asians (more than 19 percent) within the study area is within three Census
tracts located within Rancho Cucamonga, while the largest percentage of African Americans
(more than 22 percent) are located within three Census tracts in Fontana.
Table 5-11 shows that of the study area Census tracts with low-income households, those
within Rancho Cucamonga have the lowest concentrations. Of the 10 census tracts with 50
percent or greater low-income households, 1 is within Montclair, 2 are within Ontario, 3 are
within Pomona, and 4 are in Fontana. An additional 14 Census tracts that meet the 38.1
percent criteria for low-income households are included within the study area corridor.
Table 5-11: Environmental Justice (Census Tracts)
Ethnicity Household Poverty Level
Minority Population
(%)
Hispanic or Latino
(%)
Average
Persons in
Household
Percent Households below 150%
Poverty Level*
County
County of Los Angeles 72.8 48.1 3 28.2
County of San Bernardino
68.2 50.5 3 28.0
City
Pomona 87.4 69.4 4 37.4
Montclair 84.5 68.5 4 34.5
Ontario 82.8 70.2 4 30.9
Rancho Cucamonga 60.2 36.1 3 19.9
Fontana 84.5 66.7 4 26.6
Study Area
Census Tract 4023.03 87.7 76.3 4 51.0
Census Tract 4026 77.8 64.4 3 40.0
Census Tract 4027.02 93.0 84.9 4 53.0
Census Tract 4027.05 80.3 68.7 4 28.4
Census Tract 4027.06 95.1 73.1 4 31.7
Census Tract 4028.01 98.0 95.2 5 47.1

Community Impact Report
212 West Valley Connector Project
Table 5-11: Environmental Justice (Census Tracts)
Ethnicity Household Poverty Level
Minority Population
(%)
Hispanic or Latino
(%)
Average
Persons in
Household
Percent Households below 150%
Poverty Level*
Census Tract 4088 85.4 63.5 3 51.6
Census Tract 2.07 88.8 80.1 4 27.5
Census Tract 2.08 76.5 68.4 4 23.8
Census Tract 3.01 94.0 76.6 4 52.2
Census Tract 3.03 87.3 78.6 4 28.4
Census Tract 3.04 86.6 64.8 4 22.4
Census Tract 10.02 87.5 81.2 4 33.7
Census Tract 11.01 85.5 74.0 3 48.2
Census Tract 13.12 83.0 59.4 4 14.2
Census Tract 14 81.3 62.8 3 49.1
Census Tract 15.01 93.1 91.4 4 47.2
Census Tract 15.03 94.2 90.0 5 56.2
Census Tract 15.04 92.1 76.1 4 47.5
Census Tract 16 97.1 96.1 4 57.4
Census Tract 18.03 75.7 63.9 3 16.9
Census Tract 18.13 95.3 86.1 5 44.3
Census Tract 20.28 59.7 42.8 3 10.5
Census Tract 20.34 66.7 31.6 3 12.5
Census Tract 20.35 62.5 31.6 3 9.3
Census Tract 20.36 65.1 28.7 3 13.7
Census Tract 20.37 72.8 42.6 4 13.0
Census Tract 20.38 79.8 40.4 4 6.2
Census Tract 21.07 64.5 47.5 3 34.0
Census Tract 21.09 82.0 43.1 2 8.1
Census Tract 21.10 77.4 38.4 2 22.6
Census Tract 22.04 89.7 80.0 4 30.0
Census Tract 22.07 72.0 45.6 4 25.9
Census Tract 23.05 85.2 62.6 4 13.7
Census Tract 24.01 94.2 89.6 5 39.8
Census Tract 24.02 94.3 87.7 4 47.7
Census Tract 26.01 88.7 71.8 5 23.4
Census Tract 28.01 90.6 77.6 4 41.4
Census Tract 28.03 89.8 82.1 4 50.7
Census Tract 28.04 94.5 85.8 4 63.5

Community Impact Report
West Valley Connector Project 213
Table 5-11: Environmental Justice (Census Tracts)
Ethnicity Household Poverty Level
Minority Population
(%)
Hispanic or Latino
(%)
Average
Persons in
Household
Percent Households below 150%
Poverty Level*
Census Tract 29.01 88.0 84.9 4 41.8
Census Tract 30 87.1 73.1 3 53.4
Census Tract 31.02 92.3 90.1 4 53.8
Census Tract 32 83.6 76.9 4 43.7
Census Tract 33.01 91.2 84.7 4 42.0
Census Tract 33.02 81.1 77.7 4 40.5
Census Tract 127 65.0 47.8 3 17.1
Study Area 84.1 68.9 4 34.7
*Low-income populations are defined as households that fall below the 150% federal poverty line based on household size, as provided by the DHHS. Refer to Table 5-9 for full federal poverty guideline in which poverty level is determined.
Source: U.S. Census Bureau, 2016.
Figure 5-2 graphically depicts the locations of environmental justice populations within the
corridor study area. As shown in the figure, and as reflected in the Census data, all census
tracts in the study area exceed the SBCTA service area of Los Angeles and San Bernardino
Counties for minority populations (minority population greater than 50 percent). This figure
also illustrates how low-income populations (10 percent greater than SBCTA service area of
Los Angeles and San Bernardino counties) are prevalent along both sides of the alternatives
and along the project alignment in Ontario.
Public Outreach
Access to the decision-making process is a fundamental principal of environmental justice.
Community outreach and participation have been integrated into the project development
process from the outset, including alternatives development, extensive public and agency
stakeholder involvement, and public scoping. A citizen’s advisory committee, which
consisted of local residents, business owners, and a local church representative, was
formed to provide a broader perspective into the proposed project. This committee met on
five occasions and helped shape some of the earliest efforts to engage with the broader
community, beginning in 2012. Omnitrans’ stakeholder outreach continued during the AA
phase of the project in 2014.
Omnitrans conducted public outreach activities throughout the corridor in May and June
2014 to explain the purpose and objectives of the project and to provide a range of
opportunities to answer questions and collect comments from the public.

Community Impact Report
214 West Valley Connector Project
To further the goals of environmental justice in accordance with federal directives, a Public
Involvement Plan was developed and implemented as an integral part of the public
involvement and outreach strategy for the proposed project, including a targeted effort to
engage environmental and social equity organizations in the region. Among local
community-based organizations, several whose mission is achieving environmental justice,
including the Center for Community Action and Environmental Justice, and the United Voice
for Pomona Environmental Justice, were sent bilingual notices for the public scoping
meetings held in each of the five project corridor cities between April 12 and 20, 2016. In
addition, a specially focused workshop meeting for the purposes of engaging potentially
affected businesses on Holt Boulevard in Ontario, and other stakeholders, was also held in
June 2017.
SBCTA and Omnitrans will continue to engage in public outreach activities throughout
development of the project, including consistent updates and announcements on the project
website and Facebook page that will allow interested parties to stay up to date regarding the
progress of the environmental documentation phase. Other outreach activities will include
mailers to property owners and tenants within 0.25 mile of the project footprint and public
meetings for affected property owners and tenants.
SBCTA recognizes the need to provide multicultural, multilingual, fully accessible,
economically diverse participation from stakeholders along the project corridor. Many
diverse attempts were made to ensure that both English- and Spanish-speaking community
members had access to information about the West Valley Connector Project because
English and Spanish are the most common spoken languages within the project area.
Special outreach efforts for the public scoping meetings included a pre-postage paid
postcard in English and Spanish that was sent to approximately 1,035 stakeholders;
advertisements in 2 English and 2 Spanish language newspaper publications; online ads on
2 English newspaper publication websites; a project webpage and Facebook page;
electronic notices (e-blasts) to stakeholders; English and Spanish flyers sent to 45 public
facilities (e.g., libraries, community centers, City halls, senior centers); announcements at
the City Council meetings in each of the 5 cities; announcements in Omnitrans’ online blog
and bilingual newsletter; and poster ads on Omnitrans buses. Spanish translation services
were available at each of the 5 public scoping meetings.

Community Impact Report
West Valley Connector Project 215
Figure 5-2: Environmental Justice Communities

Community Impact Report
216 West Valley Connector Project
This page intentionally left blank.

Community Impact Report
West Valley Connector Project 217
5.5.3 Environmental Consequences
Potential impacts on environmental justice populations were determined through review of
analysis of the project alternatives, including land use; traffic; visual and aesthetic
considerations; biological resources; water quality; hazardous waste; community and
cultural resources; air quality; noise and vibration; safety and security; and acquisitions and
displacements as addressed in respective technical studies prepared for this project.
No Build Alternative
The No Build Alternative would maintain the current level of transit service in the study area.
Under the No Build Alternative, the project would not be constructed, and there would be no
impacts to or transit improvements for environmental justice populations.
Build Alternatives
BRT Corridor
Alternative A
Alternative A would provide enhanced transit service in the study area with the
implementation of a full 35-mile long BRT corridor. Alternative A would not include
expansion of facilities or require right-of-way acquisitions. No homes or businesses would
be displaced.
Some utility relocations may be partially relocated in several areas throughout the corridor;
however, no long-term disruptions in service are anticipated.
During construction of the side-running stations, delays to bicycles and pedestrians could
result, but with implementation of a Traffic Management Plan (TMP), impacts should be
minimal.
Implementation of Alternative A would provide a benefit to individuals who rely on public
transportation services. Alternative A would improve accessibility, reliability, frequency,
convenience, and connectivity of transit services to several key destinations, including
employment, education, shopping, medical, recreation, and cultural opportunities, along the
project corridor. These benefits would tend to accrue to a greater degree to the area’s transit
user populations.
No high and disproportionate adverse impacts on environmental justice communities are
anticipated under Alternative A because all substantive impacts would be would be fully
mitigated.
Alternative B
Under Alternative B, acquisition of 37 full parcels would occur; this includes 14 residential,
53 commercial, and 8 industrial/manufacturing properties. There would also be partial

Community Impact Report
218 West Valley Connector Project
acquisition of 168 parcels (see Section 5.4, Relocations). The relocation impacts would
occur in Census Tracts 15.01, 15.03, and 16.00, in Ontario, which is an environmental
justice community.
Displaced residential and commercial property owners and tenants are provided relocation
assistance payments, including moving payments, and advisory assistance in accordance
with the Uniform Relocation Assistance and Real Property Acquisitions Policies Act of 1987,
as amended (Uniform Act).
Residents generally prefer to remain within close proximity to local schools and established
familial and cultural settings, and businesses prefer to relocate as close as possible to
existing customer bases or service areas.
The Draft Relocation Impact Report found the total amount of comparable adequate
relocation sites available in the project area for residential and commercial properties
potentially displaced by the project.
Because sufficient housing stock exists, the residents affected by the project could be
relocated within proximity of their current locations and existing community services, if they
so choose. The replacement area is comparable in terms of public facilities, services, and
amenities, including community centers, senior centers, libraries, schools, parks, and police
and fire stations.
Per the Uniform Relocation Act, in addition to receiving fair market compensation for any
property acquired on behalf of the project, property owners and tenants would also receive
relocation assistance. There are also provisions to ensure that comparable replacement
housing is within the financial means of the displaced person. When such housing cannot be
provided using the housing payments allowed within the statutory limits, the Uniform Act
provides “housing of last resort” to respond to difficult or unique displacement conditions so
displaced persons will be relocated to decent, safe, and sanitary replacement housing.
Tenants who are eligible may qualify for rental assistance if the cost to rent a comparable
replacement dwelling is greater than their previous rent. Additionally, coordination with the
local housing authority representatives by the real estate specialist will be undertaken to
determine the availability of vouchers and other options for displaced persons who may face
immediate financial hardship. This will include coordination with the Ontario Housing
Authority to discuss the Displacement Avoidance Plan (DAP) for Ontario’s Transformative
Climate Communities project. These minimization measures and others to recognize special
needs households will be addressed in the Real Estate Acquisition Management Plan
(RAMP), if Alternative B is ultimately selected.
Community Impact Report
West Valley Connector Project 219
Relocation assistance benefits and services are to be provided equitably to all property
owners and tenants without regard to race, color, religion, age, national origins, and
disability as specified under Title VI of the Civil Rights Act of 1964.
The acquisition of properties for the construction under Alternative B could potentially affect
community cohesion; however, the effect of access changes, ROW acquisitions, a slight
increase in noise, and a minor change in visual character are confined to limited areas and
are not expected to negatively affect overall community character. Alternative B is not
expected to sever or degrade access to neighborhoods or community facilities during
construction or upon project operation. In fact, the proposed project overall may have the
effect of enhancing community cohesion by placement of hardscape (i.e., street furniture, art
work), lighting, landscaping, and other components of the new infrastructure associated with
the transit investment. Such investments in the community can be a source of community
pride.
Some temporary utility relocations will occur in several areas throughout the corridor
however, no long-term disruptions in service are anticipated.
Construction activities could result in lane closures and create short-term delays to vehicles,
bicycles, and pedestrians, especially in Ontario along Holt Boulevard, but the preparation
and implementation of a TMP should minimize impacts. Coordination with fire and police
departments and other emergency services will be conducted in advance of construction.
Public access to businesses will be maintained at all times.
Implementation of Alternative B would provide a benefit to individuals who rely on public
transportation services. Alternative B would improve accessibility, reliability, frequency,
convenience, and connectivity of transit services to several key destinations, including
employment, education, shopping, medical, recreation, and cultural opportunities, along the
project corridor. These benefits would tend to accrue to a greater degree to the area’s transit
user populations.
In addition, the planned BRT station design elements would help actualize the general
planning goals of the affected cities and counties, as outlined in Section 3.0, Land Use.
These include improving access and safety features for bicycles and pedestrians, which
would entail infrastructure improvements in accordance with ADA requirements, namely
providing concrete boarding areas at each station and connecting ADA-accessible pathways
within a 0.5-mile radius of all stations, including repair or replacement of sidewalk or curb
ramps and restriping of pedestrian crosswalks, where needed. Bicycle access improvements
include providing bicycle parking racks at each station.

Community Impact Report
220 West Valley Connector Project
O&M Facility
The proposed O&M facility will support BRT vehicles used for BRT service under both
alternatives. The potential sites, located approximately 1 mile south of the project alignment,
are located within Census Tracts 18.13 and 18.03 (see Section 5.5.2 for discussion on EJ
communities). The proposed O&M facility would not lead to additional impacts other than the
ones listed under Alternatives A and B, given that its purpose is to support BRT operations
under both alternatives.
Temporary Impacts
BRT Corridor
As previously discussed, construction of the build alternatives would result in temporary
impacts for those residents in the vicinity of the construction activities. The construction-
related impacts would not disproportionately affect EJ populations.
O&M Facility
As previously discussed, construction of the O&M facility would result in temporary impacts
for those residents in the vicinity of the construction activities. The construction-related
impacts would not disproportionately affect EJ populations.
5.5.4 Avoidance, Minimization, and Mitigation Measures
Taking all factors described above into account, the project alternatives would not have
disproportionately high and adverse effects on environmental justice populations. The
combination of station design and landscaping elements, together with proposed
minimization measures, would help offset impacts associated with implementing either
Alternative A or B; however, strategies to involve the environmental justice communities will
continue during the preliminary engineering phase to effectively implement the project and
proposed strategies.
Based on the environmental justice analysis, the build alternatives would not cause
disproportionately high and adverse effects on minority or low-income populations per EO
12898. Implementation of measures outlined below would further minimize potential impacts
to environmental justice communities.
Measures CI-TRA-1 and CI-TRA-2 (see Section 5.1.3) would create a plan to coordinate
detours with community groups and emergency service providers, including several
measures to reduce community impacts; these include restricting construction times,
rerouting traffic, minimizing lane and sidewalk closures, and alerting the affected community
in advance and working with public agencies on detour routes, and maintaining access to
local businesses.

Community Impact Report
West Valley Connector Project 221
Project design will be carried out to incorporate features that minimize impacts to the
community during construction as described in Measures TRA-1 and TRA-2 as described
below:
TRA-1 The project design would incorporate the following improvement measures to
enhance sbX Operations and sbX Operations at Signalized Intersections:
• Reconstruction of curb and gutters will only be required for the segment
where dedicated bus-only lanes are proposed.
• Vehicular lanes where the sbX operates in dedicated bus-only lanes will
feature concrete roadways, painted or striped to visually separate the
exclusive lanes from the mixed-flow lanes.
• Concrete pads will be placed at all station locations for the sbX vehicles.
• Wherever possible for exclusive lanes, the bus signals and the adjacent
existing intersection signals will be integrated to create one signalized
intersection controlling automobiles and buses.
• Intersection crossings will be controlled with signals, and pedestrians will
be allocated standard crossing time.
• Left turn movements for vehicular traffic from mixed-flow lanes crossing
exclusive lanes on the project alignment will require separate signal
phases with red arrows when transit vehicles are crossing intersections.
• The signal modifications may also include “active” No-Right-Turn
indications and “Bus Coming” signs to prevent right turns across the
exclusive lanes.
• Signal modifications will include upgrades to signal controllers and
software to accommodate the transit priority treatment at intersections.
• Presignals and queue cutters will be used to prevent traffic from stopping
or blocking the exclusive lanes.
TRA-2 The following improvement measures would be carried out at the following
affected intersections for both Alternatives A and B:
• Garey Avenue/Holt Boulevard: Restripe eastbound Holt Avenue approach
to add a dedicated right-turn lane.
• Towne Avenue/Holt Boulevard: Modify the traffic signal to include
protected plus permitted phasing at the northbound and southbound
Towne Avenue approaches.
• East End Avenue/Holt Boulevard: Restripe the eastbound Holt Avenue
right-turn lane to a shared through/ right-turn lane.
• Day Creek Boulevard/Foothill Boulevard: Restripe the third northbound
through lane to a shared through/right-turn lane.

Community Impact Report
222 West Valley Connector Project
• Sierra Avenue/ Foothill Boulevard: Modify the traffic signal to include
protected plus permitted phasing at the eastbound and westbound
Foothill Boulevard approaches.
• Sierra Avenue/San Bernardino Avenue: Modify the traffic signal to include
protected plus permitted phasing at the eastbound and westbound San
Bernardino Avenue approaches.
• Sierra Avenue/Marygold Avenue: Modify and restripe the eastbound
Marygold Avenue shared through/right lane to a right-turn lane with a
dedicated eastbound through lane.
• Juniper Avenue/Valley Boulevard: Restripe the westbound Valley
Boulevard approach to add a dedicated right-turn lane.
Measures AV-2, AV-4, AV-5, AV-6, and AV-7 will gain greater community acceptance for the
project and are consistent with and promote general plan goals of the local communities
include providing light glare shields at all stations; adhering to the streetscape designs of the
affected localities; developing and implementing an Art-in-Transit program and incorporating
artwork into the station designs; minimizing tree removal; and being sensitive to designated
historic roadways in project design and landscaping as described below:
AV-2 All lighting at the stations shall include shielding and directionality to limit the
extent of glare created at these locations.
AV-4 Meet any currently established City requirements for streetscape design for
the various roadways within the project area that are disturbed by the project
construction and work with the community stakeholders to ensure
implementation. Relevant goals and policies include Policy 6D.P24 of the
Pomona General Plan, Policy CD3-6 of the Ontario General Plan, Policy CM-
1.5 of the Rancho Cucamonga General Plan, and Goal #4.1 of the Fontana
General Plan, all of which require transit developments to provide elements
such as landscaping to enhance the aesthetics, functionality, and
sustainability of streetscapes.
AV-5 Develop and implement an Art-in-Transit strategy and incorporate artwork
into relevant center- and side-running BRT station designs.
AV-6 Between Euclid and Sultana avenues, minimize the number of tree removals
to the extent possible.
AV-7 Within the Holt Boulevard/Euclid Avenue intersection, ensure any work
complies with requirements of the historic designations of the roadway
regarding landscape and other contributing factors.

Community Impact Report
West Valley Connector Project 223
It is SBCTA’s policy to ensure that the proposed project be designed and constructed in full
compliance with FTA requirements for safety and security. Safety and security are priorities
in conducting all work within the Omnitrans stations. Omnitrans has a System Safety
Management Plan (SSMP) to achieve this policy. The overall objective of this SSMP is to
define activities, management controls, and monitoring processes that ensure that its
patrons are adequately protected and local fire and police jurisdictions have appropriate and
unimpeded access to the system in the event of an incident.
To further minimize potential impacts related to safety and security to environmental justice
communities, Measures SS-1 through SS-5 will incorporate security features in all BRT
stations, include installing lighting, monitoring cameras, and other elements to enhance
safety for all users. A greater level of security may be provided at specific locations if an
assessment determines certain facilities warrant additional security measures. These
security measures are described below.
SS-1 All stations and parking facilities shall be equipped with monitoring equipment
and/or be monitored by SBCTA security personnel on a regular basis.
SS-2 SBCTA shall implement a security plan that includes in-vehicle and station
surveillance by SBCTA security or other local jurisdiction security personnel.
SS-3 All stations shall be lit to standards that avoid shadows, and all pedestrian
pathways leading to/from sidewalks and parking facilities shall be well
illuminated.
SS-4 SBCTA shall coordinate and consult with Pomona PD, Montclair PD, Ontario
PD, Rancho Cucamonga PD, Fontana PD, County of San Bernardino
Sheriff’s Department, and County of Los Angeles Sheriff’s Department to
develop safety and security plans for the alignment, parking facilities, and
station areas.
SS-5 The station design shall not include design elements that obstruct visibility or
observation, nor provide discrete locations favorable to crime; pedestrian
access at stations shall be ground level with clear sight lines.
To further minimize potential impacts related to property acquisitions to environmental
justice communities, Measure ACQ-1 (see Section 5.4.3) indicated that a RAMP will be
developed adhering to the requirements pertaining to land acquisition as prescribed by the
Uniform Relocation Assistance and Real Property Acquisition Policies Act of 1970, as
amended. The RAMP will address the need to have relocation specialists who have
experience working with the elderly, disabled, and low-income population groups and be
fluent in Spanish. Additionally, the plan will address coordinating with the local Section 8

Community Impact Report
224 West Valley Connector Project
Housing Authority on the availability of vouchers and other options for displaced low-income
households.
The RAMP will also address potential relocations of minority-owned businesses and identify
organizations with which to coordinate, such as the Inland Empire Region of the California
Hispanic Chamber of Commerce, Asian Business Association – Inland Empire, and the
Black Chamber of Commerce of the Inland Empire, to identify resources that may be of help
to such businesses. The potential use of property lease-back options to allow small
businesses to continue to function in place after acquisition will also be explored in the
RAMP.

Community Impact Report
West Valley Connector Project 225
This page intentionally left blank.


Community Impact Report
West Valley Connector Project 227
TRAFFIC/TRANSPORTATION/PEDESTRIAN/BICYCLE
FACILITIES
6.1 Affected Environmental
The West Valley Connector Project would improve corridor mobility and transit efficiency in
the San Bernardino Valley from the City of Pomona to the City of Fontana with an
enhanced, state-of-the-art BRT system. Improved rapid transit along the project corridor
would help SBCTA/Omnitrans achieve its long-range goals to cost effectively enhance
lifeline mobility and accessibility, improve transit operations, increase ridership, support
economic growth and redevelopment, conserve nonrenewable resources, and improve
corridor safety. As analyzed in the Traffic Operations Analysis Report (Iteris, 2018), multiple
intersections along the project corridor currently operate at capacity during peak hours, and
conditions are expected to worsen if improvements are not made.
6.1.1 Access, Circulation, and Parking
Much of the study is characterized by typical primary arterials-adjacent to urban residential
neighborhoods, commercial, and light industrial properties with on-street and off-street
parking in residential areas and usually plentiful off-street surface parking at commercial
lots. Table 6-1 summarizes the existing primary roadway segments along the proposed
corridor. The roadway segments are generally operating at good levels of service (LOS), or
LOS A through D, other than the south stretch of Sierra Avenue in Fontana between Valley
Boulevard and Kaiser Permanente.
Table 6-1: Existing Primary Facilities Summary
Jurisdiction Route Segment Configuration
Pomona Holt Ave Garey Avenue to Mills Avenue
4-lane Divided
Montclair Holt Blvd Mills Avenue to Benson Avenue
4-lane Divided
Ontario
Holt Blvd Benson Avenue to Vineyard Avenue
4-lane Divided
Inland Empire Blvd
Archibald Avenue to Haven Avenue
6-lane Divided
Rancho Cucamonga
Milliken Ave Inland Empire Boulevard to Foothill Boulevard
6-lane Divided
Haven Avenue Inland Empire Boulevard to Foothill Boulevard
6-lane Divided
Foothill Blvd Haven Avenue to Day Creek Boulevard
6-lane Divided

Community Impact Report
228 West Valley Connector Project
Table 6-1: Existing Primary Facilities Summary
Jurisdiction Route Segment Configuration
Fontana
Foothill Blvd Day Creek Boulevard to Sierra Avenue
4-lane Divided
Sierra Ave Foothill Boulevard to Valley Boulevard
4-lane Divided
Sierra Ave Valley Blvd to Kaiser Permanente Driveway
5-lane Divided (3 lanes SB, 2 lanes NB)
The primary components of the pedestrian circulation system are sidewalks and crosswalks.
Pedestrian access improvements include Americans with Disabilities Act (ADA)-accessible
concrete boarding areas at each station and connecting ADA-accessible pathways within
0.5-mile radius of all stations, including repair or replacement of sidewalk or curb ramps and
restriping of pedestrian crosswalks where needed.
Existing and Proposed Bikeways
The SBCTA Non-Motorized Transportation Plan (2015) and the Los Angeles County Bicycle
Master Plan (2012) identify bikeways that run adjacent to the proposed project alignment.
Table 6-2 summarizes the existing and planned bikeways located within the project corridor.
Table 6-2: Existing and Proposed Bikeways
Jurisdiction Existing and Proposed Bikeways
Ontario
• Existing Class II facility along Inland Empire Boulevard from Archibald Avenue to Haven Avenue.
• Planned Class III facility along Haven Avenue and along Inland Empire Boulevard between Haven Avenue and Milliken Avenue.
Rancho Cucamonga
• Existing Class II facility along Milliken Avenue, Haven Avenue, and Foothill Boulevard along the project corridor
Fontana
• Existing Class II facility along Foothill Boulevard between East Avenue and Cherry Avenue.
• Planned Class II facility along Foothill Boulevard from Cherry Avenue to Sierra Avenue.
• Planned Class II facility along Sierra Avenue.
Parking
Parking conditions vary along the major arterials within the study area as shown in Table 6-
3. In other areas of the study area, there is on-street and off-street parking in residential
areas and off-street surface parking is typically plentiful in commercial lots.

Community Impact Report
West Valley Connector Project 229
Table 6-3: Parking Conditions
Route Segment Parking Conditions
Holt Ave Garey Avenue to Mills Avenue On-Street Parking Allowed
Holt Blvd Mills Avenue to Benson Avenue On-Street Parking Allowed
Holt Blvd Benson Avenue to Vineyard Avenue On-Street Parking Allowed
Inland Empire Blvd Archibald Avenue to Haven Avenue No On-Street Parking
Milliken Ave Inland Empire Boulevard to Foothill Boulevard
No On-Street Parking
Haven Ave Inland Empire Boulevard to Foothill Boulevard
No On-Street Parking
Foothill Blvd Haven Avenue to Day Creek Boulevard
No On-Street Parking
Foothill Blvd Day Creek Boulevard to Sierra Avenue
No On-Street Parking; On-Street Parking Allowed (Between Cypress Avenue and Sierra Avenue)
Sierra Ave Foothill Boulevard to Valley Boulevard
On-Street Parking Allowed; No On-Street Parking (Between Marygold Avenue to Valley Boulevard)
Sierra Ave Valley Blvd to Kaiser Permanente Driveway
No On-Street Parking
6.1.2 Public Transportation
Omnitrans
Omnitrans is the major public transportation provider in the San Bernardino Valley, with a
service area of approximately 456 square miles, serving 15 municipalities and many
unincorporated areas of San Bernardino County. In 2004, Omnitrans developed the
Omnitrans Systemwide Plan that identified major transit corridors for potential improved
service. SBCTA included the corridors from the Systemwide Plan in its own San Bernardino
County Long Range Transit Plan in 2010. The corridors were also included as strategic
corridors in the 2012 Regional Transportation Plan/Sustainable Communities Strategy
produced by the SCAG. The Omnitrans System-wide Plan and SBCTA Long Range Transit
Plan determined that based on the level and character of transit demand, the most
appropriate technology for premium transit service is BRT along ten major corridors.
Since the adoption of the Omnitrans System-wide Plan, Omnitrans has begun operation of
the first sbX corridor, the Green Line on the E Street Corridor, serving the cities of San
Bernardino and Loma Linda. The 15.7-mile BRT corridor, began revenue operation in April
2014, and includes 16 specialized transit stations, 5.4 miles of BRT center-running
dedicated lanes plus 10.3 miles of BRT operating in mixed flow lanes.

Community Impact Report
230 West Valley Connector Project
Aside from existing and planned BRT corridors, Omnitrans currently operates 27 bus routes
in the San Bernardino Valley. Portions of two routes in particular, Route 61 and 66 share
their routes with the proposed project. Route 61, with 5,000 passengers per average
weekday, and local Route 66, with 3,185 passengers per average weekday, are two of
Omnitrans’ most productive services, together accounting for nearly 20 percent of
Omnitrans’ total system-wide daily ridership. In addition, the corridor is home to several
important employment, educational, and activity centers where public transit demand by
workers, shoppers, students, visitors, and others is concentrated. The project corridor adds
Victoria Gardens as a potential destination to be connected to Ontario Mills, Ontario
International Airport, and Kaiser Permanente Medical Center and provides new direct
connections between three Metrolink stations.
Route 61
Route 61 is a 20.4-mile route operating from the Pomona Transit Center on the west end
along Holt Boulevard in the City of Pomona to the Ontario International Airport, along Inland
Empire Boulevard and Milliken Avenue to Ontario Mills. The corridor continues east along
Fourth Street/San Bernardino Avenue to the South Fontana Transit Center near Kaiser
Permanente Hospital, then north along Sierra Avenue terminating at the Fontana Metrolink
Station.
Route 61 crosses the western portion of the San Bernardino Valley in an east-west
direction, providing one of three east-west transit options along with Route 66 on Foothill
Boulevard and Route 67 on Baseline Road.
Route 61 serves 92 local stops along the corridor in each direction, with an average of 4.5
stops per mile in each direction in the corridor. Transfers along the corridor includes 16
other Omnitrans bus routes, two Metrolink commuter Rail lines (the San Bernardino Line
and Riverside Line), Foothill Transit Silver Streak BRT, and nine Foothill Transit local bus
routes. Since 2006, ridership in the corridor has remained the highest in all of Omnitrans’
service area at approximately 5,000 riders on average per weekday. This represents
approximately 11.2 percent of Omnitrans’ total system ridership.
Route 66
Route 66 is a 15.8-mile route that runs primarily along Foothill Boulevard with termini in
Montclair and Fontana. The route serves two primary transit stations at the Montclair Transit
Center and Fontana Metrolink Transit Center. Route 66 has moderate ridership, with the
majority of boardings occurring at the route termini. The route includes 73 bus stops in each
direction, with an average of 0.22 miles between stops. Route 66 has the fifth highest
ridership among Omnitrans routes with approximately 3,185 riders on average per weekday,
representing 7.1 percent of all Omnitrans’ total system ridership.

Community Impact Report
West Valley Connector Project 231
Other Routes
Aside from Route 61 and 66, Omnitrans operates several other bus routes within the study
area including the following:
• Route 80 along Holt Boulevard (between Euclid Avenue and Vineyard Avenue)
• Route 81 along Haven Avenue
• Route 82 along Milliken Avenue and Sierra Avenue
• Route 85 along Foothill Boulevard
• Routes 10, 14, 15, 19, 20, and 67 along Sierra Avenue
• Route 29 along Valley Boulevard
Other Bus Operators
Several other local transit operators provide service in the service area of the project.
• Foothill Transit, serving the San Gabriel Valley, with connections to Omnitrans bus
routes at the Montclair Transcenter on several Foothill Transit routes, and connections
between Route 61 and several Foothill Transit routes at Pomona Transit Center.
• Victor Valley Transit Authority, serving Victorville and Apple Valley, provides service to
Fontana Metrolink and Fontana Kaiser Permanente Hospital.
Metrolink
Metrolink is a regional commuter train service that operates service on seven regional lines
serving Los Angeles County, Ventura County, the Antelope Valley, and San Bernardino,
Riverside, and Orange counties under the jurisdiction of the Southern California Regional
Rail Authority (SCRRA). Three routes serve San Bernardino County and include the San
Bernardino and Riverside and Inland Empire/Orange County Lines. The San Bernardino and
Riverside routes interface with the planned West Valley Connector Corridor alignments and
serve an average of 11,036 and 4,630 average weekday riders in 2016, respectively.1
The San Bernardino Line runs 7 days a week while the Riverside Line only runs on
weekdays. Direct connections to both lines are provided via the Pomona, Rancho
Cucamonga, and Fontana Metrolink Stations served along the project route.
6.2 Environmental Consequences
6.2.1 Access, Circulation, and Parking
The No Build Alternative would maintain the current configuration of study corridor arterials
and maintain the existing levels of public transportation services. Under the No Build
Alternative, the project would not be constructed, and the existing multimodal transportation
1 http://www.metrolinktrains.com/ pdfs/Facts&Numbers/Monthly_Line_
Ridership/Average_and_Total_Ridership_ Report_FY16.pdf.

Community Impact Report
232 West Valley Connector Project
system would not be enhanced by the new choice for commuting, as well as improved traffic
conditions along major arterials, without the project improvements.
BRT Corridor
Common to All Build Alternatives
Design and construction of this project will either maintain or reconstruct all existing
driveways impacted by the project. Access to all homes and businesses will be maintained,
except for those parcels that are fully acquired for the project. For properties proposed for
full or partial acquisition, fair compensation and/or relocation benefits will be provided.
Under Alternative B, the WVC buses will run within dedicated lanes, and access to the
stores along Holt Boulevard will be maintained. A median is proposed as part of Alternative
B as a safety measure for the dedicated bus lanes. With the median, the project would
provide multiple intersections wide enough for large trucks/vehicles towing vessels to
navigate U-turns.
The project would be designed to retain existing pedestrian and bicycle circulation routes.
Where possible, the existing pedestrian and bicycle system would be improved to
encourage pedestrians and bicyclists to use the West Valley Connector. The build
alternatives would support modal shifts from automobiles to transit, cycling, and walking.
Good sidewalk connections, and to some degree bicycle paths, need to be provided
between station locations and adjacent land uses to help encourage transit usage. To create
connectivity between bicycles and transit, bike storage would be provided at proposed
stations and storage for bikes would be provided on West Valley Connector vehicles.
According to the Traffic Operations Analysis Report (April 2018), the current usage rate of
on-street parking demand during a typical weekday is below 11 percent. Considering the low
utilization of on-street parking demand during a typical weekday, as well as the presence of
off-street parking lots provided by most businesses, it is not likely that removal of on-street
parking to accommodate the proposed project Build Alternative B configuration would have
an adverse effect on parking conditions. No parking impacts outside of the segment of Holt
Boulevard between Benson Avenue and Vineyard Avenue are anticipated. Because no
arterial roadways would be permanently closed and there are no permanent impacts to
access or circulation, no indirect impacts are anticipated.
A more cohesive transit system would result from the project because of more frequent
service, new signage, improved pedestrian and bicycle facilities, and connections with
nearby intermodal land uses that would provide an integrated transit rider experience,
improving access to community centers and businesses along the corridor.
With improved transit service along the project corridor, the build alternatives would provide
a benefit for the local communities. Residents would have improved access to community
facilities and businesses, and connections to the Metrolink system. Those employed in the

Community Impact Report
West Valley Connector Project 233
study area would benefit from the improved transit service through a more reliable and
faster commute via transit.
Based on the proposed Phase I and Phase II alignments, 129 intersections were analyzed
in the Traffic Operations Analysis Report (April 2018). The Phase I alignment (Milliken
Avenue alignment) consists of 84 intersections, which includes 65 intersections along the
proposed West Valley Connector routes and 19 intersections along parallel routes, such as
D Street, State Street, and Mission Boulevard, within Ontario. The Phase II alignment
(Haven Avenue branch alignment) consists of an additional 45 intersections, for a total of
129 intersections (see Figures 6-1 and 6-2).
An adverse traffic impact is considered to occur if an intersection that is forecast to operate
at LOS D or better under the no-build condition worsens to LOS E under build conditions. In
addition, an adverse impact is considered to occur if the project results in any increase in
delay at an intersection forecast to operate at LOS E or F in no-build conditions.
Alternative A
Based on the threshold indicated above, in opening year 2023, the following intersections are
considered to be adversely impacted by the Alternative A scenario:
• Garey Avenue/Holt Avenue (PM peak hour)
• Day Creek Boulevard/Foothill Boulevard (PM peak hour)
• Sierra Avenue/Foothill Boulevard (PM peak hour)
By future year 2040, the following intersections are considered to be adversely impacted by
the Alternative A scenario:
• Garey Avenue/Holt Boulevard (AM and PM peak hours)
• Towne Avenue/Holt Boulevard (PM peak hour)
• East End Avenue/Holt Boulevard (PM peak hour)
• Rochester Avenue/Foothill Boulevard (PM peak hour)
• Day Creek Boulevard/Foothill Boulevard (PM peak hour)
• Citrus Avenue/Foothill Boulevard (PM peak hour)
• Sierra Avenue/San Bernardino Avenue (AM peak hour)
• Sierra Avenue/Marygold Avenue (PM peak hour)
• Juniper Avenue/Valley Boulevard (PM peak hour)
• Haven Avenue/Arrow Route (PM peak hour)
• Haven Avenue/Foothill Boulevard (PM peak hour)
Alternative B
Based on the threshold indicated earlier, in future year 2023, the following intersections are
considered to be adversely impacted by the Alternative B scenario:

Community Impact Report
234 West Valley Connector Project
• Garey Avenue/Holt Avenue (PM peak hour)
• Euclid Avenue/Holt Boulevard (AM peak hour)
• Day Creek Boulevard/Foothill Boulevard (PM peak hour)
• Sierra Avenue/Foothill Boulevard (PM peak hour)

Community Impact Report
West Valley Connector Project 235
Figure 6-1: Study Intersection Locations (Sheet 1 of 2)

Community Impact Report
236 West Valley Connector Project
Figure 6-2: Study Intersection Locations (Sheet 1 of 2)

Community Impact Report
West Valley Connector Project 237
By future year 2040, the following intersections are considered to be adversely impacted by
the Alternative B scenario:
• Garey Avenue/Holt Avenue (AM and PM peak hours)
• Towne Avenue/Holt Avenue (PM peak hours)
• East End Avenue/Avenue (PM peak hours)
• Euclid Avenue/Holt Boulevard (AM peak hours)
• Rochester Avenue/Foothill Boulevard (PM peak hours)
• Day Creek Boulevard/Foothill Boulevard (PM peak hours)
• Citrus Avenue/Foothill Boulevard (PM peak hours)
• Sierra Avenue/San Bernardino Avenue (AM peak hours)
• Sierra Avenue/Marygold Avenue (PM peak hours)
• Juniper Avenue/Valley Boulevard (PM peak hours)
• Haven Avenue/Arrow Route (PM peak hours)
• Haven Avenue/Foothill Boulevard (PM peak hours)
On-street parking along Holt Boulevard is proposed to be eliminated along the 3.5 mile
segment between Benson Avenue and Vineyard Avenue. Currently, on-street, non-metered
parking is provided along this segment. Since on-street parking is unmarked, parking space
capacity was estimated based on the length of available curb, assuming on average vehicle
length of 20 feet. According to the Traffic Operations Analysis (Iteris 2017), the current
utilization rate of on-street parking demand during a typical weekday is below 11 percent.
Considering the low utilization of on-street parking demand during a typical weekday as well
as the presence of off-street parking lots provided by most businesses, it is not likely that the
removal of on-street parking to accommodate Alternative B would have an adverse effect on
parking conditions.
O&M Facility
The O&M facility at Site Options 1 or 2 would have access along Cucamonga Avenue.
Based on the threshold indicated above, in opening year 2023, the following two
intersections are considered to be adversely impacted by the O&M facility at the Site 1 or 2
scenario:
• #2 Campus Avenue/Belmont Street (AM and PM peak hours)
• #4 Bon View Avenue/Belmont Street (PM peak hour)
By future year 2040, the following three intersections are considered to be adversely
impacted by the O&M facility at the Site 1 or 2 scenario:
• #2 Campus Avenue/Belmont Street (AM and PM peak hours)
• #4 Bon View Avenue/Belmont Street (PM peak hour)
• #6 Grove Avenue/Mission Boulevard (AM and PM peak hours)

Community Impact Report
238 West Valley Connector Project
The O&M facility at Site Option 3 would have access along Bon View Avenue. Based on the
threshold indicated earlier, in opening year 2023, the following two intersections are
considered to be adversely impacted by the O&M facility at the Site 1 or 2 scenario:
• #2 Campus Avenue/Belmont Street (AM and PM peak hours)
• #4 Bon View Avenue/Belmont Street (PM peak hour)
By future year 2040, the following three intersections are considered to be adversely
impacted by the O&M facility at the Site 3 scenario:
• #2 Campus Avenue/Belmont Street (AM and PM peak hours)
• #4 Bon View Avenue/Belmont Street (PM peak hour)
• #6 Grove Avenue/Mission Boulevard (AM and PM peak hours)
Temporary Impacts
BRT Corridor
During construction, the project would result in temporary impacts to traffic circulation due to
traffic detours around work zones involving lane closures. The project would minimize
disruption to the extent practicable by maintaining driveway access to adjacent properties
throughout construction of the project. SBCTA will work with the affected property owners to
identify the convenient time that the construction could occur. Traffic flow, including bicycle
lanes and pedestrian walkways along the roadway alignment, would also be maintained
during construction, although occasionally lane reduction could occur to accommodate
construction activities. Measure CI-TRA-1 states the Traffic Management Plan (TMP) will
outline any necessary pedestrian detours, which provide a protected pathway near, but
safely away from station construction. For the dedicated lane segment, reconstruction of
the roadway would be done segment by segment and one side at a time to avoid roadway
closure.
Temporary construction easements (TCEs) would be required at various roadway segments
under construction. However, access obstructions in and out of any residential homes and
local businesses are not anticipated. On-street parking may be affected during construction,
but as discussed above, the low utilization rates of existing on-street parking does not
suggest that the impacts would cause an adverse effect. SBCTA would coordinate with the
traffic department of the local jurisdictions and with community groups, emergency service
providers, and motorists in developing detour routes and other traffic considerations. As
such, these detours and lane closures are not expected to have substantial adverse effects
on public or emergency service delivery or the ability of people to access public facilities.
Coordination with local jurisdictions and public transportation providers would continue
through the final design to identify emergency service routes that serve hospitals, fire/police
stations, emergency shelters, emergency command centers, and other facilities that provide

Community Impact Report
West Valley Connector Project 239
essential services in times of emergencies within the study area. These emergency service
routes would be maintained during construction or alternate routes provided. Residents and
business owners along the corridor wouldalso be given advance notice of the work to be
performed and the duration.
O&M Facility
Construction of the O&M facility would be confined within the existing site, which is zoned
for industrial use. In addition, construction of the O&M facility would be scheduled to occur
at a different time than the corridor construction. Construction materials delivery to and from
the construction site could occur periodically during the construction period; however, no
adverse impacts would be anticipated with the traffic control plan implemented.
6.2.2 Public Transportation
No Build Alternative
The No Build Alternative would maintain the current level of transit service along the project
corridor. Any additional transit services would only be provided in the study area with the
intent of responding to a growing population and commensurate growth in demand for
transit services. While this additional transit service would maintain an alternative to
automobile travel, it would be subject to the same traffic congestion and deterioration of
travel times associated with auto modes. As congestion along existing streets continues to
worsen, reliability and quality of public transportation services will continue to degrade.
Build Alternatives
BRT Corridor
Common to All Build Alternatives
With implementation of a build alternative, it is anticipated that the project would enhance
Omintrans’ current service and access to and from transit centers and encourage increased
ridership, thereby increasing transit usage in the surrounding community. The ridership
forecasts for the West Valley Connector Corridor are summarized in Table 6-4. This table
displays a summary of the ridership forecast for the premium bus routes and local bus
routes serving the corridor. Ridership forecasts are displayed for the No Build Alternative
and build alternatives.
As shown in Table 6-4, Phase I/Milliken Alignment of the proposed project is planned to
open in 2020 and is forecast to provide service for 5,800 riders in the opening year. When
coupled with ridership that would be maintained from local Bus Routes 61 and 66, total daily
public transit ridership along the corridor in 2020 is estimated to be approximately 11,000.
This amounts to more than 2,300 new daily transit trips, or a 27 percent increase over the
forecast ridership without the proposed project.

Community Impact Report
240 West Valley Connector Project
The Phase II/Haven Alignment is planned to be constructed after the Phase I/ Milliken
Alignment is completed and when the funding is available. The opening year for Phase
II/Haven Alignment would be sometime between 2022 and 2040. Both phases of operation
combined are forecast to provide service for 8,290 riders at the opening year. When coupled
with ridership on the local bus routes, total daily ridership along the corridor is estimated to
be approximately 12,000 daily transit trips, a 36 percent increase over the forecast ridership
without the proposed project.
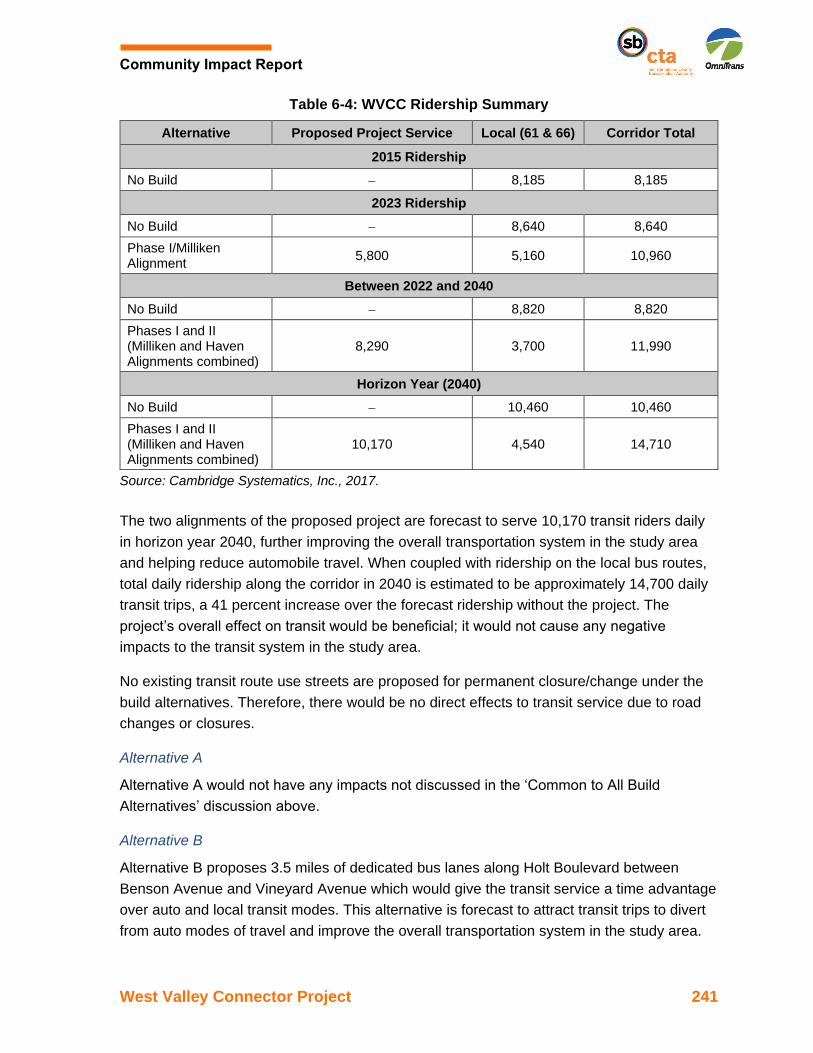
Community Impact Report
West Valley Connector Project 241
Table 6-4: WVCC Ridership Summary
Alternative Proposed Project Service Local (61 & 66) Corridor Total
2015 Ridership
No Build − 8,185 8,185
2023 Ridership
No Build − 8,640 8,640
Phase I/Milliken Alignment
5,800 5,160 10,960
Between 2022 and 2040
No Build − 8,820 8,820
Phases I and II (Milliken and Haven Alignments combined)
8,290 3,700 11,990
Horizon Year (2040)
No Build − 10,460 10,460
Phases I and II (Milliken and Haven Alignments combined)
10,170 4,540 14,710
Source: Cambridge Systematics, Inc., 2017.
The two alignments of the proposed project are forecast to serve 10,170 transit riders daily
in horizon year 2040, further improving the overall transportation system in the study area
and helping reduce automobile travel. When coupled with ridership on the local bus routes,
total daily ridership along the corridor in 2040 is estimated to be approximately 14,700 daily
transit trips, a 41 percent increase over the forecast ridership without the project. The
project’s overall effect on transit would be beneficial; it would not cause any negative
impacts to the transit system in the study area.
No existing transit route use streets are proposed for permanent closure/change under the
build alternatives. Therefore, there would be no direct effects to transit service due to road
changes or closures.
Alternative A
Alternative A would not have any impacts not discussed in the ‘Common to All Build
Alternatives’ discussion above.
Alternative B
Alternative B proposes 3.5 miles of dedicated bus lanes along Holt Boulevard between
Benson Avenue and Vineyard Avenue which would give the transit service a time advantage
over auto and local transit modes. This alternative is forecast to attract transit trips to divert
from auto modes of travel and improve the overall transportation system in the study area.

Community Impact Report
242 West Valley Connector Project
O&M Facility
Construction of the proposed O&M facility would support BRT vehicles used for BRT service
under both alternatives. It is certain the planned BRT system can be implemented and
maintained. No impacts to the transportation system would occur as a result of the proposed
O&M facility implementation.
Temporary Impacts
BRT Corridor
As discussed above, temporary impacts to public transportation would result from construction
activities, including lane closures along arterial streets. SBCTA would coordinate with the
traffic department of the local jurisdictions and with all corridor emergency service providers in
developing detour routes and other traffic considerations. In addition, coordination with other
public transportation providers would ensure that the public is aware of any detour information.
O&M Facility
There would be no temporary impacts to the public transportation system during the O&M
facility construction.
6.3 Avoidance, Minimization, and Mitigation Measures
Project Design Modification
The project design will incorporate roadway improvement measures as outlined in TRA-1
and TRA-2 (see Section 5.5.4).
Traffic Operations Minimization and Mitigation Measures
Several traffic impact reduction measures are identified in the Traffic Operations Analysis
Report (Iteris, 2018) to help alleviate traffic impacts that are anticipated by 2023 and 2040
throughout the corridor. These recommended traffic operation improvements consist of
various right-turn geometric improvements, traffic signal timing and phasing improvements,
and other TSM improvements that could be implemented, as summarized in Table 6-5.
Table 6-5: Potential Traffic Operations Mitigation Measures
Impacted Intersections
Alternatives Proposed Avoidance Measures Level of
Significance with Mitigation
Garey Avenue/ Holt Boulevard
A and B Restripe the eastbound Holt Avenue approach to add a dedicated right-turn lane.
Not Significant

Community Impact Report
West Valley Connector Project 243
Table 6-5: Potential Traffic Operations Mitigation Measures
Impacted Intersections
Alternatives Proposed Avoidance Measures Level of
Significance with Mitigation
Towne Avenue/ Holt Boulevard
A and B Modify the traffic signal to include protected plus permitted phasing at the northbound and southbound Towne Avenue approaches.
Not Significant
East End Avenue/ Holt Boulevard
A and B Restripe the eastbound Holt Avenue right-turn lane to a shared through/right-turn lane.
Not Significant
Euclid Avenue/ Holt Boulevard
B No feasible measures are available.
Significant and Unavoidable
Rochester Avenue/ Foothill Boulevard
A and B No feasible measures are available.
Significant and Unavoidable
Day Creek Boulevard/ Foothill Boulevard
A and B Restripe the third northbound through lane to a shared through/ right-turn lane.
Not Significant
Citrus Avenue/ Foothill Boulevard
A and B No feasible measures are available.
Significant and Unavoidable
Sierra Avenue/ Foothill Boulevard
A and B Modify the traffic signal to include protected plus permitted phasing at the eastbound and westbound Foothill Boulevard approaches.
Not Significant
Sierra Avenue/San Bernardino Avenue
A and B Modify the traffic signal to include protected plus permitted phasing at the eastbound and westbound San Bernardino Avenue approaches.
Not Significant
Sierra Avenue/ Marygold Avenue
A and B Modify and restripe the eastbound Marygold Avenue shared through/ right lane to a right-turn lane with a dedicated eastbound through lane.
Not Significant
Juniper Avenue/ Valley Boulevard
A and B Restripe the westbound Valley Boulevard approach to add a dedicated right-turn lane.
Not Significant
Haven Avenue/ Arrow Route
A and B No feasible measures are available.
Significant and Unavoidable
Haven Avenue/ Foothill Boulevard
A and B No feasible measures are available.
Significant and Unavoidable
Campus Avenue/ Belmont Street
O&M facility Sites 1,2, or 3
No feasible measures are available.
Significant and Unavoidable
Bon View Avenue/ Belmont Street
O&M facility Sites 1,2, or 3
No feasible measures are available.
Significant and Unavoidable
Grove Avenue/ Mission Boulevard
O&M facility Sites 1,2, or 3
Modify the traffic signal to include a right-turn overlap phase at the westbound Mission Boulevard approach.
Not Significant
Source: WVC Project Traffic Operational Analysis Report, 2018.

Community Impact Report
244 West Valley Connector Project
SBCTA will work with local jurisdictions to improve local roadway conditions where traffic
operation impacts have been identified. For the intersections identified where feasible
mitigation is proposed, SBCTA will include those feasible intersection improvement
measures as part of the project. SBCTA will be responsible to fund the full cost for feasible
improvements to be undertaken by local jurisdictions.
For intersections that are infeasible to mitigate, further coordination with local jurisdictions
would be required to identify appropriate traffic improvement compensation.
Minimization and Mitigation Measures during Construction
CI-TRA-1 SBCTA will prepare a TMP in cooperation with local municipalities prior to
construction. The TMP will be submitted with the construction plan to the
police and fire departments of affected cities prior to commencement of
construction activities. The TMP will outline necessary street closures and
detours. In addition, detours around construction areas will be identified for
bicyclists and pedestrians. Signs will be posted to direct bicyclists and
pedestrians to intersections where they may cross. A restriction on large-size
trucks shall be imposed to confine travel to and from the construction site
during off-peak commute times.
CI-TRA-2: Business access shall be maintained at all times during construction, and
work will be scheduled to avoid unnecessary inconvenience to the public and
abutting property owners. Undue delays in construction activities will be
avoided to reduce the public’s exposure to construction.

Community Impact Report
West Valley Connector Project 245
CUMULATIVE IMPACTS
NEPA defines cumulative effects as the impact on the environment resulting from the
incremental impact of the project action when added to other past, present, and reasonably
foreseeable future actions, regardless of what agency or person undertakes such actions.
Cumulative impacts can result from individually minor but collectively significant actions
occurring over time. NEPA provides the context and carries the mandate to analyze the
cumulative effects of a federal action. The purpose of cumulative effect analysis is to ensure
that federal decisions consider the full range of an action’s consequences.
One method for assessing cumulative effects is to summarize land use, population, and
employment projects listed in adopted general plans and related planning documents
designed to evaluate regional or area-wide conditions. This approach is particularly
appropriate to transportation projects as it accounts for future travel demand generated by
anticipated land use and employment changes. See Tables 2-4, 2-5, and Figure 2-5 in
Section 2.6 for a list of development and transportation plans within 5 miles of the proposed
project.
No Build Alternative
The No Build Alternative would not result in any cumulative effects.
Build Alternatives
Land Use
The build alternatives and the proposed O&M facility are not expected to have an adverse
cumulative impact on land use when considered with any transportation, commercial,
industrial, or residential projects because implementation of the proposed project is
consistent with adopted land use and transportation plans. The No Build Alternative is
expected to result in cumulative impacts because it is inconsistent with many regional and
local goals and policies that guide development towards one that features a multimodal
transportation system that includes the provision of high quality public transportation.
Community Character
Temporary construction cumulative impacts on the regional population could occur if
multiple projects in the same locality are scheduled to undergo construction at the same
time. SBCTA would work closely with the cities and communities within the project area to
identify such potential consequences and adjust construction schedules to avoid
construction, to the extent practicable, if multiple projects occur within the same locality
simultaneously.

Community Impact Report
246 West Valley Connector Project
Alternative B would result in the acquisition and removal of nonresidential/business
properties and the displacement of employees. Some of the other cumulative projects
identified in Tables 2-4 and 2-5 are also expected to result in the acquisition and removal of
residential and nonresidential properties. As a result, Alternative B may contribute
incrementally to cumulative impacts to community character related to removal of
businesses. However, this potential cumulative effect would be offset by implementation of
the approved land development projects listed in Tables 2-4 and 2-5. In addition, displaced
properties or people would be relocated within the same city or area vicinity as the affected
property. As a result, Alternative B would contribute incrementally to continuing changes in
community character and cohesion in the study area.
Economy
The build alternatives and the proposed O&M facility are not expected to have an adverse
cumulative impact on the regional economy when considered with any transportation,
commercial, industrial, or residential projects because no permanent impacts to the regional
economy are anticipated as a result of the proposed project. No cumulative impacts to
income or employment are anticipated. The proposed project would cause a negligible
reduction in property tax and sale tax revenues in the project area counties; and would not
have an adverse cumulative impact on business activity. Beneficial impacts include
improved public transportation linkages, which may improve access to the rest of the region.
Community Facilities
No cumulative impacts are anticipated as a result of the build alternatives and the proposed
O&M facility in relation to community facilities or emergency services because there are no
permanent impacts.
Relocations
The build alternatives and the proposed O&M facility are not expected to have an adverse
cumulative impact on relocations when considered with any transportation, commercial,
industrial, or residential projects because replacement properties are available within close
proximity.
Environmental Justice
Because the build alternatives and the proposed O&M facility would not cause
disproportionately high and adverse effects on minority or low-income populations from
implementation of the build alternatives, no permanent cumulative impacts are anticipated.
Traffic
The build alternatives and the proposed O&M facility include the provision of a high quality
transit alternative to the automobile within the project service area, encouraging a more

Community Impact Report
West Valley Connector Project 247
multimodal transportation system. In addition, the project would service multiple transfer
stations and key destinations along the project corridor, thus providing increased
connectivity to the rest of the region. This would reduce the amount of single occupancy
automobiles on the roads and decreasing the burden on the existing transportation network.
As such, no permanent cumulative impacts are anticipated.

Community Impact Report
248 West Valley Connector Project
This page intentionally left blank.
Community Impact Report
West Valley Connector Project 249
PUBLIC INVOLVEMENT
Early and frequent coordination with the general public and appropriate public agencies is
an essential part of the environmental process to determine the scope of environmental
documentation, the level of analysis, potential impacts and mitigation measures, and related
environmental requirements.
Community outreach and participation have been integrated into the project development
process from the outset, including alternatives development, extensive public and agency
stakeholder involvement, and public scoping. SBCTA’ stakeholder outreach began during
the Alternatives Analysis (AA) phase of the project in 2014. During the AA phase, a Project
Development Team (PDT) was established and comprised of representatives from all of the
local jurisdictions traversed by the West Valley Connector corridor and other affiliated
agencies and businesses to review all of the technical work and provide input on the
preferred transit solution. The PDT included representatives from:
• Omnitrans
• San Bernardino Associated Governments (SBCTA)
• Southern California Association of Governments (SCAG)
• County of San Bernardino
• City of Fontana
• City of Montclair
• City of Ontario
• City of Pomona
• City of Rancho Cucamonga
• Foothill Transit
• Los Angeles County Metropolitan Transportation Authority (LA Metro)
• Southern California Regional Rail Authority (SCRRA/Metrolink)
• Los Angeles World Airports (LAWA)
• Simon Group (Ontario Mills)
• Kaiser Permanente
As part of the AA phase, SBCTA conducted public outreach activities in May and June 2014
to explain the purpose and objectives of the project, and to provide a range of opportunities
to answer questions and collect comments from the public. Specific outreach activities
included two public information meetings, two rider information sessions, a transit operator
information session, and a community survey.
Public Scoping Meetings
As part of the environmental documentation phase, public scoping meetings were held in
each of the five project corridor cities between April 12 and 20, 2016. The purpose of the

Community Impact Report
250 West Valley Connector Project
public scoping meetings was to initiate the environmental documentation phase by providing
the public an opportunity to comment and identify potential environmental impacts and
methods to reduce, avoid, and mitigate impacts.
SBCTA recognizes the need to provide multicultural, multilingual, fully accessible,
economically diverse participation from stakeholders along the project corridor. Many
diverse attempts were made to ensure that both English and Spanish speaking community
members had access to information about the West Valley Connector Corridor Project
because English and Spanish are the most common spoken languages within the project
area. Special outreach efforts for the public scoping meetings included a pre-postage paid
postcard in English and Spanish that was sent to approximately 1,035 stakeholders;
advertisements in two English and two Spanish newspaper publications; online ads on two
English newspaper publication websites; a project webpage and Facebook page; electronic
notices (e-blasts) to stakeholders; English and Spanish flyers sent to 45 public facilities
(e.g., libraries, community centers, city halls, senior centers); announcements at the city
Council meetings in each of the five cities; announcements in SBCTA’ online blog and
bilingual newsletter; and poster ads on Omnitrans buses. Spanish translation services were
available at each of the five public scoping meetings.
Focused Public Outreach
In addition to public scoping meetings, focused public outreach was conducted targeting
affected property owners, residents and environmental justice communities to gather
feedback on the project. A total of three meetings were held in Ontario, Rancho
Cucamonga, and Pomona from June 13-15, 2017.
A variety of public notification strategies were executed in advance of the Holt Boulevard
focused outreach meetings. Full color bilingual (English and Spanish) meeting notification
postcards were mailed to property owners and tenants within 0.25-mile from Holt Boulevard,
between Benson Avenue and Vineyard Avenue, and to environmental justice groups. The
notification postcards included information on the project; the purpose of the meetings; the
date, time, and location of the meetings; SBCTA contact information; and a project exhibit
showing the BRT alignment and station locations.
A total of 7,242 mailers were sent via USPS on May 30, 2017 (2,343 mailers were sent to
property owners, 4,738 mailers were sent to tenants, and 161 mailers were sent to
environmental justice groups). In addition, the mailer was emailed to two environmental
justice groups (United Voices of Pomona for Environmental Justice and Healthy in Pomona)
on June 6, 2017 since these environmental justice groups did not have a physical mailing
address. The meetings were held in an open house format where project exhibit boards
were displayed. SBCTA and Project staff were on hand to answer questions from the public
and to gather public comments and feedback.

Community Impact Report
West Valley Connector Project 251
The first outreach meeting was held on June 13, 2017 at the Ontario Senior Center in
Ontario from 3:00 p.m. to 7:00 p.m. Attendance was brisk with several participants arriving
before the meeting start time. In total, thirty-three (33) individuals signed in on the meeting
sign-in sheets. It is estimated that seven (7) additional participants attended but chose to not
sign in bringing the total meeting attendance to approximately forty (40). There were at least
four individuals that required Spanish interpretation.
The second outreach meeting was held on June 14, 2017 at North Hills Community Church
in Rancho Cucamonga from 3:00 p.m. to 7:00 p.m. Six (6) individual attended the meeting
with no participants requiring Spanish interpretation.
The third outreach meeting was held on June 15, 2017 at Purpose Church in Pomona from
3:00 p.m. to 7:00 p.m. Nine (9) individuals attended the meeting with no participants
requiring Spanish interpretation.
Circulation of the Draft Environmental Document
The Draft Environmental Impact Report/ Environmental Assessment (Draft EIR/EA) has
been prepared in accordance with the CEQA and NEPA requirements. The document was
circulated for public review and comment for a period of 45 days, from June 24 to August 8,
2019. Four public meetings were held within the project area to inform the public of the
proposed project and encourage public input.
Other Outreach Efforts
Public outreach activities will continue throughout the development of the project including
consistent updates and announcements on the project website and Facebook page that will
allow interested parties to stay up to date regarding the progress of the environmental
documentation phase.

Community Impact Report
252 West Valley Connector Project
This page intentionally left blank.
\

Community Impact Report
West Valley Connector Project 253
REFERENCES
California Department of Finance. 2016. California County Population Estimates.
California Department of Transportation. 2015. California County-Level Economic Forecast
2015-2040.
City of Fontana. 2018. General Plan.
City of Fontana. 2009. Arboretum Specific Plan.
City of Fontana. 2006. Summit at Rosena Specific Plan.
City of Fontana. 2007. Valley Trails Specific Plan.
City of Fontana. 2007. Fontana Promenade Specific Plan.
City of Fontana. 2007. Ventana at Duncan Canyon Specific Plan.
City of Fontana. 2015. Westgate Specific Plan.
City of Fontana. 2003. West End Specific Plan.
City of Fontana. 1984. Northgate Specific Plan.
City of Fontana. 1984. Southwest Industrial Park Specific Plan.
City of La Verne. 2013. Old Town La Verne Specific Plan.
City of Montclair. 1999. General Plan.
City of Montclair. 2006. North Montclair Downtown Specific Plan.
City of Montclair. 1991. Holt Boulevard Specific Plan.
City of Ontario. 2008. The Ontario Plan.
City of Ontario. 2010. I-10 Grove Interchange and Corridor.
City of Ontario. 2015. Meredith International Centre Specific Plan.
City of Ontario. 2006. Ontario Center Specific Plan.
City of Ontario. 2012. Ontario Festival Specific Plan.
City of Ontario. 1996. Ontario Mills Specific Plan.
City of Ontario. 2011. Guasti Plaza Specific Plan.

Community Impact Report
254 West Valley Connector Project
City of Ontario. 2010. Wagner Properties Specific Plan.
City of Ontario. 2013. Holt Boulevard Mobility and Streetscape Strategic Plan.
City of Ontario. 2008. West Haven Specific Plan.
City of Ontario. 2008. Tuscana Village Specific Plan.
City of Ontario. 2008. Transpark Specific Plan.
City of Ontario. 2007. The Exchange Specific Plan.
City of Ontario. 2007. Rich-Haven Specific Plan.
City of Ontario. 2009. Crossroads Business Park.
City of Ontario. 2006. Parkside Specific Plan.
City of Ontario. 2014. Grand Park Specific Plan.
City of Ontario. 2010. The Avenue Specific Plan.
City of Ontario. 2015. 15/16 Budget.
City of Pomona. 2014. Pomona General Plan.
City of Pomona. 2013. Pomona Corridors Specific Plan.
City of Pomona. 2005. Downtown Pomona Specific Plan.
City of Rancho Cucamonga. 2010. General Plan.
City of Rancho Cucamonga. 1999. Development Code.
City of Rancho Cucamonga. 2013. Rancho Cucamonga Foothill Boulevard BRT Corridor
Study.
City of Rancho Cucamonga. 1981. Industrial Area Specific Plan.
City of Rancho Cucamonga. 1987. Foothill Boulevard Specific Plan.
City of Rancho Cucamonga. 2002. Foothill Boulevard Visual Improvement Plan.
City of Rancho Cucamonga. 1983. Terra Vista Community Plan.
City of Rancho Cucamonga. 1981. Victoria Community Plan.
City of Rancho Cucamonga. 2002. Victoria Arbors Master Plan.
City of Rancho Cucamonga. 2002. Victoria Gardens Master Plan.

Community Impact Report
West Valley Connector Project 255
City of Rialto. 2010. The Renaissance Specific Plan.
City of Rialto. 2010. Foothill Boulevard Specific Plan.
City of Rialto. 2016. Pepper Avenue Specific Plan.
City of Rialto. 2010. Lytle Creek Ranch Specific Plan.
City of Upland. 2008. Park View Specific Plan.
City of Upland. 2004. College Park Specific Plan.
Council of Economic Advisers. 2014. The American Jobs Act: Impact for California.
Retrieved in June 2016 from https://www.whitehouse.gov/sites/default/files/
THE_AMERICAN_JOBS_ACT_Impact_CA.pdf
County of San Bernardino. 2007. The Countywide Plan.
County of San Bernardino. 2014. County of San Bernardino 2013-2021 Housing Element.
Google. 2016. Google Maps.
Iteris. 2017. West Valley Connector Traffic Operations Analysis. December.
Los Angeles County, 2012. Bicycle Master Plan.
Los Angeles County Metropolitan Transportation Authority. 2014. Gold Line Foothill
Extension.
Los Angeles County, Department of Regional Planning. 2015. General Plan 2035.
Omnitrans. 2014. Alternatives Analysis Report, West Valley Connector Corridor.
Parsons. 2017. 30% Preliminary Engineering Design.
Parsons. 2018. Project Census Tract Study Area Map. March.
OPC. 2017. Draft Relocation Impact Report. West Valley Connector Project. October.
Riverside County Transportation Commission. 2016. I-15 Express Lanes.
San Bernardino Associated Governments. 2016. I-10 Corridor Project.
San Bernardino Associated Governments. 2014. Route 210 to Interstate 215 Future Route
210 Construction Activity.
San Bernardino Associated Governments. 2012. GIS Data – Land Use. Retrieved from
http://www.SBCTA.ca.gov/planning2/GIS-data-land-use.html

Community Impact Report
256 West Valley Connector Project
San Bernardino County Flood Control District. 2014. San Bernardino County Master
Stormwater System Maintenance Program.
San Bernardino County Transportation Agency. 2015. Non-Motorized Transportation Plan.
Southern California Association of Governments. 2009. Countywide Zoning. Retrieved from
http://egis3.lacounty.gov/dataportal/2012/04/10/countywide-zoning/
Southern California Association of Governments. 2008. Regional Comprehensive Plan.
Southern California Association of Governments. 2012. Land Use Data. Retrieved from
http://gisdata.scag.ca.gov/SitePages/GIS%20Library.aspx
Southern California Association of Governments. 2015. 2015 Adopted FTIP. Retrieved from
http://ftip.scag.ca.gov/Pages/2015/adopted.aspx
Southern California Association of Governments. 2016. 2016-2040 Regional Transportation
Plan/Sustainable Communities Strategy.
Southern California Association of Governments. 2016. Sustainability Planning Grant.
Southern California Association of Governments. 2016. Draft 2016 RTP/SCS Growth
Forecast by Jurisdiction. Retrieved in June 2016 from
http://www.scag.ca.gov/Documents/2016DraftGrowthForecastByJurisdiction.pdf
Southern California Regional Rail Authority. 2016. Monthly Ridership (Conductor Counts).
Retrieved in October 2016 from
http://www.metrolinktrains.com/pdfs/Facts&Numbers/Monthly_Line_Ridership/Average_and
_Total_Ridership_Report_FY16.pdf
United States Department of Health and Human Services (HHS). 2016. Poverty Guidelines.
Retrieved in June 2016 from https://aspe.hhs.gov/2015-poverty-guidelines.
United States Environmental Protection Agency (EPA). 2016. Glossary of EJSCREEN
Terms. Retrieved in October 2016 from https://www.epa.gov/ejscreen/glossary-ejscreen-
terms
United States Census Bureau. 2016. 2010-2014 American Community Survey 5-Year
Estimates. Retrieved between April and July 2016 from
http://factfinder.Census.gov/faces/nav/jsf/pages/index.xhtml#
Community Impact Report
West Valley Connector Project 257
APPENDIX A – CENSUS TRACT DATA

Community Impact Report
258 West Valley Connector Project
This page intentionally left blank.