community impact - cloud object storage | store & retrieve ... · •$482,102 total community...
TRANSCRIPT

The Real Cost of Patient Leakage
Community Impact

Agenda
• Community Care Model• Financial Impact of Patient Leakage• New Research• The Model
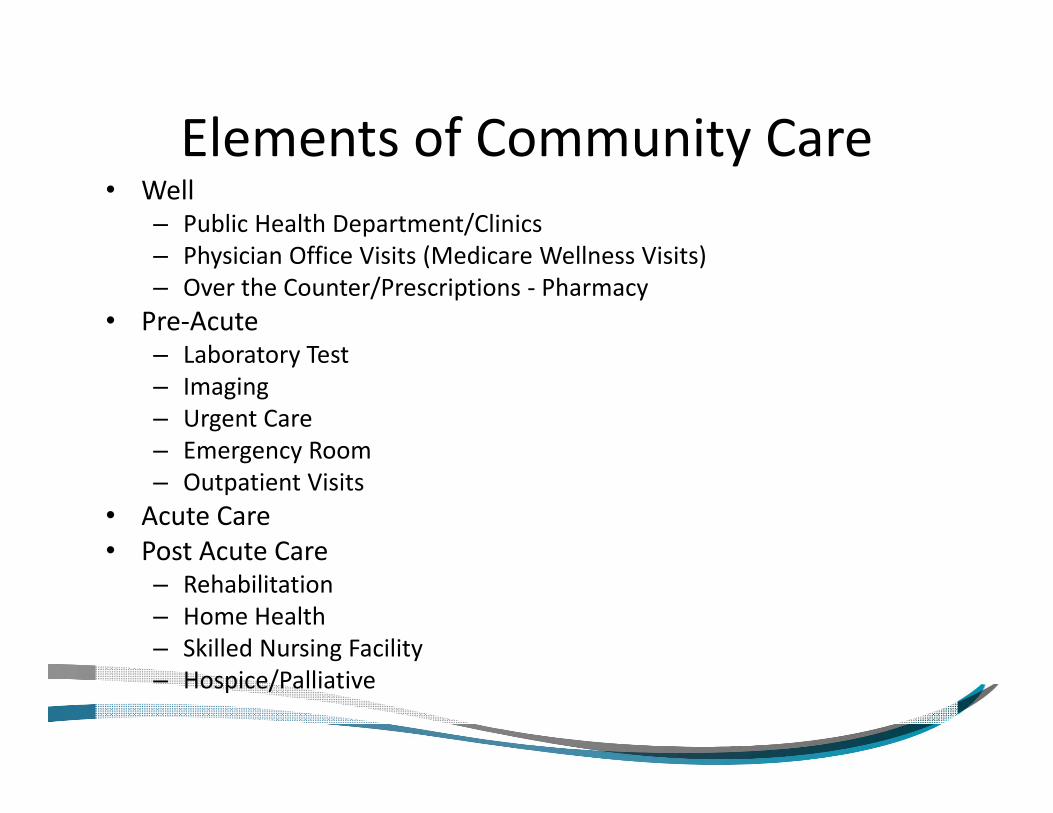
Elements of Community Care• Well
– Public Health Department/Clinics– Physician Office Visits (Medicare Wellness Visits)– Over the Counter/Prescriptions ‐ Pharmacy
• Pre‐Acute– Laboratory Test– Imaging– Urgent Care– Emergency Room– Outpatient Visits
• Acute Care• Post Acute Care
– Rehabilitation– Home Health– Skilled Nursing Facility– Hospice/Palliative

Total Cost of Care• Consumer Out of Pocket Spending
– Deductibles– Over the Counter– Insurance Premiums
• Employer Insurance Premiums• TCO (You and Me)‐Family of Four
– $1,062 X 12 = $12,744 (Premium) + $2,500 Deductible + Co‐Insurance (Max Out of Pocket $12,000)
– Rates go up another (18%+36% increases past two years) + 40% in 2017 (Hold on!)
– Median Household Income $93,743 (so 14%‐26% of Income goes to Healthcare)

National Health Expenditures• Hospital Care• Professional Services
– Physician– Other– Dental
• Residential and Personal Care• Home Health• Nursing Care• Retail
– Prescription Drugs– Other Medical Products/DME
• Government Administration• Private Insurance• Government Healthcare• Investments
– R&D– Structures

National Healthcare Expenditures ($Billions)
0
1000
2000
3000
4000
5000
6000
1960 1980 2000 2002 2004 2006 2008 2010 2012 2014 2016 2018 2020 2022 2024
Historical Projected
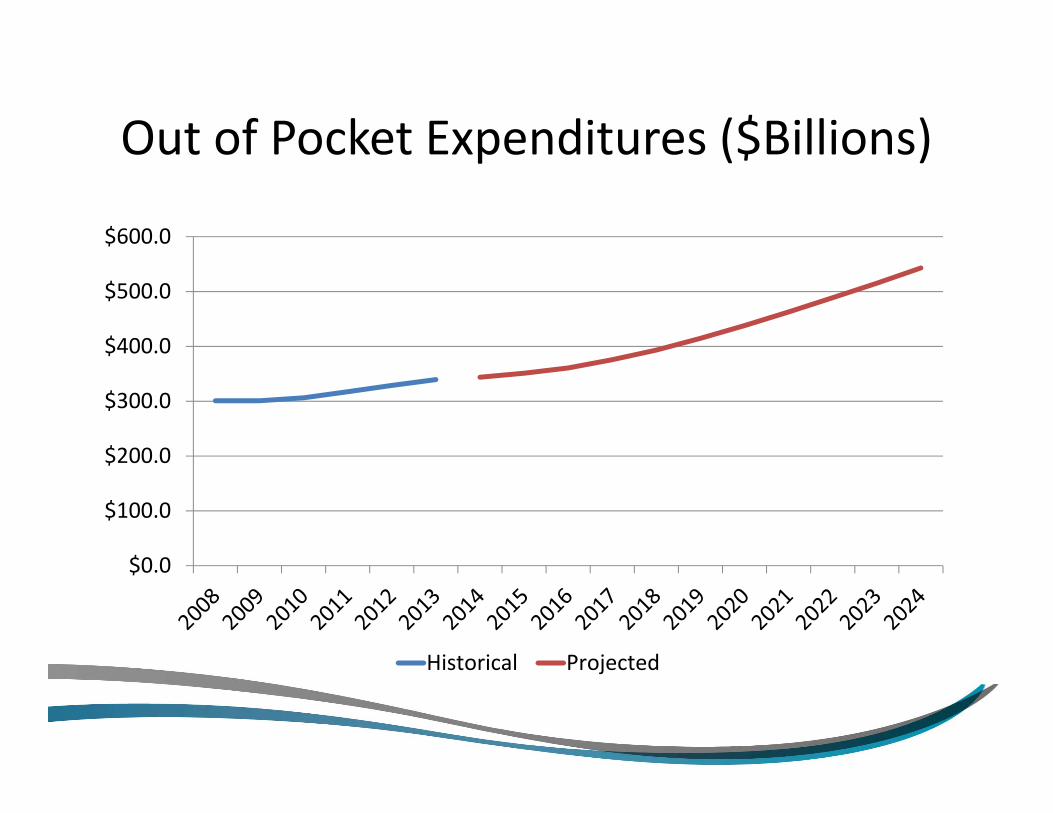
Out of Pocket Expenditures ($Billions)
$0.0
$100.0
$200.0
$300.0
$400.0
$500.0
$600.0
Historical Projected

2015 Projected Health Expenditures
13%
35%
22%
18%
4%8%
Personal Health Expenditures
OOP Pvt Insurance MedicareMedcaid Other Health Ins Third Party Payer

Healthcare Spend by Age
$0.00
$5,000,000,000.00
$10,000,000,000.00
$15,000,000,000.00
$20,000,000,000.00
$25,000,000,000.00
$30,000,000,000.00
$35,000,000,000.00
$40,000,000,000.00
$45,000,000,000.00
$50,000,000,000.00
0 3 6 9 12
15
18
21
24
27
30
33
36
39
42
45
48
51
54
57
60
63
66
69
72
75
78
81
84
87
90
93
96
99
Total Expenditures
Total Expenditures

The Hockey Stick
$0.00
$5,000.00
$10,000.00
$15,000.00
$20,000.00
$25,000.00
$30,000.00
$35,000.00
$40,000.00
0 3 6 9 12
15
18
21
24
27
30
33
36
39
42
45
48
51
54
57
60
63
66
69
72
75
78
81
84
87
90
93
96
99
Avg Expenditures by Age
Avg Expenditures

FINANCIAL IMPACTThe Real Cost of Patient Leakage

Cost of Leakage• 50 Year Old Female in Indiana leaves community hospital and goes to Tertiary Medical Center
• Knee Joint Replacement– Procedure 470 – Major Joint Replacement w/o MCC– Avg. Payments Community $6,925 v Tertiary $11,897– Avg. Charges Community $36,569 v Tertiary $50,834– Lifetime Value of Patient
• $482,102 Total Community Costs (50 to 85)• Current Patients Who Leave Market n=2,854• Total Economic Impact @2,854 X $482,102 = $1.375B

Total Lifetime Value
• Hospitals need to learn new skill sets (Population Health Management)– Life Expectancy Models– Year 50 $244,539– Year 85 $726,641
• Payers will also have to learn new skill sets (Health Care)
• Serious Innovations coming in Care Management
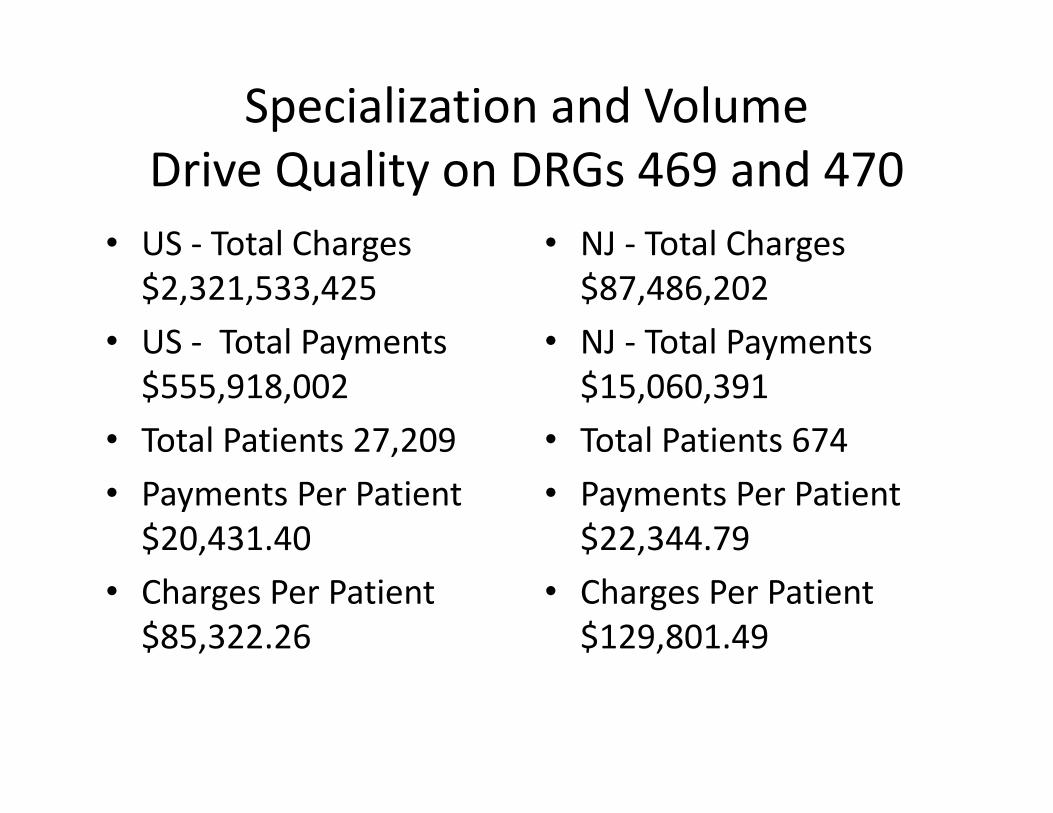
Specialization and VolumeDrive Quality on DRGs 469 and 470
• US ‐ Total Charges $2,321,533,425
• US ‐ Total Payments $555,918,002
• Total Patients 27,209 • Payments Per Patient $20,431.40
• Charges Per Patient $85,322.26
• NJ ‐ Total Charges $87,486,202
• NJ ‐ Total Payments $15,060,391
• Total Patients 674 • Payments Per Patient $22,344.79
• Charges Per Patient $129,801.49

Physician Inbound Referrals
15

Leakage by Physician Based on MOBs
16

WHAT OUR RESEARCH IS SHOWING US
The Real Cost of Patient Leakage

New Research
• Regression Analysis of 2,030 Hospitals• Profitability Driven by Four Variables:
– Overall, we concluded that our dependent variables statistically significantly predicted Net Income, F(11,2016) = 8.902, p < .05, R2 =.046. However, only four variables were statistically significant to the prediction: Doctor Communication, Cleanliness, Quietness, and Recommend Hospital (Note: Pain Management is not far behind).

Cost of Chronic Disease
• 80/20 Rule (Pareto)• 5% of patients represent 50% of Costs• Healthcare Expenditures due to Chronic Diseases $42T – 190M 59% of US affected, 75M have 2+
• Disease Management – Asthma, Diabetes, Chronic Heart Failure (CHF), Chronic Heart Disease (CHD), Hypertension, Chronic Obstructive Pulmonary Disease, and Behavioral Health
Source: Partnership to Fight Chronic Diseases 2016

THE MODELTotal Cost of Care

Return on Investment• Return On Investment
– Total Revenue Returned• Pre‐Acute Visits
– Wellness– Physician Office Visits– Urgent Care
• Acute Care Settings– Inpatient Admissions – Outpatient Visits– Emergency Room Visits
• Post‐Acute Visits– Rehab– Home Health– Skilled Nursing Facilities– Hospice/Pallative

Types of ROI
• Hard ROI – Specific dollars are attributable to the calculations (New Incremental Revenue, Quantifiable Cost Savings, Decrease Penalties)
• Soft ROI – Additional variables where the program contributes to the overall value of the hospital, but does not directly contribute revenue (Improved Image, Improved Health Status, Improved Patient Experience)
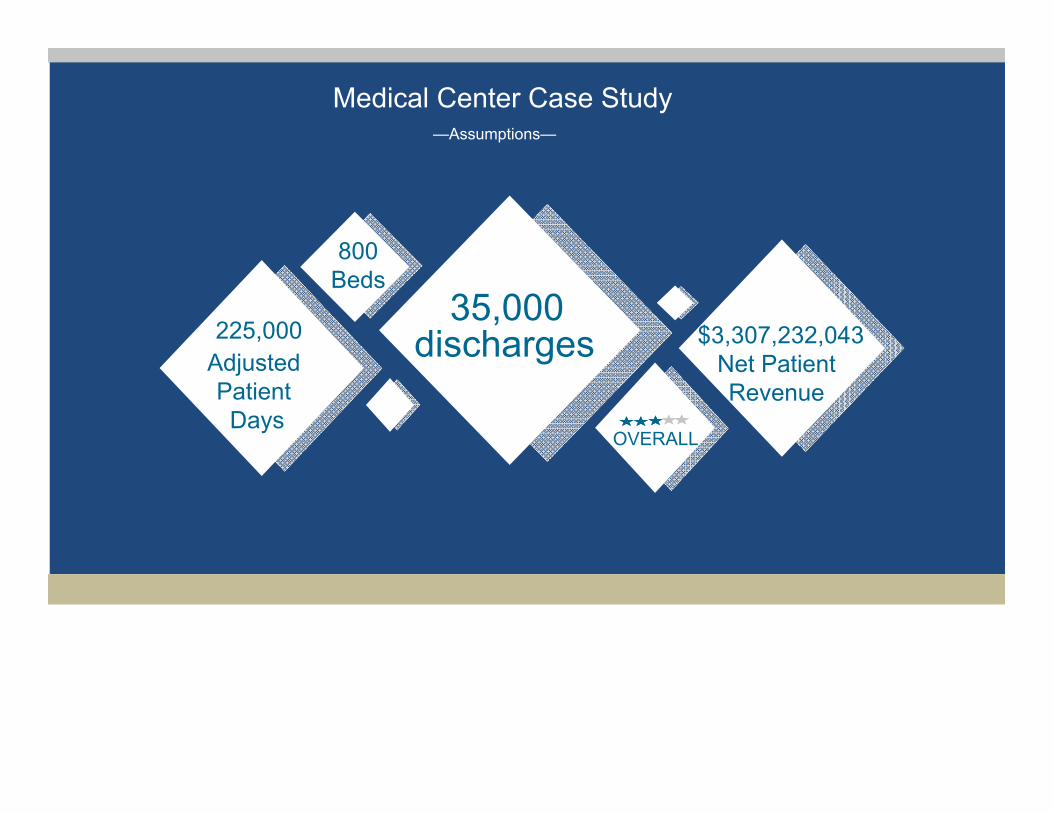
Medical Center Case Study
225,00035,000
Adjusted Patient
Days
discharges $3,307,232,043Net Patient Revenue
OVERALL
800Beds
—Assumptions—

Leakage to Capture—Medical Center—
Medical Center134,393 unique patients last year$443,481,758 in inpatient payments (56% Capture Rate)$208,704,267 in outpatient payments (48% Capture Rate)
Medical Center134,393 unique patients last year$443,481,758 in inpatient payments (56% Capture Rate)$208,704,267 in outpatient payments (48% Capture Rate)
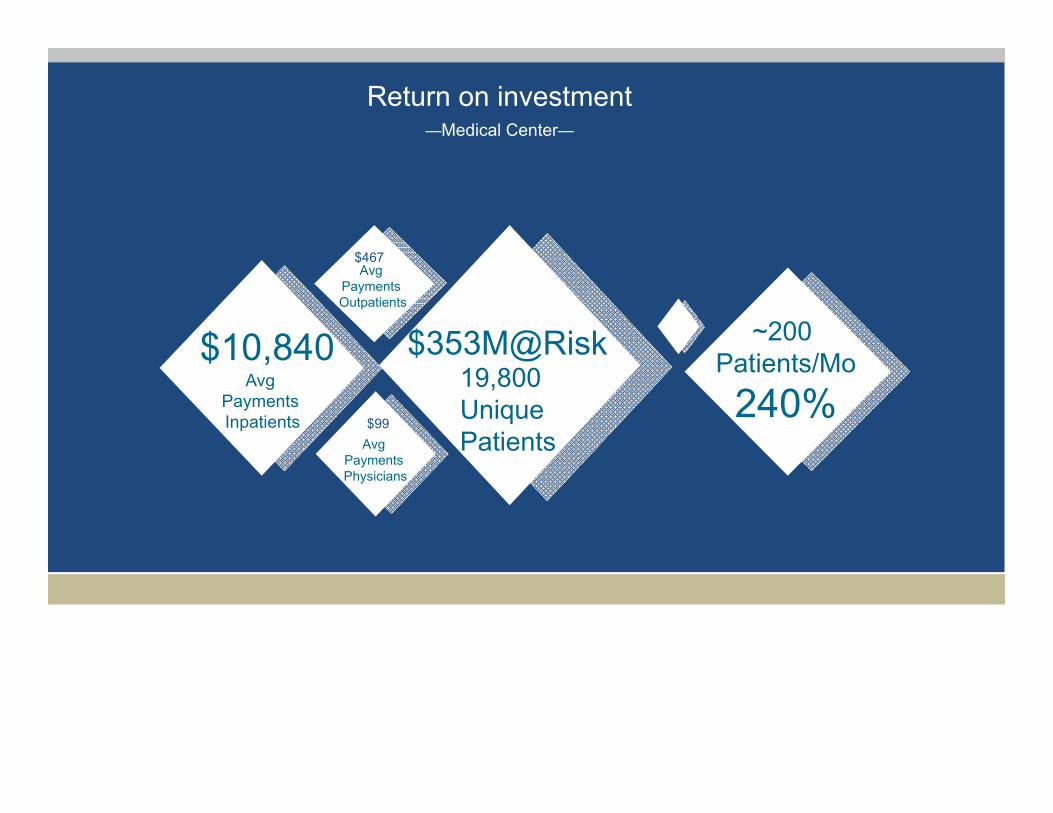
Return on investment
$10,840 ~200 Patients/Mo240%
$353M@RiskAvg
Payments Inpatients
19,800 Unique Patients
—Medical Center—
$467Avg
Payments Outpatients
$99Avg
Payments Physicians

Model Components

Model Output

Summary
• The Cliff is Coming!– The Good News – It’s not until 2030
• When one patient leaves, we all lose• Impact Analysis needs to include Hard and Soft ROI Metrics
• Build a Model and get “Buy‐In” up front on parameters
