community health needs assessment 2016 thank you for your interest in advocate eureka hospital’s...
TRANSCRIPT

Community Health Needs Assessment2014 – 2016

December 2016
Thank you for your interest in Advocate Eureka Hospital’s Community Health Needs Assessment for 2014-2016. Every three years, our hospital staff collaborates with others in the community to assess the health needs of those we serve. This year we were able to partner with regional health departments, other hospitals, social service agencies and community residents to collect and analyze health data.
Our previous assessment resulted in a community health program focused on improving access to mental health services. While access has improved as a result of cooperative interventions, our recent assessment shows a continued need to focus on mental health services for our community. Thus, we will continue our efforts with community partners to develop greater access and ultimately, better mental health for our community.
I want to thank you for taking the time to review our data and recommendations. At the end of our report there is a link to connect with us and express any feedback or ideas you may have to assist us in addressing health issues in our community. It is indeed our privilege to be entrusted with the health of our community and we look forward to partnering with you on improving mental health in Woodford County and the surrounding areas.
Colleen Kannaday President Advocate Eureka Hospital
21 2
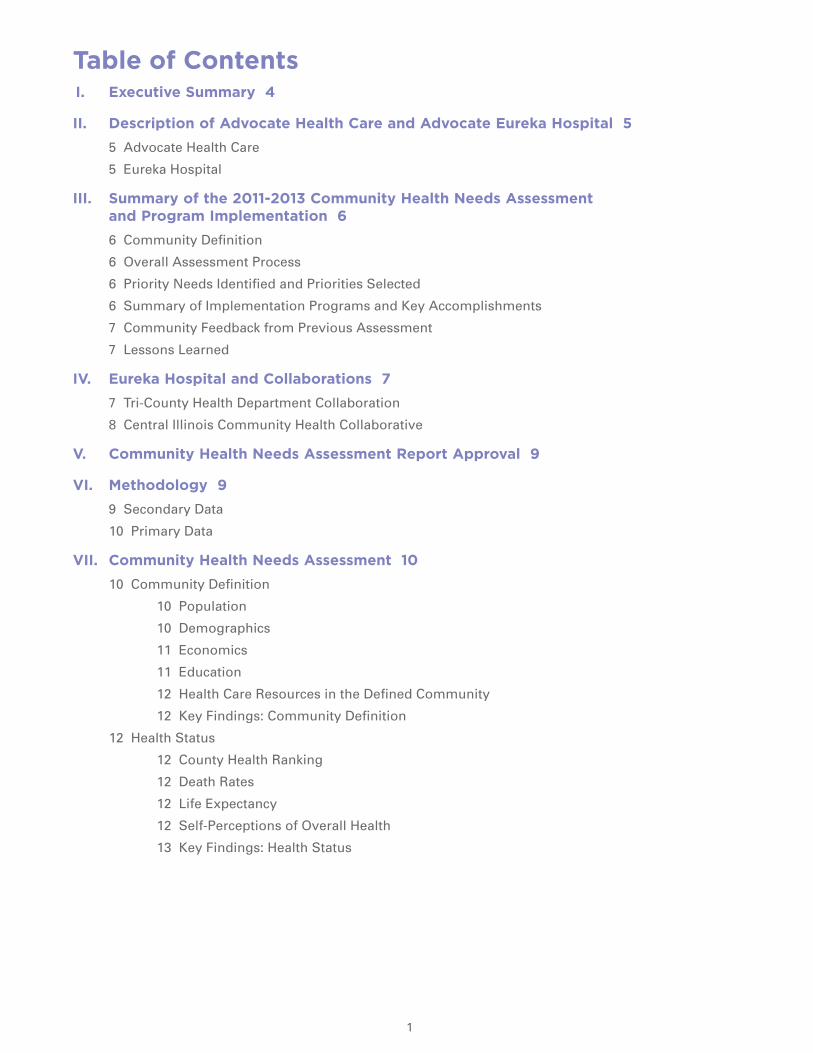
I. Executive Summary 4
II. Description of Advocate Health Care and Advocate Eureka Hospital 5
5 Advocate Health Care
5 Eureka Hospital
III. Summary of the 2011-2013 Community Health Needs Assessment and Program Implementation 6
6 Community Definition
6 Overall Assessment Process
6 Priority Needs Identified and Priorities Selected
6 Summary of Implementation Programs and Key Accomplishments
7 Community Feedback from Previous Assessment
7 Lessons Learned
IV. Eureka Hospital and Collaborations 7
7 Tri-County Health Department Collaboration
8 Central Illinois Community Health Collaborative
V. Community Health Needs Assessment Report Approval 9
VI. Methodology 9
9 Secondary Data
10 Primary Data
VII. Community Health Needs Assessment 10
10 Community Definition
10 Population
10 Demographics
11 Economics
11 Education
12 Health Care Resources in the Defined Community
12 Key Findings: Community Definition
12 Health Status
12 County Health Ranking
12 Death Rates
12 Life Expectancy
12 Self-Perceptions of Overall Health
13 Key Findings: Health Status
Table of Contents

22
13 Access to Care
13 Choice of Medical Care
13 Choice of Medical Care for At-Risk Population
13 Access to:
13 Medical Care
13 Dental Care
13 Counseling Services
13 Health Care Coverage
14 Personal Physician and Time Since Last Check Up
14 Key Findings: Access to Care
14 Modifiable Health Behaviors
14 Tobacco Use
14 Substance Abuse
15 Nutrition
16 Physical Activity and Inactivity
16 Weight Status
16 Key Findings: Modifiable Health Behaviors
16 Environment
16 Built Environment
16 Physical Activity
17 Food Security and Access to Healthy Foods
18 Social Environment
18 Intentional Injury
18 Unintentional Injury
19 Key Findings: Environment
19 Disease and Chronic Conditions
19 Alzheimer’s Disease and Dementia
20 Cancer
21 Cardiovascular Disease
23 Diabetes
23 Infectious Disease
25 Mental Health
28 Oral Health
28 Respiratory Disease
31 Key Findings: Disease and Chronic Conditions
32 Maternal and Child Health
32 Pre- and Post-Natal Care
32 Birth Outcomes
32 Key Findings: Maternal and Child Health
Table of Contents
3 3
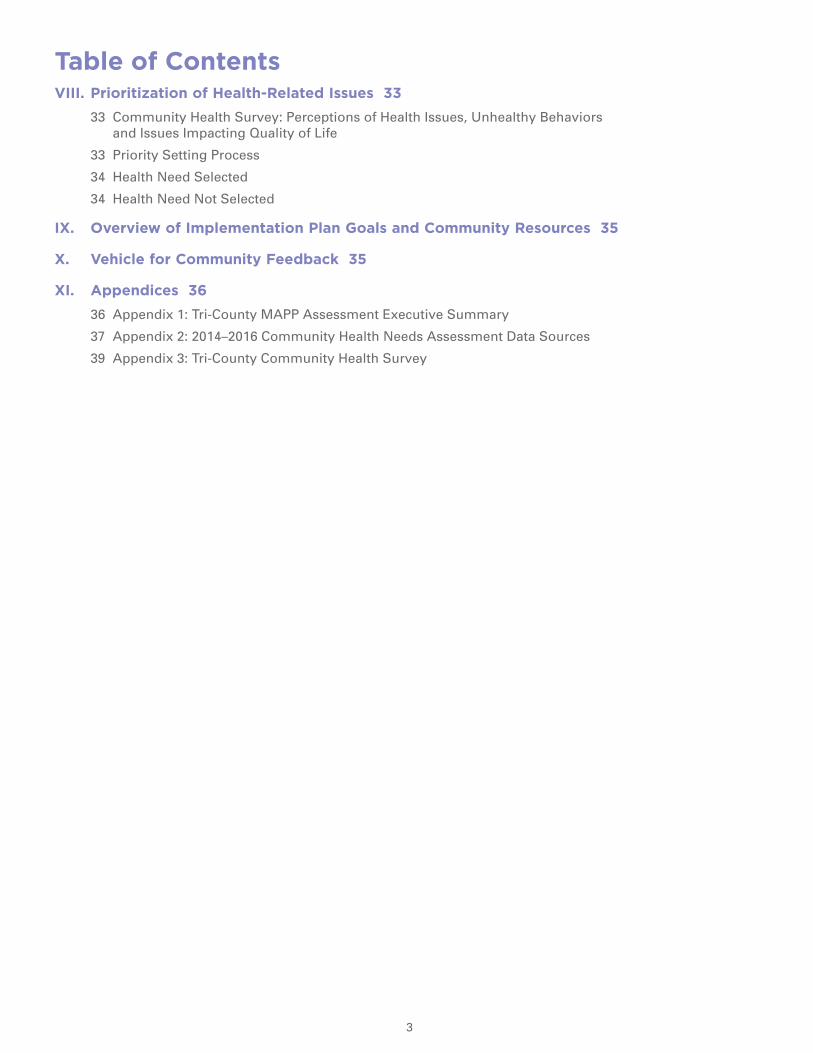
VIII. Prioritization of Health-Related Issues 33
33 Community Health Survey: Perceptions of Health Issues, Unhealthy Behaviors and Issues Impacting Quality of Life
33 Priority Setting Process
34 Health Need Selected
34 Health Need Not Selected
IX. Overview of Implementation Plan Goals and Community Resources 35
X. Vehicle for Community Feedback 35
XI. Appendices 36
36 Appendix 1: Tri-County MAPP Assessment Executive Summary
37 Appendix 2: 2014–2016 Community Health Needs Assessment Data Sources
39 Appendix 3: Tri-County Community Health Survey
Table of Contents

4
I. Executive SummaryAdvocate Eureka Hospital (Eureka Hospital) is located in Woodford County Illinois and for the purposes of this report has defined “community” as the entire county. Multiple community based agencies provide social services to the Tri-County region, which includes Woodford, Peoria and Tazewell Counties. Based upon overlapping service areas, the three county health departments and six hospitals located in this region chose to form a Tri-County Collaborative. This collaborative is led by the Woodford County Health Department, the Peoria City/County Health Department and the Tazewell Health Department.
A second collaborative, the Central Illinois Community Health Collaborative, was created by a team of healthcare professionals from OSF Saint Francis Medical Center and UnityPoint, both in Peoria. This collaborative was created to engage the broader community in improving population health as a part of the community health assessment process.
For the 2014-2016 Community Health Needs Assessment, Eureka Hospital participated in the priority setting process with the Central Illinois Community Health Collaborative. The two needs identified in the Central Illinois Community Health Collaborative were healthy eating/active living and mental health.
The Tri-County Health Department collaboration utilized the Mobilizing for Action through Planning and Partnerships (MAPP) process to determine the priority health issues and behavioral health was one of the top three health needs identified. Behavioral health is defined as mental health and substance abuse.
The community health needs assessment team at Eureka hospital selected one health priority from the Tri-County health priorities to focus on for its 2014-2016 Community Health Needs Assessment. The hospital wanted to focus its efforts on one major initiative, specific to Woodford County, as its resources are limited as a critical access hospital. Mental health was selected as the health priority for the Eureka Hospital 2014-2016 Community Health Needs Assessment.
Mental health was selected as the health priority for Eureka Hospital for several reasons. In addition to mental health being identified as a health priority in the previously mentioned Tri-County collaborations, mental health was also identified as the second most important health issue in the community by Woodford County residents that participated in the 2016 Tri-County Community Health Survey.
Further supporting Eureka Hospital’s selection of mental health is Woodford County’s increased suicide attempts from 2015 to 2016, according to the Woodford County Sheriff’s Department for calls they responded to. The number of suicide attempts for 2016 has increased to 48 attempts, which is greater than the 35 attempts for 2015. The number of deaths due to suicide in Woodford County is higher per 100,000 population than the rate for Illinois (Illinois Department of Public Health, 2010-2011). The number of deaths due to suicide in Woodford County remained the same at 10 deaths for 2015 and 2016 (Woodford County Sheriff, 2014-2015).
Mental health was also selected as a key health priority for the previous community health needs assessment by both Eureka Hospital and the Woodford County Health Department. It is clear from community input and current data that ongoing efforts are needed in this area to continue to reduce the stigma associated with mental health, and to give further momentum to efforts to improve mental health for county residents.
Even though Eureka Hospital did not select healthy behaviors as a priority health need, the hospital will continue to support the efforts of the Tri-County Healthy Eating/Active Living Implementation Subcommittee. A member of the management team from the hospital is serving on this committee to assist in promoting healthy eating and active living in the Tri-County region. The hospital also employs nurses in most of the public schools in Woodford County who will continue to reinforce healthier eating habits and exercise among students.
To improve mental health in Woodford County, Eureka Hospital is continuing its collaboration with the Woodford County Health Department and the Tazwood Mental Health Center through the Illinois Project for Local Assessment of Need (IPLAN) mental health subcommittee. As a result of the work of the IPLAN mental health subcommittee, beginning in January 2013, a psychiatrist began taking appointments at the health department one day a month and a counselor one day a week. This allowed Woodford County residents to receive mental health services locally without having to travel to Tazewell County. In June 2016, the counseling appointments moved to Eureka Hospital.

65 6
Eureka Hospital will continue to offer Mental Health First Aid to the community. Mental Health First Aid is an evidence based, nationally recognized adult public education program that teaches individuals how to identify, understand and respond to the signs of mental illness and substance abuse disorders. Eureka Hospital will lead the efforts in the development of a Tri-County and/or Woodford County Mental Health First Aid collaborative.
II. Description of Advocate Health Care and Advocate Eureka Hospital
Advocate Health CareAdvocate Eureka Hospital is one of eleven hospitals in the Advocate Health Care system. Advocate is the largest health system in Illinois and one of the largest healthcare providers in the Midwest, operating more than 400 sites of care including 11 acute care hospitals, the state’s largest integrated children’s network, five Level I trauma centers (the state’s highest designation for trauma care), two Level II trauma centers, the region’s largest medical group and one of the region’s largest home health care companies. The Advocate system trains more primary care physicians and residents at its four teaching hospitals than any other health system in the state.
Advocate is a faith-based, not-for-profit health system related to both the Evangelical Lutheran Church in America and the United Church of Christ. Advocate’s mission is to serve the health needs of individuals, families and communities through a wholistic philosophy rooted in the fundamental understanding of human beings as created in the image of God. This wholistic approach provides quality care and service, and treats each patient with dignity, respect and integrity. To guide its relationships and actions, Advocate embraces the five values of compassion, equality, excellence, partnership and stewardship. The mission, values and wholistic philosophy (MVP) permeate all areas of Advocate’s healing ministry and are integrated into every aspect of the organization building a cultural foundation. The MVP calls Advocate to extend its services into the community to address access to care issues and to improve the health and well-being of the people in the communities Advocate serves. As an Advocate Hospital, Eureka Hospital embraces the Advocate system MVP.
Eureka HospitalEureka Hospital is a 25-bed facility that has served and cared for the people of Woodford County and the surrounding area since 1901. Eureka Hospital is the only hospital in Woodford County and is a critical access hospital as certified by the Centers for Medicare and Medicaid Services. By functioning in this capacity, Eureka Hospital plays a vital role in serving the health needs of a primarily rural area. Community residents benefit from having access to care close to home as provided by a dedicated group of primary care and specialty physicians. If the patient’s condition requires advanced care, Eureka Hospital is available to stabilize the condition and seamlessly transition the patient to another facility.
In early 2016, the hospital completed a 28,000 square foot addition to the hospital. The expansion included two state-of-the-art operating rooms, as well as 11 modern, private patient rooms. The building was constructed with environmental stewardship in mind. This included placement of white reflective ethylene propylene diene terpolymer (EDPM) roof with high SRI value, energy efficient LED lighting throughout the building controlled by occupancy/daylight sensors and air handling units outfitted with energy recovery wheels.
A cherished community institution, Eureka Hospital has set new standards for what a rural hospital can accomplish. While patients appreciate the small-town touch of one-on-one care, they also know that it’s backed by services and technology typically unavailable at a small hospital. Emergency care, inpatient and outpatient surgeries, rehabilitation and advanced radiology are only a few of the services offered. These services are provided by a skilled and caring staff that has won numerous awards for patient satisfaction.

66
III. Summary of the 2011-2013 Community Health Needs Assessment and Program Implementation
Community DefinitionFor the 2011-2013 Community Health Needs Assessment, Eureka Hospital defined the community as Woodford County, which is situated in rural Central Illinois. The county is 97.6 percent white and has a median household income of $66,198, which is higher than the median for the state of Illinois.
Overall Assessment ProcessEureka Hospital worked with members of the community through its partnership with the Woodford County Health Department for the 2011-2013 Community Health Needs Assessment. Staff members at Advocate BroMenn Medical Center, located 30 minutes southeast of Eureka in Normal, were also a part of the hospital’s Community Health Needs Assessment team. Both hospitals fall under the administration of the same president. Although the hospitals are under the same administration, each hospital conducted a separate community health needs assessment.
Priority Needs Identified and Priorities SelectedMental health was chosen as the primary health priority by Eureka Hospital for the 2011-2013 CHNA for several reasons. First, access to mental health services in Woodford County was severely limited due to the 2009 closure of the Tazwood Wellness Center satellite facility in Eureka, resulting in residents leaving the county to find mental health care. Secondly, the results of the 2011 IPLAN Community Health Plan and Need Assessment for Woodford County showed a growing need for mental health services in Woodford County. Finally, partnerships with the Woodford County Health Department and the Tazwood Wellness Center strongly supported the decision. This was consistent with one of the three health priorities selected by the Woodford County Health Department for their 2011 IPLAN process.
Summary of Implementation Programs and Key AccomplishmentsThere are several significant accomplishments in the area of mental health. An overview of these are explained below:
In June 2014, Advocate BroMenn Medical Center, in partnership with Eureka Hospital, offered an evidence-based mental health program to the community entitled Mental Health First Aid. Mental Health First Aid is a nationally recognized adult public education program that teaches individuals how to identify, understand and respond to the signs of mental illness and substance abuse disorders. Certified instructors teach participants to become Mental Health First Aiders. Participants learn about the signs and symptoms of acute mental health crises and chronic mental health problems, such as anxiety and depression. Eureka Hospital has collaborated with BroMenn Medical Center, Woodford County Health Department, McLean County Center for Human Services, Central Illinois Area Health Education Center and the McLean County Health Department in offering this program to the community. Since June 2014, over 600 community members in McLean and Woodford County have been trained in Mental Health First Aid. In January 2015, the first ever Mental Health First Aid course was held in Woodford County at the Roanoke Mennonite Church, which is part of the Delegate Church Association for Advocate BroMenn Medical Center and Eureka Hospital. In April 2015, a second course was held at Eureka College, which is a partner of Eureka Hospital.
One of the outcomes measured for access to mental health services for the 2011-2013 community health needs assessment include the number of patients visiting the Eureka Hospital emergency room with a behavioral health-related diagnosis. This number has steadily decreased by 24% from 2010 to 2014, from 78 patients in 2010 to 59 patients in 2014. Positively contributing to this decrease is the collaboration between Eureka Hospital, the Woodford County Health Department and the Tazwood Wellness Center. Participants from these entities and other community organizations form the Woodford County Health Department IPLAN Mental Health Subcommittee, which has worked on improving access to mental health services in Woodford County. As a result of the subcommittee’s efforts, beginning in January 2013, the Tazwood Wellness Center staff began offering counseling services one time per week and psychiatric services one time per month at the Woodford County Health Department. To assist with referrals to this program and with effective communication, a Eureka Hospital social worker coordinated educational
87 8
sessions for local Advocate Medical Group physicians and the medical staff serving Eureka Hospital’s emergency room. The hospital social worker also coordinated educational sessions for the staff at nursing homes and with Woodford County clergy at delegate churches.
Providing counseling and psychiatric services at the Woodford County Health Department also improved a second outcome measured for access to mental health services in Woodford County. In 2012, prior to services being offered at the Woodford County Health Department, 75 residents received counseling services at the Tazwood Center for Wellness in Tazewell County. This number increased to 114 residents in 2013, 106 residents in 2014 and 143 residents in 2015 when residents were able to access counseling and psychiatric services within Woodford County, no longer requiring them to travel outside of the county to receive treatment.
Community Feedback from Previous AssessmentEureka hospital provided a mechanism for community members to provide feedback from the 2013 Community Health Needs Assessment and made the report available to community members. The hospital Community Health Needs Assessment report was also posted on the hospital’s website. No feedback was received from individuals in the community via the available mechanisms.
Lessons Learned A lesson learned from the previous community health needs assessment is that as a small critical access hospital in a small county, it is beneficial to collaborate with neighboring counties to better utilize resources and share data in the assessment process.
IV. Eureka Hospital and CollaborationsTri-County Health Department CollaborationEureka Hospital has defined “community” as Woodford County Illinois. Multiple community based agencies provide social services to the Tri-County region which includes Woodford, Peoria and Tazewell Counties. Based upon overlapping service areas, the three county health departments and six hospitals located in this region chose to form a Tri-County Collaborative. This collaborative is led by the Woodford County Health Department, the Peoria City/County Health Department and the Tazewell Health Department. For the purpose of this report, the primary partner for Eureka Hospital was the Woodford County Health Department.
The Tri-County Collaborative utilized the MAPP process (Mobilizing for Action through Planning and Partnership) to conduct its community health needs assessment. This is the first time that three county health departments have utilized a shared assessment for their certification process. The process is community-driven and assists in development and implementation efforts around identifying and prioritizing health issues. The MAPP process consists of four assessments:
• Community Health Status Assessment
• Community Themes and Strengths Assessment
• Forces of Change Assessment
• Local Public Health Systems Assessment
An executive summary of the MAPP assessments can be found in Appendix 1 of this report. The full Community Health Improvement Plan can be found at the following link: http://healthyhoi.org.

88
Tri-County MAPP Steering Council The Community Health Manager for Eureka Hospital served on the MAPP Steering Council which was led by the Tri-County health departments. Five individuals from each of the three counties of Peoria, Woodford and Tazewell comprise the MAPP Steering Council for the Tri-County Region. They are as follows:
Organization: Title:
Advocate Eureka Hospital Community Health Manager
City of Peoria Grants Coordinator
Easter Seals, IL Partners for Human Services Executive Vice President Strategic Initiatives, Governmental Affairs & Grants
Eureka College Assistant Dean of Students/Director of Residence Life
Gifts in the Moment, Tri-County Fresh Food Hub Chairperson
Gifts in the Moment: Tri-County Fresh Food Hub Co-chair Person, Secretary
Hopedale Medical Complex Community Health Coordinator
Human Service Center President and CEO
Peoria City/County Health Department Director of Community Health Policy and Planning
Regional Office of Education Regional Superintendent
Roanoke Mennonite Church Pastor
Tazewell County Health Department Administrator
Tazwood Center for Wellness Director of Clinical Services
Woodford County Board of Health Board Member, Secretary
Woodford County Health Department Administrator
YWCA, Pekin Executive Director
Central Illinois Community Health CollaborativeFor the Tri-County region consisting of Peoria, Woodford and Tazewell Counties, there was a second collaborative created by a team of healthcare professionals from OSF Saint Francis Medical Center and UnityPoint called the Central Illinois Community Health Collaborative. This collaborative was created to engage the entire community in improving population health as a part of the community health assessment process. Members of the Central Illinois Community Health Collaborative include: Peoria City/County Health Department, Tazewell County Health Department, Woodford County Health Department, Kindred Hospital, Advocate Eureka Hospital, Hopedale Medical Complex, Pekin Hospital, Heart of Illinois United Way, Heartland Community Health Clinic and Bradley University, as well as OSF St. Francis Medical Center and UnityPoint. The Community Health Manager for Eureka Hospital served on the Central Illinois Community Health Council. The council members are as follows:
Organization: Title:
Advocate Eureka Hospital Community Health Manager
Heartland Health Services Chief Medical Officer
Heart of Illinois United Way President
Hopedale Medical Complex Community Health Coordinator
OSF Saint Francis Medical Center Director of Business and Community Health in Ambulatory Administration
OSF Saint Francis Medical Center Senior Vice President and CEO
OSF Saint Francis Medical Center Vice President of Ambulatory Care
Pekin Hospital Controller
Peoria City/County Health Department Epidemiologist

109 10
Tazewell County Health Department Administrator
Tazewell County Health Department Epidemiologist
UnityPoint Health – Methodist, Proctor Vice President of Strategy and Development
Woodford County Health Department Administrator
V. Community Health Needs Assessment Report Approval
Eureka Hospital is utilizing this report to meet the hospital’s 2016 Community Health Needs Assessment requirement reportable to the Internal Revenue Service as outlined by the Patient Protection and Affordable Care Act. This report was approved by Advocate BroMenn Medical Center and Eureka Hospital’s Governing Council on November 15, 2016.
VI. MethodologyThe 2016 Community Health Needs Assessment was conducted using a mixed methodological approach. Secondary statistical data were collected from over 30 different sources and used to assess the community profile, as well as other aspects of health of Woodford County. A Tri-County Community Health Survey was administered to examine perceptions of community health issues, unhealthy behaviors, issues with quality of life, healthy behaviors and access to healthcare. Woodford County results indicated that 535 residents responded to the survey. The Tri-County Community Health Survey results, broken down by county, can be accessed through the following link: http://healthyhoi.org/community-health-assessment.
Secondary DataExisting secondary data was used to develop an overall assessment of health-related issues in the community. The most recent data available at the time of data collection was utilized during the prioritization process for this community health needs assessment and is included in the report.
Much of the secondary data used for this assessment was acquired via Healthy Communities Institute, a centralized data platform purchased by Advocate Health Care to help drive community health improvement efforts. Healthy Communities Institute operates as a repository for publicly available secondary data as well as hospital emergency room visits and hospitalization rates. The platform includes dashboards, geographic information systems maps, disaggregation at the zip code level, disparities information and effective practices for over 100 health-related issues. Healthy Communities Institute also supplies a colorful gauge to depict comparisons between Woodford County, Illinois counties, Illinois and US counties.
Green (Good):When a high value is good, community value is equal to or higher than the 50th percentile (median), or, when a low value is good, community value is equal to or lower than the 50th percentile.
Yellow (Fair):When a high value is good, community value is between the 50th and 25th percentile, or when a low value is good, the community value is between the 50th and 75th percentiles.
Red (Poor):When a high value is good, the community value is less than the 25th percentile, or when a low value is good, the community value is greater than the 75th percentile.
A comprehensive list of data sources can be found in Appendix 2.

1010
Primary DataIn addition to existing secondary data sources, the Tri-County Health Needs Assessment Collaborative administered a survey (Appendix 3) consisting of 36 demographic and health-related questions. A total of 535 Woodford County residents participated in the survey from July-September 2015. Results of the 2016 Tri-County Community Health Survey for Woodford County will be referenced throughout this report.
VII. Community Health Needs AssessmentCommunity DefinitionFor the purposes of this assessment, “community” is defined as Woodford County Illinois. Eureka Hospital is the only hospital in Woodford County, which is located in rural central Illinois. Although the hospital participated in a Tri-County Collaborative for the three counties illustrated in Exhibit 1 below, for the purpose of this community health needs assessment, the focus of this report will be on Woodford County. The following towns are in Woodford County: Bay View Gardens, Benson, Congerville, El Paso, Eureka, Germantown Hills, Goodfield, Kappa, Lowpoint, Metamora, Minonk, Panola, Roanoke, Secor, Spring Bay, and Washburn.
Exhibit 1: Tri-County Map
Source: http://www.tricountyinteragencycouncil.org/files/tri-county.bmp, 2016.
PopulationWoodford County consists of a total population of 39,334 (Healthy Communities Institute, Claritas, 2016). Eureka has the largest population in the county with 6,861. The population in Woodford County increased by 1.73 percent from 2010 to 2016 (Healthy Communities Institute, Claritas, 2016).
DemographicsAge and GenderThe median age in Woodford County is 40.0, which is older than the median age for Illinois at 37.8 years of age. The age distribution for Woodford County is shown in Exhibit 2 below.
Exhibit 2: Population by Age for Woodford County 2016
Source: Healthy Communities Institute, Claritas, 2016.

1211 12
Race and EthnicityThe population of Woodford County is 96.6 percent White, 0.7 percent Black or African American, .63 percent Asian, .25 percent American Indian and Alaska Native, and .03 percent Native Hawaiian or Pacific Islander (Healthy Communities Institute, Claritas, 2016).
Household/FamilyThe average household size in Woodford County is 2.62 with 14,636 residents living as a part of a household. Thirty-five percent of people in a household are under age 18 (Healthy Communities Institute, Claritas, 2016). Twenty-one percent of the households in Woodford County are single parent households. In comparison to other counties in the United States, the Woodford County single parent household value is in the best 0-50th percentile range (green indicator).
EconomicsIncomeThe median household income in Woodford County is $69,760 which is higher than the Illinois median household income of $59,608 (Healthy Communities Institute, Claritas, 2016). The percent of people living below the federal poverty level is 8.1 percent. This is in the best 0-50th percentile range (green indicator) compared to other counties in Illinois (Healthy Communities Institute, American Community Survey, 2010-2014).
EmploymentThe percent of the civilian labor force that is unemployed in Woodford County is 6.9 percent, lower than Illinois at 9.9 percent. The three common industries of employment are manufacturing at 17.8 percent, healthcare at 14.6 percent and retail trade at 11.5 percent (Healthy Communities Institute, Claritas, 2016).
EducationEducational LevelNinety-four percent of the population over the age of 25 in Woodford County possesses a high school diploma or higher and 28 percent have a bachelor’s degree or higher (Healthy Communities Institute, American Community Survey, 2010-2014). Eureka College, a small liberal arts college, is located in Woodford County.
Student-to-Teacher RatioThis indicator shows the average number of public school students per teacher in the region. It does not measure class size. According to the National Center for Education Statistics, larger schools tend to have higher student-teacher ratios. There are 16.8 students per teacher in Woodford County (Healthy Communities Institute, National Center for Education Statistics, 2013-2014). This is in the worst fourth quartile range (red indicator) compared to other counties in the United States and has increased from 12.9 students per teacher since 2012-2013, as illustrated in Exhibit 3 below.
Exhibit 3: Student to Teacher Ratio for Woodford County 2013-2014
Source: Healthy Communities Institute, National Center for Education Statistics, 2013-2014.
1212
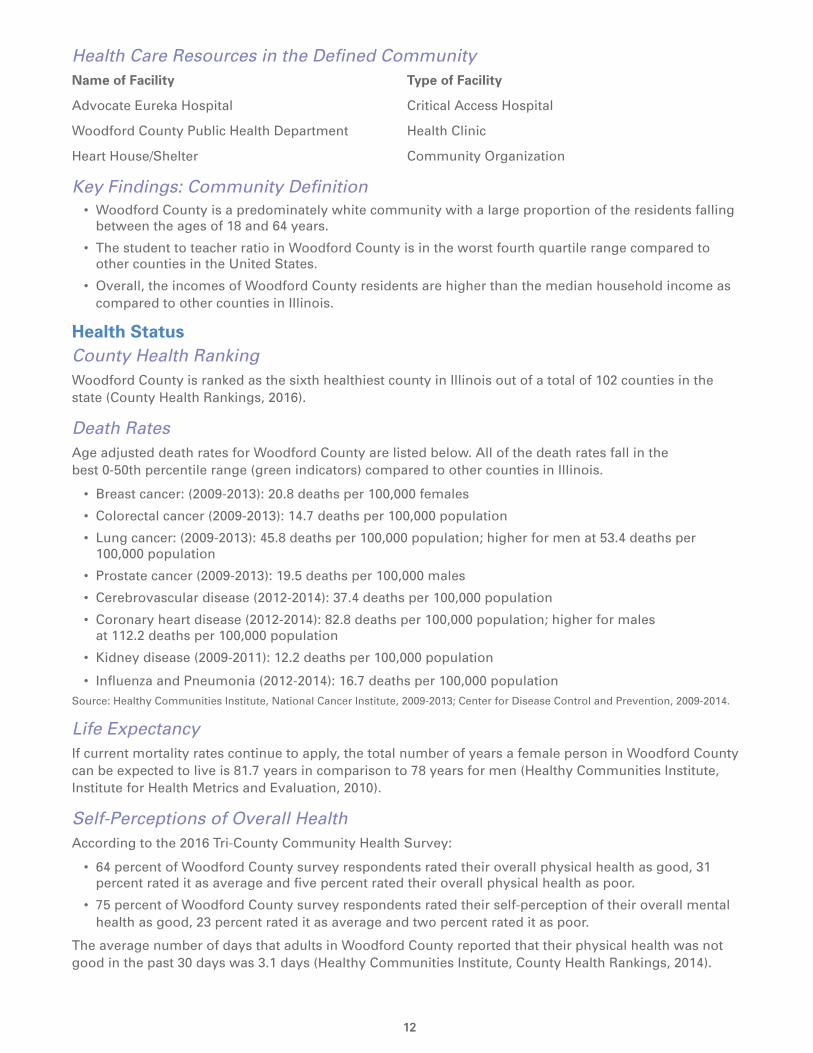
Health Care Resources in the Defined CommunityName of Facility Type of Facility
Advocate Eureka Hospital Critical Access Hospital
Woodford County Public Health Department Health Clinic
Heart House/Shelter Community Organization
Key Findings: Community Definition• Woodford County is a predominately white community with a large proportion of the residents falling
between the ages of 18 and 64 years.
• The student to teacher ratio in Woodford County is in the worst fourth quartile range compared to other counties in the United States.
• Overall, the incomes of Woodford County residents are higher than the median household income as compared to other counties in Illinois.
Health StatusCounty Health RankingWoodford County is ranked as the sixth healthiest county in Illinois out of a total of 102 counties in the state (County Health Rankings, 2016).
Death RatesAge adjusted death rates for Woodford County are listed below. All of the death rates fall in the best 0-50th percentile range (green indicators) compared to other counties in Illinois.
• Breast cancer: (2009-2013): 20.8 deaths per 100,000 females
• Colorectal cancer (2009-2013): 14.7 deaths per 100,000 population
• Lung cancer: (2009-2013): 45.8 deaths per 100,000 population; higher for men at 53.4 deaths per 100,000 population
• Prostate cancer (2009-2013): 19.5 deaths per 100,000 males
• Cerebrovascular disease (2012-2014): 37.4 deaths per 100,000 population
• Coronary heart disease (2012-2014): 82.8 deaths per 100,000 population; higher for males at 112.2 deaths per 100,000 population
• Kidney disease (2009-2011): 12.2 deaths per 100,000 population
• Influenza and Pneumonia (2012-2014): 16.7 deaths per 100,000 populationSource: Healthy Communities Institute, National Cancer Institute, 2009-2013; Center for Disease Control and Prevention, 2009-2014.
Life ExpectancyIf current mortality rates continue to apply, the total number of years a female person in Woodford County can be expected to live is 81.7 years in comparison to 78 years for men (Healthy Communities Institute, Institute for Health Metrics and Evaluation, 2010).
Self-Perceptions of Overall HealthAccording to the 2016 Tri-County Community Health Survey:
• 64 percent of Woodford County survey respondents rated their overall physical health as good, 31 percent rated it as average and five percent rated their overall physical health as poor.
• 75 percent of Woodford County survey respondents rated their self-perception of their overall mental health as good, 23 percent rated it as average and two percent rated it as poor.
The average number of days that adults in Woodford County reported that their physical health was not good in the past 30 days was 3.1 days (Healthy Communities Institute, County Health Rankings, 2014).

1413 14
Key Findings: Health Status• Women have a greater life expectancy than men in Woodford County.
Access to Care Choice of Medical Care2016 Tri-County Community Health Survey respondents were asked to choose the type of health care they use when they are sick. Six options were available to select from including clinic/doctor’s office, urgent care, emergency department, health department, I don’t seek medical attention or other. The results were as follows for Woodford County survey respondents: Seventy-five percent of respondents selected clinic or doctor’s office as their choice of medical care followed by urgent care at 12 percent, I don’t seek medical attention at 11 percent and the emergency department at two percent. Choice of medical care for the health department was zero percent.
Choice of Medical Care for At-Risk PopulationThe at-risk population or those living in poverty selected the emergency room as their choice of medical care at eight percent versus two percent for the general population. Urgent care was also slightly lower at six percent for the at-risk population versus 12 percent for the general population. The health department was chosen by four percent of the at-risk population as choice of medical care versus zero percent for the general population (Tri-County Community Health Survey, 2016).
Access to:Medical CareEighty-seven percent of Woodford County survey respondents reported having access to medical care while 13 percent reported that they do not have access to medical care. Forty-one percent of those who reported that they do not have access to medical care said they were not able to get medical care because they could not afford the co-pay, 26 percent said they did not have insurance, 26 percent that there was too long of a wait and 14 percent said they did not have a way to get to the doctor. Respondents were instructed to select all answers that applied if they reported that they did not have access to medical care (Tri-County Community Health Needs Assessment, 2016).
Dental CareEighty-five percent of Woodford County survey respondents reported having access to dental care while 15 percent reported that they did not have access. For those respondents that reported that they did not have access to dental care, 52 percent reported no insurance as the primary reason for not having access. This was followed by 34 percent who stated they could not afford the co-pay and 19 percent reporting that the dentist refused their insurance. Respondents were instructed to select all answers that applied if they did not have access to dental care (Tri-County Community Health Survey, 2016).
Counseling Services2016 Tri-County County Community Health Survey data show that 92 percent of Woodford County survey respondents reported having access to counseling services and eight percent reported that they do not have access. A follow-up question was asked to survey respondents who reported that they were not able to get counseling when needed. The primary reasons respondents did not have access to counseling are as follows. Respondents were instructed to select all answers that applied if they reported that they did not have access to counseling services; 47 percent – could not afford co-pay, 29 percent – too long to wait, 20 percent – no insurance, 16 percent counselor refused insurance, 13 percent embarrassment, 11 percent no way to get to counselor, 11 percent I don’t know how to find and 11 percent fear.
Health Care CoverageAccording to the Tri-County Community Health Survey, 97 percent of the Woodford County survey respondents reported having either private insurance, Medicaid or Medicare while three percent reported having no insurance. Inability to afford coverage was the unanimous reason respondents gave for not having insurance coverage.

1414
Personal Physician and Time Since Last Check UpOf the 2016 Woodford County survey respondents, 88 percent indicated that they had a personal physician while 12 percent stated that they do not have a personal physician. Sixty-six percent of respondents indicated that they have had a check-up within the last year and 17 percent have had a check-up within one-two years (Tri-County Community Health Survey, 2016).
Key Findings: Access to Care• The at-risk population or those living in poverty selected the emergency room as their choice of
medical care at eight percent versus two percent for the general population. Urgent care was also slightly lower at six percent for the at-risk population versus 12 percent for the general population.
• Almost all, 97 percent, of Woodford County residents are covered by some type of insurance.
• Could not afford the co-pay was the primary answer for Woodford County survey respondents for not having access to medical care or counseling services.
Modifiable Health BehaviorsTobacco UseThe percentage of Woodford County adults that smoke cigarettes is 14.8 percent (Healthy Communities Institute, County Health Rankings, 2014). This is in the best 0-50th percentile range (green indicator) compared to other counties in Illinois. The percent of 12th grade students who smoked cigarettes on at least one day during the 30 days prior to the survey is 13 percent (Healthy Communities Institute, Center for Prevention Research and Development, Illinois Youth Survey, 2014). This is also in the best 0-50th percentile range (green indicator) compared to other counties in Illinois.
Tri-County Community Health Survey data show 87 percent of Woodford County survey respondents do not smoke and seven percent state they smoke more than 12 cigarettes a day or “vape.”
Substance AbuseAlcohol Use
Twenty-two percent of adults in Woodford County, shown in Exhibit 4 below, reported heavy drinking in the 30 days prior to the survey or binge drinking on at least one occasion during that period (Healthy Communities Institute, County Health Rankings, 2014). This is in the worst fourth quartile range (red indicator) when compared to other counties in the United States.
Exhibit 4: Woodford County Adults Who Drink Excessively 2014
Source: Healthy Communities Institute, County Health Rankings, 2014.
15 16
The age-adjusted emergency room rate due to alcohol abuse is 13.9 visits per 10,000 population for Woodford County (Healthy Communities Institute, Illinois Hospital Association, COMPdata, 2012-2014). This rate is in the best 0-50th percentile range (green indicator) compared to other Illinois counties (see Exhibit 5).
Exhibit 5: Age-Adjusted Emergency Room Rate due to Alcohol Abuse for Woodford County 2012-2014
Source: Healthy Communities Institute, Illinois Hospital Association, COMPdata, 2012-2014.
The highest emergency room rates due to alcohol abuse are seen in:
• individuals aged 18-19 (32.7 emergency room visits per 10,000 population)
• individuals aged 20-24 (30.8 emergency room visits per 10,000 population)
• males (17.8 emergency room visits per 10,000 population)
Woodford County’s age-adjusted hospitalization rate due to alcohol abuse is 5.3 per 10,000 population, which is also in the best 0-50th percentile range (green indicator) compared to other Illinois counties (Healthy Communities Institute, Illinois Hospital Association, COMPdata, 2012-2014). The highest hospitalization rates due to alcohol abuse are seen in males with 7.8 hospitalizations per 10,000 population (see Exhibit 6).
Exhibit 6: Age-Adjusted Hospitalization Rate due to Alcohol Abuse for Woodford County 2012-2014
Source: Healthy Communities Institute, Illinois Hospital Association, COMPdata, 2012-2014.
The percentage of motor vehicle crash deaths with alcohol involvement in Woodford County is 26 percent (Healthy Communities Institute, County Health Rankings, 2010-2014).
Other Substances
Compared to other Illinois counties, the age-adjusted emergency room rate for substance abuse is in the best 0-50th percentile range (green indicator) at 5.3 emergency room visits per 10,000 population (Healthy Communities Institute, Illinois Hospital Association, COMPdata, 2012-2014).
NutritionThe percentage of adults who eat fruits and vegetables five or more times per day in Woodford County is 11.6 percent (Healthy Communities Institute, Illinois Risk Factor Behavior Surveillance System, 2007-2009). This is in the worst fourth quartile in comparison to other counties in Illinois as shown below in Exhibit 7. Fruit and vegetable consumption is lowest amongst males at 7.4 percent and 25-44 year olds at 10.4 percent.

16
Exhibit 7: Woodford County Residents Adult Fruit and Vegetable Consumption 2007-2009
Source: Healthy Communities Institute, Illinois Behavioral Risk Factor Surveillance System, 2007-2009.
The 2016 Tri-County Community Health Survey data show over half (55 percent) of Woodford County residents report low consumption (one to two servings per day) of fruits and vegetables.
Physical Activity and InactivityThe percentage of adults (ages 20 and up) who did not participate in any leisure-time activities (physical activities other than their regular job) during the past month in Woodford County is 22.6 percent (Healthy Communities Institute, Centers for Disease Control and Prevention, 2013). This rate is in the best 0-50th percentile (green indicator) when compared to other counties in the United States.
The 2016 Tri-County Community Health Survey data provide a more fine-grain assessment of exercise. Specifically, 34 percent of Woodford County survey respondents indicated that they do not exercise at all, while two-thirds of residents (66 percent) exercise one to two times per week or more.
Weight StatusThe percentage of adults aged 18 and older who are obese in Woodford County according to the Body Mass Index is 30.1 percent (Healthy Communities Institute, Illinois Behavioral Risk Factor Surveillance System, 2010-2014). This rate is in the best 0-50th percentile (green indicator) when compared to other Illinois counties but has steadily increased from the 2004-2006 rate of 20.3 percent and the 2007-2009 rate of 25.1 percent. The rate is highest amongst individuals 45-64 years of age at 42.2 percent.
Key Findings: Modifiable Health Behaviors• Woodford County residents are in the worst fourth quartile range for adults who drink excessively
compared to other counties in the United States but the emergency room rates and hospitalization rates due to alcohol abuse are in the best 0-50th percentile compared to other Illinois counties.
• Woodford County residents eat less fruits and vegetables than residents in other counties in Illinois.
• Woodford County’s obesity rate is better than other counties in Illinois but has risen steadily since the 2004-2006 rate.
Environment Built EnvironmentPhysical ActivityAccording to the Robert Wood Johnson Foundation, “the built environment describes physical or manmade features such as sidewalks, streetlights, traffic and parks that may promote or discourage activity.” The built environment is important to consider when assessing physical activity as there is strong evidence suggesting an association between access to recreational resources, bikability and walkability of neighborhoods as well as safe, esthetically pleasing environments with increased physical activity and reduced obesity rates (Robert Wood Johnson Foundation, Built Environment and Physical Activity, 2007).
In Woodford County, 68 percent of residents have access to exercise opportunities, meaning they live reasonably close to a park or recreational facility. Woodford County falls in the best 0-50th percentile range (green indicator) when compared to other counties in the United States for access to exercise opportunities despite the county’s rural expanse (Healthy Communities Institute, County Health Rankings, 2015).

17 18
According to the US Department of Agriculture Food Environment Atlas 2012, there are .08 recreation and fitness centers per 1,000 population in Woodford County, slightly more than the national average of .06 per 1,000 population (see Exhibit 8).
Exhibit 8: Number of Recreation and Fitness Centers per 1,000 population in Woodford County
Source: Healthy Communities Institute, US Department of Agriculture, Food Environment Atlas, 2012.
Food Security and Access to Healthy FoodsFood Insecurity The United States Department of Agriculture defines food insecurity as limited or uncertain availability of nutritionally adequate foods or uncertain ability to acquire these foods in socially acceptable ways. The percentage of the population that experienced food insecurity in Woodford County at some point during 2014 is 9.1 percent. This rate is in the best 0-50th percentile range (green indicator) compared to other counties in the United States. The percentage of children (under 18 years of age) living in households that experienced food insecurity at some point during 2014 is 18 percent (Healthy Communities Institute, Feeding America, 2014). This rate is also in the best 0-50th percentile range (green indicator) compared to other counties in the United States.
Grocery Store DensityWoodford County is in the worst 50th–75th percentile range (yellow indicator) in comparison to other counties in the United States for grocery store density with .15 supermarkets and grocery stores per 1,000 in Woodford County (Healthy Communities Institute, US Department of Agriculture, Food Environment Index, 2012).
Fast Food Restaurant DensityThe fast food restaurant density is in the best 0-50th percentile range (green indicator) compared to other counties in the United States (see Exhibit 9) with .44 fast food restaurants per 1,000 in Woodford County.
Exhibit 9: Fast Food Restaurant Density for Woodford County 2012
Source: Healthy Communities Institute, US Department of Agriculture, Food Environment Atlas, 2012.
Farmers Market DensityThere are .05 Farmers Markets per 1,000 population in Woodford County (Healthy Communities Institute, US Department of Agriculture, Food Environment Index, 2013). This rate falls in the best 0-50th percentile range (green indicator) compared to other counties in the United States (see Exhibit 10).

18
Exhibit 10: Farmer’s Market Density 2013
Source: Healthy Communities Institute, US Department of Agriculture, Food Environment Atlas, 2013.
Social EnvironmentIntentional InjuryCrime RatesThe crime rate in Woodford County for the measurement period of 2010-2012 was 53.6 crimes per 100,000 population as illustrated below in Exhibit 11. This is in the best 0-50th percentile range (green indicator) compared to other counties in Illinois and has decreased from the 2007-2009 rate of 118.7 crimes per 100,000 population. Violent crimes include homicide, forcible rape, robbery, and aggravated assault (Healthy Communities Institute, County Health Rankings, 2010-2012).
Exhibit 11: Woodford County Violent Crime Rate 2010-2012
Source: Healthy Communities Institute, County Health Rankings, 2010-2012.
Unintentional InjuryMotor Vehicle DeathsFour deaths were attributable to motor vehicle collisions in Woodford County in 2013. (Healthy Communities Institute, Fatality Analysis Reporting System, 2013). This is slightly higher than the three deaths for the previously measured year.
Pedestrian DeathsThe number of pedestrians killed in traffic collisions in Woodford County was zero for 2010–2013 per 100,000 population (Healthy Communities Institute, Fatality Analysis Reporting System, 2013).
FallsThe number of patients with a falls diagnosis in the outpatient setting in Woodford County is 105.6 patients per 1,000 population (70+). This is higher than the number of patients with a falls diagnosis in the outpatient setting for Illinois at 71.3 patients per 1,000 population (70+) (Healthy Communities Institute, Illinois Hospital Association, COMPdata, Oct 2014-Sept 2015).

19 20
The number of Woodford County residents that had a fall requiring admission to a hospital is 38 patients per 1,000 population (70+). This is higher than the state of Illinois rate of 30.6 patients per 1,000 population (70+) (Healthy Communities Institute, Illinois Hospital Association, COMPdata, Oct 2014-Sept 2015).
Key Findings: Environment• Woodford County is in the worst 50th–75th percentile range (yellow indicator) for grocery store density
in comparison to other counties in the United States.
• The violent crime rate for Woodford County is in the best 0-50th percentile range (green indicator) compared to other counties in Illinois.
• The rate for community residents being treated for falls in Woodford County on both an outpatient and inpatient basis is higher than the rate for the state.
• The rate for farmers markets per 1,000 population in Woodford County falls in the worst 50th-75th percentile range (yellow indicator) compared to other counties in the United States.
Disease and Chronic ConditionsAlzheimer’s Disease and DementiaAlzheimer’s disease is the most common form of dementia among the geriatric population, accounting for 50 to 80 percent of dementia cases. It is a progressive and irreversible disease where memory and cognitive abilities are slowly destroyed making it impossible to carry out even simple, daily tasks. Alzheimer’s disease typically manifests after the age of 60. According to the Centers for Disease Control and Prevention, Alzheimer’s disease is the fifth leading cause of death among adults aged 65 and older. The Alzheimer’s Association notes that the number of people age 65 and older with Alzheimer’s disease is estimated to reach 7.1 million by 2025, a 40 percent increase from the estimated 5 million age 65 and older currently affected by the disease. Medicare costs for those with Alzheimer’s and other dementias are estimated to be $107 billion in 2013 (Healthy Communities Institute, Illinois Hospital Association, COMPdata, 2016).
The age-adjusted death rate due to Alzheimer’s disease in Woodford County is 36 deaths per 100,000 population (Healthy Communities Institute, Centers for Disease Control and Prevention, 2012-2014). This rate is in the worst 50th–75th percentile range (yellow indicator) compared to other counties in Illinois (see Exhibit 12).
Exhibit 12: Age-Adjusted Death Rate due to Alzheimer’s Disease for Woodford County 2012-2014
Source: Healthy Communities Institute, Centers for Disease Control and Prevention, 2012-2014.
The percent of Medicare beneficiaries being treated for Alzheimer’s Disease or dementia in Woodford County is 9.8 percent (Healthy Communities Institute, Centers for Medicare and Medicaid Services, 2014). This rate is in the worst 50th–75th percentile (yellow indicator) compared to other counties in the United States.

20
CancerBreast CancerThe breast cancer incidence rate for Woodford County females is 141.9 cases per 100,000, placing Woodford County in the worst fourth quartile range (red indicator) when compared to other counties in the United States (see Exhibit 13) for this measure (Healthy Communities Institute, National Cancer Institute, 2008-2012).
Exhibit 13: Woodford County Breast Cancer Incidence Rate 2008-2012
Source: Healthy Communities Institute, National Cancer Institute, 2008-2012.
In 2007-2009, 55 percent of Woodford County females age 40 or over had received a mammogram within the past year. This percentage is lower than the state (64.5 percent) and the Healthy People 2020 goal (81.1 percent) (Illinois Behavioral Risk Factor Surveillance System, 2007-2009).
However, the percent of Medicare beneficiaries who have received a mammogram in the past two years is 68 percent, which is in the best 0-50th percentile range (green indicator) when compared to other counties in the United States (Healthy Communities Institute, County Health Rankings, 2013).
Colorectal CancerWoodford County’s colorectal cancer incidence rate is 46.8 cases per 100,000 population as shown in Exhibit 14 (Healthy Communities Institute, National Cancer Institute, 2008-2012). This is in the worst 50th–75th percentile range (yellow indicator) when compared to other counties in the United States and higher than the Healthy People 2020 goal of 39.9 cases per 100,000. There are higher incidence rates for men at 60 cases per 100,000 population.
Exhibit 14: Woodford County Colorectal Cancer Incidence Rate 2008-2012
Source: Healthy Communities Institute, National Cancer Institute, 2008-2012.
The percentage of Woodford County adults aged 50 and over who have ever had a sigmoidoscopy or colonoscopy exam is 54.6 percent (Healthy Communities Institute, Illinois Behavioral Risk Factor Surveillance System, 2007-2009).

21 22
Prostate CancerThe prostate cancer incidence rate for Woodford County males is 114.8 cases per 100,000 population. This is in the best 0-50th percentile range (green indicator) when compared to other counties in the United States (Healthy Communities Institute, National Cancer Institute, 2008-2012). This rate has decreased from the 143.4 cases per 100,000 population of 2005-2009.
Cervical CancerIn 2007-2009, 70.4 percent of Woodford County females had a pap smear within the past year (Healthy Communities Institute, Illinois Behavioral Risk Factor Surveillance System, 2007-2009).
Lung CancerWoodford County’s lung and bronchus cancer incidence rate is 62.5 cases per 100,000 population which is in the best 0-50th percentile range (green indicator) when compared to other counties in the United States. This rate has remained relatively unchanged since 2006-2010 (Healthy Communities Institute, National Cancer Institute, 2008-2012).
Cardiovascular Disease According to the Centers for Disease Control and Prevention, coronary heart disease is the most common type of heart disease, causing nearly 400,000 deaths per year and costing over $100 billion in health services, medication and lost productivity (Healthy Communities Institute, Illinois Hospital Association, COMPdata, 2016).
Cardiac disorders are consistently within the top five reasons for patient visits to Eureka Hospital’s emergency room from 2011-2015. The number of visits for 2011-2015, respectively, are as follows: 350, 304, 258, 252 and 270. (Eureka Hospital, Top ICD-9 Diagnosis, 2011-2015.)
The age-adjusted emergency room rate due to heart failure is 5.3 emergency room visits per 10,000 population for Woodford County (Healthy Communities Institute, Illinois Hospital Association, COMPdata, 2012-2014) as shown in Exhibit 15. This is in the best 0-50th percentile range (green indicator) compared to other Illinois Counties. The rate has increased slightly from the 2009-2011 rate (4.0 emergency room visits). The highest emergency room rates occur in:
• individuals 85 years and older (70.5 emergency room visits per 10,000 population)
• males (6.5 emergency room visits per 10,000 population)
Exhibit 15: Age-Adjusted Emergency Room Rate Due to Heart Failure for Woodford County 2012-2014
Source: Healthy Communities Institute, Illinois Hospital Association, COMPdata, 2012-2014.
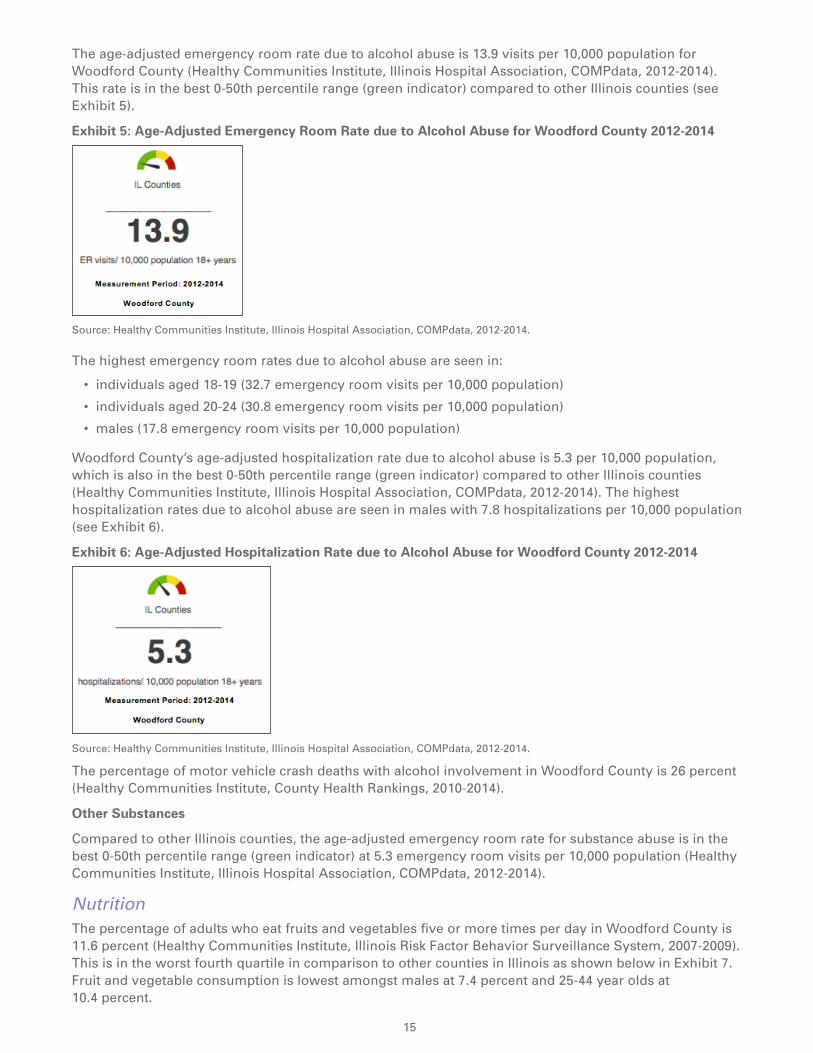
The rate for age-adjusted hospitalizations due to heart failure in Woodford County is 22 hospitalizations per 10,000 population (Healthy Communities Institute, Illinois Hospital Association, COMPdata, 2012–2014) as show below in Exhibit 16. This is in the best 0-50th percentile range (green indicator) compared to other Illinois counties. The rate for Woodford County has increased from the 2009-2011 rate of 18.8 hospitalizations per 10,000 population. The highest hospitalization rates occur in individuals greater than or equal to 85 years old with rates of 272.4 hospitalizations per 10,000 population.
22
Exhibit 16: Age-Adjusted Hospitalization Rate Due to Heart Failure for Woodford County 2012-2014
Source: Healthy Communities Institute, Illinois Hospital Association, COMPdata, 2012-2014.
The age-adjusted emergency room visit rate due to hypertension is 13.6 visits per 10,000 population for Woodford County (Healthy Communities Institute, Illinois Hospital Association, COMPdata, 2012-2014). This rate is in the best 0-50th percentile range (green indicator) compared to other counties in Illinois, although it has increased from the 2009-2011 rate (9.1 emergency room visits per 10,000 population).
The highest emergency room rates occur in:
• individuals ages 64-85 years (38.4 emergency room visits per 10,000 population)
• individuals ages 85 years and older (64.1 emergency room visits per 10,000 population)
• females (14.9 emergency room visits per 10,000 population)
The age-adjusted hospitalization rate for hypertension in Woodford County is 1.5 hospitalizations per 10,000 population (Healthy Communities Institute, Illinois Hospital Association, COMPdata, 2012-2014). This is in the best 0–50th percentile range (green indicator) compared to other counties in Illinois. The rate has remained relatively unchanged since 2009-2011 (2.7 hospitalizations per 10,000 population).
The percent of Medicare beneficiaries receiving treatment for hyperlipidemia (high cholesterol) in Woodford County is 50.9 percent (Healthy Communities Institute, Center for Medicare and Medicaid Services, 2014). This places the percent of Medicare beneficiaries receiving treatment in the worst fourth quartile range (red indicator) in comparison to other counties in the United States. The percentages of Medicare beneficiaries receiving treatment for atrial fibrillation is also in the worst fourth quartile range (red indicator). See Exhibit 17 below for other cardiovascular diseases/conditions.
Exhibit 17: Medicare Beneficiaries Receiving Treatment for Cardiovascular Diseases/Conditions in Woodford County 2014
Disease or Condition Percent Being Treated (2012)
Indicator Color (Comparison to US Counties)
Trend Direction from 2010
Hyperlipidemia 50.9 Red Increased from 46.1
Atrial fibrillation 10.6 Red Increased from 9.1
Hypertension 58 Yellow Increased from 53.5
Stroke 3.7 Yellow Decreased from 4.5
Heart failure 4.2 Yellow Decreased from 15.3
Ischemic heart disease 24.8 Green Decreased from 27.6
Source: Healthy Communities Institute, Center for Medicare and Medicaid Services, 2014.

23 24
DiabetesThe Center for Disease Control estimates the direct economic cost of diabetes in the United States to be about $100 billion per year (Healthy Communities Institute, Center for Disease Control, 2016). This figure does not take into account the indirect economic costs attributable to potential work time lost to diabetes- related illness or premature death.
The average annual age-adjusted emergency room visit rate due to diabetes for individuals aged 18 years and older (cases of gestational diabetes are excluded) in Woodford County is 11.5 emergency visits per 10,000 population (Healthy Communities Institute, Illinois Hospital Association, COMPdata, 2012-2014) as illustrated below in Exhibit 18. This is in the best 0-50th percentile range (green indicator) compared to other counties in Illinois. The highest incidence rate occurs in individuals aged of 65-84 years with 31.3 emergency room visits per 10,000 population.
Exhibit 18: Age-Adjusted Emergency Room Visit Rate Due to Diabetes for Woodford County 2012-2014
Source: Healthy Communities Institute, Illinois Hospital Association, COMPdata, 2012-2014.
The average annual age-adjusted hospitalization rate due to diabetes for individuals age 18 years and older (cases of gestational diabetes are excluded) is 7.3 hospitalizations per 10,000 population (Healthy Communities Institute, Illinois Hospital Association, COMPdata, 2012-2014). This is in the best 0-50th percentile range (green indicator) compared to other counties in Illinois. The highest incidence rate occurs in individuals age 65–84 years with 19.2 hospitalizations per 10,000 population.
The percent of Medicare beneficiaries receiving treatment for diabetes in Woodford County is 25.6 percent (Healthy Communities Institute, Center for Medicare and Medicaid Services, 2014).
The percent of adults in Woodford County age 20 and over that have ever been diagnosed with diabetes is 9.6 percent. This is in the best 0-50th percentile range (green indicator) compared to other counties in the United States (Healthy Communities Institute, Center for Disease Control and Prevention, 2013).
Infectious Disease Sexually Transmitted Diseases
ChlamydiaIn 2014, there were 160.4 cases of Chlamydia diagnosed per 100,000 population in Woodford County. This rate is in the best 0-50th percentile range (green indicator) compared to other counties in the United States (see Exhibit 19). This rate has increased from the 2008 rate of 127.3 cases of Chlamydia diagnosed per 100,000 population (Healthy Communities Institute, National Center for HIV/AIDS, Viral Hepatitis, STD and TB Prevention, 2014).
24
Exhibit 19 Chlamydia Incidence Rate for Woodford County 2014
Source: Healthy Communities Institute, National Center for HIV/AIDS, Viral Hepatitis, STD, and TB Prevention, 2014.
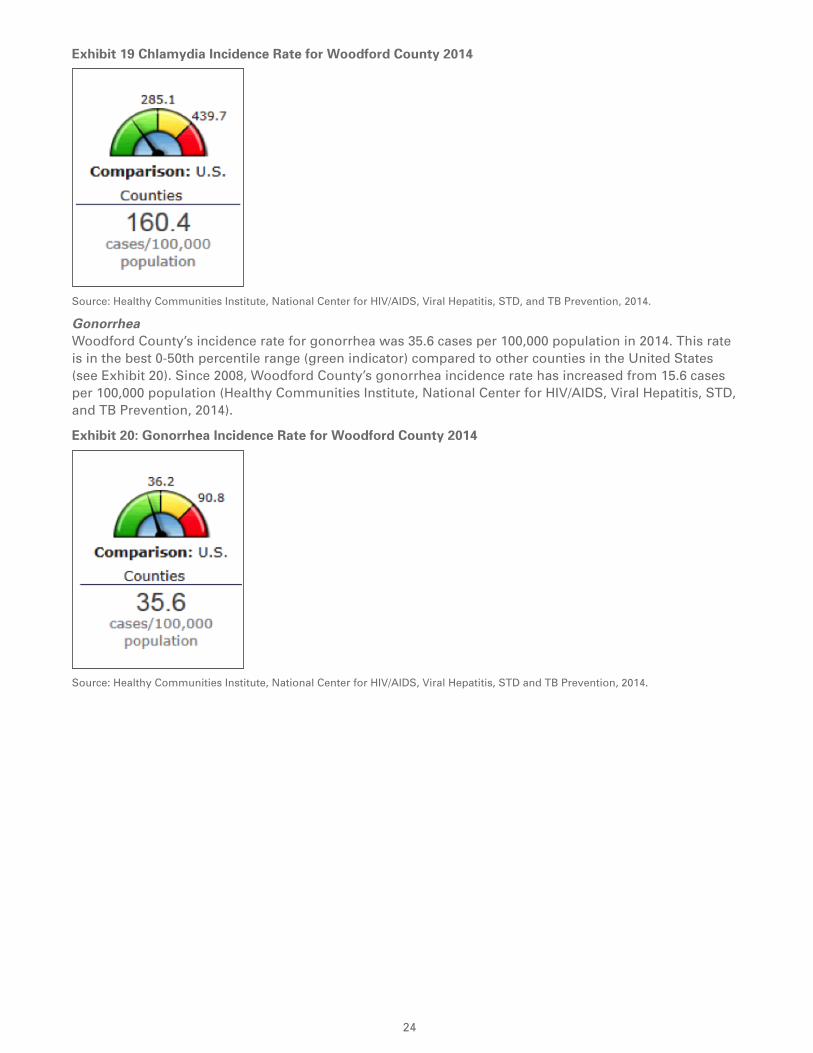
GonorrheaWoodford County’s incidence rate for gonorrhea was 35.6 cases per 100,000 population in 2014. This rate is in the best 0-50th percentile range (green indicator) compared to other counties in the United States (see Exhibit 20). Since 2008, Woodford County’s gonorrhea incidence rate has increased from 15.6 cases per 100,000 population (Healthy Communities Institute, National Center for HIV/AIDS, Viral Hepatitis, STD, and TB Prevention, 2014).
Exhibit 20: Gonorrhea Incidence Rate for Woodford County 2014
Source: Healthy Communities Institute, National Center for HIV/AIDS, Viral Hepatitis, STD and TB Prevention, 2014.

25 26
Vaccine Preventable Diseases
Pneumonia The percentage of Woodford County adults who have ever received a pneumonia vaccine at some point in their lifetime is 30.6 percent (Healthy Communities Institute, Illinois Behavioral Risk Factor Surveillance System, 2010-2014). This percentage is in the worst 50th–75th percentile range (yellow indicator) when compared to other Illinois counties as illustrated in Exhibit 21 below.
Exhibit 21: Woodford County Adults Who Have Ever Received a Pneumococcal Vaccine 2010-2014
Source: Healthy Communities Institute, Illinois Behavioral Risk Factor Surveillance System, 2010-2014.
Influenza The percentage of Woodford County adults who received an influenza vaccination in the past 12 months is 37.0 percent (Healthy Communities Institute, Illinois Behavioral Risk Factor Surveillance System, 2010-2014). This is in the worst fourth quartile range (red indicator) in comparison to other Illinois counties as illustrated below in Exhibit 22.
Exhibit 22: Woodford County Adults Who Have Ever Received an Influenza Vaccine 2010-2014
Source: Healthy Communities Institute, Illinois Behavioral Risk Factor Surveillance System, 2010-2014.
The annual age-adjusted emergency room visit rate due to immunization-preventable pneumonia and influenza for age 18 years and older in Woodford County is 4.9 visits per 10,000 population (Healthy Communities Institute, Illinois Hospital Association, COMPdata, 2012-2014). When compared to other counties in the United States, this measure falls in the best 0-50th percentile range (green indicator).
Mental HealthMental illnesses are one of the leading causes of disability in the United States. In any given year, approximately 13 million American adults have a seriously debilitating mental illness. Furthermore, unstable mental health can lead to suicide, which accounts for the death of approximately 30,000 Americans every year (Healthy Communities Institute, Illinois Hospital Association, COMPdata, 2016).
The percent of Medicare beneficiaries receiving treatment for depression in Woodford County is 16.4 percent (Healthy Communities Institute, Center for Medicare and Medicaid Services, 2014). This is in the worst 50th-75th percentile range (yellow indicator) in comparison to other counties in the United States as illustrated below in Exhibit 23. The highest percentages occur in individuals under age 65 at 38.7 percent.

26
Exhibit 23: Percent of Medicare Beneficiaries Being Treated for Depression in Woodford County 2014
Source: Healthy Communities Institute, Center for Medicare and Medicaid Services, 2014.
There were 12.6 deaths due to suicide/100,000 population in Woodford County compared to 8.4/100,000 population in Illinois (Illinois Department of Public Health, 2010-2011). The number of deaths due to suicide as well as suicide attempts in Woodford County has been on the rise as illustrated in Exhibit 24 below.
According to data from the Woodford County Sheriff’s Department for calls they responded to, the number of suicides for 2016 is 10. The number of suicide attempts increased to 48 attempts, which is greater than the total attempts for 2015.
Exhibit 24: Deaths Due to Suicide and Suicide Attempts in Woodford County 2014–June 1, 2016
2015 2016
Deaths 10 10
Attempts 35 48Source: Woodford County Sheriff, 2014-2016.
The rate for age-adjusted emergency room visits due to pediatric mental health (aged 18 years and under) for Woodford County is 34.7 emergency room visits per 10,000 population (Healthy Communities Institute, Illinois Hospital Association, COMPdata, 2012–2014). This is in the best 0-50th percentile range (green indicator) compared to other counties in Illinois (see Exhibit 25).
Exhibit 25: Age-Adjusted Emergency Room Rate Due to Pediatric Mental Health for Woodford County 2012-2014
Source: Healthy Communities Institute, Illinois Hospital Association, COMPdata, 2012-2014.
27 28
The highest emergency room visit rates due to pediatric mental health occur in:
• individuals 12-14 years old (61.3 emergency room visits per 10,000 population)
• 15-17 year olds (95.1 emergency room visits per 10,000 population)
• males (36.1 emergency room visits per 10,000 population)
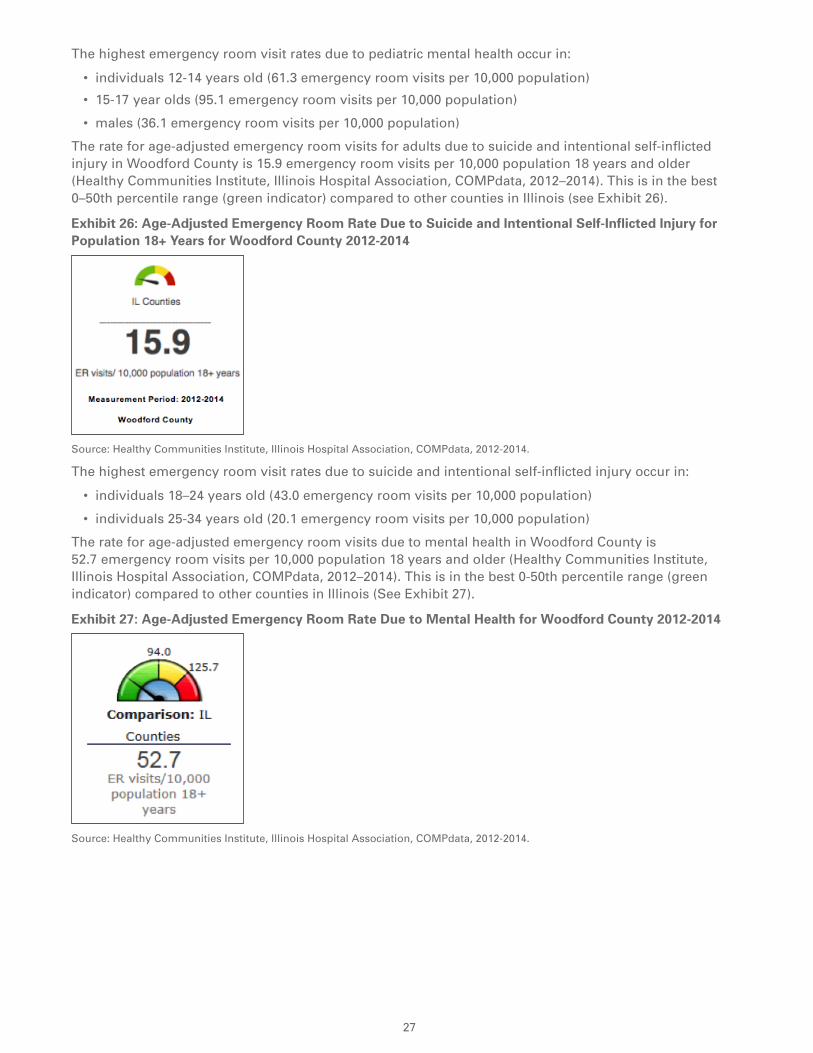
The rate for age-adjusted emergency room visits for adults due to suicide and intentional self-inflicted injury in Woodford County is 15.9 emergency room visits per 10,000 population 18 years and older (Healthy Communities Institute, Illinois Hospital Association, COMPdata, 2012–2014). This is in the best 0–50th percentile range (green indicator) compared to other counties in Illinois (see Exhibit 26).
Exhibit 26: Age-Adjusted Emergency Room Rate Due to Suicide and Intentional Self-Inflicted Injury for Population 18+ Years for Woodford County 2012-2014
Source: Healthy Communities Institute, Illinois Hospital Association, COMPdata, 2012-2014.
The highest emergency room visit rates due to suicide and intentional self-inflicted injury occur in:
• individuals 18–24 years old (43.0 emergency room visits per 10,000 population)
• individuals 25-34 years old (20.1 emergency room visits per 10,000 population)
The rate for age-adjusted emergency room visits due to mental health in Woodford County is 52.7 emergency room visits per 10,000 population 18 years and older (Healthy Communities Institute, Illinois Hospital Association, COMPdata, 2012–2014). This is in the best 0-50th percentile range (green indicator) compared to other counties in Illinois (See Exhibit 27).
Exhibit 27: Age-Adjusted Emergency Room Rate Due to Mental Health for Woodford County 2012-2014
Source: Healthy Communities Institute, Illinois Hospital Association, COMPdata, 2012-2014.
28
The highest rates occur in:
• individuals 18-24 years old (85 emergency room visits per 10,000 population)
• individuals 25-34 years old (65.8 emergency room visits per 10,000 population)
• individuals 35-44 years old (56.7 emergency room visits per 10,000 population)
• females (70.6 emergency room visits per 10,000 population)
The average number of days that Woodford County adults reported that their mental health was “Not Good” in the past 30 days is 3.2 days (Healthy Communities Institute, County Health Rankings, 2014). This is in the best 0–50th percentile (green indicator) in comparison to other counties in Illinois.
Oral HealthIn 2007-2009, 69.1 percent of Woodford County adults visited a dentist or dental clinic within the past year. This percentage is in the best 0-50th percentile range (green indicator) when compared to other Illinois counties (Healthy Communities Institute, Illinois Behavioral Risk Factor Surveillance System, 2014).
Respiratory DiseaseCurrently in the United States, more than 23 million people have asthma. Additionally, approximately 13.6 million adults have been diagnosed with COPD. Because of the cost to the health care system, the burden of respiratory diseases also falls on society; it is paid for with higher health insurance rates, lost productivity, and tax dollars. Annual health care expenditures for asthma alone are estimated at $20.7 billion (Office of Disease Prevention and Health Promotion, Healthy People 2020, 2016).
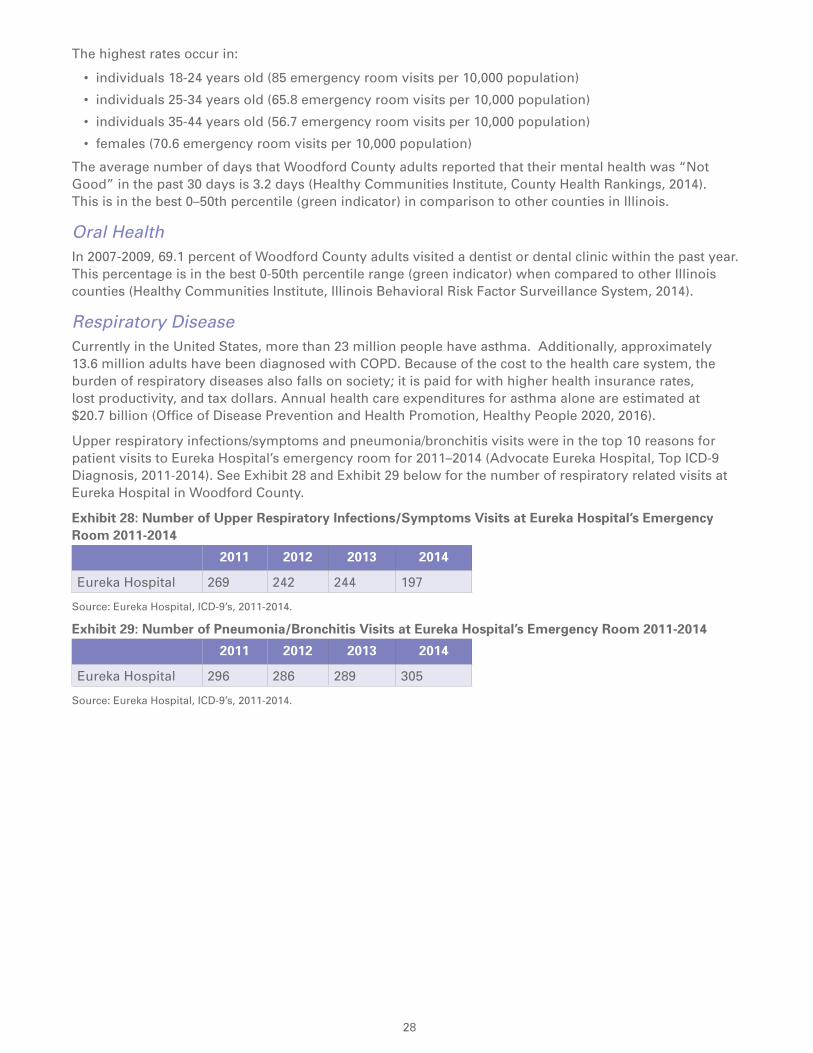
Upper respiratory infections/symptoms and pneumonia/bronchitis visits were in the top 10 reasons for patient visits to Eureka Hospital’s emergency room for 2011–2014 (Advocate Eureka Hospital, Top ICD-9 Diagnosis, 2011-2014). See Exhibit 28 and Exhibit 29 below for the number of respiratory related visits at Eureka Hospital in Woodford County.
Exhibit 28: Number of Upper Respiratory Infections/Symptoms Visits at Eureka Hospital’s Emergency Room 2011-2014
2011 2012 2013 2014
Eureka Hospital 269 242 244 197
Source: Eureka Hospital, ICD-9’s, 2011-2014.
Exhibit 29: Number of Pneumonia/Bronchitis Visits at Eureka Hospital’s Emergency Room 2011-2014
2011 2012 2013 2014
Eureka Hospital 296 286 289 305
Source: Eureka Hospital, ICD-9’s, 2011-2014.
29 30
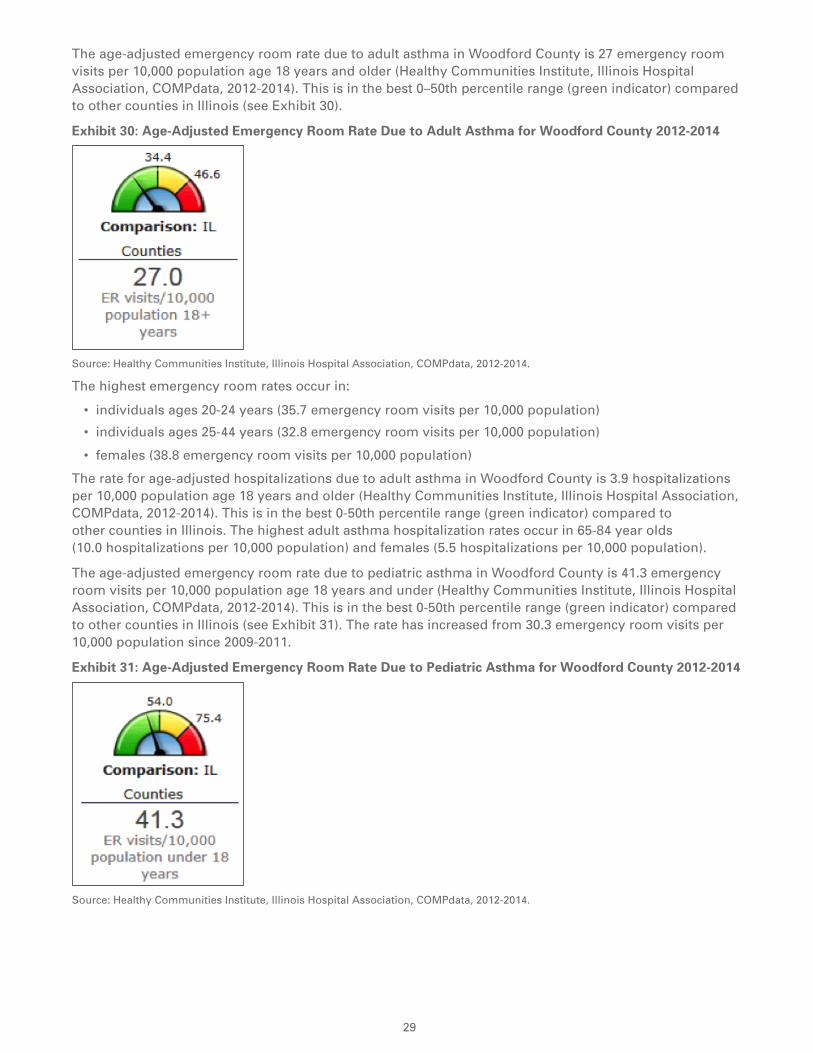
The age-adjusted emergency room rate due to adult asthma in Woodford County is 27 emergency room visits per 10,000 population age 18 years and older (Healthy Communities Institute, Illinois Hospital Association, COMPdata, 2012-2014). This is in the best 0–50th percentile range (green indicator) compared to other counties in Illinois (see Exhibit 30).
Exhibit 30: Age-Adjusted Emergency Room Rate Due to Adult Asthma for Woodford County 2012-2014
Source: Healthy Communities Institute, Illinois Hospital Association, COMPdata, 2012-2014.
The highest emergency room rates occur in:
• individuals ages 20-24 years (35.7 emergency room visits per 10,000 population)
• individuals ages 25-44 years (32.8 emergency room visits per 10,000 population)
• females (38.8 emergency room visits per 10,000 population)
The rate for age-adjusted hospitalizations due to adult asthma in Woodford County is 3.9 hospitalizations per 10,000 population age 18 years and older (Healthy Communities Institute, Illinois Hospital Association, COMPdata, 2012-2014). This is in the best 0-50th percentile range (green indicator) compared to other counties in Illinois. The highest adult asthma hospitalization rates occur in 65-84 year olds (10.0 hospitalizations per 10,000 population) and females (5.5 hospitalizations per 10,000 population).
The age-adjusted emergency room rate due to pediatric asthma in Woodford County is 41.3 emergency room visits per 10,000 population age 18 years and under (Healthy Communities Institute, Illinois Hospital Association, COMPdata, 2012-2014). This is in the best 0-50th percentile range (green indicator) compared to other counties in Illinois (see Exhibit 31). The rate has increased from 30.3 emergency room visits per 10,000 population since 2009-2011.
Exhibit 31: Age-Adjusted Emergency Room Rate Due to Pediatric Asthma for Woodford County 2012-2014
Source: Healthy Communities Institute, Illinois Hospital Association, COMPdata, 2012-2014.

30
The highest emergency room rates occur in:
• ages zero to four years old (48.8 emergency room visits per 10,000 population)
• males (45.5 emergency room visits per 10,000 population)
The age-adjusted hospitalization rate due to pediatric asthma in Woodford County is 8.2 hospitalizations per 10,000 population age 18 years and under (Healthy Communities Institute, Illinois Hospital Association, COMPdata, 2012-2014). This is in the worst 50-75th percentile range (yellow indicator) compared to other counties in Illinois (see Exhibit 32). The rate has increased from 2009-2011 (5.2 hospitalizations per 10,000 population). The highest rates occur in females with 9.2 hospitalizations per 10,000 population.
Exhibit 32: Age-Adjusted Hospitalization Rate Due to Pediatric Asthma for Woodford County 2012-2014
Source: Healthy Communities Institute, Illinois Hospital Association, COMPdata, 2012-2014.
The age-adjusted emergency room rate due to chronic obstructive pulmonary disease in Woodford County is 14.3 emergency room visits per 10,000 population age 18 years and older (Healthy Communities Institute, Illinois Hospital Association, COMPdata, 2012-2014). This is in the best 0-50th percentile range (green indicator) compared to other counties in Illinois. The rate has increased from 2009-2011 (8.3 emergency room visits per 10,000 population).
The highest emergency room rates due to chronic obstructive pulmonary disease occur in:
• individuals ages 65-84 years (51.3 emergency room visits per 10,000 population)
• females (16.4 emergency room visits per 10,000 population)
The age-adjusted hospitalization rate due to chronic obstructive pulmonary disease in Woodford County is 14.7 hospitalizations per 10,000 population aged 18 years and older (Healthy Communities Institute, Illinois Hospital Association, COMPdata, 2012-2014). This is in the best 0-50th percentile range (green indicator) compared to other counties in Illinois.
The highest hospitalization rates due to chronic obstructive pulmonary disease occur in:
• individuals ages 65-84 years (69.1 hospitalizations per 10,000 population)
The percent of Medicare beneficiaries being treated for asthma in Woodford County is 4.1 percent (Healthy Communities Institute, Center for Medicare and Medicaid Services, 2014). This is in the best 0-50th percentile range (green indicator) compared to other counties in Illinois.
The percent of Medicare beneficiaries being treated for chronic obstructive pulmonary disease in Woodford County is 10.9 percent (Healthy Communities Institute, Center for Medicare and Medicaid Services, 2014). This is in the best 0-50th percentile range (green indicator) compared to other counties in Illinois.
The percentage of adults who have been told by a healthcare provider that they have asthma in Woodford County is 7.8 percent (Healthy Communities Institute, Illinois Behavioral Risk Factor Surveillance System, 2010-2014). The highest percentage occurs in individuals ages 45-64 at 18.5 percent and with females at 13.3 percent.
31 32
Key Findings: Disease and Chronic ConditionsAlzheimer’s Disease and Dementia
• The age-adjusted death rate due to Alzheimer’s disease in Woodford County is 36 deaths per 100,000 population. This rate is in the worst 50–75th percentile range (yellow indicator) compared to other counties in Illinois.
Cancer• The breast cancer incidence rate for Woodford County females is in the worst fourth quartile range
(red indicator) when compared to other counties in the United States.
• The percent of Woodford County females aged 40 or over that have received a mammogram within the past year is lower than the state.
• The incidence rate for colorectal cancer in Woodford County is in the worst 50–75th percentile range (yellow indicator) when compared to other counties in the United States.
• The incidence rate for lung and prostate cancer is lower in Woodford County in comparison to other counties in the United States.
Cardiovascular Disease• Cardiac disorders are consistently within the top five reasons for patient visits to Eureka Hospital’s
emergency room from 2011-2015.
• Woodford County has a higher percentage of Medicare beneficiaries being treated for atrial fibrillation, hyperlipidemia, hypertension, stroke and heart failure in comparison to other counties in the United States.
Diabetes• The percent of adults in Woodford County age 20 and over that have ever been diagnosed with
diabetes is in the best 0-50th percentile range (green indicator) compared to other counties in the United States.
Infectious Disease• Woodford County’s incidence rate for gonorrhea and chlamydia is in the best 0-50th percentile range
(green indicator) compared to other counties in the United States.
• The percentage of Woodford County adults who have ever received a pneumonia vaccine at some point in their lifetime is in the worst 50–75th percentile range (yellow indicator) when compared to other Illinois counties.
• The percentage of Woodford County adults who received an influenza vaccination in the past 12 months is in the worst fourth quartile range (red indicator) in comparison to other Illinois counties.
Mental Health• The number of suicide attempts in Woodford County increased from 2015 to 2016.
• The percent of Medicare beneficiaries receiving treatment for depression in Woodford County is in the worst 50 to 75th percentile range (yellow indicator) in comparison to other counties in the United States.
• Age-adjusted emergency room visits due to pediatric mental health, suicide and intentional self-inflicted injury and harm, and mental health are in the best 0-50th percentile range compared to other counties in Illinois.
• The highest rates for age-adjusted emergency room visits due to pediatric mental health occur in individuals 15-17 years old.
Oral Health• The percent of Woodford County residents who visited a dentist or dental clinic within the past year is
in the best 0-50th percentile range (green indicator) when compared to other Illinois counties.
Respiratory Disease• The age-adjusted hospitalization rate due to pediatric asthma in Woodford County is in the worst
50-75th percentile range (yellow indicator) compared to other counties in Illinois.

32
• Woodford County has a lower percentage of Medicare beneficiaries being treated for asthma and chronic obstructive pulmonary disease than other comparative counties in the United States.
• Upper respiratory infections/symptoms and pneumonia/bronchitis visits were in the top 10 reasons for patient visits to Eureka Hospital’s emergency room for 2011–2014.
Maternal and Child HealthPre- and Post-Natal CareMothers Who Smoked During PregnancyThe percentage of births that were to mothers that smoked and/or used tobacco products during pregnancy in Woodford County is 9.1 percent. Compared to other Illinois Counties, Woodford County is in the best 0-50th percentile range for this measure; however, this percentage is higher than the Healthy People 2020 national health target to “decrease the percentage of women who gave birth and who smoked cigarettes during pregnancy to 1.4 percent” (Healthy Communities Institute, Illinois Department of Public Health, 2008; Office of Disease Prevention and Health Promotion, Healthy People 2020, 2016).
Birth OutcomesInfant MortalityThe mortality rate for infants within their first year of life for Woodford County is 3.7 deaths per 1,000 live births (Healthy Communities Institute, Illinois Department of Public Health, 2011-2013). This is in the best 0-50th percentile range compared to other counties in Illinois as show below in Exhibit 33. This rate is lower than the Healthy People 2020 national health target which is to reduce the infant mortality rate to 6 deaths per 1,000 live births. The 2011-2013 Woodford County rate (3.7 deaths per 1,000 live births) has decreased from the 2006-2008 rate of 6.8 deaths per 1,000 live births.
Exhibit 33: Infant Mortality Rate for Woodford County 2011-2013
Source: Healthy Communities Institute, Illinois Department of Public Health, COMPdata, 2011-2013.
Pre-term Births (Less than 37 Weeks Gestation)The percentage of births with less than 37 weeks of completed gestation in Woodford County is 9.2 percent (Healthy Communities Institute, Illinois Department of Public Health, 2013). This is in the best 0-50th percentile range when compared to other Illinois counties and lower than the Healthy People 2020 national health target of 11.4 percent.
Babies with Low Birth WeightThe percentage of births in which the newborn weighed less than 2,500 grams (5 pounds, 8 ounces) in Woodford County is 6.8 percent (Illinois Department of Public Health, 2013). This is in the best 0-50th percentile range (green indicator) when compared to other Illinois counties and is lower than the Healthy People 2020 national health target which is to reduce the proportion of infants born with low birth weight to 7.8 percent.
Key Findings: Maternal and Child Health• Woodford County has fewer preterm births than other Illinois counties.
• Woodford County’s infant mortality rate and percent of babies with low birth weight are both lower than the rate of other counties in Illinois and lower than the Healthy People 2020 national health target.
33 34
VIII. Prioritization of Health-Related IssuesCommunity Health Survey: Perceptions of Health Issues, Unhealthy Behaviors and Issues Impacting Quality of LifeTo aid in identifying the high priority health issues in Peoria, Woodford and Tazewell County, the 2016 Tri-County Community Health Survey asked respondents to report on their perceptions of the three most important health issues, unhealthy behaviors and factors that contribute to well-being in each of the communities.
Perceptions of Health IssuesThe 2016 Tri-County Community Health Survey asked respondents to rate the three most important health issues in their community out of 15 choices. The results for Woodford County are below.
The health issue that rated highest was cancer, which was identified by 50 percent of Woodford County respondents. Mental health was the second most important health issue according to 47 percent of Woodford County respondents. Obesity was rated as the third most important issue at 45 percent.
Perceptions of Unhealthy BehaviorsThe 2016 Tri-County Community Health Survey asked respondents to select the most important unhealthy behaviors in the community out of a total of 10 choices. The results for Woodford County are as follows: poor eating habits rated the highest at 45 percent; followed by alcohol abuse at 44 percent; and drug abuse at 39 percent.
Perceptions of Issues Impacting Quality of LifeThe 2016 Tri-County Community Health Survey asked respondents to select the three most important issues impacting well-being in the community out of a total of 11 choices. Forty-nine percent of Woodford County residents that completed the survey rated job opportunities as the most important issue impacting quality of life, followed by 47 percent rating healthy food choices and 42 percent rating access to health as the most important issues.
Priority Setting ProcessEureka Hospital participated in the priority setting process as outlined in Appendix 7, page 102, of the Tri-County Community Health Needs Assessment 2016 report. The link for the full report can be found in Appendix 2. In brief, the following steps occurred during the prioritization process with the Central Illinois Community Health Collaborative:
• Data was presented for health concerns for the Tri-County region
• Discussion occurred regarding the issues and potential grouping of issues
• The PEARL Test was applied from the Hanlon method
• The collaborative council voted to narrow issues
• The collaborative council voted a second time based on magnitude, severity and ability to impact through collaboration
• Consensus was agreed upon for two health priorities for the Tri-County region
The two needs identified during the prioritization process are:
• Healthy eating/active living
• Mental health

34
Health Need Selected Mental Health The community health needs assessment team at Eureka Hospital selected mental health as a health priority for several reasons. In addition to mental health being identified as a top health priority for the Central Illinois Community Health Collaborative, behavioral health was also identified as one of three health priorities for the Tri-County Health Department collaboration. The health departments utilized the Mobilizing for Action through Planning and Partnerships (MAPP) process to determine the health priorities. Specific to Woodford County, on December 3, 2015, several staff members from Eureka Hospital, including the Administrator of Eureka Hospital, participated in the local forces of change assessment conducted by the Woodford County Health Department as part of the Tri-County MAPP process. Mental health was identified as one of the top three forces by the 30 individuals that participated in the assessment. Forces of change are defined as those things that influence the health and quality of the life of Woodford County residents.
A second reason mental health was selected as a key health priority is that Woodford County residents that participated in the 2016 Tri-County Community Health Survey perceived mental health as the second most important health issue in the community.
In addition to the above survey data and local forces of change assessment results, the number of suicide attempts in Woodford County for 2016 has increased from the number of attempts for 2015, according to the Woodford County Sheriff’s Department for calls they responded to.
Mental health was also previously selected as a key health priority for the previous community health needs assessment by both Eureka Hospital and the Woodford County Health Department. It is clear from community input and current data that continued efforts are needed to reduce the stigma associated with mental health and give further momentum to the efforts of improving mental health for county residents.
Health Need Not Selected Healthy BehaviorsEureka Hospital did not select healthy behaviors as a priority health need for the hospital. The hospital community health needs assessment team wanted to focus its efforts on one major initiative as its resources are limited as a critical access hospital. The hospital will, however, continue to support the efforts of the Tri-County Healthy Eating/Active Living Implementation Subcommittee. A member of the management team from the hospital is serving on this committee to assist in promoting healthy eating and active living in the Tri-County region. The hospital also employs nurses in most of the public schools in Woodford County that can reinforce healthier eating habits and exercise among students.
35 36
IX. Overview of Implementation Plan Goals and Community Resources
Eureka Hospital is a vital part of Woodford County, serving the critical health needs of individuals, families, and the community with a wholistic philosophy of care. The hospital’s dedication to expanding its partnerships has resulted in engaging a network of community organizations to implement and enhance community health programs. An example of a community health program offered by the hospital is the Family Wellness Expo in which a presentation on “superfood” was provided by a hospital cardiologist and a variety of health screenings were offered. The hospital sponsors or participates in a variety of community events throughout the year to provide education locally on a variety of health related topics.
To improve mental health in Woodford County, Eureka Hospital will continue its collaboration with the Woodford County Health Department and the Tazwood Wellness Center through the IPLAN mental health subcommittee. As a result of the work of the IPLAN mental health subcommittee, beginning in January 2013, a psychiatrist began taking appointments at the health department one day a month and a counselor one day a week so fewer residents of Woodford County had to travel to Tazewell County to receive mental health services. In June, 2016 the counseling appointments moved to Eureka Hospital. The number of patients visiting Eureka Hospital’s emergency room with a mental health-related diagnosis will continue to be measured on a quarterly basis. The desired outcome is a decrease in this number due to increased local access to mental health services.
Eureka Hospital plans to continue offering an evidenced-based mental health program to the community entitled Mental Health First Aid. Mental Health First Aid is a nationally recognized adult public education program that teaches individuals how to identify, understand and respond to the signs of mental illness and substance abuse disorders. Participants learn about the signs and symptoms of acute mental health crises and chronic mental health problems like anxiety and depression. Certified instructors teach participants to become Mental Health First Aiders. In April, 2016, Eureka Hospital sent an employee to become a certified Mental Health First Aid trainer. Eureka hospital will lead the efforts in the development of a Tri-County and/or Woodford County Mental Health First Aid Collaborative. To date, Mental Health First Aid courses held in Woodford County have been held in collaboration with the McLean County Mental Health Collaborative. Eureka Hospital will collaborate with the Tri-County Health Departments, Advocate BroMenn Medical Center and the Central Illinois Area Health Education Center community partners to offer this program.
X. Vehicle for Community Feedback Community FeedbackWe welcome your feedback regarding the Community Health Needs Assessment (CHNA) Report. If you would like to comment on this report, please click on the link below to complete a CHNA feedback form. We will respond to your questions/comments within thirty days. Your comments will also be considered during our next CHNA assessment cycle.
http://www.advocatehealth.com/chnareportfeedback
If you experience any issues with the link to our feedback form or have any other questions, please click below to send an email to us at: [email protected]
This report can be viewed online at Advocate Health Care’s CHNA Report webpage via the following link: http://www.advocatehealth.com/chnareports
A paper copy of this report may also be requested by contacting the hospital’s Community Health Department.
Sharing ResultsIn addition to the opportunity to provide feedback through the means described above, Eureka Hospital CHNA Report presentations will be provided to community groups and organizations upon request.
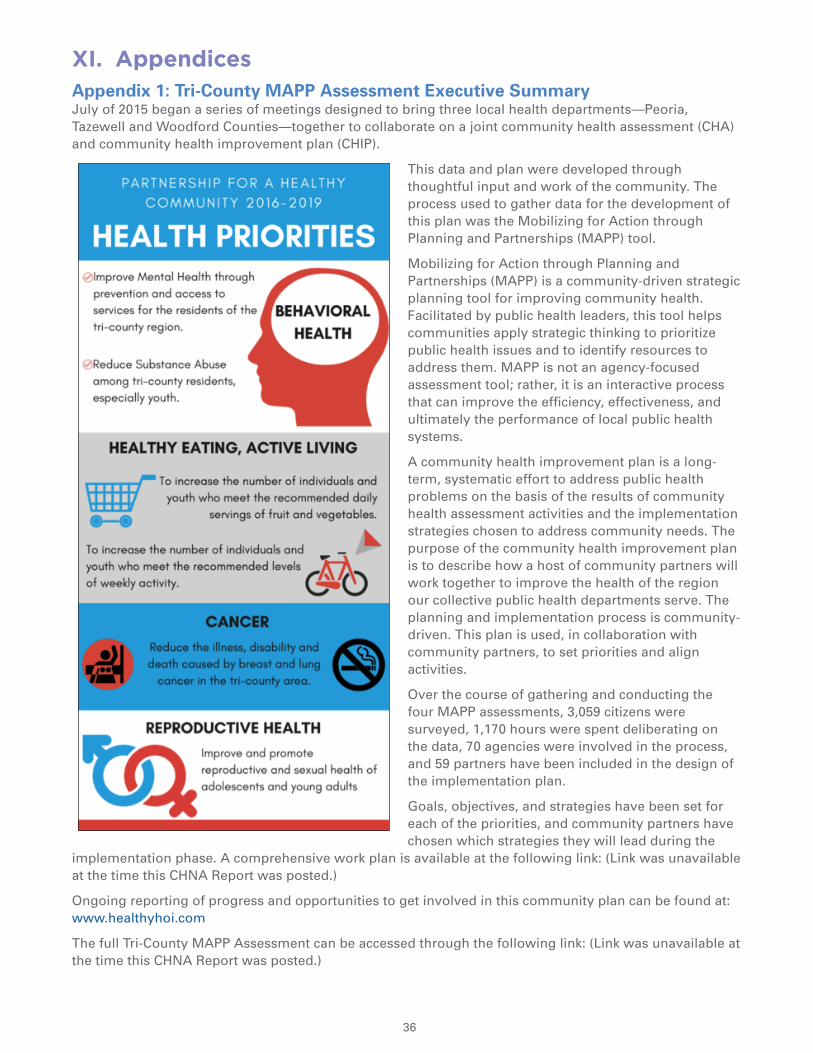
36
XI. AppendicesAppendix 1: Tri-County MAPP Assessment Executive SummaryJuly of 2015 began a series of meetings designed to bring three local health departments—Peoria, Tazewell and Woodford Counties—together to collaborate on a joint community health assessment (CHA) and community health improvement plan (CHIP).
This data and plan were developed through thoughtful input and work of the community. The process used to gather data for the development of this plan was the Mobilizing for Action through Planning and Partnerships (MAPP) tool.
Mobilizing for Action through Planning and Partnerships (MAPP) is a community-driven strategic planning tool for improving community health. Facilitated by public health leaders, this tool helps communities apply strategic thinking to prioritize public health issues and to identify resources to address them. MAPP is not an agency-focused assessment tool; rather, it is an interactive process that can improve the efficiency, effectiveness, and ultimately the performance of local public health systems.
A community health improvement plan is a long-term, systematic effort to address public health problems on the basis of the results of community health assessment activities and the implementation strategies chosen to address community needs. The purpose of the community health improvement plan is to describe how a host of community partners will work together to improve the health of the region our collective public health departments serve. The planning and implementation process is community-driven. This plan is used, in collaboration with community partners, to set priorities and align activities.
Over the course of gathering and conducting the four MAPP assessments, 3,059 citizens were surveyed, 1,170 hours were spent deliberating on the data, 70 agencies were involved in the process, and 59 partners have been included in the design of the implementation plan.
Goals, objectives, and strategies have been set for each of the priorities, and community partners have chosen which strategies they will lead during the
implementation phase. A comprehensive work plan is available at the following link: (Link was unavailable at the time this CHNA Report was posted.)
Ongoing reporting of progress and opportunities to get involved in this community plan can be found at: www.healthyhoi.com
The full Tri-County MAPP Assessment can be accessed through the following link: (Link was unavailable at the time this CHNA Report was posted.)

37 38
Appendix 2: 2014–2016 Community Health Needs Assessment Data Sources(All data and website links were verified as of the date of Governing Council approval.)
Advocate Eureka Hospital, Top ICD-9 Diagnosis, 2011-2014.
Community Health Needs Assessment 2016, OSF St. Francis Medical Center, Peoria County, Tazewell County, Woodford County. http://healthyhoi.org/community-health-assessment
County Health Rankings, 2016. http://www.countyhealthrankings.org/app/illinois/2016/rankings/woodford/county/outcomes/overall/snapshot
Healthy Communities Institute, 2016. Website unavailable to the public. The following data sources were accessed through Healthy Communities Institute:
American Community Survey, 2010-2014. http://factfinder.census.gov/faces/nav/jsf/pages/index.xhtml
American Lung Association, 2010-2013. http://www.stateoftheair.org/2015/states/?referrer=http://admin.advocatehealth.thehcn.net/modules.php?op=modload&name=NS-Indicator&file=indicator&iid=17946037
American Journal of Public Health, April 2010. https://www.coloradocollege.edu/dotAsset/50e39f0e-9490-42d2-a791-80d0f09de17f.pdf
Centers for Disease Control and Prevention Diabetes Data and Statistics, 2013. http://www.cdc.gov/diabetes/atlas/countydata/atlas.html
Center for Prevention Research and Development, Illinois Youth Survey, 2014. https://iys.cprd.illinois.edu/UserFiles/Servers/Server_178052/File/2014/cnty14_woodford.pdf
Center for Medicare and Medicaid Services, 2014. https://www.cms.gov/Research-Statistics-Data-and-Systems/Statistics-Trends-and-Reports/Chronic-Conditions/CC_Main.html
Claritas, 2016. Website unavailable.
County Health Rankings County Health Rankings, 2014. http://www.countyhealthrankings.org/app/illinois/2014/rankings/woodford/county/outcomes/overall/snapshot
Fatality Analysis Reporting System, 2013. http://www-fars.nhtsa.dot.gov/Main/index.aspx
Feeding America, 2014. http://www.feedingamerica.org/hunger-in-america/ourresearch/mapthe-meal-gap
Illinois Behavioral Risk Factor Surveillance System, 2007-2009. http://app.idph.state.il.us/brfss/countydata.asp?selTopicCounty=nutrition&areaCounty=Wood_103&show=freq&yrCounty=4&form=county&yr=&area=&selTopic=
Illinois Behavioral Risk Factor Surveillance System, 2010-2014. http://app.idph.state.il.us/brfss/countydata.asp?selTopicCounty=obesity&areaCounty=Wood_103&show=freq&yrCounty=5&form=county&yr=&area=&selTopic=
Illinois Department of Public Health, 2008. http://iquery.illinois.gov/iquery/
Illinois Department of Public Health, 2011-2013. http://www.dph.illinois.gov/data-statistics/vital-statistics/infant-mortality-statistics
Illinois Department of Public Health, 2013. http://www.dph.illinois.gov/data-statistics/vital-statistics/birth-statistics/more-statistics
National Cancer Institute, 2008-2012. http://statecancerprofiles.cancer.gov/incidencerates/
National Center for Education Statistics, 2013-2014. http://nces.ed.gov/ccd/elsi/default.aspx
National Center for HIV/AIDS, Viral Hepatitis, STD and TB Prevention, 2014. http://gis.cdc.gov/GRASP/NCHHSTPAtlas/main.html

38
Illinois Hospital Association, 2012-2014. http://www.team-iha.org/
Institute for Health Metrics and Evaluations, 2010. http://ghdx.healthdata.org/record/united-states-life-expectancy-estimates-county-1985-2010
United States Department of Agriculture Food Environment Atlas, 2012. http://ers.usda.gov/data-products/food-environment-atlas/data-access-and-documentation-downloads.aspx
Illinois Department of Public Health, 2010-2011. http://www.idph.state.il.us/health/statshome.htm
Illinois Hospital Association COMPdata, Oct 2014-Sept 2015.
Tri-County Interagency Council, 2016. http://www.tricountyinteragencycouncil.org/files/tri-county.bmp
Tri-County MAPP Community Health Assessment, 2016. http://healthyhoi.org

39 40
Appendix 3: Tri-County Community Health SurveyCommunity Health Needs Assessment Survey
Instructions
We want to know how you view our community, so we are inviting you to participate in a research study for community health-needs. Your opinions are important. This questionnaire will take approximately 10 minutes to complete. All of your individual responses are confidential. We will use results of the surveys to improve our understanding of health needs in the community.
Please read each question and mark the response that best represents your views of community needs.
I. Important Health Issues in our Community
Please identify the three (3) most important health issues in our community.
o Aging issues, such as Alzheimer’s disease, such hearing loss, memory loss or arthritis
o Infectious/contagious diseases as flu, pneumonia, food poisoning
o Cancer o Injuries
o Chronic pain o Lung disease (asthma, COPD)
o Dental health (including tooth pain) o Mental health issues such as depression, hopelessness, anger, etc.
o Diabetes o Obesity/overweight
o Early sexual activity o Sexually transmitted infections
o Heart disease/heart attack o Stroke
o HIV/AIDS o Other ___________________________________
II. Unhealthy Behaviors
Please identify the three (3) most important unhealthy behaviors in our community.
o Angry behavior/violence o Not able to get a routine checkup
o Alcohol abuse o Poor eating habits
o Child abuse o Reckless driving
o Domestic violence o Risky sexual behavior.
o Drug abuse o Smoking
o Elder abuse (physical, emotional, financial, sexual)
o Other _____________________________________
III. Issues with Your Well Being
Please identify the three (3) most important factors that impact your wellbeing in our community.
o Access to health services o Healthy food choices
o Affordable clean housing o Less hatred & more social acceptance
o Availability of child care o Less poverty
o Better school attendance o Less violence
o Job opportunities o Safer neighborhoods/schools
o Good public transportation o Other ___________________________________

40
IV. Access to Health CareThe following questions ask about your own personal health and health choices. Remember, this survey will not be linked to you in any way.
1. When you get sick, where do you go? Please choose only one.
o Clinic/Doctor’s office o Emergency Department o I don’t seek medical attention
o Urgent Care Center o Health Department o Other ________________________
2. How long has it been since you have been to the doctor to get a checkup when you were well (not because you were already sick)?
o Within the last year o 1-2 years ago o 3-5 years ago
o 5 or more years ago o I have never been to a doctor for a checkup.
3. In the last year, was there a time when you needed medical care but were not able to get it?
o No (please go to question 5) o Yes (please go to the next question)
4. If you just answered “yes” to question 3, why weren’t you able to get medical care? Choose all that apply.
o I didn’t have health insurance. o The doctor or clinic refused to take my insurance or Medicaid.
o I couldn’t afford to pay my co-pay or deductible. o I didn’t know how to find a doctor.
o I didn’t have any way to get to the doctor. o Too long to wait for appointment.
o Fear
o Other ___________________________________
5. In the last year, was there a time when you needed prescription medicine but were not able to get it?
o No (please go to question 7) o Yes (please go to the next question)
6. If you just answered “yes” to question 5, why weren’t you able to get prescription medication? Choose all that apply.
o I didn’t have health insurance. o The pharmacy refused to take my insurance or Medicaid.
o I couldn’t afford to pay my co-pay or deductible.
o I didn’t have any way to get to the pharmacy.
o I didn’t know how to find a pharmacy. o Other _________________________________________
7. About how long has it been since you have been to the dentist to get a checkup (not for an emergency)?
o Within the last year o 1-2 years ago o 3-5 years ago
o 5 or more years ago o I have never been to a doctor for a checkup.
8. In the last year, was there a time when you needed dental care but could not get it?
o (please go to question 10) o Yes (please go to the next question)

41 42
9. If you just answered “yes” to question 8, why weren’t you able to get dental care? Choose all that apply.
o I didn’t have dental insurance. o The dentist refused to take my insurance or Medicaid.
o I couldn’t afford to pay my co-pay or deductible.
o I didn’t know how to find a dentist.
o I didn’t have any way to get to the dentist. o To long to wait for appointment.
o Fear. o Other ________________________________________
10. In the last year, was there a time when you needed mental-health counseling but could not get it?
o No (please go to question 12) o Yes (please go to the next question)
11. If you just answered “yes” to question 10, why weren’t you able to get mental-health counseling? Choose all that apply.
o I didn’t have insurance. o The counselor refused to take my insurance or Medicaid.
o I couldn’t afford to pay my co-pay or deductible.
o I didn’t know how to find a counselor.
o I didn’t have any way to get to a counselor. o To long to wait for appointment.
o Fear. o Other ________________________________________
o Embarrassment.
12. In the last week how many times did you participate in deliberate exercise (such as jogging, walking, golf, weight-lifting, fitness classes) that lasted for at least 30 minutes or more?
o None (please go to next question) o 1-2 o 3-5 o More than 5
--
13. If you answered “none” to the last question, why didn’t you exercise in the past week? Choose all that apply.
o I don’t have any time to exercise. o I don’t like to exercise.
o It is not important to me. o I can’t afford the fees to exercise.
o I don’t have access to an exercise facility. o I am too tired.
o I don’t have child care while I exercise. o I have a physical disability.
o Other ___________________________________
14. On a typical day, how many servings of fruits and/or vegetables do you have?
o None (please go to next question) o 1-2 o 3-5 o More than 5
15. If you answered “none” to the last question, why didn’t you eat fruits/vegetables? Choose all that apply.
o It is difficult to buy fruits and/or vegetables. o I don’t like fruits/vegetables.
o It is not important to me. o I can’t afford fruits/vegetables.
o Other ___________________________________

42
16. On a typical day, how many cigarettes do you smoke (either actual or electronic/vapor)?
o None o 1-4 o 5-8 o 9-12 o More than 12
17. Where do you get most of your medical information (check only one)
o Doctor o Friends/family o Internet o Pharmacy o Nurse at my church
18. Do you have a personal physician? o No o Yes
19. Overall, my physical health is: o Good o Average o Poor
20. Overall, my mental health is: o Good o Average o Poor
21. How long has it been since you have had a flu shot?
o Within the last year o 1-2 years ago o 3-5 years ago
o 5 or more years ago o I have never had a flu shot
V. Background Information
What county do you live in?
o McLean o Other
What type of insurance do you have?
o Medicare o Medicaid o Private/commercial o None
If you answered “none” to the last question, why don’t you have insurance? Choose all that apply.
o I cannot afford insurance. o I don’t need insurance.
o I don’t know how to get insurance. o Other ___________________________________
What is your gender? o Male o Female
What is your age?
o Under 20 o 21-30 o 31-40 o 41-50 o 51-60 o 61-70 o 71 or older
What is your race?
o White o Black/African American
o Hispanic/Latino o Native American/American Indian/Alaska Native
o Asian (Indian, Pakistani, Japanese, Chinese, Korean, Vietnamese, Filipino)
o Pacific Islander (Native Hawaiian, Samoan, Guamanian/Chamorro)
o Other race not listed here: ____________________________________________________________________
What is your highest level of education?
o Less than high school o Some high school o High school degree (or GED/equivalent)
o Some college (no degree) o Associate’s degree o Bachelor’s degree
o Graduate or professional degree
o Other ____________________________________________________
What was your total income last year, before taxes?
o Less than $20,000 o $20,001 to $40,000 o $40,001 to $60,000
o $60,001 to $80,000 o $80,001 to $100,000 o Over $100,000

43 43
Do you: o Rent o Own o Other
How many people live in your home? ____________________
What is your job status?
o Full-time o Part-time o Homemaker
o Retired o Student o Armed Forces
Is there anything else you would like to tell us about community concerns, health problems or services in the community?
____________________________________________________________________________________________________
Thank you very much for sharing your views with us!
This survey instrument was reviewed by the Committee on the Use of Human Subjects and Research (CUSHR), Bradley University
Institutional Review Board (IRB) in May, 2015
©Copyright 2015 by Laurence G. Weinzimmer. All rights reserved.
No portion of this document may be reproduced or transmitted in any form without the written permission of the author.

01/17 MC 2224
101 S. Major Street Eureka, IL 61530
309.467.2371 advocatehealth.com/eureka