community health needs assessment · and a foundation for ongoing community engagement activities...
TRANSCRIPT
Community Health Needs Assessment
2017-2018
Presented by

Introduction .............................................................................................................................. 3 History, Mission and Vision ..................................................................................................... 3
Executive Summary .................................................................................................................. 4 Market Area Definition ............................................................................................................ 5
Service Areas ........................................................................................................................ 5 Description of the Community Served ................................................................................... 6
Response to the 2013–2015 Community Health Needs Assessment and the Changing Healthcare Environment ............................................................................................................................ 7
Activities in Response to Prioritized Needs ............................................................................ 7 Community Health Needs Assessment Participants ................................................................. 10 Assessment Methodology ....................................................................................................... 12 Summary of 2017-2018 Prioritized Community Needs ............................................................. 16
Community Needs Assessment Research Summary .................................................................. 17
Key Demographic and Economic Indicators ............................................................................ 18 Demographic Composition and Population Change Projections ............................................... 18 Additional Data by County (All 12 Total Service Area Counties) ............................................. 21
Primary Service Area Data Focus ............................................................................................ 22 Demographic and Community Profile Factors ......................................................................... 22
Population Age Structure .................................................................................................... 23 Families with Children under Age 18 ................................................................................... 23 Race Ethnicity .................................................................................................................... 23
Social and Physical Environment ............................................................................................ 24 Unemployment – Civilian Population 16 and Older .............................................................. 24 Unemployment Rate by Race .............................................................................................. 24 Poverty ............................................................................................................................... 25 Poverty Segmented By Race ................................................................................................ 25 Children in Poverty ............................................................................................................. 26 Income Distribution ............................................................................................................ 26 Educational Attainment ...................................................................................................... 27 Number of reported violent crime offenses per 100,000 population ........................................ 28 Healthy Eating, Physical Activity, and Overweight/Obesity ................................................. 28
Health Status Profile............................................................................................................... 30 Leading Causes of Death ..................................................................................................... 30 Alcohol, Illicit Substance and Tobacco Use .......................................................................... 31 Current Tobacco Users ........................................................................................................ 32 General Health ................................................................................................................... 33 Maternal and Child Health: Infant Mortality ........................................................................ 33 Access to Healthcare Providers ............................................................................................ 34 Communicable Diseases ...................................................................................................... 34 Health Insurance ................................................................................................................. 35 Preventable Hospital Events for the Medicare Population ..................................................... 35
Hospital Inpatient Discharge Data Patterns .............................................................................. 36
La Fiesta del Pueblo Festival Survey Highlights ........................................................................ 37
Patient, Community Stakeholder, Provider, and Staff Discussions ............................................. 39 Broad Dimensions of Health ................................................................................................... 39 Health Problems and Contributing Factors .............................................................................. 40 Solutions and Suggested Interventions ..................................................................................... 41 Leading Challenges ................................................................................................................ 42
Community Survey ................................................................................................................. 44

Health Issues Evaluated in the Modified Delphi Method ........................................................... 47
The Prioritized List of Needs ................................................................................................... 49
Implementation Strategy Considerations .................................................................................. 50
Appendices ............................................................................................................................. 51 Appendix A: Leadership and Community Discussion Guide .................................................... 52
CURRENT INVOLVEMENT AND EXPERIENCE IN THE COMMUNITY .................... 53 Appendix B: La Fiesta del Pueblo Survey Instrument............................................................... 56 Appendix C: La Fiesta del Pueblo Festival Survey Frequency Tables ........................................ 58 Appendix D: Additional Data by County (All 12 Total Service Area Counties) ........................ 64
Quality of Life .................................................................................................................... 64 Teen Births ......................................................................................................................... 65 Physical Activity ................................................................................................................. 66 Preventable Hospital Days................................................................................................... 67 Adult Smoking.................................................................................................................... 68 Adult Obesity ..................................................................................................................... 69 Uninsured Population ......................................................................................................... 70 Educational Attainment ...................................................................................................... 71 Diabetes Monitoring ........................................................................................................... 72 Unemployment ................................................................................................................... 73 Children in Poverty ............................................................................................................. 74 Premature Death ................................................................................................................. 75 Poor or Fair General Health ................................................................................................ 76 Low Birthweight ................................................................................................................. 77 Excessive Drinking ............................................................................................................. 78 Sexually Transmitted Infections ........................................................................................... 79 Alcohol-Impaired Driving Deaths ........................................................................................ 80 Mammogram Screening ...................................................................................................... 81 Community Survey Results ................................................................................................. 82
Appendix E: Community Resources and Facilities ................................................................. 115

Tift Regional Medical Center, Community Health Needs Assessment
Introduction
History, Mission and Vision
TRHS is an economic and healthcare
pillar in the community. Tift Regional
Medical Center (TRMC) is the 181-bed
flagship for Tift Regional Health
System. Cook Medical Center (CMC)
has 60 inpatient beds, including the
Sylvia Barr Center, a 12-bed geriatric -
psychiatric unit. The TRHS care
continuum is supported by the CMC
Cook Senior Living Center (a 95-bed skilled nursing facility).
TRHS works to improve the quality of life of area residents by providing acute care medical services,
specialized medical care (such as women’s health, oncology, orthopedics, surgical services, geriatric mental
health, and others. The organization provides a full range of treatment alternatives in several locations
throughout south central Georgia to meet the needs of children, adolescents, adults, and older adults. Inpatient
services are provided at TRMC, as well as CMC. Additionally, the Tifton Physicians Center (located near the
TRMC main campus), the Tift Regional Physician Group (with over 20 locations throughout South Central
Georgia), and the West Campus (located near the TRMC main campus) position TRHS as the core of the
healthcare system in the Tift County Primary Service Area (PSA), as well as the seven adjacent counties that
comprise the Secondary Service Area (SSA).
The Community Health Needs Assessment (CHNA) will help TRHS continue to focus its efforts on
community needs that can be positively impacted by the hospitals’ inpatient hospitalization, outpatient
services, and integrates care capabilities. TRHS’s prominent role in this culturally rich area underscores the
importance of the CHNA and the associated research proposed in
this document.
The 2017 CHNA provides TRHS with an in-depth assessment of
healthcare priorities (focusing on medical health, behavioral health,
and co-morbid conditions), linkage to the Implementation Plans,
and a foundation for ongoing community engagement activities for
each inpatient hospital. Crescendo’s unique approach encompasses
the same broad definition of “health” consistent with that reflected
in the TRHS mission statement.
“To serve the health needs of
the patient as well as those of
the communities we serve.”– Tift Regional Health System MissionStatement
Tift Regional Medical Center, Community Health Needs Assessment 4
Executive Summary
In order to provide succinct, easily accessible reference to the Community Health Needs Assessment requirements, the Executive Summary includes the following section contains the research results:
• Market Area Definition
• Response to the 2013–2015 Community Health Needs Assessment and the Changing HealthcareEnvironment
• Community Health Needs Assessment Participants
• Assessment Methodology (including prioritization)
• Summary of 2017-2018 Prioritized Community Needs
The requirements also include a list of community resources available to address community needs; the list is included in the appendix.

Tift Regional Medical Center, Community Health Needs Assessment 5
Market Area Definition
Service Areas
The TRMC Service Area includes 12 counties in southwest Georgia:
Primary Service Area (PSA)
• Tift County
• Turner County
• Cook County
Secondary Service Area
(SSA)
• Atkinson County
• Benhill County
• Berrien County
• Coffee County
• Colquitt County
• Crisp County
• Irwin County
• Wilcox County
• Worth County

Tift Regional Medical Center, Community Health Needs Assessment 6
Description of the Community Served TRHS is an economic and healthcare pillar in the community. Tift Regional Medical Center (TRMC) is the
181-bed flagship for Tift Regional Health System. Cook Medical Center (CMC) has 60 inpatient beds,
including the Sylvia Barr Center, a 12-bed geriatric - psychiatric unit. The TRHS care continuum is supported
by the CMC Cook Senior Living Center (a 95-bed skilled nursing facility).
The Primary Service Area (PSA) is comprised Tift, Turner, and Cook Counties. tri-county area includes nearly 67,000 people and reflects high level of racial, economic, and health status diversity.
• Tift County includes over half of the service area population. About three of ten (29.8%) of the county’spopulation is comprised of African Americans. In addition, residents have a slightly higher medianhousehold income and lower median age than the other two PSA counties. These two indicators oftencorrelate with a better community health. Tift County also has a higher percentage of people livingbelow 100% of the Federal Poverty Level (FPL).
• Turner County residents have the highest median age. The county is racially diverse, with over 40% ofits residents being African American.
• Cook County is the least racially diverse county in the TRMC PSA, as slightly more than one of fourresidents (27.7%) are African American.
Tift County
Turner County
Cook County
•Population: 40,787
•Percent African American: 29.8%
•Median household income: $37,653
•Median age: 35.1
•Percent living in poverty: 29.3%
•Percent reporting “fair” or “poor” health: 22.0%
•Population: 8,338
•Percent African American: 41.0%
•Median household income: $31,806
•Median age: 38.0
•Percent living in poverty: 25.4%
•Percent reporting “fair” or “poor” health: 21.0%
•Population: 17,033
•Percent African American: 27.7%
•Median household income: $35.683
•Median age: 36.7
•Percent living in poverty: 25.1%
•Percent reporting “fair” or “poor” health: 22.0%

Tift Regional Medical Center, Community Health Needs Assessment 7
Response to the 2013–2015 Community Health Needs Assessment and the Changing
Healthcare Environment
Activities in Response to Prioritized Needs The 2014 TRHS CHNA identified four leading community needs; the highest priority ones were to improve
access to primary care, increase mental health service resources, promote healthy behavior with specific
preventive education and outreach programs geared towards chronic conditions, and reduce vehicle accidents
and deaths.
Based on the 2014 assessment, the hospital enacted specific programs designed to impact the needs. TRHS
developed implementation plan activities for the top needs. Activities enacted as a result of the 2014 CHNA
and Implementation Plan include the following:
2014 CHNA-related Priority Needs and
Activities Conducted by TRHS to Address Them
CHNA Need Category
TRHS Activity Undertaken to
Address the Needs
Improve primary care
Expand the primary care base within Tift Regional’s service area in accordance with an independent medical staff development analysis.
• TRHS has recruited 22 primary carephysicians since 2014. This includes internalmedicine, hospital medicine, pediatrics, familymedicine, emergency medicine and OB/GYN.
• TRHS has outreach primary care clinics in
seven counties, including Tift, Worth, Turner,Irwin, Berrien, Cook and Colquitt counties.
• TRHS has expanded use of advanced practiceproviders to meet demand (currently 34 aredeployed at the various primary care clinicswithin the service area, not including specialtyadvanced practice providers). This includesnurse practitioners and physician assistants.

Tift Regional Medical Center, Community Health Needs Assessment 8
Provide outpatient services that offer
preventive care for the underinsured, decompress the Emergency Room prevent readmissions to the hospital
• Accepting walk-in patients and offering same-
day appointments, Tift Community Health Center (TCHC) is a clinic serving residents who may be economically-disadvantaged. The clinic recently welcomed four new providers and is expanding its building for additional patient capacity.
• TCHC also offers the Transition Clinic program, which provides follow-up appointments and prescription refills to recently discharged hospital patients who may not have timely access to a primary care provider.
• Tift Regional’s Outpatient Case Management Department helps recently-discharged patients access local resources and assistance programs to help minimize readmissions.
• TRHS currently has primary care providers embedded in local high-volume nursing homes. The providers are training nursing home staff to identify potential patient problems before the issues blossom into a crisis requiring a visit to the ER and/or admission (or readmission) to the hospital.
• The Tift Regional Medical Center Foundation is purchasing a healthcare bus for TRHS in fall
2018. This mobile clinic will be used for outreach to medically-underserved areas within the region.
• TRHS has two convenient care clinics: Affinity ExpressCare in Tifton and Cook Family Wellness Center in Adel. In-the-works: an orthopedic convenient care clinic.
Implement disease management programs and convenient care services for employers.
• WorkSmart is an occupational health clinic which currently provides disease management programs for five major employers and is seeking to expand this service. In addition, WorkSmart has a sick visit program with a
large distribution company and holds on-site wellness activities for numerous industries.
• As Tift County’s biggest employer, Tift Regional provides an employee medical home clinic for its own workforce.
• TRHS holds ongoing free health seminars, screenings and medical fairs for the community covering issues such as obesity,

Tift Regional Medical Center, Community Health Needs Assessment 9
cardiovascular disease, cancer,
musculoskeletal disorders and more.
• TRHS offers a Diabetes Learning Center, chronic kidney disease classes and various support groups, including cancer, Alzheimer’s, Lupus and more.
• TRHS has two convenient care clinics: Affinity ExpressCare in Tifton and Cook Family Wellness Center in Adel. In-the-works: an orthopedic convenient care clinic.
Develop Patient Centered Medical Homes (PCMHs) for the TRMC service area.
• TRHS currently has 18 primary care practices which have achieved Top Recognition as a Patient Centered Medical Home by the
National Committee for Quality Assurance (NCQA).
Work with Stratus Healthcare partners and the South Georgia Primary Care Network on the development of population health management.
• These efforts have been streamlined to focus on the development of the Care Alliance Accountable Care Organization (ACO), which launched in January 2016. This is a Medicare-approved ACO.
Develop a plan to address the shortage of mental health resources
Recruit a psychiatrist to develop a psychiatry program to include inpatient consults, outpatient counseling and to serve as medical director of the Sylvia Barr Center, Tift
Regional Health System’s 12‐bed geriatric psychiatric unit at Cook Medical Center in Adel.
• TRHS recruited a full-time employed psychiatrist to serve in this role along with a psychiatric nurse practitioner and two licensed counselors.
• TRHS is also building a replacement facility for Cook Medical Center in Adel, which will include a brand new Sylvia Barr Center (to be completed in late 2019). The goal is to expand to 20 geriatric psychiatric beds by 2020.
Explore a psychiatric telemedicine compliment.
• TRHS is currently providing psychiatric telemedicine consulting to a local nursing home and is exploring additional psychiatric telemedicine services for the community.

Tift Regional Medical Center, Community Health Needs Assessment 10
Community Health Needs Assessment Participants
TRHS reached out to an expansive and highly diverse group of individuals to participate in its CHNA
leadership team and to contribute insight from community service organizations. Each member provided
project insight, feedback regarding perceptions of area health needs, data evaluation, and other guidance during
the CHNA process. These individuals had a breadth of community health vision, knowledge, and power to
impact the well-being of the service area.
The CHNA leadership team included the following members:
LEADERSHIP GROUP PARTICIPANTS
Tift Regional Health System participants
Name Title
Jay Carmichael Administrative Chief of Staff
Dr. William Guest Chief Medical Officer (retired)
Dr. Cameron Nixon Chief Transformation Officer
Mindy McStott, RN Vice President, Quality Management
Chris Efaw Vice President, Outreach and Development
Mary Perlis, RN Director, Outpatient Case Management
Andrea Heath Director, Director of Specialty Clinics
Wanda Watson, RN Manager, Diabetes Learning Center
Kristy Daniels, LCSW Manager, Hospice of Tift Area
Joel Presley Director, Clinical Integration
Valerie Levy AHC Grant Director
Amanda Ramshead Director, Behavioral Services
Shannon Simpson Tumor Registry Supervisor
Liza Tillman Director of Public Relations
Joy Davis Oncology Accreditation Coordinator
LeAnn Pritchett Director, Patient Safety
Jim O’Conner Data Analyst, Clinical Integration

Tift Regional Medical Center, Community Health Needs Assessment 11
Community participants
Name Title/Organization
John B. Prince, III President, Prince Automotive Group and Former Chairman, Hospital Authority of Tift County
Joyce Mims Secretary, Hospital Authority of Tift County
Darian Peavy CEO, Tiftarea YMCA
Craig Sowell Director, Tift County Recreation Department
Nancy Bryan Executive Director, Ruth’s Cottage & Patticake House
Lillie McEntyre Director, Tift County Commission on Children and Youth
Fran Kinchen Director, Leroy Rogers Center
Roxie Price Family & Consumer Sciences Agent, Tift County Extension Service
Dina Willis Tifton Tift County Public Library/Hispanic Community Activist
Marcus Seigle Chiropractor/Hispanic Community Activist
Tammy Licea Social Worker, Diversified Resources
The CHNA executive interview list included the following members:
EXECUTIVE INTERVIEWS
Tift Regional Health System participants
Name Title
Dr. Langston Cleveland Occupational Medicine, WorkSmart Occupational Health
Dr. William Hancock Cardiology, Tift area Cardiology
Dr. Vincent Valencia Family Medicine, Cook Primary Care
Mandy Brooks Executive Director, Tift Regional Medical Center Foundation
Chris Dorman President/CEO
William T. Richardson Retired President/CEO
Michael Purvis CEO, Cook Medical Center
LeAnn Pritchett Director, Patient Safety
Valerie Levy AHC Grant Director
Mary Perlis, RN Director, Outpatient Case Management
William Guest, MD Senior VP and Chief Medical Officer
Mindy McStott, RN VP, Quality Management
Dr. Melissa Rampal Nephrology

Tift Regional Medical Center, Community Health Needs Assessment 12
Community participants
Name Title/Organization
Cindy Evers Community Member, Northside Baptist Church
Tina Moody, RN Medical Services Supervisor, Tift County School System
David Fant Orgill
Pete Pyrzenski Manager, City of Tifton
Julie Smith Mayor, City of Tifton
Greg Battle Pastor, Herring Memorial United Methodist Church
Judge Herbert Benson State Court of Tift County
Assessment Methodology
The TRHS CHNA methodology includes a combination of quantitative and qualitative research methods
designed to evaluate perspectives and opinions of area stakeholders and healthcare consumers – especially
those from underserved populations. The methodology that was used helped prioritize the needs and establish
a basis for continued community engagement – in addition to simply developing a broad, community-based list
of needs.
The major sections of the methodology include the following:
• Strategic secondary research
• Qualitative discussion groups and one-on-one interviews with TRHS leaders, Community Leadership
Team members, other community service providers, and healthcare consumers in the primary service area
(PSA) and Secondary Service Area (SSA)
• Hispanic population surveys
• Community surveys
• Needs prioritization using a modified Delphi Method. The Delphi Method was pioneered by the
RAND Corporation. It is a quantitative and qualitative survey method used to collect, distill, and reach
prioritized consensus around creative ideas and/or qualitative issues and questions.
Each of these components of the CHNA methodology is described in the following sections.
Tift Regional Medical Center, Community Health Needs Assessment 13
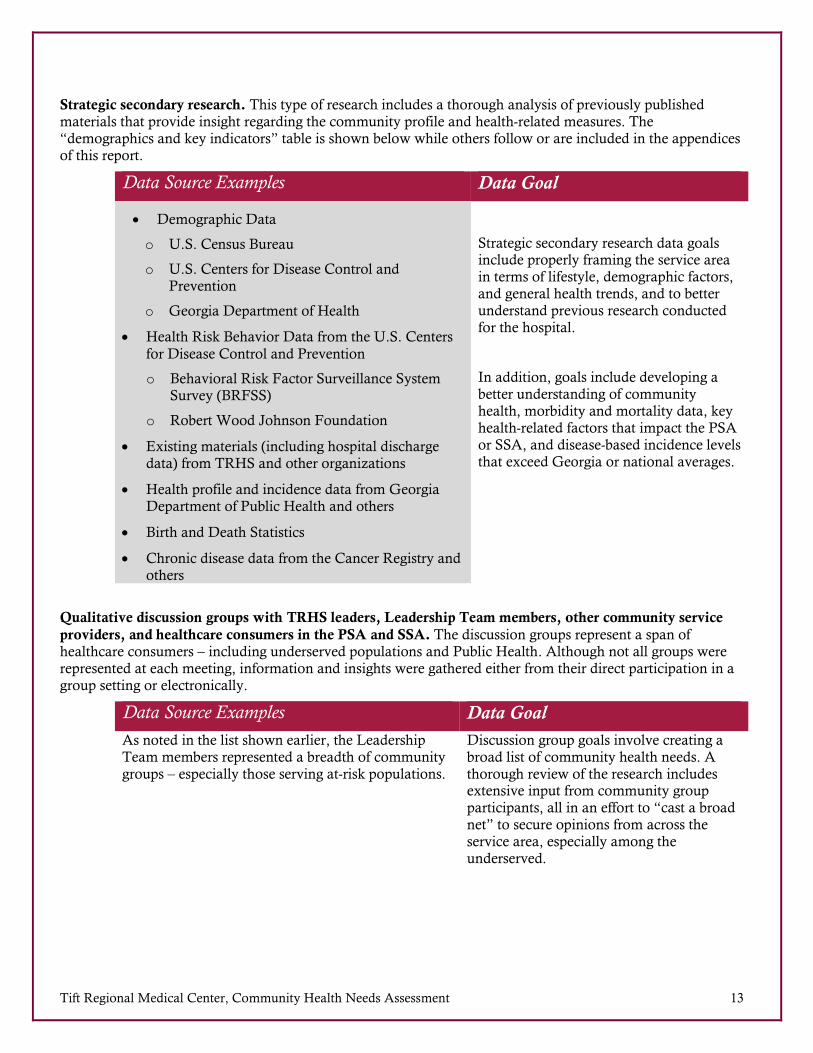
Strategic secondary research. This type of research includes a thorough analysis of previously published
materials that provide insight regarding the community profile and health-related measures. The “demographics and key indicators” table is shown below while others follow or are included in the appendices of this report.
Data Source Examples Data Goal
• Demographic Data
o U.S. Census Bureau
o U.S. Centers for Disease Control and Prevention
o Georgia Department of Health
• Health Risk Behavior Data from the U.S. Centers
for Disease Control and Prevention
o Behavioral Risk Factor Surveillance System Survey (BRFSS)
o Robert Wood Johnson Foundation
• Existing materials (including hospital discharge data) from TRHS and other organizations
• Health profile and incidence data from Georgia Department of Public Health and others
• Birth and Death Statistics
• Chronic disease data from the Cancer Registry and
others
Strategic secondary research data goals include properly framing the service area in terms of lifestyle, demographic factors, and general health trends, and to better understand previous research conducted for the hospital.
In addition, goals include developing a better understanding of community health, morbidity and mortality data, key health-related factors that impact the PSA or SSA, and disease-based incidence levels that exceed Georgia or national averages.
Qualitative discussion groups with TRHS leaders, Leadership Team members, other community service
providers, and healthcare consumers in the PSA and SSA. The discussion groups represent a span of healthcare consumers – including underserved populations and Public Health. Although not all groups were represented at each meeting, information and insights were gathered either from their direct participation in a group setting or electronically.
Data Source Examples Data Goal
As noted in the list shown earlier, the Leadership Team members represented a breadth of community groups – especially those serving at-risk populations.
Discussion group goals involve creating a broad list of community health needs. A thorough review of the research includes extensive input from community group
participants, all in an effort to “cast a broad net” to secure opinions from across the service area, especially among the underserved.
Tift Regional Medical Center, Community Health Needs Assessment 14
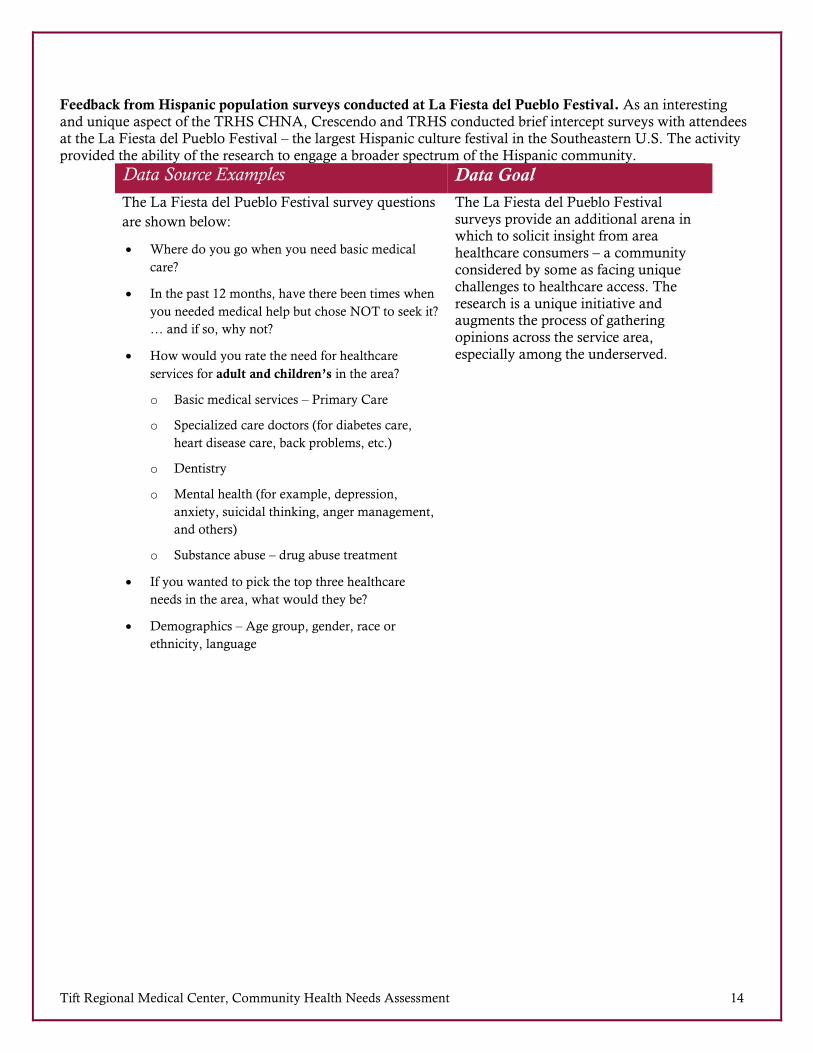
Feedback from Hispanic population surveys conducted at La Fiesta del Pueblo Festival. As an interesting
and unique aspect of the TRHS CHNA, Crescendo and TRHS conducted brief intercept surveys with attendees at the La Fiesta del Pueblo Festival – the largest Hispanic culture festival in the Southeastern U.S. The activity provided the ability of the research to engage a broader spectrum of the Hispanic community.
Data Source Examples Data Goal
The La Fiesta del Pueblo Festival survey questions
are shown below:
• Where do you go when you need basic medical
care?
• In the past 12 months, have there been times when
you needed medical help but chose NOT to seek it?
… and if so, why not?
• How would you rate the need for healthcare
services for adult and children’s in the area?
o Basic medical services – Primary Care
o Specialized care doctors (for diabetes care,
heart disease care, back problems, etc.)
o Dentistry
o Mental health (for example, depression,
anxiety, suicidal thinking, anger management,
and others)
o Substance abuse – drug abuse treatment
• If you wanted to pick the top three healthcare
needs in the area, what would they be?
• Demographics – Age group, gender, race or
ethnicity, language
The La Fiesta del Pueblo Festival surveys provide an additional arena in which to solicit insight from area healthcare consumers – a community considered by some as facing unique challenges to healthcare access. The research is a unique initiative and augments the process of gathering opinions across the service area,
especially among the underserved.
Tift Regional Medical Center, Community Health Needs Assessment 15
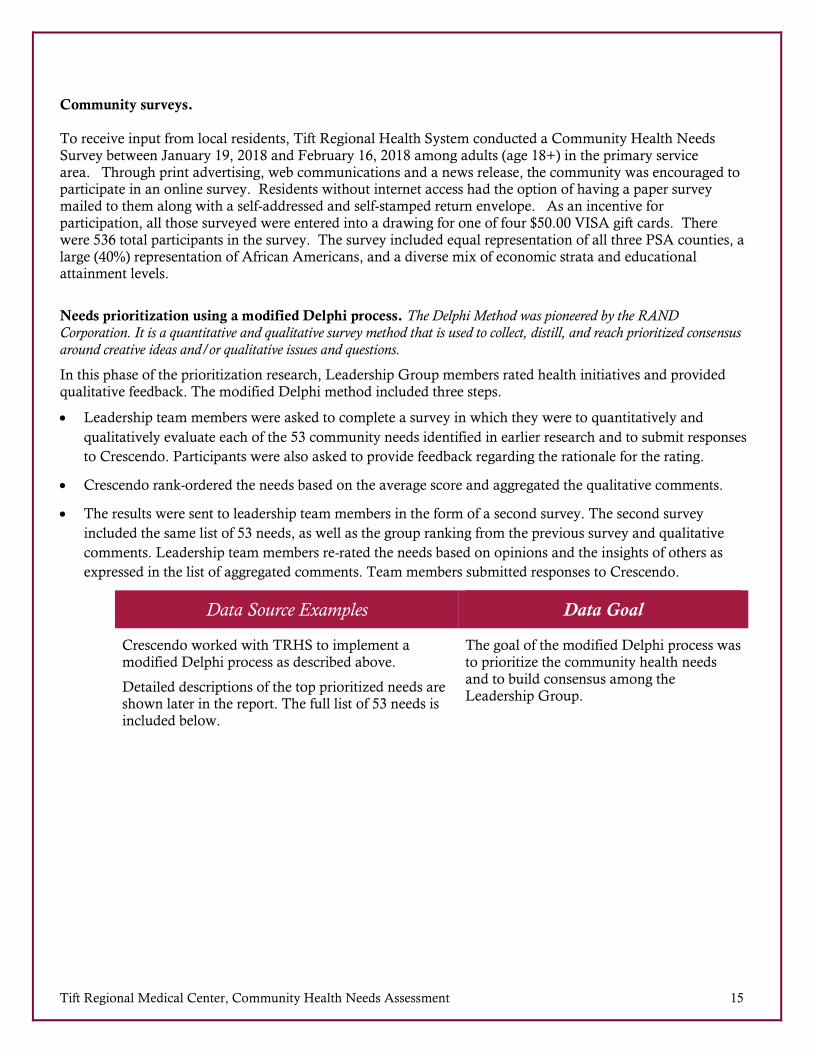
Community surveys.
To receive input from local residents, Tift Regional Health System conducted a Community Health Needs Survey between January 19, 2018 and February 16, 2018 among adults (age 18+) in the primary service area. Through print advertising, web communications and a news release, the community was encouraged to participate in an online survey. Residents without internet access had the option of having a paper survey mailed to them along with a self-addressed and self-stamped return envelope. As an incentive for participation, all those surveyed were entered into a drawing for one of four $50.00 VISA gift cards. There were 536 total participants in the survey. The survey included equal representation of all three PSA counties, a large (40%) representation of African Americans, and a diverse mix of economic strata and educational attainment levels.
Needs prioritization using a modified Delphi process. The Delphi Method was pioneered by the RAND Corporation. It is a quantitative and qualitative survey method that is used to collect, distill, and reach prioritized consensus
around creative ideas and/or qualitative issues and questions.
In this phase of the prioritization research, Leadership Group members rated health initiatives and provided qualitative feedback. The modified Delphi method included three steps.
• Leadership team members were asked to complete a survey in which they were to quantitatively and
qualitatively evaluate each of the 53 community needs identified in earlier research and to submit responses
to Crescendo. Participants were also asked to provide feedback regarding the rationale for the rating.
• Crescendo rank-ordered the needs based on the average score and aggregated the qualitative comments.
• The results were sent to leadership team members in the form of a second survey. The second survey
included the same list of 53 needs, as well as the group ranking from the previous survey and qualitative
comments. Leadership team members re-rated the needs based on opinions and the insights of others as
expressed in the list of aggregated comments. Team members submitted responses to Crescendo.
Data Source Examples Data Goal
Crescendo worked with TRHS to implement a modified Delphi process as described above.
Detailed descriptions of the top prioritized needs are shown later in the report. The full list of 53 needs is included below.
The goal of the modified Delphi process was to prioritize the community health needs and to build consensus among the Leadership Group.

Tift Regional Medical Center, Community Health Needs Assessment 16
Summary of 2017-2018 Prioritized Community Needs
Several methodologies were combined to develop a comprehensive and prioritized list of 2017-2018 community needs. A summary table of the top identified community needs is shown below with methodological details and processes described in a later section. The top needs fall into three, somewhat overlapping domains: Access to Care, System Capacity, and Care Coordination Services.
Prioritized Community Needs
Domain and Rank Health Need
Access to Care
1 • Transportation services for people needing to go todoctor’s appointments or the hospital
2 • Greater access to care for people with mental illness orsubstance use issues
3 • Affordability of prescription drugs and primary care
services
System Capacity
4 • Primary and specialty care providers: psychiatry,dementia spectrum issues, pediatrics, rheumatology,endocrinology, neurology
6 • Providers for population segments with unique culturesor needs: Spanish language services (primary care,specialized medicine, care coordination)
Care Coordination Services
5 • People with co-morbid or complex chronic conditions
7 • People with existing challenges of access to care (e.g.,homeless, Spanish speaking households, low socio-economic strata)
8 • People requiring behavioral health and medical /physical healthcare services (i.e., integrated care)
9 • Seniors - especially those with chronic conditions andthose with co-morbid behavioral health and medical /physical health issues

Crescendo Consulting Group 17
Community Needs Assessment Research Summary The following sections present results of the secondary research, primary quantitative research, and primary qualitative research. Major sub-sections include the following:
• Key Demographic and Economic Indicators for the 12 County Total Service Area
• Primary Service Area Data Focus
• Social and Physical Environment
• Health Status Profile
• Hospital Inpatient Discharge Data Patterns
• La Fiesta del Pueblo Festival Survey Highlights
• Patient, Community Stakeholder, Provider, and Staff Discussions
• Community Survey Results
• Health Issues Evaluated in the Modified Delphi Method (i.e., Prioritization)
• Implementation Strategy Considerations
“There aren’t too many places like Tifton and [Tift] County. I’ve lived here
almost all my life, and I’ve seen a lot of growth and change. The local culture
hasn’t changed much, though; it is one of the best, sweetest characteristics
about the area. It may also contribute to some of the health-related
challenges, too, though. More importantly, people are ready and willing to
roll up their sleeves and help people truly in need.”
– Leadership team member

Crescendo Consulting Group 18
Key Demographic and Economic Indicators Population, age, and disability status tend to drive the need for healthcare services while income,
education, and poverty level highly correlate to them. The following analysis of demographic factors such
as these highlights the growing need for healthcare services in the area, as well as identifies structural
causes of health care service usage.
As identified in the most recent 2010 U.S. Census, service area residents tend to have several
characteristics that heighten the urgency of developing a clear, proactive approach to meeting the health
needs in the service area. Relative to the current status and compared to key national and state of Georgia
averages, the service area has the following characteristics:
• Median age similar to Georgia state averages
• Lower median household incomes
• A lower degree of educational attainment
• Higher disability rates
Since 2000, Georgia has grown rapidly with most growth attributed to more urban areas of the state.
Within the TRMC service area, growth has been more moderate. The following demographic tables and
discussion present key data reflecting these summary points and highlight the impact on community
needs and the prioritization of issues.
Demographic Composition and Population Change Projections
The TRMC service area includes over a quarter of a million residents (262,825) with slightly more females
than males.
Population
Measure Total
Population
Total Male
Population
Total Female
Population
Tift 40,787 19,671 21,116
Turner 8,338 4,284 4,054
Cook 17,033 8,200 8,833
Atkinson 8,294 4,090 4,204
Ben Hill 17,477 8,349 9,128
Berrien 19,019 9,471 9,548
Coffee 43,003 21,980 21,023
Colquitt 46,024 22,869 23,155
Crisp 23,314 11,035 12,279
Irwin 9,408 4,798 4,610
Wilcox 8,972 5,252 3,720
Worth 21,156 10,208 10,948
PSA 66,158 32,155 34,003
SSA 196,667 98,052 98,615
Total Service Area 262,825 130,207 132,618
Georgia 10,006,693 4,883,331 5,123,362
• TRMC’s PSA population is concentrated in Tift County which makes up approximately two-thirds ofthe total PSA population.
• SSA population centers are located in Colquitt and Coffee Counties.

Crescendo Consulting Group 19
The state of Georgia saw extraordinary growth from 2000 to 2015 (+18.4%). However, the TRMC PSA
has seen modest (4.3%) growth since 2000. Higher growth was seen in the SSA.
Population Trends
Measure Total
Population
Population growth since
2000 Projected
growth 2020
Tift 40,787 4.5% 47,936
Turner 8,338 -6.0% 9,334
Cook 17,033 9.1% 18,295
Atkinson 8,294 10.1% 8,890
Ben Hill 17,477 0.9% 19,938
Berrien 19,019 18.8% 19,936
Coffee 43,003 13.2% 52,825
Colquitt 46,024 8.2% 55,209
Crisp 23,314 6.6% 25,383
Irwin 9,408 -4.0% 10,891
Wilcox 8,972 7.9% 9,655
Worth 21,156 -1.3% 2,515
PSA 66,158 4.3% 35,440
SSA 196,667 5.9% 32,786
Total Service Area 262,825 5.5% 33,454
Georgia 10,006,693 18.4% 12,189,252
U.S. 316,515,021 9.8% 334,500,000
• The fastest growth rates in the TRMC Total Service Area (TSA) were in the SSA counties of Berrien
(18.9%), Coffee (13.2%) and Atkinson (10.1).
The TRMC service areas have substantially greater poverty (and lower median household income) than the Georgia average.
Median Household Income and Poverty
Measure Median Household Income Percent Living Below 200% FPL
Tift $47,346 49.0%
Turner $38,177 50.9%
Cook $41,553 51.0%
Atkinson $38,011 58.2%
Ben Hill $36,250 58.6%
Berrien $42,017 51.3%
Coffee $41,968 53.9%
Colquitt $38,546 53.4%
Crisp $40,942 55.5%
Irwin $46,055 50.3%
Wilcox $41,466 52.5%
Worth $44,852 47.2%

Crescendo Consulting Group 20
Median Household Income and Poverty
Measure Median Household Income Percent Living Below 200% FPL
PSA $44,699 49.7%
SSA $40,858 53.4%
Total Service Area $41,825 52.4%
Georgia $59,410 38.9%
U.S. $66,011 34.3%
• All of the 12 PSA and SSA counties have poverty rates exceeding the Georgia average.
• Approximately one-third more people (by percentage) live below 200% of the FPL in service area counties than in the state as a whole.
The age of people in the TRMC PSA and SSA aggregately mirror the Georgia averages and are slightly below the U.S. total.
PSA and SSA Age-related Measures
Measure Median Age Percent 65 and older
Tift 35.1 13.6%
Turner 38.0 17.5%
Cook 36.7 14.3%
Atkinson 34.9 11.0%
Ben Hill 38.6 14.9%
Berrien 39.0 15.7%
Coffee 35.2 12.0%
Colquitt 35.5 13.6%
Crisp 38.4 14.9%
Irwin 39.0 16.3%
Wilcox 39.4 15.3%
Worth 40.4 16.3%
PSA 35.9 14.3%
SSA 37.2 14.1%
Total Service Area 36.9 14.2%
Georgia 35.9 11.9%
U.S. 37.6 14.1%
• Only one county in the PSA or SSA (i.e., Worth County) has a median age over 40.0 years.
• Seniors over age 65 comprise only about one-seventh of the population, but as with most U.S.
locations, is expected to slowly increase as Baby Boomers reach that age plateau.
Crescendo Consulting Group 21
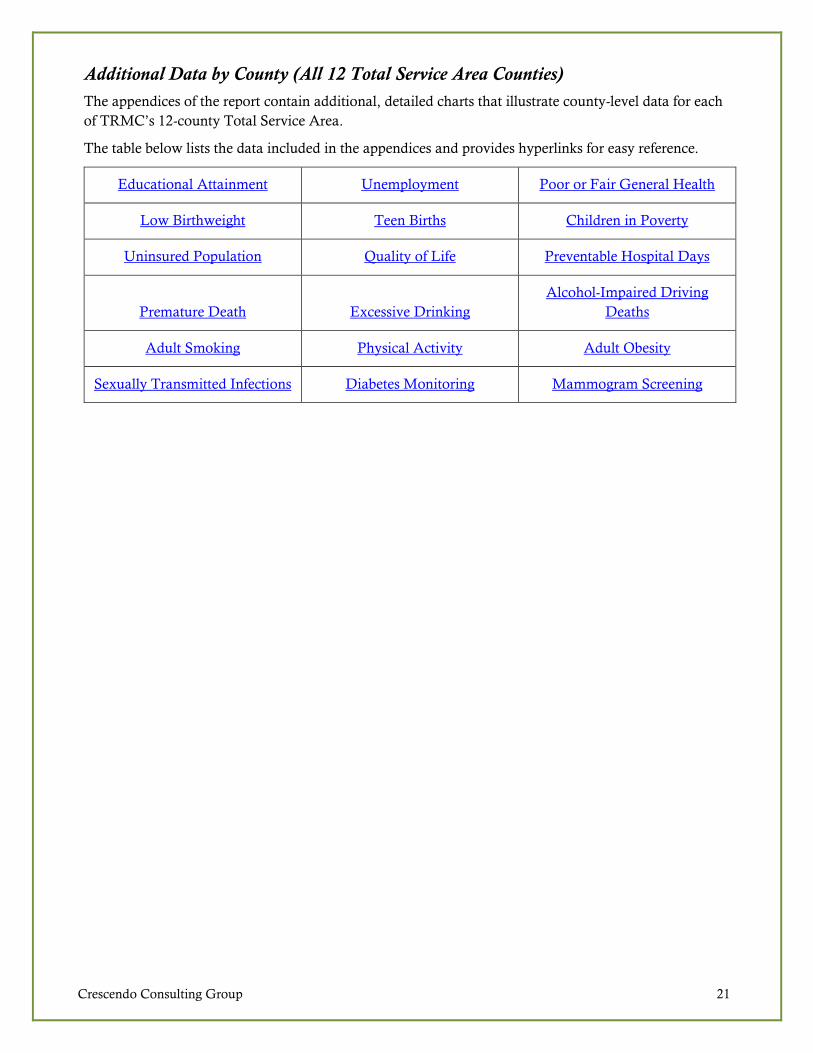
Additional Data by County (All 12 Total Service Area Counties)
The appendices of the report contain additional, detailed charts that illustrate county-level data for each
of TRMC’s 12-county Total Service Area.
The table below lists the data included in the appendices and provides hyperlinks for easy reference.
Educational Attainment Unemployment Poor or Fair General Health
Low Birthweight Teen Births Children in Poverty
Uninsured Population Quality of Life Preventable Hospital Days
Premature Death Excessive Drinking
Alcohol-Impaired Driving
Deaths
Adult Smoking Physical Activity Adult Obesity
Sexually Transmitted Infections Diabetes Monitoring Mammogram Screening

Crescendo Consulting Group 22
Primary Service Area Data Focus
Approximately 80% of TRMC’s patient volume lives in Tift, Turner, or Cook Counties – the Primary Service Area (PSA). The following tables present a deeper perspective of data defining the PSA.
Demographic and Community Profile Factors
There are approximately 65,000 people in the TRMC PSA
Population by Age Group
Tift Cook Turner Georgia United States
Total Population 40,787 17,033 8,338 10,006,693 316,515,021
Percent Under 5 years 7.1% 6.8% 6.5% 6.6% 6.3%
Percent 5 to 9 years 6.7% 7.5% 6.3% 7.0% 6.5%
Percent 10 to 14 years 6.9% 7.7% 6.4% 7.1% 6.5%
Percent 15 to 19 years 7.9% 7.4% 6.3% 7.1% 6.7%
Percent 20 to 24 years 7.6% 5.9% 6.2% 7.3% 7.1%
Percent 25 to 29 years 7.0% 6.1% 6.5% 7.3% 7.2%
Percent 30 to 34 years 6.1% 5.9% 5.6% 6.9% 6.9%
Percent 35 to 39 years 6.4% 6.5% 5.2% 6.9% 6.6%
Percent 40 to 44 years 5.8% 6.4% 4.8% 6.8% 6.2%
Percent 45 to 49 years 6.1% 6.4% 5.7% 7.1% 6.6%
Percent 50 to 54 years 6.1% 6.6% 6.2% 7.1% 6.9%
Percent 55 to 59 years 6.3% 6.4% 6.3% 6.7% 6.9%
Percent 60 to 64 years 5.7% 5.5% 5.5% 5.7% 6.2%
Percent 65 to 69 years 4.8% 5.5% 5.9% 5.0% 5.3%
Percent 70 to 74 years 3.6% 3.9% 4.9% 3.4% 3.7%
Percent 75 to 79 years 2.6% 2.9% 3.4% 2.3% 2.6%
Percent 80 to 84 years 1.8% 1.9% 2.3% 1.5% 1.9%
Percent 85 years and over 1.6% 1.4% 2.3% 1.4% 2.0%
• The Tift County area is large representations of major age groups that tend to have unique categories
of needs.
o Children age 19 and under (28.6%) often require preventive and early intervention
support.
o Young people and families of child-bearing years (ages 20 to 44) with lifestyle and
substance use challenges.
o Older adults and seniors 45 and over (38.6%,) who may require higher levels of chronic
condition and acute care support.
• Other PSA counties have a similar make-up.
Crescendo Consulting Group 23
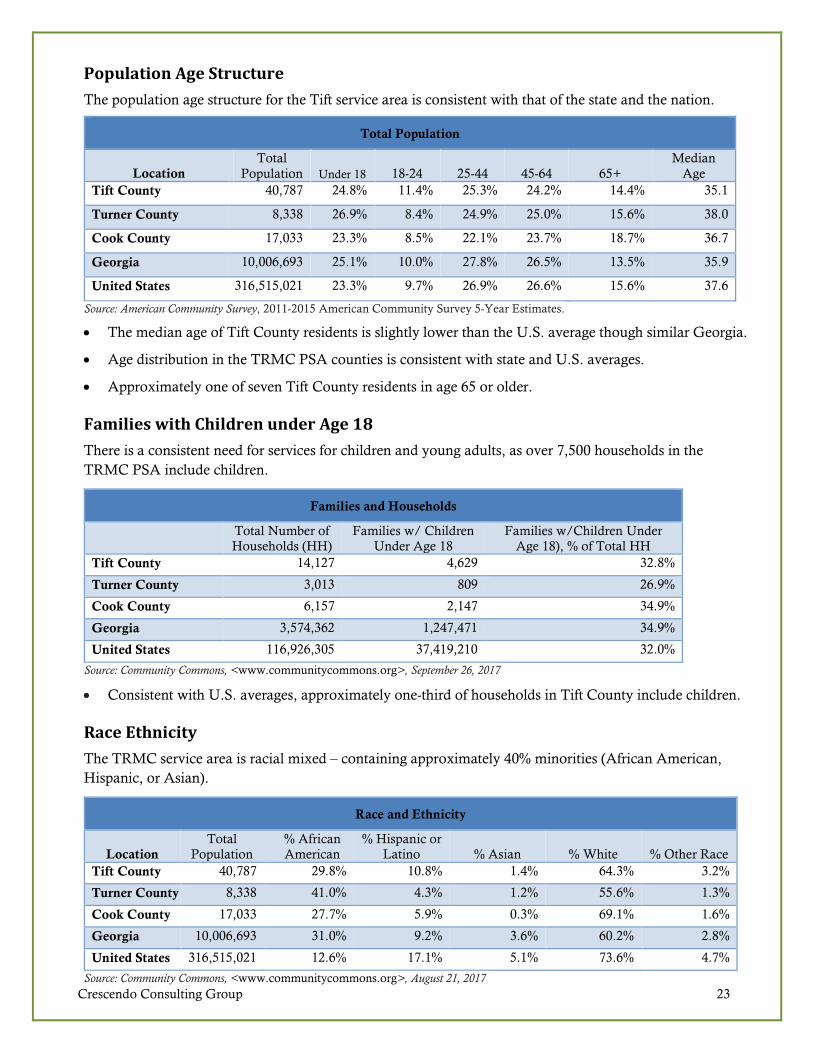
Population Age Structure
The population age structure for the Tift service area is consistent with that of the state and the nation.
Total Population
Location
Total
Population Under 18 18-24 25-44 45-64 65+
Median
Age
Tift County 40,787 24.8% 11.4% 25.3% 24.2% 14.4% 35.1
Turner County 8,338 26.9% 8.4% 24.9% 25.0% 15.6% 38.0
Cook County 17,033 23.3% 8.5% 22.1% 23.7% 18.7% 36.7
Georgia 10,006,693 25.1% 10.0% 27.8% 26.5% 13.5% 35.9
United States 316,515,021 23.3% 9.7% 26.9% 26.6% 15.6% 37.6
Source: American Community Survey, 2011-2015 American Community Survey 5-Year Estimates.
• The median age of Tift County residents is slightly lower than the U.S. average though similar Georgia.
• Age distribution in the TRMC PSA counties is consistent with state and U.S. averages.
• Approximately one of seven Tift County residents in age 65 or older.
Families with Children under Age 18
There is a consistent need for services for children and young adults, as over 7,500 households in the
TRMC PSA include children.
Families and Households
Total Number of
Households (HH)
Families w/ Children
Under Age 18
Families w/Children Under
Age 18), % of Total HH
Tift County 14,127 4,629 32.8%
Turner County 3,013 809 26.9%
Cook County 6,157 2,147 34.9%
Georgia 3,574,362 1,247,471 34.9%
United States 116,926,305 37,419,210 32.0%
Source: Community Commons, <www.communitycommons.org>, September 26, 2017
• Consistent with U.S. averages, approximately one-third of households in Tift County include children.
Race Ethnicity
The TRMC service area is racial mixed – containing approximately 40% minorities (African American,
Hispanic, or Asian).
Race and Ethnicity
Location
Total
Population
% African
American
% Hispanic or
Latino % Asian % White % Other Race
Tift County 40,787 29.8% 10.8% 1.4% 64.3% 3.2%
Turner County 8,338 41.0% 4.3% 1.2% 55.6% 1.3%
Cook County 17,033 27.7% 5.9% 0.3% 69.1% 1.6%
Georgia 10,006,693 31.0% 9.2% 3.6% 60.2% 2.8%
United States 316,515,021 12.6% 17.1% 5.1% 73.6% 4.7%
Source: Community Commons, <www.communitycommons.org>, August 21, 2017

Crescendo Consulting Group 24
Social and Physical Environment
Compared to state and national data, county level analyses of selected social and physical environment
characteristics highlight racial disparities especially in unemployment, income, and poverty. The following tables summarize these characteristics of the service area by county.
Unemployment – Civilian Population 16 and Older
Unemployment rates for individuals 16 years and older in Tift, Turner, and Cook Counties is slightly
higher than the rest of the state. Black residents are more than twice as likely than White residents to be
unemployed.
Employment
Labor Force Employed Unemployed Unemployment Rate
Tift County 18,372 17,283 1,089 5.9
Turner County 3,184 2,962 22 7.0
Cook County 7,509 7,059 450 6.0
Georgia 4,948,936 4,665,723 283,213 5.7
United States 161,376,737 152,992,568 8,384,169 5.2
Source: US Department of Labor, Bureau of Labor Statistics. July 2017. Source geography: County
Unemployment Rate by Race
There are significant unemployment disparities between races.
Unemployment by Race or Ethnic Group
Tift
County
Turner
County
Cook
County Georgia
United
States
White 4.6% 6.4% 5.7% 7.3% 7.1%
Black or African American 9.3% 19.8% 9.5% 14.7% 14.8%
Hispanic or Latino Origin 2.6% 5.0% 4.8% 8.2% 9.8%
Source: 2011-2015 American Community Survey 5-Year Estimates, United States Census Bureau. (2011-2015). S2301:
EMPLOYMENT STATUS. Retrieved from https://factfinder.census.gov/faces/nav/jsf/pages/index.xhtml
• Turner County has a slightly higher unemployment rate (7.0%) compared to Cook (6.0%) and Tift Counties (5.9%), and the state as a whole (5.7%).
• The five-year rate of unemployment for Black residents is nearly 20% in Turner County. It is also much higher than rate for Whites and Hispanics in other areas.

Crescendo Consulting Group 25
Poverty
The poverty rates in the PSA are higher than the poverty rates in the state. This health indicator is
particularly important because poverty can create and exacerbate barriers to accessing health services,
nutritious or healthy foods, and many other indicators that contribute to poor health status.
Poverty Levels
Individuals living below 50%, 100%, 185% and 200% of the Federal Poverty Level (FPL)
% Population (At or
Below 50% FPL)
% Population in
Poverty (Below 100%
FPL)
% Population in
Poverty (At or Below
185% FPL)
% Population (at or
Below 200% FPL)
Tift County 13.9% 29.3% 46.6% 49.0%
Turner County 13.3% 25.4% 47.8% 50.9%
Cook County 11.1% 25.1% 47.6% 51.0%
Georgia 8.3% 18.4% 36.0% 38.9%
United States 6.9% 15.5% 31.6% 34.3%
Data Source: US Census Bureau, American Community Survey. 2011-15. Source geography: Tract
• Residents living at or below 100% of the Federal Poverty Level in Tift County is about 11% points higher than the state as a whole.
Poverty Segmented By Race
Data Source: US Census Bureau, American Community Survey. 2011-15. Source geography: Tract
• Tift County’s Black/African American residents are twice as likely to be living in poverty than its
White residents.
• Similarly, 38.7% of Turner County’s Black/African American residents are living in poverty
compared to 14.7% of White residents.
• Statewide, the trend is similar.
Poverty Statistics by Race
White
Black or
African
American
Native
American
/ Alaska
Native Asian
Native Hawaiian
/ Pacific Islander
Some
Other
Race
Multiple
Race
Tift County 21.9% 44.9% 100.0% 17.5% 0% 31.2% 36.3%
Turner County 14.7% 38.7% 100.0% 0.0% No Data 100.0% 32.0%
Cook County 20.6% 35.1% 58.2% 54.0% No Data 62.2% 15.6%
Georgia 13.6% 26.7% 26.2% 13.67% 31.0% 34.2% 22.0%
United States 12.7% 27.0% 28.3% 12.57% 21.0% 26.5% 19.9%
Crescendo Consulting Group 26
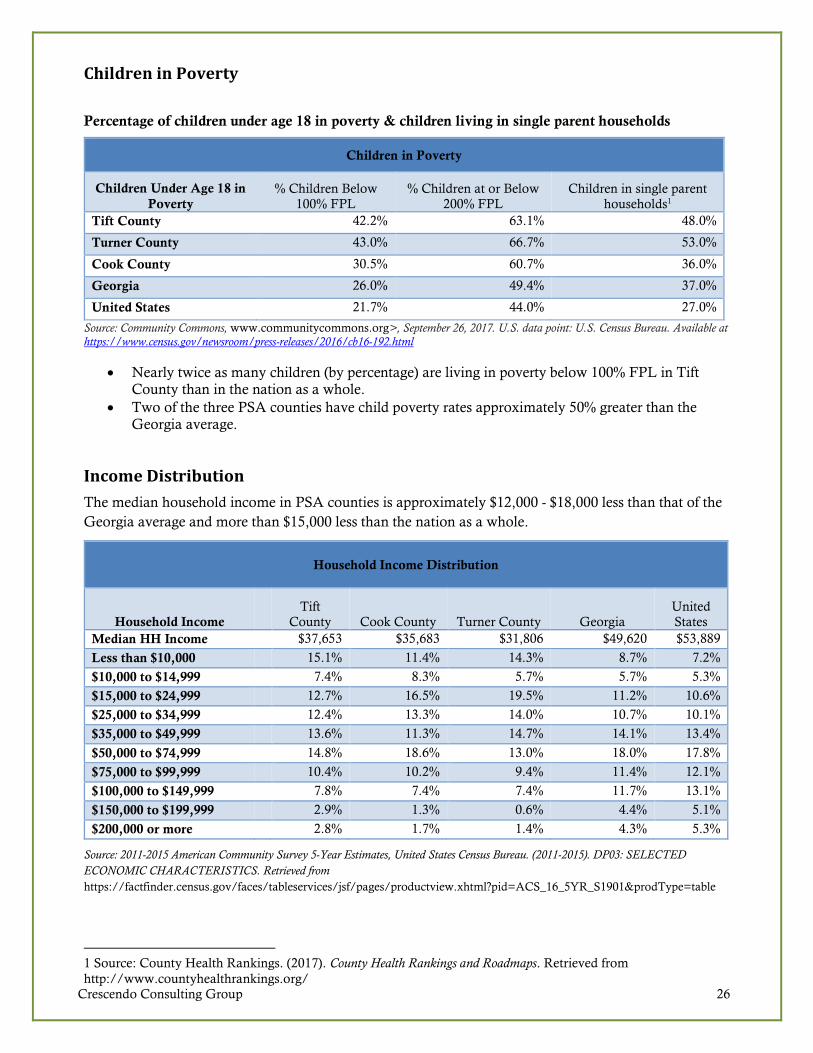
Children in Poverty
Percentage of children under age 18 in poverty & children living in single parent households
Children in Poverty
Children Under Age 18 in
Poverty
% Children Below
100% FPL
% Children at or Below
200% FPL
Children in single parent
households1
Tift County 42.2% 63.1% 48.0%
Turner County 43.0% 66.7% 53.0%
Cook County 30.5% 60.7% 36.0%
Georgia 26.0% 49.4% 37.0%
United States 21.7% 44.0% 27.0%
Source: Community Commons, www.communitycommons.org>, September 26, 2017. U.S. data point: U.S. Census Bureau. Available at https://www.census.gov/newsroom/press-releases/2016/cb16-192.html
• Nearly twice as many children (by percentage) are living in poverty below 100% FPL in Tift County than in the nation as a whole.
• Two of the three PSA counties have child poverty rates approximately 50% greater than the Georgia average.
Income Distribution
The median household income in PSA counties is approximately $12,000 - $18,000 less than that of the
Georgia average and more than $15,000 less than the nation as a whole.
Household Income Distribution
Household Income
Tift
County Cook County Turner County Georgia
United
States
Median HH Income $37,653 $35,683 $31,806 $49,620 $53,889
Less than $10,000 15.1% 11.4% 14.3% 8.7% 7.2%
$10,000 to $14,999 7.4% 8.3% 5.7% 5.7% 5.3%
$15,000 to $24,999 12.7% 16.5% 19.5% 11.2% 10.6%
$25,000 to $34,999 12.4% 13.3% 14.0% 10.7% 10.1%
$35,000 to $49,999 13.6% 11.3% 14.7% 14.1% 13.4%
$50,000 to $74,999 14.8% 18.6% 13.0% 18.0% 17.8%
$75,000 to $99,999 10.4% 10.2% 9.4% 11.4% 12.1%
$100,000 to $149,999 7.8% 7.4% 7.4% 11.7% 13.1%
$150,000 to $199,999 2.9% 1.3% 0.6% 4.4% 5.1%
$200,000 or more 2.8% 1.7% 1.4% 4.3% 5.3%
Source: 2011-2015 American Community Survey 5-Year Estimates, United States Census Bureau. (2011-2015). DP03: SELECTED
ECONOMIC CHARACTERISTICS. Retrieved from
https://factfinder.census.gov/faces/tableservices/jsf/pages/productview.xhtml?pid=ACS_16_5YR_S1901&prodType=table
1 Source: County Health Rankings. (2017). County Health Rankings and Roadmaps. Retrieved from
http://www.countyhealthrankings.org/

Crescendo Consulting Group 27
Educational Attainment
Educational attainment across the three PSA counties is lower than the state as a whole. The more rural
counties – Cook and Turner – are particularly challenged with regards to educational attainment.
Educational Attainment in the TRMC Service Area, 2016
Compared to Georgia and U.S. Rates
Educational Attainment
Tift
County
Cook
County
Turner
County PSA Georgia
United
States
PSA
Variance to
Georgia
(Percentage
Points)
Less than 9th grade 5.6% 7.2% 7.9% 6.3% 5.2% 5.6% 1.1%
9th to 12th grade, no diploma 13.2% 16.5% 16.6% 14.5% 8.9% 7.4% 5.6%
High school graduate (includes
equivalency)
34.5% 39.0% 36.5% 35.9% 28.1% 27.5% 7.8%
Some college, no degree 18.1% 16.6% 18.9% 17.8% 21.0% 21.0% -3.2%
Associate’s degree 11.2% 6.9% 7.8% 9.7% 7.4% 8.2% 2.3%
Bachelor’s degree 8.9% 8.6% 7.9% 8.7% 18.3% 18.8% -9.6%
Graduate or professional degree 8.6% 5.2% 4.3% 7.2% 11.1% 11.5% -3.9%
High school graduate or higher 81.2% 76.4% 75.4% 79.2% 85.8% 87.0% -6.6%
Bachelor’s degree or higher 17.5% 13.8% 12.3% 15.9% 29.4% 30.3% -13.5%
• Within the TRMC PSA, the percentage of persons aged 25 and older without a high school diploma (or equivalency) is higher than the state or the nation. This indicator is relevant because educational attainment is linked to positive health outcomes (Freudenberg Ruglis, 2007).
• Fewer than one in 11 PSA residents (8.7%) earned a Bachelor’s Degree – less than half of the
Georgia average rate (18.3%).
Even though educational attainment in the PSA trails state averages, it has improved since 2011.
Educational Attainment in the TRMC PSA
Trends: 2016 Compared to 2011
Educational Attainment 2012-2016 2007-2011
Change Since 2007-
2011
Less than 9th grade 6.3% 9.2% -2.9%
9th to 12th grade, no diploma 14.5% 16.7% -2.3%
High school graduate (includes equivalency) 35.9% 33.1% 2.8%
Some college, no degree 17.8% 19.1% -1.3%
Associate's degree 9.7% 7.5% 2.2%
Bachelor's degree 8.7% 8.2% 0.5%
Graduate or professional degree 7.2% 6.2% 0.9%
High school graduate or higher 79.2% 74.2% 5.0%
Bachelor's degree or higher 15.9% 14.5% 1.4%
• The percentage of adults age 25 and older with a high school diploma increased from 74.2% in
2011 to nearly 80% (79.2%) in 2016
• The percentage of adults with Associate’s or Graduate Degrees increased at a small rate.

Crescendo Consulting Group 28
Number of reported violent crime offenses per 100,000 population Overall, the rate of reported violent crime offenses in the two of the three TRMC PSA counties is high
when compared to the state as a whole.
Violent Crime Prevalence
Report Area Total Population Violent Crimes
Violent Crime Rate (Per
100,000 Pop.)
Tift County 40,787 264 647.3
Turner County 8,338 49 587.7
Cook County 17,033 38 223.1
Georgia 10,006,693 37,294 372.7
United States 316,515,021 1,213,859 383.5
Data Source: Federal Bureau of Investigation, FBI Uniform Crime Reports. Additional analysis by the National Archive of Criminal Justice Data. Accessed via the Inter-university Consortium for Political and Social Research. 2010-12. Source geography: County
• Tift County a has significantly higher rate of violent crime offenses compared to the state.
Healthy Eating, Physical Activity, and Overweight/Obesity
Food insecurity is defined by the USDA as a socioeconomic condition of limited or uncertain access to
enough food to support a healthy life. The USDA and Feeding America estimates that one in seven
Americans struggles to get enough to eat.
The fact that much of the TRMC PSA is on, or very near, a major transportation corridor (i.e., I-75) may
drive greater access to fast food than the state or the nation. These nutritional and food access outcomes
are important as they relate to obesity rates and other health risk factors like diabetes.
Access to Fast Food
Report Area
Total
Population
Number of
Establishments
Establishments,
Rate per 100,000 Population
Tift County 40,787 42 103.0
Turner County 8,338 8 95.9
Cook County 17,033 14 82.2
Georgia 10,006,693 7,747 77.4
United States 316,515,021 233,392 73.7
Data Source: US Census Bureau, County Business Patterns. Additional data analysis by CARES. 2015. Source geography:
County

Crescendo Consulting Group 29
The TRMC PSA counties have higher rates of obesity than the Georgia average – consistent with higher rates of poverty and less healthy eating habits.
Obesity and Healthy Lifestyle Activities
Measure
Tift
County
Cook
County
Turner
County
Georgia U.S.
Percentage of adults that report a BMI of 30 or more 34.0% 34.7% 31.1% 29.3% 27.5%
Percentage of adults aged 20 and over reporting no
leisure-time physical activity
26.6% 28.5% 25.7% 23.1% 21.8%
Source: Community Commons, "Build a Report". Available at https://www.communitycommons.org/maps-data/
• More than one-third of Tift County and Cook County adults has a BMI greater than 30.0 (the rate defining “obesity”).
• A high percentage of PSA -county residents report having no leisure time activity.
Low income people in Tift, Cook, and Turner Counties tend to have better access than other in Georgia
(on average).
Food Access
Total
Population
Low Income
Population
Low Income
Population with Low
Food Access
Percent Low Income
Population with Low
Food Access
Tift County 40,787 20,809 1,726 8.3%
Turner County 8,338 4,176 746 17.9%
Cook County 17,033 6,130 168 2.7%
Georgia 10,006,693 3,819,121 1,044,091 27.3%
United States 316,515,021 106,758,543 20,221,368 18.9%
Data Source: US Department of Agriculture, Economic Research Service, USDA - Food Access Research Atlas. 2015. Source
geography: Tract
• In Tift County, fewer than one in 11 low income people (8.3%) have low food access.
• In Cook County, nearly all low income people (all except 2.7%) have access to food.

Crescendo Consulting Group 30
Health Status Profile
Leading Causes of Death
According to the U.S. CDC2, the 12 leading causes of death in the U.S. are those listed to the right. Most of the mortality causes reflect the presence of chronic health conditions. Not that for the TRMC PSA, death rates per 100,000 population are higher than the Georgia average. In only two of the 12 measures – Kidney Disease and Hypertension – does the PSA have a lower incidence than the state.
Information learned in focus group discussions and secondary research suggest that lifestyle issues are highly correlated with chronic disease incidence – exacerbated (in some instances) by access to care issues of transportation,
poverty, language barriers, system capacity, and other issues.
Death Rates per 100,000 Population
2012-2016 Aggregated Data3
Cause of Death
Tift
County
Cook
County
Turner
County PSA Georgia
PSA Variance to the
Georgia Rate
Heart Disease 258.6 268.3 183.2 251.6 190.5 32.1%
Cancer 174.1 163.2 235.3 179.0 164.8 8.6%
Chronic Lower Respiratory
Disease
42.0 67.6 57.6 50.6 46.1 9.7%
Accidental Deaths 46.7 48.5 56.1 48.3 41.0 17.9%
Stroke 45.9 39.7 55.1 45.5 43.1 5.5%
Alzheimer's Disease 49.0 53.9 48.9 50.2 34.4 46.1%
Diabetes 37.9 22.6 NA 33.4 22.0 51.8%
Kidney Disease 14.6 28.4 NA 18.7 19.9 -6.2%
Septicaemia 13.4 23.5 NA 16.4 15.6 5.0%
Influenza and Pneumonia 15.1 26.7 NA 18.5 15.8 17.2%
Suicide 13.1 NA NA 13.1 12.5 4.8%
Hypertension 10.7 NA NA 10.7 11.6 -7.8%
• Heart disease death rates in the TRMC PSA are more than 30% higher than the Georgia average.
• Deaths due to Cancer or Chronic Lower Respiratory Disease occur with approximately 10% greater frequency in the PSA than the state average.
• Alzheimer’s Disease and Diabetes death rates are approximately 50% higher in the PSA than Georgia (average).
2 U.S. Centers for Disease Control and Prevention, CDC Wonder Database. Available at https://wonder.cdc.gov/. 3 For Heart Disease and Cancer, adequate data was available to use the most current (i.e., 2016) data only.
Most Common Causes of Death (2012-2016)
1. Heart Disease 2. Cancer 3. Chronic Lower Respiratory Disease 4. Accidental Deaths 5. Stroke 6. Alzheimer's Disease 7. Diabetes 8. Kidney Disease 9. Septicaemia 10. Influenza and Pneumonia 11. Suicide
12. Hypertension

Crescendo Consulting Group 31
Alcohol, Illicit Substance and Tobacco Use
Excessive alcohol consumption rates in Tift, Cook, and Turner Counties are lower than both the state
and national rates. Adolescent initiation to alcohol is the most common substance to be introduced for
this age group.
Alcohol Consumption
Total Population
Age 18
Estimated Adults
Drinking
Excessively
Estimated Adults
Drinking
Excessively
(Crude
Percentage)
Estimated Adults
Drinking
Excessively
(Age-Adjusted
Percentage)
Tift County 29,782 2,531 8.5% 8.8%
Turner County 6,624 No Data Suppressed Suppressed
Cook County 12,432 1,703 13.7% 13.9%
Georgia 7,121,933 982,827 13.8% 13.7%
United States 232,556,016 38,248,349 16.4% 16.9%
Data Source: Centers for Disease Control and Prevention, Behavioral Risk Factor Surveillance System. Accessed via the Health Indicators Warehouse. US Department of Health and Human Services, Health Indicators Warehouse. 2006-12. Source geography: County
• Excessive alcohol consumption rates among Tift County adults is substantially lower than the Georgia average.
• Overall, Georgia state rates are approximately 20% less than the U.S. rate.
Although marijuana and opioid use rates were not available at the county-level, anecdotal data, as well as
state of Georgia data indicate that opioid use is a rising problem in Tift County and the general TSA.
• Georgia’s annual opioid death rate increased approximately 30% from 2009 to 2015 – continuing to in crease in 2016 (1,394) and nearly 1,400 in 2017 (estimated).4
4 U.S. CDC. Available at https://www.cdc.gov/drugoverdose/data/statedeaths.html

Crescendo Consulting Group 32
Current Tobacco Users
The percent of Tift County residents who are regular cigarette smokers is slightly lower than the Georgia
and U.S. averages.
Tobacco Use
Total Population Age
18
Total Adults Regularly Smoking
Cigarettes
Percent Population Smoking
Cigarettes
Tift County 29,782 4,944 16.6%
Turner County 6,624 1,259 19.0%
Cook County 12,432 2,797 22.5%
Georgia 7,121,933 1,289,070 18.1%
United States 232,556,016 41,491,223 17.8%
• Cook County adults have a higher tobacco smoking rate than other PSA counties, the state of Georgia, and the U.S. average.
• There are approximately 9,000 adult users of tobacco in the TRMC PSA.

Crescendo Consulting Group 33
General Health
TRMC PSA-county residents report poorer general health and slightly poorer mental health compared to
the Georgia average.
Self-Reported Health Status
Area
Self reported
general health
(Percentage of
adults reporting fair
or poor health)
Average number of
physically unhealthy
days reported in past
30 days (age-
adjusted)
Percentage of adults
reporting 14 or more
days of poor mental
health per month
Percentage of
population
without adequate
social/emotional
support
Tift County 22.00% 4.6 14.00% 21.20%
Cook County 22.00% 4.6 14.00% suppressed
Turner County 21.00% 4.5 14.00% 29.60%
Georgia 17.00% 3.7 13.00% 20.70%
United States 17.80% 3.6 14.0% 20.70%
Data Source: Kaiser Family Foundation, Available at https://www.kff.org/other/state-indicator/percent-of-adults-reporting-fair-or-poor-health-status/?currentTimeframe=0&selectedRows=%7B%22wrapups%22:%7B%22united-states%22:%7B%7D%7D%7D&sortModel=%7B%22colId%22:%22Location%22,%22sort%22:%22asc%22%7D; Centers for Disease Control and Prevention, Behavioral Risk Factor Surveillance System. Accessed via the Health Indicators Warehouse. US Department of Health and Human Services, Health Indicators Warehouse. 2006-12. Source geography: County. Available at http://www.countyhealthrankings.org/app/georgia/2018/measure/outcomes/145/data
• The percentage who self-assess health status as “poor or fair” is 4.2 percentage points (24%) higher than the U.S. rate.
• The percentage of the PSA-county population reporting 14 or more days of poor mental health is approximately equal to the state average. However, one of seven adults report struggling with the issue.
Maternal and Child Health: Infant Mortality
The rate of infant mortality in Tift County in the period from 2011 to 2016 was higher than the national rate.
Infant Mortality
Total Births Total Infant Deaths
Infant Mortality Rate
(Per 1,000 Births)
Tift County 3,315 29 8.8
Turner County 670 5 6.9
Cook County 1,255 14 11.0
Georgia 716,420 5,445 7.6
United States 20,913,535 136,369 6.5
Data Source: US Department of Health and Human Services, Health Resources and Services Administration, Area Health Resource File. 2011-16. Source geography: County
• The rate of infant mortality in Cook County is nearly twice that of the U.S. average. However, given the small sample size (i.e., 1,255 births), the data must be considered directional but not statistically significant.

Crescendo Consulting Group 34
Access to Healthcare Providers
With the one exception of primary care providers in Tift County, the availability of PCPs, dentists, and
mental health providers in Tift, Cook, and Turner Counties lags Georgia and U.S. averages.
Healthcare Provider Capacity
Primary Care
Total
Population
PCPs per
100,000 Pop.
Dentists per
100,000 Pop.
Mental Health
Providers per
100,000
Population
Percent Adults
Without Any
Regular Doctor
(PCP)
Tift County 40,787 108.1 39.3 51.5 24.3%
Turner County 8,338 36.8 24.4 NA No Data
Cook County 17,033 58.1 29.2 34.8 18.5%
Georgia 10,006,693 72.9 49.2 121.2 26.1%
United States 316,515,021 87.8 65.6 202.8 22.1%
Data Source: Source: Community Commons, "Build a Report". Available at https://www.communitycommons.org/maps-data/; Data Source: Centers for Disease Control and Prevention, Behavioral Risk Factor Surveillance System. Additional data analysis by CARES. 2011-12. Source geography: County
• Tift County report having more PCPs per capita than other reporting areas.
• Even with relatively strong number of PCPs, nearly one of four (24.3%) of Tift County residents is without a PCP.
• The number of dentists per 100,000 population in TRMC PSA-counties is much lower than state and U.S. averages.
• The PSA service area counties have fewer than half of the mental health providers per 100,000 than the Georgia average and only about 20% of the U.S. average.
Communicable Diseases Infection rates of Sexually Transmitted Disease (e.g., chlamydia) in the Tift, Cook, and Turner Counties is above the U.S. average.
Sexually Transmitted Diseases
Total
Population
Total
Chlamydia
Infections
Chlamydia
Infection Rate (Per
100,000 Pop.)
Gonorrhea
Infection Rate (Per
100,000 Pop.)
Population with
HIV / AIDS, Rate
(Per 100,000 Pop.)
Tift County 40,787 247 605.6 100.5 331.3
Turner County 8,338 66 791.6 36.0 345.9
Cook County 17,033 80 469.7 88.1 261.7
Georgia 10,006,693 51,607 515.7 137.6 512.7
United States 316,515,021 1,441,789 455.5 110.6 353.2
Data Source: US Department of Health and Human Services, Health Indicators Warehouse. Centers for Disease Control and Prevention, National Center for HIV/AIDS, Viral Hepatitis, STD, and TB Prevention. 2014; US Department of Health & Human Services, Health Indicators Warehouse. Centers for Disease Control and Prevention, National Center for HIV/AIDS, Viral Hepatitis, STD, and TB Prevention. 2013. Available at https://assessment.communitycommons.org/CHNA/report?page=6&id=616&reporttype=libraryCHNA
Crescendo Consulting Group 35
• The rate of chlamydia infections in Tift County is about 20% higher than the Georgia and U.S.
averages.
• Gonorrhea rate in the three TRMC PSA counties are lower than state and U.S. averages.
• HIV rates are lower than the state average, but given the health, community, and financial impact of HIV/AIDS, this remains an important indicator.
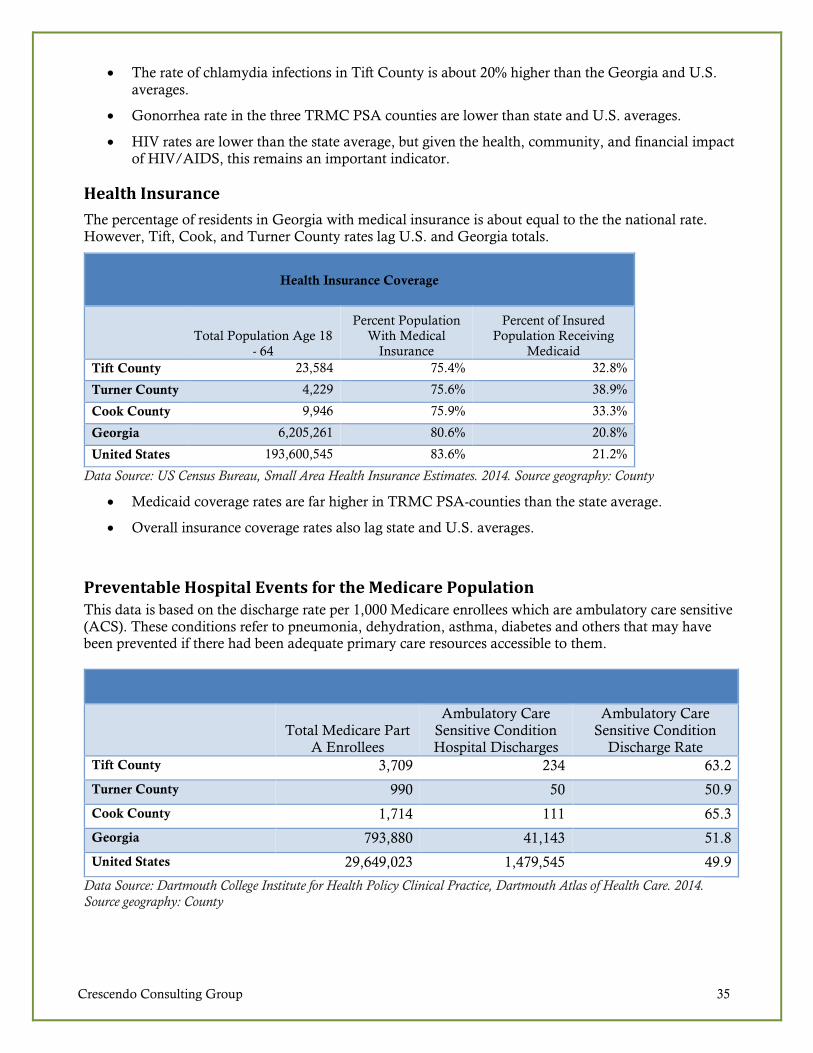
Health Insurance
The percentage of residents in Georgia with medical insurance is about equal to the the national rate. However, Tift, Cook, and Turner County rates lag U.S. and Georgia totals.
Health Insurance Coverage
Total Population Age 18
- 64
Percent Population
With Medical
Insurance
Percent of Insured
Population Receiving
Medicaid
Tift County 23,584 75.4% 32.8%
Turner County 4,229 75.6% 38.9%
Cook County 9,946 75.9% 33.3%
Georgia 6,205,261 80.6% 20.8%
United States 193,600,545 83.6% 21.2%
Data Source: US Census Bureau, Small Area Health Insurance Estimates. 2014. Source geography: County
• Medicaid coverage rates are far higher in TRMC PSA-counties than the state average.
• Overall insurance coverage rates also lag state and U.S. averages.
Preventable Hospital Events for the Medicare Population This data is based on the discharge rate per 1,000 Medicare enrollees which are ambulatory care sensitive (ACS). These conditions refer to pneumonia, dehydration, asthma, diabetes and others that may have been prevented if there had been adequate primary care resources accessible to them.
Total Medicare Part A Enrollees
Ambulatory Care Sensitive Condition Hospital Discharges
Ambulatory Care Sensitive Condition
Discharge Rate
Tift County 3,709 234 63.2
Turner County 990 50 50.9
Cook County 1,714 111 65.3
Georgia 793,880 41,143 51.8
United States 29,649,023 1,479,545 49.9
Data Source: Dartmouth College Institute for Health Policy Clinical Practice, Dartmouth Atlas of Health Care. 2014. Source geography: County

Crescendo Consulting Group 36
Hospital Inpatient Discharge Data Patterns
By reviewing the hospital discharge data (only de-identified patient data), it can be determined that distance from the hospital has a tremendous impact on patients’ ability or willingness to seek care. The data in the following table includes the most common 10 diagnosis codes given to patients discharged from TRMC in 2016. Percentages represent the average “likelihood index” for people living in zip code areas “Near TRMC Hospitals” and for those “Further Away from TRMC Hospitals.” .
The Index is computed by dividing the percentage of diagnoses from each zip code by the zip code population (as
a percent of the total service area. For example,
Total number of Essential (primary) hypertension diagnoses: 56,456 Total number of Essential (primary) hypertension diagnoses in areas Near TRMC Hospitals 45,404 Percent of Essential (primary) hypertension diagnoses in areas Near TRMC Hospitals 72.67% Population of the total zip code population used for the analysis 220,004
Population of Essential (primary) hypertension diagnoses in areas Near TRMC Hospitals 90,476 Percent of Essential (primary) hypertension population in areas Near TRMC Hospitals 41.12% Index of diagnosis area to population 177% [Note the first number in the table below]
Service Use Indices Based on Transportation Patterns5
Diagnosis
Areas (by Zip Code) Near TRMC
Hospitals
Areas (by Zip Code) Further Away from TRMC Hospitals
Essential (primary) hypertension 177% 54%
Other long term (current) drug therapy 173% 49%
Type 2 diabetes mellitus without complications 188% 51%
Hyperlipidemia, unspecified 195% 51%
Nicotine dependence, cigarettes, uncomplicated 182% 43%
Encounter for screening mammogram for malignant
neoplasm of breast
187% 54%
Personal history of nicotine dependence 176% 52%
Gastro-esophageal reflux disease without esophagitis 181% 55%
Urinary tract infection, site not specified 180% 47%
Anemia, unspecified 164% 53%
• The above analysis shows that people living in zip code areas nearer to TRMC hospitals are three to four time more likely to seek hospital services than others.
• An index of 100.0% would indicate that, on a per capita basis, people in a particular area are seeking services at a rate proportionate with the population.
5 “Near TRMC Hospitals” includes the following zip code areas: 31620, 31637, 31639, 31647, 31714, 31733,
31749, 31774, 31775, 31783, 31790, 31793, 31794, 31795;
“Further Away from TRMC Hospitals” includes the following zip code areas: 31015, 31533, 31622, 31632, 31650,
31750, 31768, 31771, 31781, 31788, 31789, 31791.

Crescendo Consulting Group 37
La Fiesta del Pueblo Festival Survey Highlights
During the Autumn 2017 La Fiesta del Pueblo Festival, TRMC staff members and others conduct
intercept surveys among 127 Festival attendees. The short survey helped to quantify festival-goers’
medical care service use habits, the degree to which they seek care when needed, and perceptions about
the most urgent health needs in the area. Summary highlights are shown below, and the full set of
frequency tables is contained in the Appendix.
• Most Festival attendees (54.0%) go to the doctor’s office when they need basic medical care.
However, nearly one in five (19.4%) say that they go to the hospital emergency room – a
generally high-cost, low efficiency alternative.
Q1. Where do you go when you need basic medical care?
Answer Percent of Respondents
Doctor's office 54.0%
Clinic or urgent care facility 23.4%
Hospital Emergency Room 19.4%
I do not get care even when I
need it
3.2%
• Many Festival goers do not seek care when needed.
o Nearly half of survey respondents (47%) indicated that there were times in the past year
when they needed medical help but chose not to seek it. In most cases (40.4%), those
who chose not to seek care made the decision due to lack of finances.
o The primary reasons why those needing care did not seek it relate to access issues –
transportation or “no doctors near me” (19.3%), language barriers (15.8%), or
inconvenient hours of provider service (17.5%).
Q2. In the past 12 months, have there been times when you needed medical help but chose NOT to seek it?
Q3. If YES, why did you NOT get care?
No 53%
40.4%
17.5%
15.8%
10.5%
8.8%7.0%
Yes 47%
Did not have the money
Doctors or clinic not open at a
convenient timeDoctor might not know my
language; difficult to communicateNo doctors or clinics near me; too
far awayHad no transportation to get to the
doctor or clinicSomething else

Crescendo Consulting Group 38
• Among respondents, approximately 20% to 30% indicated that “… A LOT more” services are required to meet demands for substance use, mental health, dentistry, primary care, and specialized medical care.
Q4. How would you rate the need for healthcare services … in the area?
Health Services Need Percent saying,
"We need A LOT more."
Substance use treatment services 29.5%
Mental health services 26.7%
Dentistry 23.0%
Basic Primary Care 19.0%
Specialized care providers 18.3%
See the Appendices for a more complete presentation of associated data tables.

Crescendo Consulting Group 39
Patient, Community Stakeholder, Provider, and Staff Discussions
Patients and community members joined discussion groups or participated in one-to-one interviews as
part of the community health needs assessment. Members were recruited in person by office staff and by
phone. The communications to the patients and community explained that the meeting was an important
step in the assessment process in that helps identify opportunities for community health improvement
over the next few years.
The patient discussions used a formal interview guide (see Appendix) that covered participants’ broad
perceptions of health and narrowed into what they saw as the biggest health problems facing the
community.
Additionally, Crescendo conducted one-on-one telephonic interviews with a diverse group of community
stakeholders to provide additional perspective on key topics. TRMC provided Crescendo with names and
contact information for interview subjects. Call duration varied by participant but were approximately 15-
20 minutes in length.
Many of the Leadership Group members were highly active in local healthcare and/or had personal
interests which allowed them to maintain insightful and unique perspectives. During group meetings,
they spoke about the most critical community health needs and their impact – particularly as they relate
to activities where TRMC may be able to contribute.
Broad Dimensions of Health
Although there is a sample bias in the selection of patients, they universally had positive things to say
about their TRMC services and the community, in general.
“Transportation is a critical factor. Especially for a rural area, we have a pretty good range of
services. However, that doesn’t mean [anything] if you can’t get to the doctor’s appointment
because you don’t have a car and there is no bus.”
“I’ve lived here forever. I see a lot of people – lots of Spanish-speaking residents – who either
struggle with the language or they are scared that someone will think that they are an illegal
immigrant. Either way, it results in them not getting highly needed services. Then when
something goes really bad, they wind up in the hospital ER, and – usually the taxpayers – wind
up payer ten times what it would have cost to get them preventive care! It doesn’t make sense.
We need more Spanish-speaking docs.”
“Healthcare reimbursement is a crap shoot. If you have health insurance, your deductible and co-
pay are so high that you can’t afford to go to the doctor for relatively minor things – though these
are things that may WELL get worse! If you are coming from low socio-economic strata, you’re
statistically more likely to need care, but you’ve got Medicaid. Crazy though, most preventive
care is not on Medicaid. But if you’re on Medicaid, even a really small co-pay may be enough to
keep you from care. Ugh! Don’t even ask me about the people in the middle – they are [facing
intense financial challenges] if they want care. The people with money can always get care in Tift
County. If you don’t have the resources, and you can’t get the medicine to keep you healthy.”

Crescendo Consulting Group 40
Health Problems and Contributing Factors
There is a great deal of consensus in regard to most of the health needs in the area – especially mental
health care. There appeared to be the varying levels of interest in substance abuse treatment, but many
recognized that things such as the opioid crisis (though not currently a major issue) may soon become
urgent. Although some participants indicated that “drugs and alcohol is an issue with everyone” others
had very little energy around the topic. Conditions that patients listed as some of the biggest health
problems included (in order):
• Access to primary care and specialized medical care.
• Transportation.
• Mental health and substance abuse.
• Access to care for Spanish-speaking residents.
• Lack of exercise, poor diets, and smoking.
• Diabetes, pre-diabetes, nutrition.
Not surprisingly, participants also pointed to generational, social, and cultural influences as key
contributing factors in the persistence of poor health:
• The generational high impact of poverty.
“It’s tough to break the cycle [of poverty]. Sometime, they are truly bad parents, but most parents
try hard to provide a good life for their kids. It is difficult, though, when you as a parent, either
did not have a good role model or you don’t have the faculties to figure it out. Unless you are
really fortunate, you will wind up passing along an ‘absence of aspirations’ to your kids.”
“Some older people have to decide whether to pay for food or medicine.”
• Cultural issues often impact healthy behaviors.
“We are true Southerners! I love this place! We make a lot of our own problems sometimes,
though. I love the food here; you will never go away from my kitchen hungry … maybe a couple
pounds heavier, but never hungry. The down side of that is that we have people we love dying at
62 years old because of heart disease, diabetes, or general obesity. That said, I can’t imagine how
anyone would ever change how we live. It’s a big challenge.”

Crescendo Consulting Group 41
Solutions and Suggested Interventions
When asked if community members feel there are services to address the problems mentioned,
Leadership Group members spoke highly of existing services, but suggested ways to improve delivery.
“What we really need is a mobile service van that can travel to high-need areas including the
Spanish-speaking ones, and provide dental and primary care services.”
“Tift Region’s doctors advocate for senior citizens by helping with a million different community
service programs. Other providers don’t care for poor people as much.”
“The Care Coordination capability is the best kept secret in town. Care coordination is a
relatively low-cost way to prevent chronic disease patients from showing up in my hospital as
often. When they do [show up at the hospital], I’ll take good care of them, but I’d rather not see
them at all unless it is for a well-check. Care coordinators keep the high-risk patients healthier
and they provide preventive care, too, sometime. Some even provide those wrap-around services
that everyone [i.e., patients] needs, but no one can afford.”
“An advocate [i.e., care coordinator] even helped get me coupons from the drug company.”
“Co-locating social workers or other counselors in the emergency department makes a lot of sense
because a high percentage of ED patients have mental health issues. Having an onsite counselor
will help the throughput of the ED, provide more effective patient care, and I can’t help but think
that it will lower the overall cost of care.”
“Senior citizens are an integral part of our culture and institutional heritage here in Tifton. The
obvious issue is that they have recurring medical needs. The piece often overlooked is the mental
health piece. Loneliness, dementia, age-related disabilities, transportation, health and wellness; as
a society and a community, we owe it to these folks to stand up with them. You know what?
Before you can turn around twice, you’ll be one of them!”
Participants were very insightful both in terms of understanding the challenges to improving personal
health and methods to outreach to new people.
“Changes need to come from within our community. The best role – and a necessary role – for a
consultant is to bring an outside perspective and help US guide OUR work. I’m pleased that [the
CHNA consultant] has done just that! It would absolutely not work if you come into a
community and tell them they’re wrong.”
“To make changes in the community, Tift [Regional Hospital] needs to spend time getting to
know people – really learning how to empathize with them.”
“Some people just don’t want to go to the doctor. That attitude is a little higher with African
Americans, Spanish speakers, and the obese.”
“Please help us figure out how to educate [doctors] who don’t understand in the inner parts of
what the patient needs [i.e., the psychological or motivational interviewing-style piece]. People
need encouragement, and they need their doctors to help them figure out what will truly motivate
them to change unhealthy behaviors.”
“Our churches are very important. It would be great if the hospital could work with them to
improve health and wellness in our community. Just by doing so, you’d likely let folks know that
the hospital can help them when they’re sick, too. You can have a health day at church.”
Crescendo Consulting Group 42
“Get the Tift doctors and nurses, and – especially – the administrators out in the community!
They would do a great job, and they have a lot of good things to tell people. Most importantly,
with this opioid thing on the increase, make services more top-of-mind.”
“It would be helpful if there was an easier way to find healthcare providers – especially in an
emergency. Mental health problems might be the worst. If you or a family member is suicidal,
you can’t afford to wait 30 days for an appointment. There needs to be a mental health triage or
urgent care facility.”
Although there are good number of clinics and urgent care facilities in the area, community participants
noted concerns about quality, access and insurance. Insurance barriers appeared top of mind in some of
the discussions.
“You [TRMC] don’t treat me any differently because I’m on Medicaid.”
“Insurance makes a big difference in healthcare.”
“It shouldn’t be based on insurance whether you can take care of your health.”
Leading Challenges
When asked to note the leading health challenges in their community, there were several consensus areas
consistent with patient observations:
• Access to providers
Stakeholders frequently commented that access to care can be a challenge. Comments suggest
that accessibility to providers varies by specialty and geographic area, but also represents a
general problem.
“We have a need for urgent care and specialized medicine. Our population is older than other
areas where I’ve worked, and the biggest health problem is the emergency care. Having an
Urgent Care facility with longer hours rather than sending them in an ambulance to the ER
would be a big help.”
“It is difficult to find a doctor taking new patients. When you do find one, sometimes the
response is, ‘Hmmm, I wonder why no one else wants to go see this doctor.’ Usually though, any
patient is delighted to find any doctor taking new patients.”
“Access to healthcare is the greatest need. TRMC has a great opportunity.”
“There are no specialists in the area – neurology, rheumatology, and others. You need to go to
Atlanta.”
“I have no trouble getting in to see my PCP, but sometimes the wait time to see specialists is
long.”
“If you need a drug detox facility, you’re in trouble. I think that the jail is the biggest de facto
detox facility around here. We really need help here, too.”
• Prevalence – and management - of chronic health conditions
Among the stakeholders, the prevalence and management and certain chronic health conditions,
such as heart disease, diabetes, and hypertension were identified as important issues facing the
community. Several mentioned that either they or a family member (or both) had experience with
one or more of these conditions, and it was recognized that better lifestyle habits and better

Crescendo Consulting Group 43
management of these chronic health conditions could make a big difference in the health of the
community.
“I think if diabetes could be controlled that would help with the other conditions.”
“Diabetes and pre-diabetes are very prevalent. Any time we propose grants we must include
nutritional value of food. Improving the areas nutrition is our goal.”
“I have high blood pressure and I’m pretty young. I understand that it’s sometimes a challenge to
manage chronic health conditions, which is a factor in heart disease.”
“I’m a diabetic; I’m better with a level-headed presentation of what I can do to help myself. You
need to understand where people are and don’t expect them to pick of the fine details of what to
do from an on-line presentation. I have a physician now – they give me options for me; in the last
3 months I’ve lost 28 pounds; they don’t give me needless information.”
“Early intervention is the key, start with the young people – catch them early and avoids skeptical
“Heart disease and diabetes are the greatest health problems in the Pee-Dee.”
• Poverty and social isolation
“The Pee-Dee is one of the highest poverty areas in the state. There are no big businesses that
can support these social programs.”
“As bad as this sounds, we have a very poor population base and 54% of the population is
African-American; power people can be forgotten. And as they age people get more skeptical
about seeing doctors. They don’t understand the importance of early intervention.”
• Poor nutrition and physical activity
Several noted that poor nutrition and lack of physical activity are important problems in the
community.
“One of the biggest problems is diet. ’If you can fry it, we’ll eat it’ is the approach around here.”
“Take away fried food. Health is not a primary concern at the dinner table. We need to do a
better job telling people you can invest in your future by taking care of how you eat and exercise.”
• Communications between community groups While none of the stakeholders noted any challenges in communication between community
groups per se, two identified a need for better communication and/or education with community
members about available services in the area, particularly services to support lifestyle changes
(e.g., nutrition, exercise) and public transportation services.
• Services for the aging population Services for the aging population were perceived as lacking by one stakeholder.
“The problem is the demographics. The population is decreasing overall. But 65+ is growing and
under 18 is decreasing. The area doesn’t have enough physicians to handle the geriatric crowd, who
require more care than a 30-year-old.”
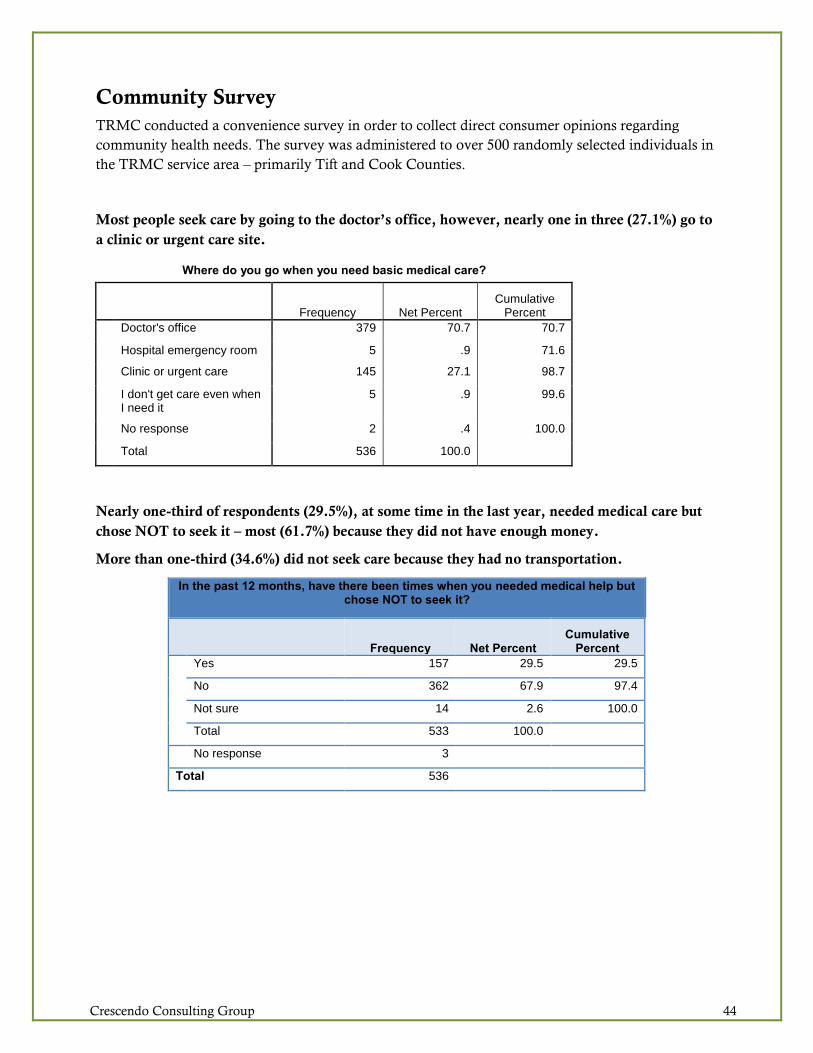
Crescendo Consulting Group 44
Community Survey
TRMC conducted a convenience survey in order to collect direct consumer opinions regarding
community health needs. The survey was administered to over 500 randomly selected individuals in
the TRMC service area – primarily Tift and Cook Counties.
Most people seek care by going to the doctor’s office, however, nearly one in three (27.1%) go to
a clinic or urgent care site.
Where do you go when you need basic medical care?
Frequency Net Percent
Cumulative Percent
Doctor's office 379 70.7 70.7
Hospital emergency room 5 .9 71.6
Clinic or urgent care 145 27.1 98.7
I don't get care even when I need it
5 .9 99.6
No response 2 .4 100.0
Total 536 100.0
Nearly one-third of respondents (29.5%), at some time in the last year, needed medical care but
chose NOT to seek it – most (61.7%) because they did not have enough money.
More than one-third (34.6%) did not seek care because they had no transportation.
In the past 12 months, have there been times when you needed medical help but chose NOT to seek it?
Frequency Net Percent Cumulative
Percent Yes 157 29.5 29.5
No 362 67.9 97.4
Not sure 14 2.6 100.0
Total 533 100.0
No response 3
Total 536
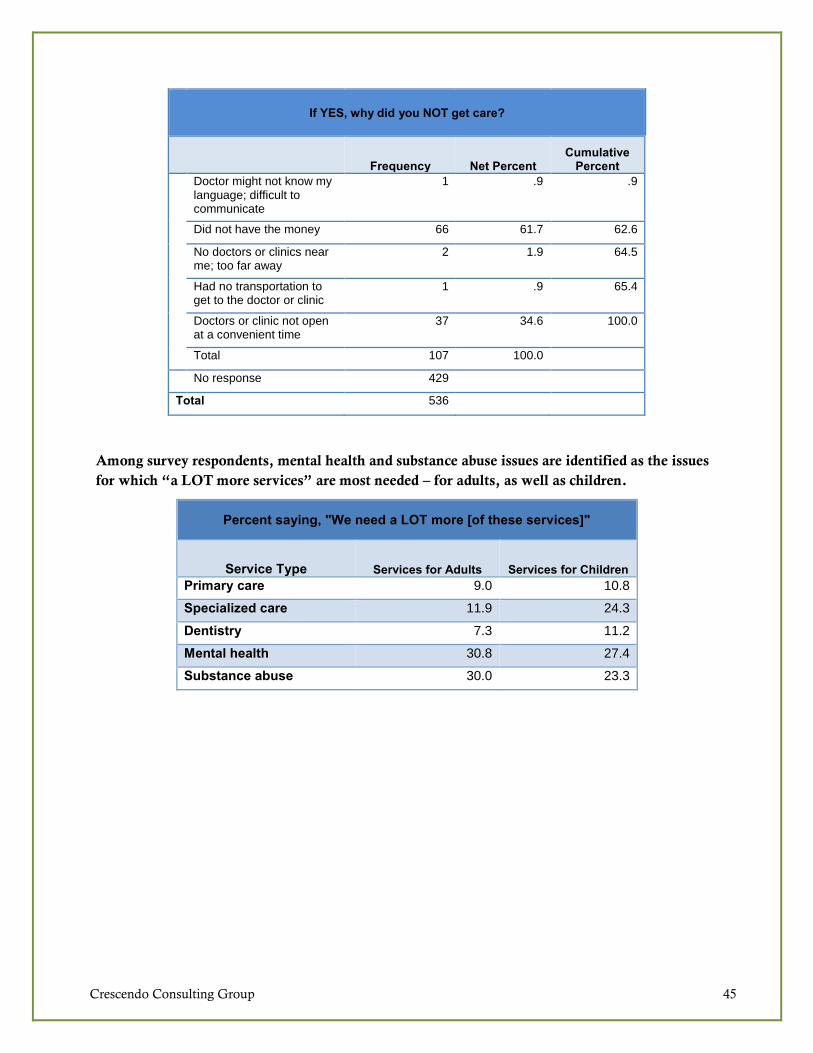
Crescendo Consulting Group 45
If YES, why did you NOT get care?
Frequency Net Percent Cumulative
Percent Doctor might not know my
language; difficult to communicate
1 .9 .9
Did not have the money 66 61.7 62.6
No doctors or clinics near me; too far away
2 1.9 64.5
Had no transportation to get to the doctor or clinic
1 .9 65.4
Doctors or clinic not open at a convenient time
37 34.6 100.0
Total 107 100.0
No response 429
Total 536
Among survey respondents, mental health and substance abuse issues are identified as the issues
for which “a LOT more services” are most needed – for adults, as well as children.
Percent saying, "We need a LOT more [of these services]"
Service Type Services for Adults Services for Children Primary care 9.0 10.8
Specialized care 11.9 24.3
Dentistry 7.3 11.2
Mental health 30.8 27.4
Substance abuse 30.0 23.3

Crescendo Consulting Group 46
Social media is identified as the best way to communicate with service area residents. Note, though,
that among people age 45 and older, Facebook and other forms of social media are somewhat less
popular.
In regards to information about Tift Regional’s providers and services, what is the best way to connect with you as a consumer?
Type of Communication Best way
Second best way
Third best way Total
Facebook or other social media site 22.4 16.0 10.6 49.1
Mailer 17.4 15.1 13.6 46.1
Word of mouth 13.8 9.7 15.9 39.4
Television commercial 13.8 12.5 10.4 36.8
Print advertisement (such as newspaper or magazine ad) 4.5 9.1 8.4 22.0
Community event 3.9 4.7 9.0 17.5
Web advertisement with a link to our website 6.2 5.8 5.4 17.4
News media story 3.9 6.2 6.9 17.0
Physician referral 3.4 5.8 6.7 15.9
Google search / website 5.4 5.8 3.9 15.1
Radio commercial 2.4 3.7 4.1 10.3
Billboard .6 4.1 4.1 8.8
Among people 45 and older, mailers, television commercials, and word of mouth (as well as
social media) are preferred communications modalities.
In regards to information about Tift Regional’s providers and services, what is the best way to connect with you as a consumer?
Survey respondents age 45 and older
Type of Communication Best way
Second best way
Third best way Total
Mailer 22.6% 14.6% 15.9% 53.1%
Facebook or other social media site 13.7% 15.3% 11.1% 40.1%
Television commercial 15.8% 13.9% 8.8% 38.4%
Word of mouth 14.7% 8.5% 15.2% 38.4%
Print advertisement (such as newspaper or magazine ad) 6.5% 12.2% 7.8% 26.5%
News media story 4.8% 7.5% 9.5% 21.7%
Community event 4.8% 6.1% 10.1% 21.0%
Web advertisement with a link to our website 5.8% 4.7% 5.7% 16.3%
Physician referral 3.8% 6.1% 6.4% 16.3%
Google search / website 4.8% 4.4% 2.7% 11.9%
Radio commercial 2.4% 3.7% 3.0% 9.2%
Billboard 0.3% 3.1% 3.7% 7.1%
NOTE: The appendices contain a full set of frequency tables for the Community Survey.

Crescendo Consulting Group 47
Health Issues Evaluated in the Modified Delphi Method Through leadership team discussions, healthcare consumer surveys, interviews with other
community stakeholders, and secondary research, 53 community health needs were identified. In
order to develop a ranked list, leadership team members were asked to rate each of the needs on a 5-
point scale (with 1 = the greatest need). The community needs which were evaluated, are contained
in the table below in alphabetical order. A prioritized list of needs – the results of the research – is
shown afterwards.
Health Issues Evaluated in the Modified Delphi Method
Community Needs Listed Alphabetically
Access to primary care physician services
Access to specialty care physician services
Affordable healthcare services
Affordable prescription medications
Autism spectrum and other learning disabilities – early detection and treatment
Behavioral health services for adults for depression, anxiety, or other mental health conditions other than
substance abuse
Cancer – Care coordination
Cancer – Diagnosis and treatment
Cancer – Education and prevention
Cancer – Screening
Care coordination for people with multiple co-morbid conditions
Children’s health – behavioral health services
Children’s health – primary care services
Children’s health – specialized care services
Dementia spectrum services for Alzheimer’s, Parkinson’s Disease, Lewy Body dementia, and others
Dental health services for children and adults
Diabetes – Care coordination
Diabetes – Diagnosis and treatment
Diabetes – Education and prevention
Diabetes – Screening
Domestic or intimate partner violence counseling or intervention
End of life issues (including palliative care)
Heart disease – Care coordination
Heart disease – Diagnosis and treatment
Heart disease – Education and prevention
Heart disease – Screening
Home health services such as Visiting Nurses or other in-home care

Crescendo Consulting Group 48
Health Issues Evaluated in the Modified Delphi Method
Community Needs Listed Alphabetically
Homeless services (healthcare for the homeless)
Hypertension treatment and related services
Nutrition and healthy eating education
Obesity – Care coordination
Obesity – Diagnosis and treatment
Obesity – Education and prevention
Obesity – Programs to help with self-management
Pain management services
Respiratory health / pulmonology education and services
Rheumatology and other arthritis services
Seniors’ health services – Care coordination
Seniors’ health services – Diagnostic and treatment
Sexually transmitted disease education, screening, and treatment
Smoking cessation services
Spanish language - Primary care services
Spanish language - Care coordination or other services to improve access to care and utilization
Spanish language - Specialized care services (e.g., diabetes care, cardiology, etc.)
Stroke prevention and care
Substance abuse – Care coordination
Substance abuse – Education and prevention
Substance abuse – Intervention and treatment
Substance abuse – Screening
Transportation services for people needing to go to doctor’s appointments or the hospital
Wellness initiatives for adults – exercise and nutrition
Wellness initiatives for children – exercise and nutrition
Women's health – comprehensive gynecology and reproductive care for women in all stages of life
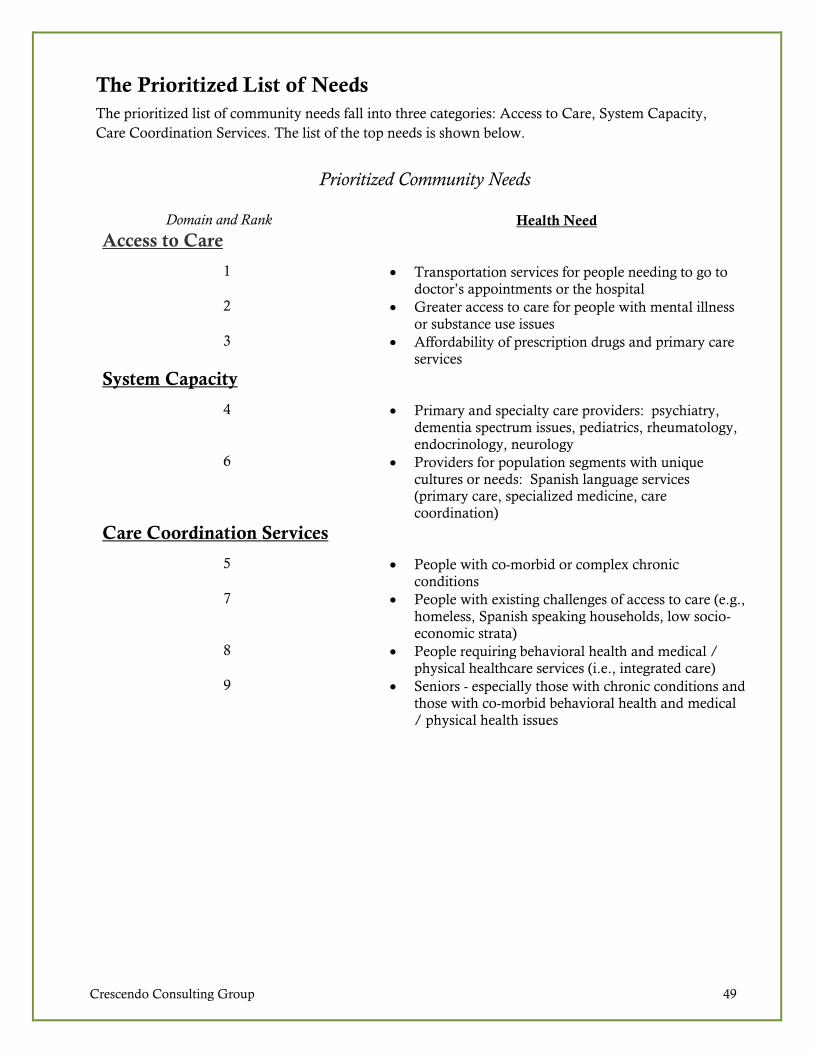
Crescendo Consulting Group 49
The Prioritized List of Needs
The prioritized list of community needs fall into three categories: Access to Care, System Capacity,
Care Coordination Services. The list of the top needs is shown below.
Prioritized Community Needs
Domain and Rank Health Need
Access to Care
1 • Transportation services for people needing to go to doctor’s appointments or the hospital
2 • Greater access to care for people with mental illness or substance use issues
3 • Affordability of prescription drugs and primary care services
System Capacity
4 • Primary and specialty care providers: psychiatry, dementia spectrum issues, pediatrics, rheumatology, endocrinology, neurology
6 • Providers for population segments with unique cultures or needs: Spanish language services (primary care, specialized medicine, care coordination)
Care Coordination Services
5 • People with co-morbid or complex chronic
conditions 7 • People with existing challenges of access to care (e.g.,
homeless, Spanish speaking households, low socio-economic strata)
8 • People requiring behavioral health and medical / physical healthcare services (i.e., integrated care)
9 • Seniors - especially those with chronic conditions and those with co-morbid behavioral health and medical / physical health issues
Crescendo Consulting Group 50
Implementation Strategy Considerations As noted above, the Community Leadership members (with the guidance and support of Chris
Efaw, CFO) indicated that ongoing strategies which address high priority community health issues effectively encourage continued engagement of diverse community leaders while simultaneously addressing several needs identified in the CHNA. There is particular interest in global strategies and initiatives that do the following:
• Accelerate efforts to provide mobile or co-located chronic disease and specialize medical care.
• Continue successful programs currently in operation, e.g. obesity, heart disease, and mental health programs.
• Evaluate and (if appropriate) develop new or modified programs to address needs identified in the 2017-2018 CHNA – especially those that target sub-populations in the highest risk sections of the service area (e.g., Spanish speaking areas).
• Consider programs designed to strengthen the family unit and encourage healthy lifestyles. This
may include continuing and/or increased partnership with faith-based groups.
These broad-based implementation strategies address many of the prioritized community health needs,
including but not limited to the following:
• Improving access to care, which includes behavioral health and substance abuse services.
• Providing education, communications, and enhanced information exchange.
• Addressing chronic diseases and related issues.
• Supporting obesity, wellness, and preventive services.
• Engaging integrated care, where possible?
Implementation strategies will be developed and communicated under separate cover. The document will identify which community needs the hospital will not address (and state why not) and the ones that it will address (and strategies for doing so).

Crescendo Consulting Group 51
Appendices
Appendix A: Leadership and Community Discussion Guide
Appendix B: La Fiesta del Pueblo Survey Instrument
Appendix C: Appendix C: La Fiesta del Pueblo Festival Survey Frequency Tables
Appendix D: Additional Data by County (All 12 Total Service Area Counties)
Appendix E: Existing Healthcare Resources and Facilities
Crescendo Consulting Group 52
Appendix A: Leadership and Community Discussion Guide
Tift Regional Medical Center
Community Health Needs Assessment
Stakeholder Interview Guide

Crescendo Consulting Group 53
Stakeholder Interview Discussion Guide
Introduction
• Introduction,and thank you. I’m ____________ . Thank you for taking the time to speak with
me.
• Explain the general purpose of the discussion. As we discussed, the purpose of this discussion is to
learn more about community health-related needs and available resources, and to collect
your insights regarding service gaps. We will also discuss the broader range of needs –
medical, social, mental health and substance abuse, and others.
• Seek participant’s honest thoughts and opinions. We’re looking for your honest feedback—this
includes both positive and negative insights and comments.
CURRENT INVOLVEMENT AND EXPERIENCE IN THE COMMUNITY
1. [FOR AGENCY INTERVIEWS] Would you please tell me a little bit about the organization
you represent and the populations you work with?
o PROBES: What is your role in your organization or in community health, in general?
2. We’ve been framing the discussions in the focus group with the CDC’s definition of
“community health” which says that… “community (or public) health is a dynamic state of
complete physical, mental, spiritual, and social well-being and not merely the absence of disease
or infirmity. … [That which] we as a society do collectively to assure the conditions in which
people can be healthy.”
o PROBE: Do you think that this way of thinking about community health also applies to
how you define health (why or why not)?
3. There are several ways to think about health and healthcare: (1) services provided in the
community, (2) access to those services including continuity of care, (3) subpopulations facing
particular challenges, (4) operational efficiency including the degree to which providers work
together and integrated care.
Based on the the populations that you serve, in any of these ways, what are the three greatest
health issues or needs including but not limited to medical, social, mental health and substance
abuse, and others?
o PROBE: How do the populations you work with understand their own health? How
about help seeking behaviors? What are the barriers to seeking out help or treatment?
4. Now I’m going to go over the list of health, mental health, and substance abuse focus areas. I’d
like to spend a few minutes and get your insights about ones that require more focus and attention,
target populations currently underserved and/or vulnerable, more specific conditions or needs
within the more general focus areas where there may be service gaps, and others.
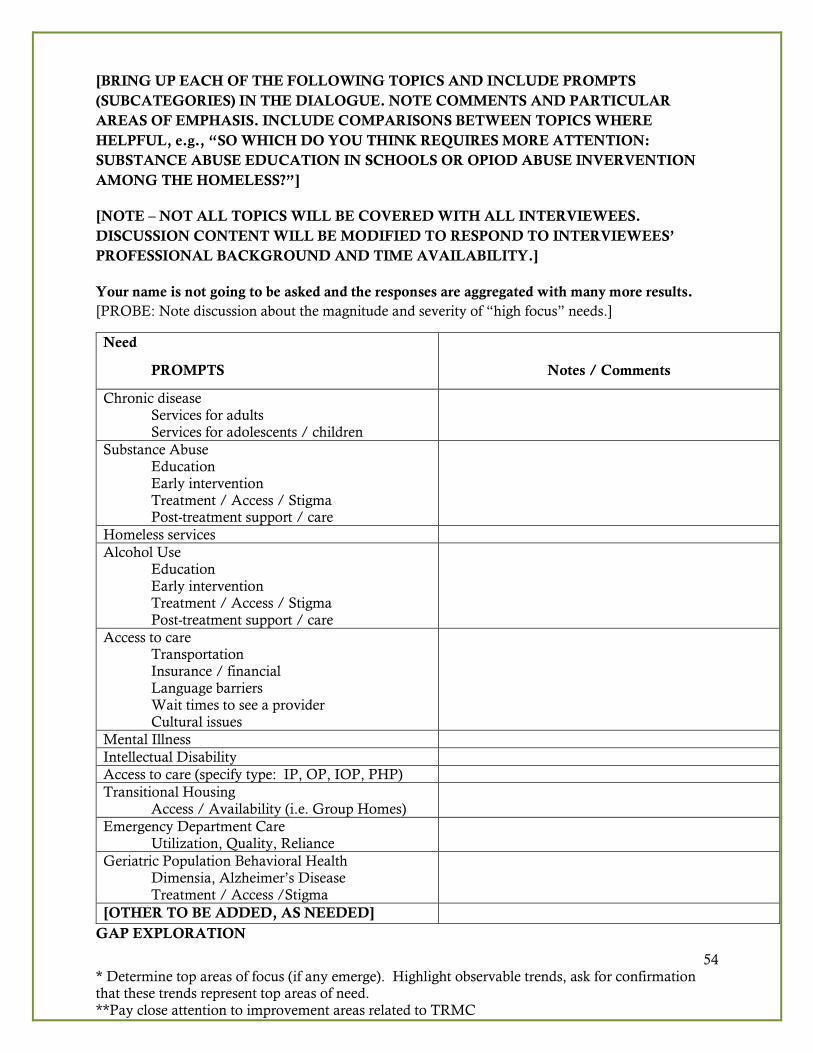
54 * Determine top areas of focus (if any emerge). Highlight observable trends, ask for confirmation that these trends represent top areas of need. **Pay close attention to improvement areas related to TRMC
[BRING UP EACH OF THE FOLLOWING TOPICS AND INCLUDE PROMPTS
(SUBCATEGORIES) IN THE DIALOGUE. NOTE COMMENTS AND PARTICULAR
AREAS OF EMPHASIS. INCLUDE COMPARISONS BETWEEN TOPICS WHERE
HELPFUL, e.g., “SO WHICH DO YOU THINK REQUIRES MORE ATTENTION:
SUBSTANCE ABUSE EDUCATION IN SCHOOLS OR OPIOD ABUSE INVERVENTION
AMONG THE HOMELESS?”]
[NOTE – NOT ALL TOPICS WILL BE COVERED WITH ALL INTERVIEWEES.
DISCUSSION CONTENT WILL BE MODIFIED TO RESPOND TO INTERVIEWEES’
PROFESSIONAL BACKGROUND AND TIME AVAILABILITY.]
Your name is not going to be asked and the responses are aggregated with many more results.
[PROBE: Note discussion about the magnitude and severity of “high focus” needs.]
GAP EXPLORATION
Need
PROMPTS Notes / Comments
Chronic disease Services for adults Services for adolescents / children
Substance Abuse Education Early intervention Treatment / Access / Stigma Post-treatment support / care
Homeless services
Alcohol Use Education
Early intervention Treatment / Access / Stigma Post-treatment support / care
Access to care Transportation Insurance / financial Language barriers Wait times to see a provider Cultural issues
Mental Illness
Intellectual Disability
Access to care (specify type: IP, OP, IOP, PHP)
Transitional Housing
Access / Availability (i.e. Group Homes)
Emergency Department Care Utilization, Quality, Reliance
Geriatric Population Behavioral Health Dimensia, Alzheimer’s Disease Treatment / Access /Stigma
[OTHER TO BE ADDED, AS NEEDED]

Crescendo Consulting Group 55
Now I would like to speak a little about the ways to better meet community health needs.
5. What are the critical challenges to better serving the target populations?
o PROBE: Are there perceived gaps in services or overlapping services?
o PROBE: Are there community health needs that aren’t being considered by service providers
that SHOULD be? Why have they not been traditionally considered related to community
health?
6. [“SILOS” vs “COOPERATIVE EFFORTS” ISSUE] You’ve done a good job naming community
health needs and gaps. To what degree is it helpful for groups to work cooperatively on projects, or is
it better if they work independently? Why or why not? What is the key to being able to work
collaboratively?
7. Regarding the needs and gaps that we’ve discussed, where do you think TRMC could make an
impact? Why? How?
Closing
8. Finally, if you had a magic wand, what health, mental health, or substance abuse needs would you
address?
o PROBE: Why?
Thank You! 9. Thank you for your time, the information you provided today is a vital part of the process and
something that will help to highlight how Tift Regional Medical Center can elevate its care to its
patients and community.
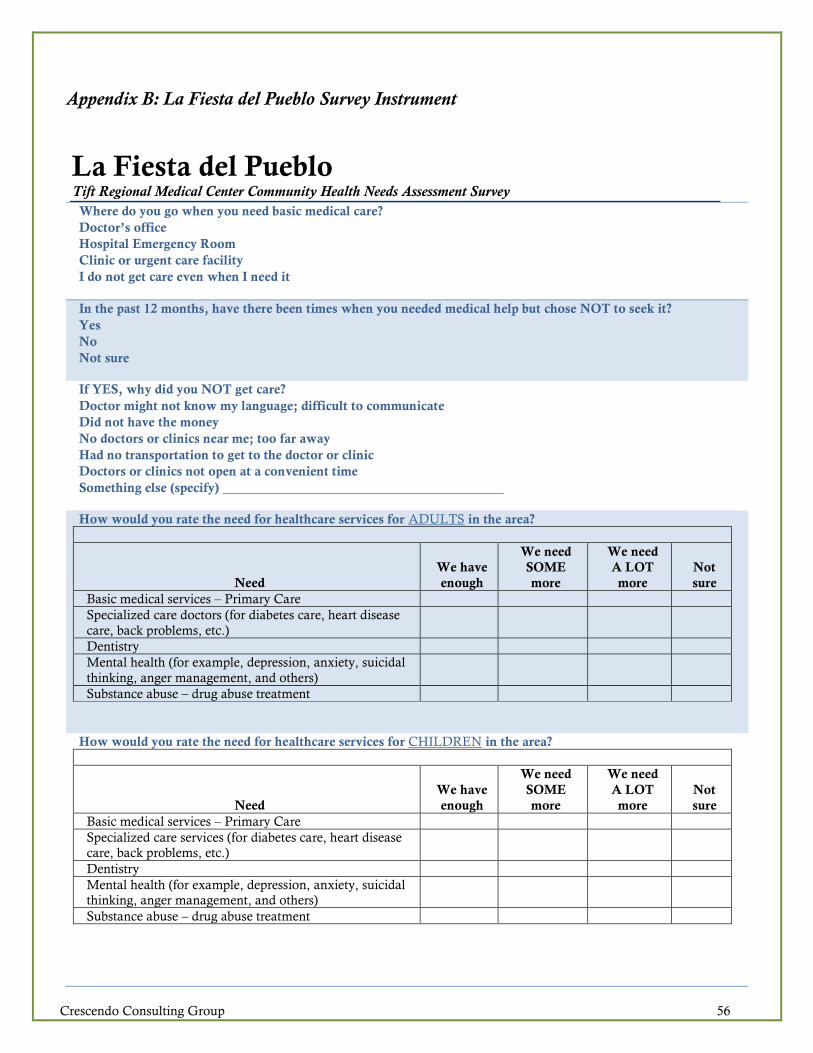
Crescendo Consulting Group 56
Appendix B: La Fiesta del Pueblo Survey Instrument
La Fiesta del Pueblo Tift Regional Medical Center Community Health Needs Assessment Survey
Where do you go when you need basic medical care?
• Doctor’s office
• Hospital Emergency Room
• Clinic or urgent care facility
• I do not get care even when I need it
In the past 12 months, have there been times when you needed medical help but chose NOT to seek it?
• Yes
• No
• Not sure
If YES, why did you NOT get care?
• Doctor might not know my language; difficult to communicate
• Did not have the money
• No doctors or clinics near me; too far away
• Had no transportation to get to the doctor or clinic
• Doctors or clinics not open at a convenient time
• Something else (specify)
How would you rate the need for healthcare services for ADULTS in the area?
Need
We have
enough
We need
SOME
more
We need
A LOT
more
Not
sure
Basic medical services – Primary Care
Specialized care doctors (for diabetes care, heart disease
care, back problems, etc.)
Dentistry
Mental health (for example, depression, anxiety, suicidal
thinking, anger management, and others)
Substance abuse – drug abuse treatment
How would you rate the need for healthcare services for CHILDREN in the area?
Need
We have
enough
We need
SOME
more
We need
A LOT
more
Not
sure
Basic medical services – Primary Care
Specialized care services (for diabetes care, heart disease
care, back problems, etc.)
Dentistry
Mental health (for example, depression, anxiety, suicidal
thinking, anger management, and others)
Substance abuse – drug abuse treatment
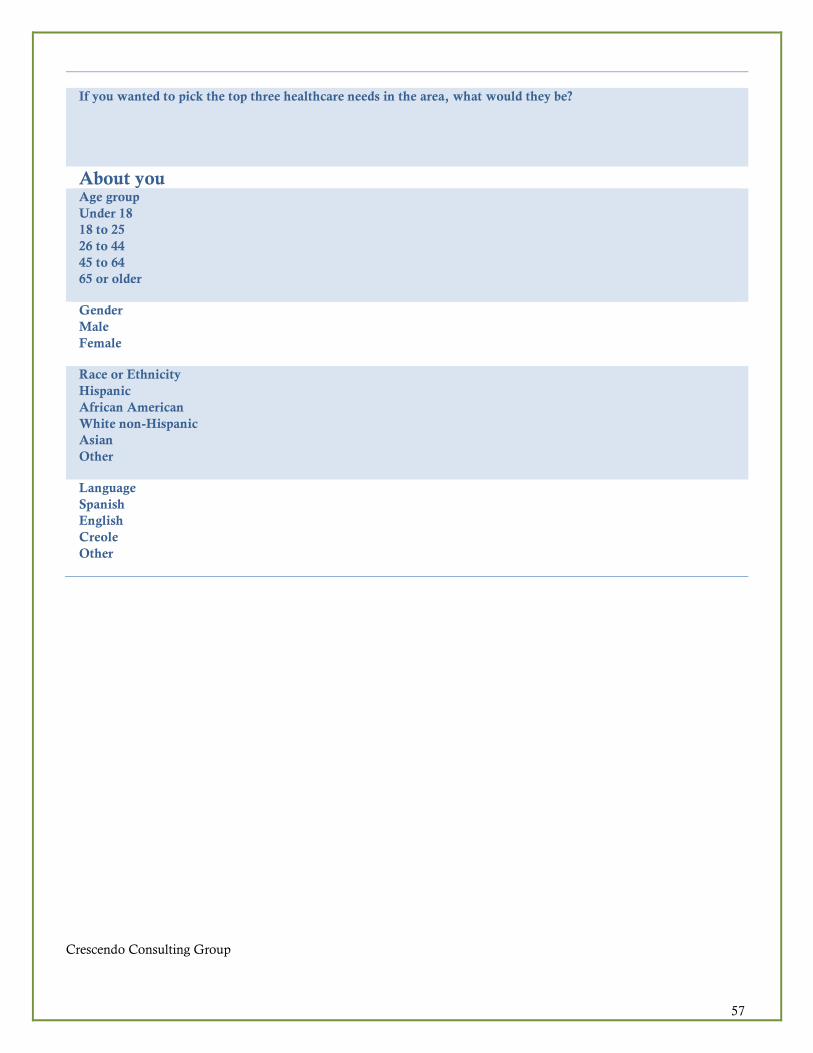
Crescendo Consulting Group
57
If you wanted to pick the top three healthcare needs in the area, what would they be?
1.
2.
3.
About you
Age group
• Under 18
• 18 to 25
• 26 to 44
• 45 to 64
• 65 or older
Gender
• Male
• Female
Race or Ethnicity
• Hispanic
• African American
• White non-Hispanic
• Asian
• Other
Language
• Spanish
• English
• Creole
• Other

Crescendo Consulting Group
58
Appendix C: La Fiesta del Pueblo Festival Survey Frequency Tables
La Fiesta del Pueblo Festival Survey Frequency
Tables
Q1. Where do you go when you need basic medical care?
Frequency Percent Net Percent
Cumulative Percent
Doctor's office 67 52.8 54.0 54.0
Hospital Emergency Room 24 18.9 19.4 73.4
Clinic or urgent care facility 29 22.8 23.4 96.8
I do not get care even when I need it 4 3.1 3.2 100.0
Total 124 97.6 100.0
No response 3 2.4 Total 127 100.0
Q2. In the past 12 months, have there been times when you needed medical help but chose NOT to seek it?
Frequency Percent Net Percent
Cumulative Percent
Yes 54 42.5 43.2 43.2
No 66 52.0 52.8 96.0
Not sure 5 3.9 4.0 100.0
Total 125 98.4 100.0
No response 2 1.6
Total 127 100.0
Q3. If YES, why did you NOT get care?
Frequency Percent Net Percent
Cumulative Percent
Doctor might not know my language; difficult to communicate
9 7.1 15.8 15.8
Did not have the money 23 18.1 40.4 56.1
No doctors or clinics near me; too far away 6 4.7 10.5 66.7
Had no transportation to get to the doctor or clinic
5 3.9 8.8 75.4
Doctors or clinic not open at a convenient time
10 7.9 17.5 93.0
Something else 4 3.1 7.0 100.0
Total 57 44.9 100.0 No response 70 55.1 Total 127 100.0

Crescendo Consulting Group
59
Q4a. How would you rate the need for healthcare services for ADULTS in the area? ... Basic medical services – Primary Care
Frequency Percent Net Percent
Cumulative Percent
We have enough 41 32.3 33.9 33.9
We need SOME more 37 29.1 30.6 64.5
We need A LOT more 23 18.1 19.0 83.5
Not sure 20 15.7 16.5 100.0
Total 121 95.3 100.0 No response 6 4.7 Total 127 100.0
Q4b. How would you rate the need for healthcare services for ADULTS in the area? ... Specialized care doctors (for
diabetes care, heart disease care, back problems, etc.)
Frequency Percent Net Percent
Cumulative Percent
We have enough 29 22.8 25.2 25.2
We need SOME more 42 33.1 36.5 61.7
We need A LOT more 21 16.5 18.3 80.0
Not sure 23 18.1 20.0 100.0
Total 115 90.6 100.0 No response 12 9.4 Total 127 100.0
Q4c. How would you rate the need for healthcare services for ADULTS in the area? ... Dentistry
Frequency Percent Net Percent
Cumulative Percent
We have enough 27 21.3 23.9 23.9
We need SOME more 37 29.1 32.7 56.6
We need A LOT more 26 20.5 23.0 79.6
Not sure 23 18.1 20.4 100.0
Total 113 89.0 100.0 No response 14 11.0 Total 127 100.0
Q4d. How would you rate the need for healthcare services for ADULTS in the area? ... Mental health (for example,
depression, anxiety, suicidal thinking, anger management, and others)
Frequency Percent Net Percent
Cumulative Percent
We have enough 18 14.2 15.5 15.5
We need SOME more 38 29.9 32.8 48.3
We need A LOT more 31 24.4 26.7 75.0
Not sure 29 22.8 25.0 100.0
Total 116 91.3 100.0 No response 11 8.7 Total 127 100.0

Crescendo Consulting Group
60
Q4e. How would you rate the need for healthcare services for ADULTS in the area? ... Substance abuse – drug abuse
treatment
Frequency Percent Net Percent
Cumulative Percent
We have enough 9 7.1 8.0 8.0
We need SOME more 26 20.5 23.2 31.3
We need A LOT more 33 26.0 29.5 60.7
Not sure 44 34.6 39.3 100.0
Total 112 88.2 100.0 No response 15 11.8 Total 127 100.0
Q5a. How would you rate the need for healthcare services for CHILDREN in the area? ... Basic medical services –
Primary Care
Frequency Percent Net Percent
Cumulative Percent
We have enough 41 32.3 36.3 36.3
We need SOME more 38 29.9 33.6 69.9
We need A LOT more 21 16.5 18.6 88.5
Not sure 13 10.2 11.5 100.0
Total 113 89.0 100.0 No response 14 11.0 Total 127 100.0
Q5b. How would you rate the need for healthcare services for CHILDREN in the area? ... Specialized care services (for
diabetes care, heart disease care, back problems, etc.)
Frequency Percent Net Percent
Cumulative Percent
We have enough 29 22.8 27.4 27.4
We need SOME more 34 26.8 32.1 59.4
We need A LOT more 30 23.6 28.3 87.7
Not sure 13 10.2 12.3 100.0
Total 106 83.5 100.0 No response 21 16.5 Total 127 100.0
Q5c. How would you rate the need for healthcare services for CHILDREN in the area? ... Dentistry
Frequency Percent Net Percent
Cumulative Percent
We have enough 29 22.8 27.9 27.9
We need SOME more 25 19.7 24.0 51.9
We need A LOT more 31 24.4 29.8 81.7
Not sure 19 15.0 18.3 100.0
Total 104 81.9 100.0 No response 23 18.1 Total 127 100.0

Crescendo Consulting Group
61
Q5d. How would you rate the need for healthcare services for CHILDREN in the area? ... Mental health (for example,
depression, anxiety, suicidal thinking, anger management, and others)
Frequency Percent Net Percent
Cumulative Percent
We have enough 17 13.4 16.0 16.0
We need SOME more 29 22.8 27.4 43.4
We need A LOT more 36 28.3 34.0 77.4
Not sure 24 18.9 22.6 100.0
Total 106 83.5 100.0 No response 21 16.5 Total 127 100.0
Q5e. How would you rate the need for healthcare services for CHILDREN in the area? ... Substance abuse – drug abuse
treatment
Frequency Percent Net Percent
Cumulative Percent
We have enough 14 11.0 13.6 13.6
We need SOME more 22 17.3 21.4 35.0
We need A LOT more 38 29.9 36.9 71.8
Not sure 29 22.8 28.2 100.0
Total 103 81.1 100.0 No response 24 18.9 Total 127 100.0
Q6a. If you wanted to pick the top three healthcare needs in the area, what would they be?
Frequency Percent Net Percent
Cumulative Percent
Bilingual services 1 .8 1.8 1.8
Dental services 10 7.9 17.9 19.6
Mental health services 13 10.2 23.2 42.9
More convenient health service locations 1 .8 1.8 44.6
Primary care services 10 7.9 17.9 62.5
Substance abuse services 9 7.1 16.1 78.6
Specialized medicine services 10 7.9 17.9 96.4
Urgent or quick care services 1 .8 1.8 98.2
Other services 1 .8 1.8 100.0
Total 56 44.1 100.0 No response 71 55.9 Total 127 100.0

Crescendo Consulting Group
62
Q6b. If you wanted to pick the top three healthcare needs in the area, what would they be?
Frequency Percent Net Percent
Cumulative Percent
Children's health services 1 .8 2.0 2.0
Dental services 12 9.4 24.0 26.0
Mental health services 5 3.9 10.0 36.0
Primary care services 8 6.3 16.0 52.0
Substance abuse services 5 3.9 10.0 62.0
Specialized medicine services 11 8.7 22.0 84.0
Urgent or quick care services 5 3.9 10.0 94.0
Women's health services 1 .8 2.0 96.0
Other services 2 1.6 4.0 100.0
Total 50 39.4 100.0 No response 77 60.6 Total 127 100.0
Q6c. If you wanted to pick the top three healthcare needs in the area, what would they be?
Frequency Percent Net Percent
Cumulative Percent
Bilingual services 1 .8 3.3 3.3
Dental services 3 2.4 10.0 13.3
Mental health services 5 3.9 16.7 30.0
Primary care services 5 3.9 16.7 46.7
Substance abuse services 6 4.7 20.0 66.7
Specialized medicine services 7 5.5 23.3 90.0
Transportation 1 .8 3.3 93.3
Urgent or quick care services 1 .8 3.3 96.7
Other services 1 .8 3.3 100.0
Total 30 23.6 100.0 No response 97 76.4 Total 127 100.0
Q7. Age group
Frequency Percent Net Percent
Cumulative Percent
Under 18 15 11.8 12.6 12.6
18 to 25 24 18.9 20.2 32.8
26 to 44 42 33.1 35.3 68.1
45 to 64 29 22.8 24.4 92.4
65 or older 9 7.1 7.6 100.0
Total 119 93.7 100.0 No response 8 6.3 Total 127 100.0
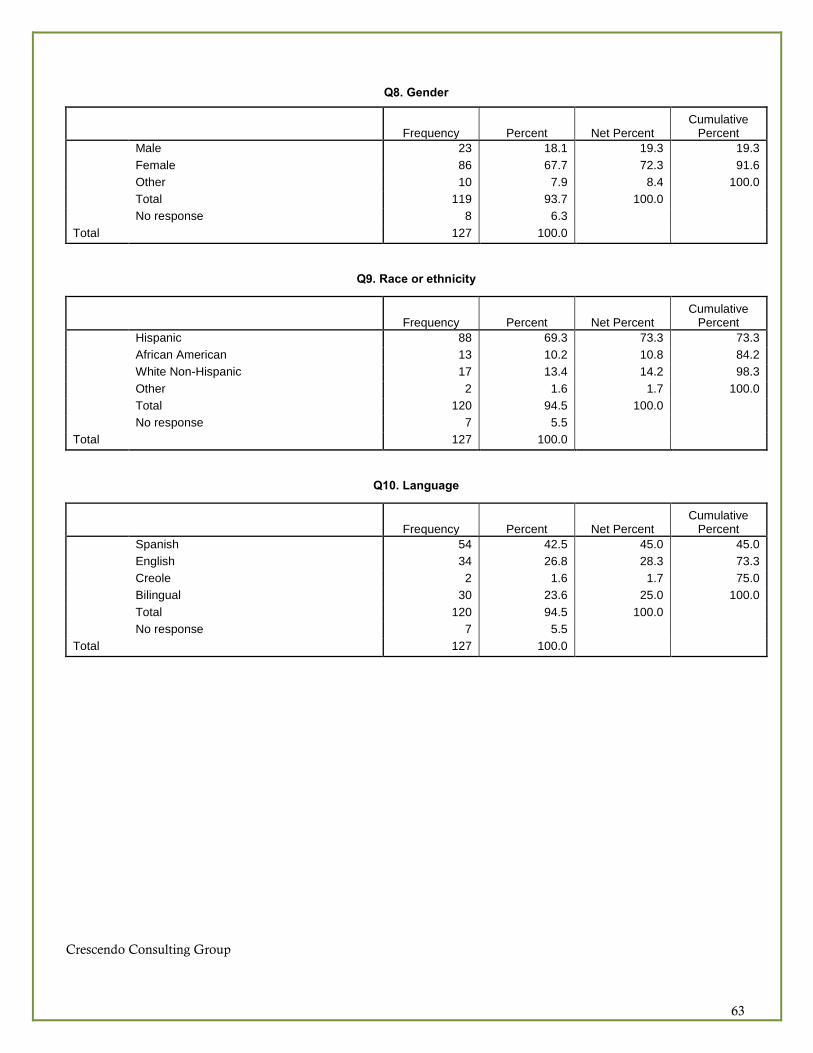
Crescendo Consulting Group
63
Q8. Gender
Frequency Percent Net Percent
Cumulative Percent
Male 23 18.1 19.3 19.3
Female 86 67.7 72.3 91.6
Other 10 7.9 8.4 100.0
Total 119 93.7 100.0 No response 8 6.3 Total 127 100.0
Q9. Race or ethnicity
Frequency Percent Net Percent
Cumulative Percent
Hispanic 88 69.3 73.3 73.3
African American 13 10.2 10.8 84.2
White Non-Hispanic 17 13.4 14.2 98.3
Other 2 1.6 1.7 100.0
Total 120 94.5 100.0 No response 7 5.5 Total 127 100.0
Q10. Language
Frequency Percent Net Percent
Cumulative Percent
Spanish 54 42.5 45.0 45.0
English 34 26.8 28.3 73.3
Creole 2 1.6 1.7 75.0
Bilingual 30 23.6 25.0 100.0
Total 120 94.5 100.0 No response 7 5.5 Total 127 100.0

Crescendo Consulting Group 64
Appendix D: Additional Data by County (All 12 Total Service Area Counties)
Quality of Life
4.95
4.44.5
4.84.7
4.6
4.34.4
4.6 4.64.5
3.7
4.6 4.6 4.6
0
1
2
3
4
5
6
AtkinsonCounty
Ben HillCounty
BerrienCounty
CoffeeCounty
ColquittCounty
CrispCounty
IrwinCounty
WilcoxCounty
WorthCounty
TiftCounty
TurnerCounty
CookCounty
Georgia PSA SSA TSA
Quality of Life
Poor physical health days Poor mental health days

Crescendo Consulting Group 65
Teen Births
90
82
6871 71
77
50
67
46
53
75
64
39
58.6
69.3 66.6
0
10
20
30
40
50
60
70
80
90
100
AtkinsonCounty
Ben HillCounty
BerrienCounty
CoffeeCounty
ColquittCounty
CrispCounty
IrwinCounty
WilcoxCounty
WorthCounty
TiftCounty
TurnerCounty
CookCounty
Georgia PSA SSA TSA
Teen Births

Crescendo Consulting Group 66
Physical Activity
29%
26%
34% 33% 33%
28% 29% 28%
31%
27%
30%
27%
23%
27%
31% 30%
35%
43%
40%
58% 59%
73%
47%
2%
50%
65%
9%
57%
75%
56%
52% 53%
0%
10%
20%
30%
40%
50%
60%
70%
80%
AtkinsonCounty
Ben HillCounty
BerrienCounty
CoffeeCounty
ColquittCounty
CrispCounty
IrwinCounty
WilcoxCounty
WorthCounty
TiftCounty
TurnerCounty
CookCounty
Georgia PSA SSA TSA
Physical Activity
Physical inactivity Access to exercise opportunities

Crescendo Consulting Group 67
Preventable Hospital Days
110
82
68
83 83
67
53
91
58
63
51
65
52
62.0
76.9 73.2
0
20
40
60
80
100
120
AtkinsonCounty
Ben HillCounty
BerrienCounty
CoffeeCounty
ColquittCounty
CrispCounty
IrwinCounty
WilcoxCounty
WorthCounty
TiftCounty
TurnerCounty
CookCounty
Georgia PSA SSA TSA
Preventable Hospital Stays

Crescendo Consulting Group 68
Adult Smoking
21% 21%
20% 20%
21% 21%
20% 20%
18%
19% 19%
20%
18%
19%
20%
20%
17%
17%
18%
18%
19%
19%
20%
20%
21%
21%
22%
AtkinsonCounty
Ben HillCounty
BerrienCounty
CoffeeCounty
ColquittCounty
CrispCounty
IrwinCounty
WilcoxCounty
WorthCounty
TiftCounty
TurnerCounty
CookCounty
Georgia PSA SSA TSA
Adult Smoking
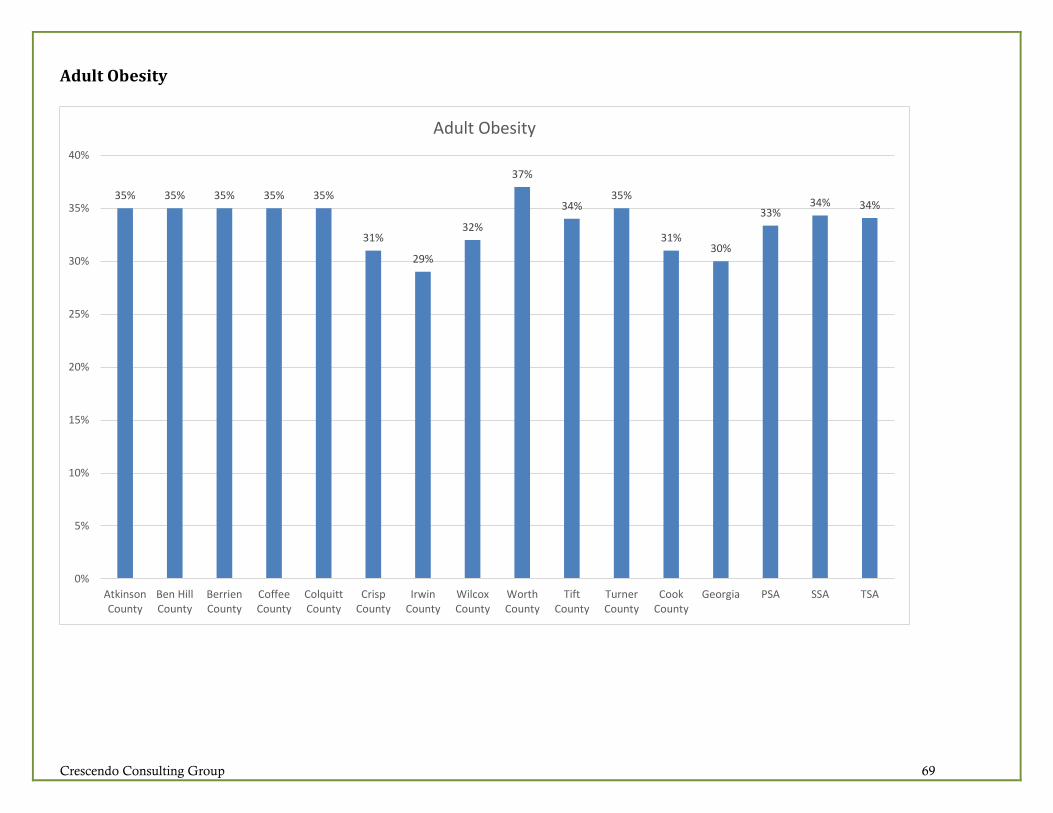
Crescendo Consulting Group 69
Adult Obesity
35% 35% 35% 35% 35%
31%
29%
32%
37%
34%35%
31%30%
33%34% 34%
0%
5%
10%
15%
20%
25%
30%
35%
40%
AtkinsonCounty
Ben HillCounty
BerrienCounty
CoffeeCounty
ColquittCounty
CrispCounty
IrwinCounty
WilcoxCounty
WorthCounty
TiftCounty
TurnerCounty
CookCounty
Georgia PSA SSA TSA
Adult Obesity

Crescendo Consulting Group 70
Uninsured Population
28%
18%
22% 22%
26%
17%
18% 18%
20%
21% 21%
23%
18%
22% 22% 22%
0%
5%
10%
15%
20%
25%
30%
AtkinsonCounty
Ben HillCounty
BerrienCounty
CoffeeCounty
ColquittCounty
CrispCounty
IrwinCounty
WilcoxCounty
WorthCounty
TiftCounty
TurnerCounty
CookCounty
Georgia PSA SSA TSA
Uninsured

Crescendo Consulting Group 71
Educational Attainment
83%81%
85%
80%
86%
79%
83%
88%
76%
83%
78%80% 80%
82% 82% 82%
36%
48% 48%
40% 40%
53%
45%
28%
37%
53%
46%44%
62%
50%
42%44%
0%
10%
20%
30%
40%
50%
60%
70%
80%
90%
100%
AtkinsonCounty
Ben HillCounty
BerrienCounty
CoffeeCounty
ColquittCounty
CrispCounty
IrwinCounty
WilcoxCounty
WorthCounty
TiftCounty
TurnerCounty
CookCounty
Georgia PSA SSA TSA
Education Level
High school graduation Some college

Crescendo Consulting Group 72
Diabetes Monitoring
82%
78%
91%
81%
86%
87%
88%
82%
87%
84%
92%
83%
85% 85% 85% 85%
70%
75%
80%
85%
90%
95%
AtkinsonCounty
Ben HillCounty
BerrienCounty
CoffeeCounty
ColquittCounty
CrispCounty
IrwinCounty
WilcoxCounty
WorthCounty
TiftCounty
TurnerCounty
CookCounty
Georgia PSA SSA TSA
Diabetes Monitoring

Crescendo Consulting Group 73
Unemployment
5.6%
9.0%
7.0%
6.6%6.4%
6.9%
8.1%
7.6%
6.4%6.2%
6.5% 6.6%
5.9%
6.3%
6.9%6.8%
0%
1%
2%
3%
4%
5%
6%
7%
8%
9%
10%
AtkinsonCounty
Ben HillCounty
BerrienCounty
CoffeeCounty
ColquittCounty
CrispCounty
IrwinCounty
WilcoxCounty
WorthCounty
TiftCounty
TurnerCounty
CookCounty
Georgia PSA SSA TSA
Unemployment

Crescendo Consulting Group 74
Children in Poverty
41%
47%
37%
34%36%
47%
37%
40%
34%
40%
45%
36%
25%
40%38% 39%
0%
5%
10%
15%
20%
25%
30%
35%
40%
45%
50%
AtkinsonCounty
Ben HillCounty
BerrienCounty
CoffeeCounty
ColquittCounty
CrispCounty
IrwinCounty
WilcoxCounty
WorthCounty
TiftCounty
TurnerCounty
CookCounty
Georgia PSA SSA TSA
Children in Poverty
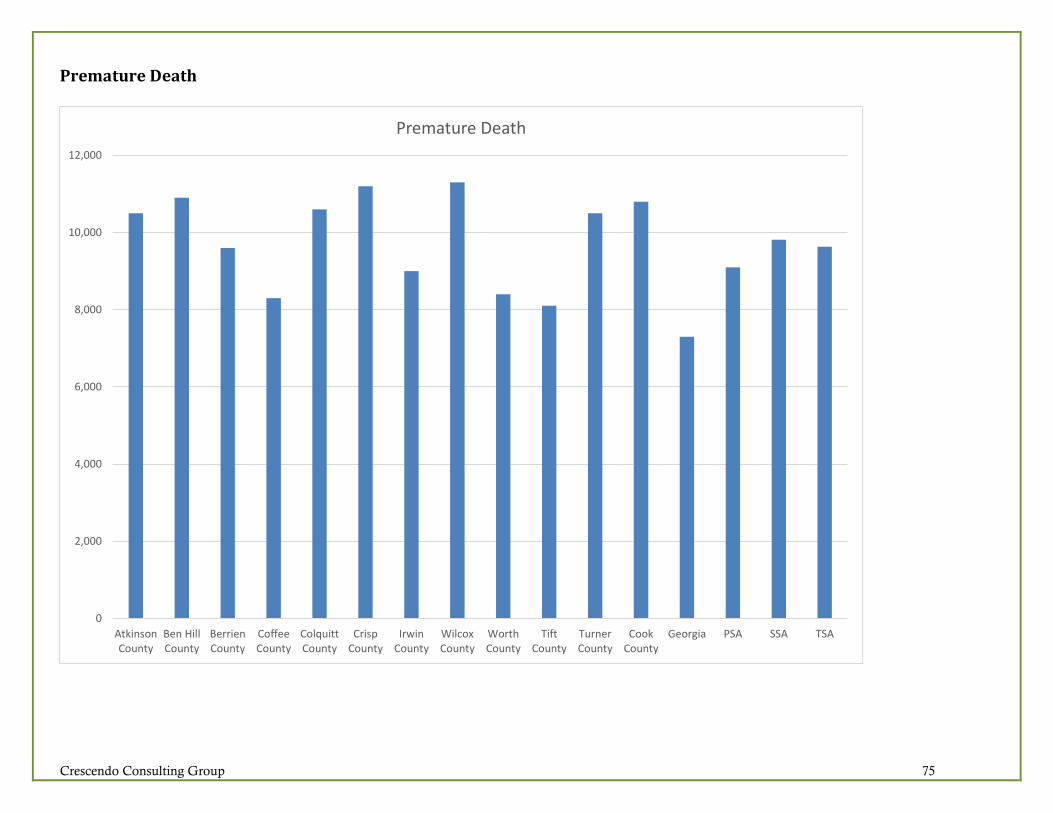
Crescendo Consulting Group 75
Premature Death
0
2,000
4,000
6,000
8,000
10,000
12,000
AtkinsonCounty
Ben HillCounty
BerrienCounty
CoffeeCounty
ColquittCounty
CrispCounty
IrwinCounty
WilcoxCounty
WorthCounty
TiftCounty
TurnerCounty
CookCounty
Georgia PSA SSA TSA
Premature Death

Crescendo Consulting Group 76
Poor or Fair General Health
0%
5%
10%
15%
20%
25%
30%
AtkinsonCounty
Ben HillCounty
BerrienCounty
CoffeeCounty
ColquittCounty
CrispCounty
IrwinCounty
WilcoxCounty
WorthCounty
TiftCounty
TurnerCounty
CookCounty
Georgia PSA SSA TSA
Poor or Fair Health

Crescendo Consulting Group 77
Low Birthweight
0%
2%
4%
6%
8%
10%
12%
14%
16%
18%
AtkinsonCounty
Ben HillCounty
BerrienCounty
CoffeeCounty
ColquittCounty
CrispCounty
IrwinCounty
WilcoxCounty
WorthCounty
TiftCounty
TurnerCounty
CookCounty
Georgia PSA SSA TSA
Low Birthweight

Crescendo Consulting Group 78
Excessive Drinking
0%
2%
4%
6%
8%
10%
12%
14%
16%
18%
AtkinsonCounty
Ben HillCounty
BerrienCounty
CoffeeCounty
ColquittCounty
CrispCounty
IrwinCounty
WilcoxCounty
WorthCounty
TiftCounty
TurnerCounty
CookCounty
Georgia PSA SSA TSA
Excessive Drinking
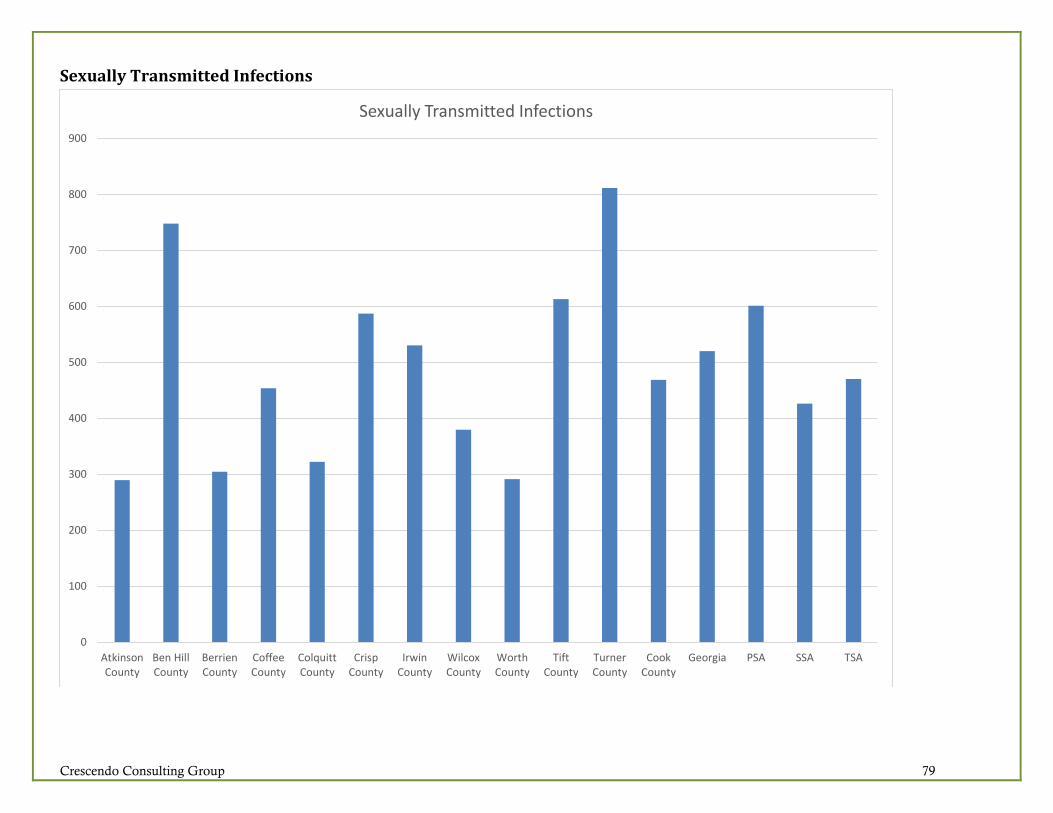
Crescendo Consulting Group 79
Sexually Transmitted Infections
0
100
200
300
400
500
600
700
800
900
AtkinsonCounty
Ben HillCounty
BerrienCounty
CoffeeCounty
ColquittCounty
CrispCounty
IrwinCounty
WilcoxCounty
WorthCounty
TiftCounty
TurnerCounty
CookCounty
Georgia PSA SSA TSA
Sexually Transmitted Infections

Crescendo Consulting Group 80
Alcohol-Impaired Driving Deaths
0%
10%
20%
30%
40%
50%
60%
AtkinsonCounty
Ben HillCounty
BerrienCounty
CoffeeCounty
ColquittCounty
CrispCounty
IrwinCounty
WilcoxCounty
WorthCounty
TiftCounty
TurnerCounty
CookCounty
Georgia PSA SSA TSA
Alcohol-Impaired Driving Deaths
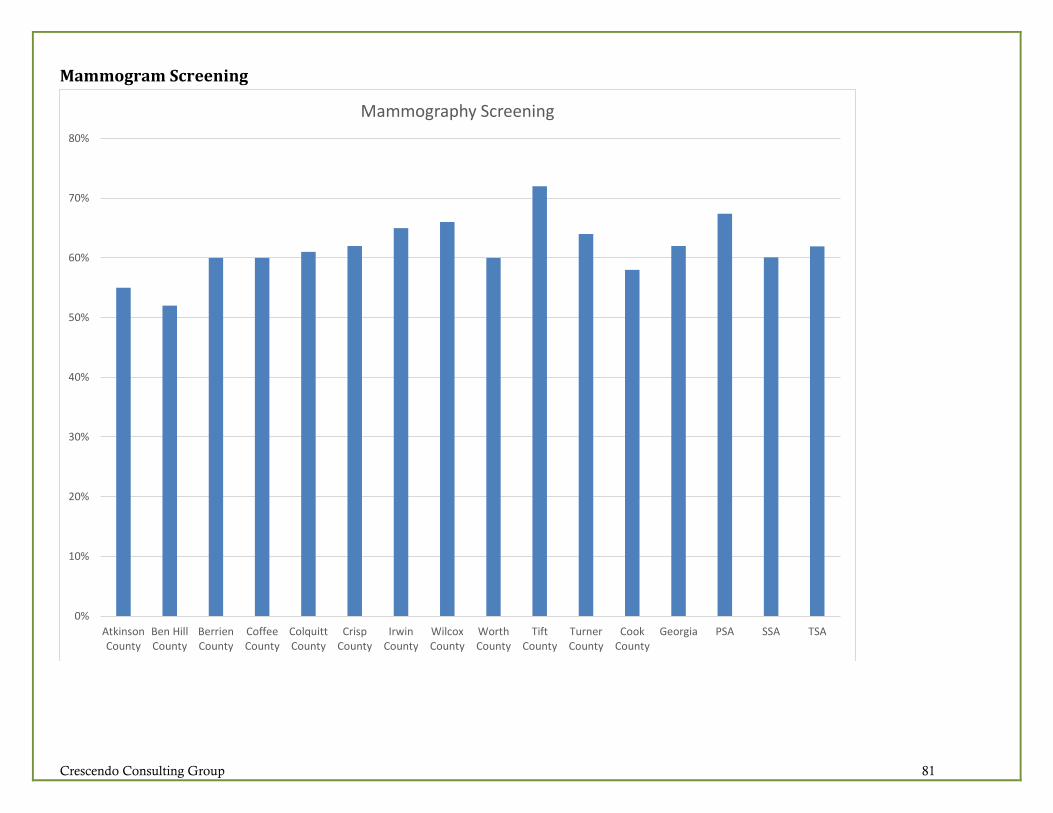
Crescendo Consulting Group 81
Mammogram Screening
0%
10%
20%
30%
40%
50%
60%
70%
80%
AtkinsonCounty
Ben HillCounty
BerrienCounty
CoffeeCounty
ColquittCounty
CrispCounty
IrwinCounty
WilcoxCounty
WorthCounty
TiftCounty
TurnerCounty
CookCounty
Georgia PSA SSA TSA
Mammography Screening

Crescendo Consulting Group 82
Community Survey Results

Crescendo Consulting Group 83

Crescendo Consulting Group 84

Crescendo Consulting Group 85

Crescendo Consulting Group 86
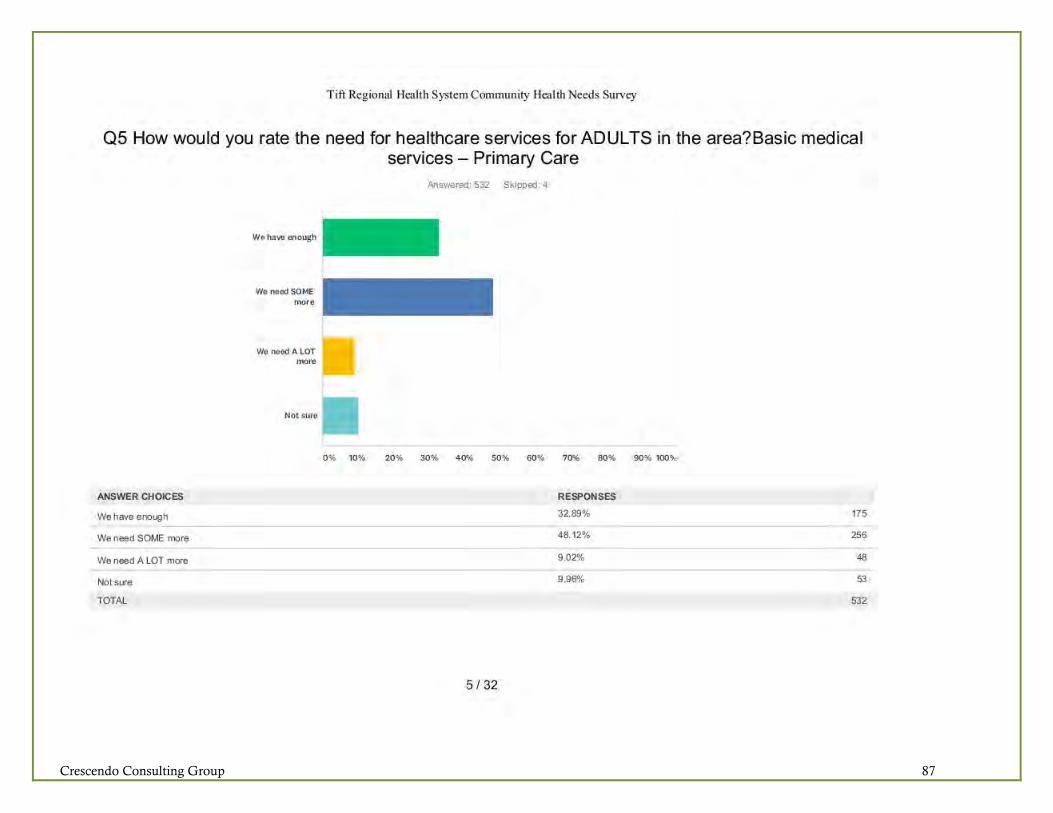
Crescendo Consulting Group 87

Crescendo Consulting Group 88

Crescendo Consulting Group 89
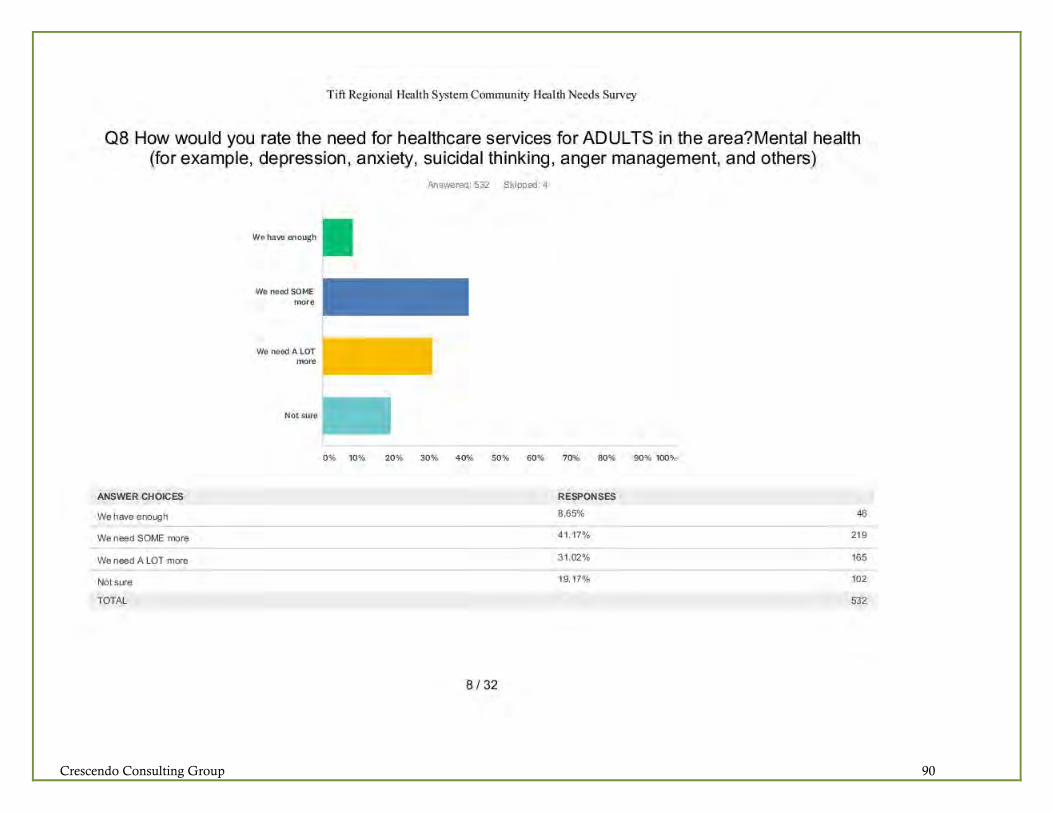
Crescendo Consulting Group 90

Crescendo Consulting Group 91

Crescendo Consulting Group 92

Crescendo Consulting Group 93

Crescendo Consulting Group 94

Crescendo Consulting Group 95
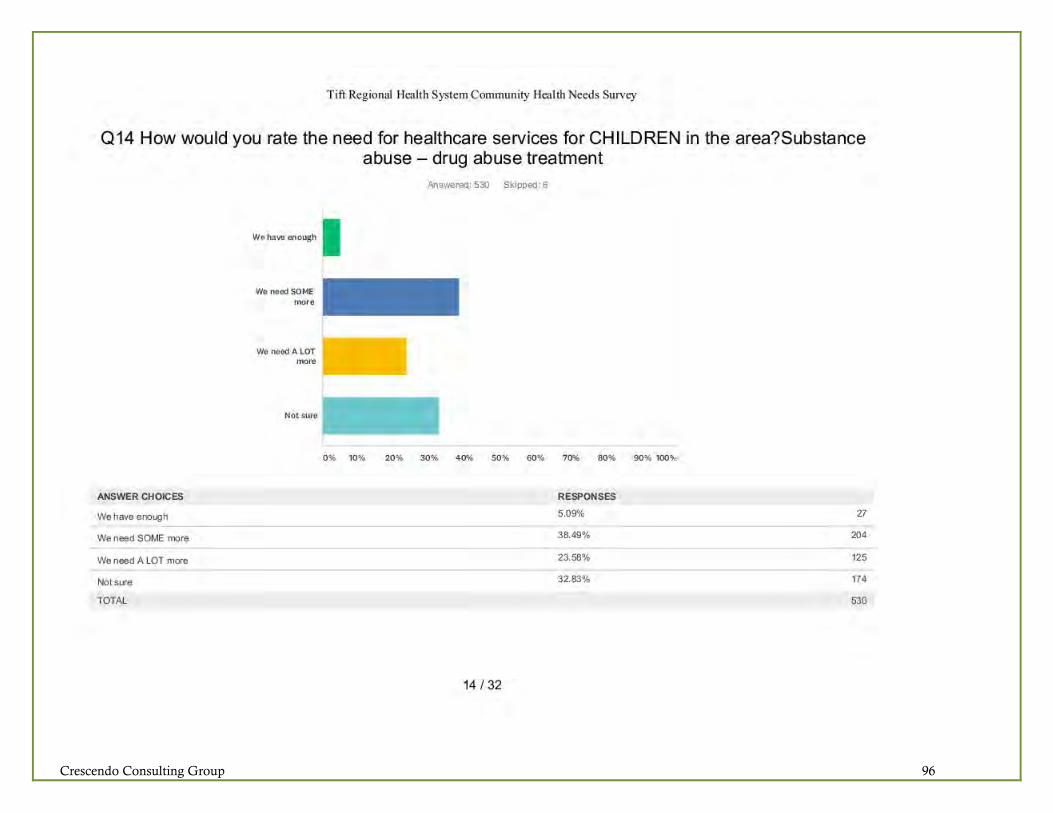
Crescendo Consulting Group 96

Crescendo Consulting Group 97

Crescendo Consulting Group 98

Crescendo Consulting Group 99

Crescendo Consulting Group 100

Crescendo Consulting Group 101
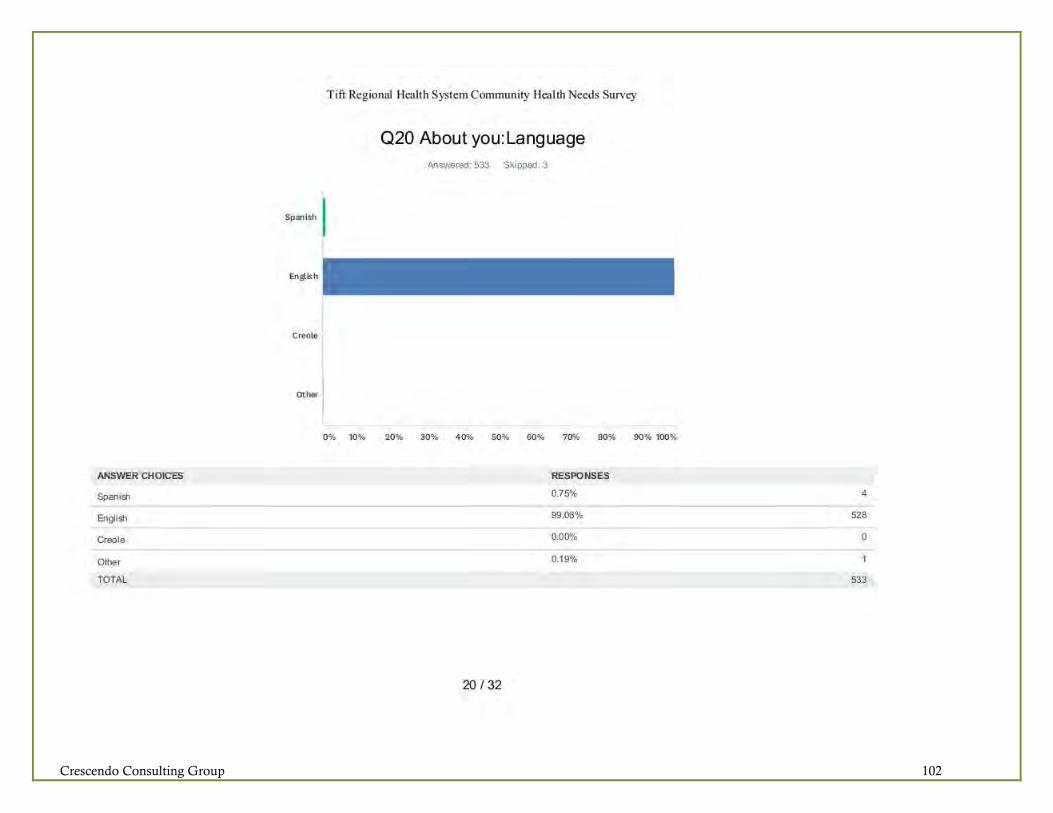
Crescendo Consulting Group 102
Crescendo Consulting Group 103
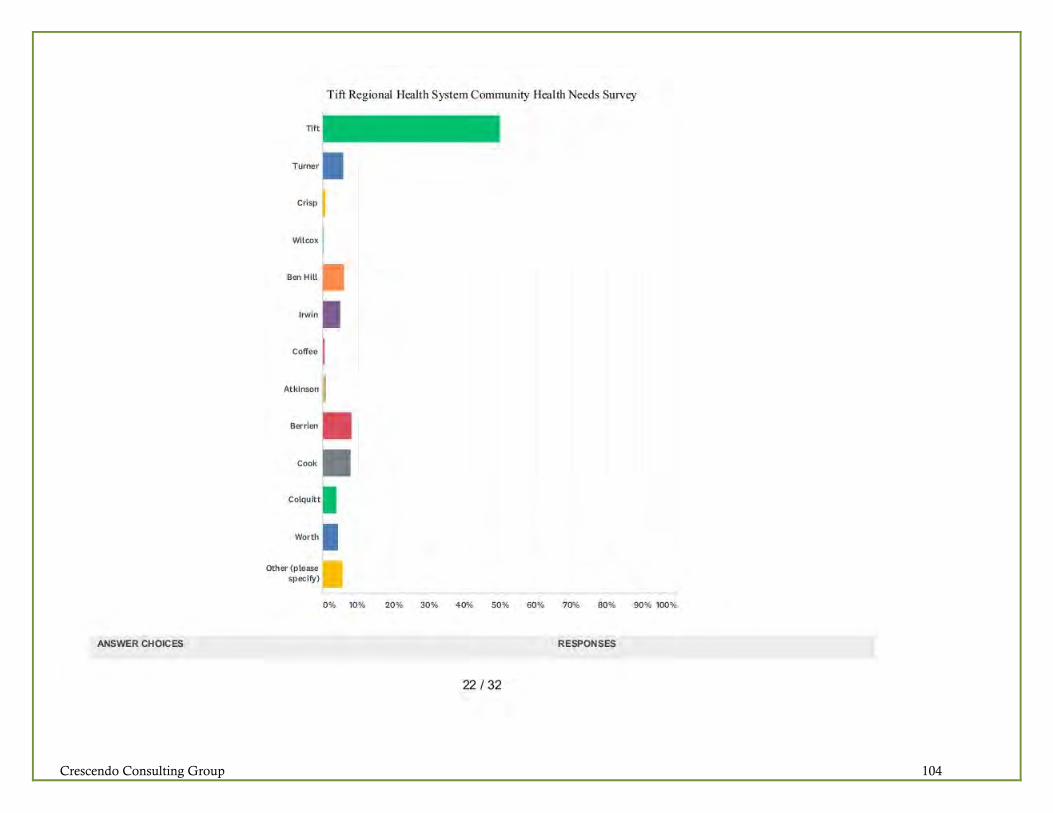
Crescendo Consulting Group 104
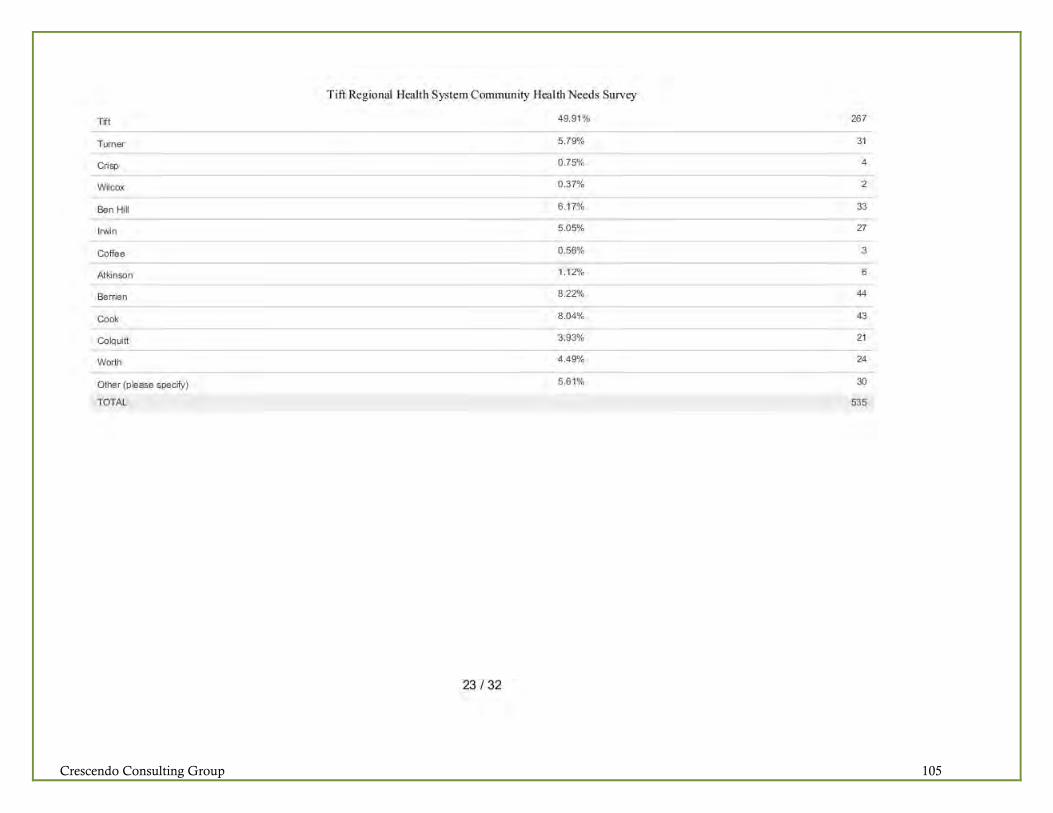
Crescendo Consulting Group 105

Crescendo Consulting Group 106

Crescendo Consulting Group 107

Crescendo Consulting Group 108

Crescendo Consulting Group 109

Crescendo Consulting Group 110
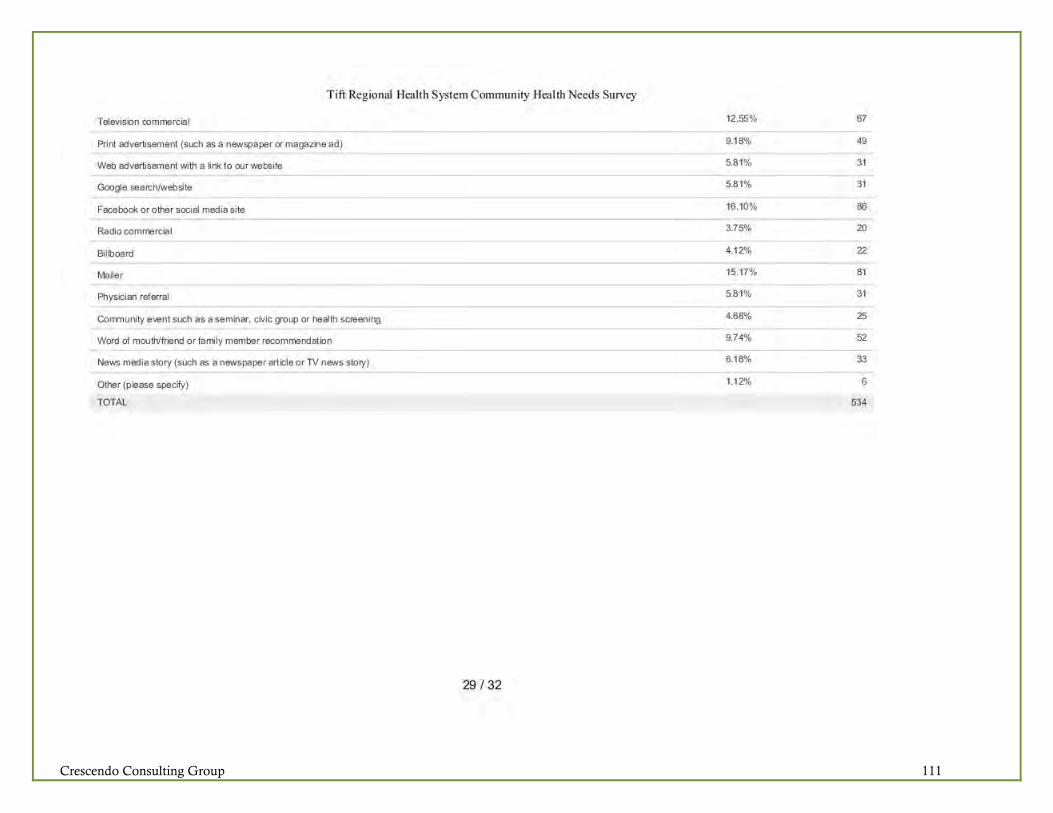
Crescendo Consulting Group 111

Crescendo Consulting Group 112

Crescendo Consulting Group 113

Crescendo Consulting Group 114

Crescendo Consulting Group Page 115
Appendix E: Community Resources and Facilities – Tift Regional Health System TIFT REGIONAL MEDICAL CENTER— MAIN CAMPUS Cardiopulmonary Rehabilitation Case Management Central Scheduling—Main Campus CT Elene Dorminy Women’s Pavilion (Birthing Center) Elene Dorminy Women’s Pavilion (Gynecology) Emergency Center Endoscopy Health Information Management (Medical Records) Heart and Vascular Center Hospital Medicine Human Resources/Employment Infusion Center Intensive Care Unit Laboratory Medical East Medical Surgical Medical West MRI Neurodiagnostics Center Observation Unit Operating Room Orthopedics Palliative Care Patient Financial Services Pediatrics PET/CT Pharmacy Radiology/Medical Imaging Respiratory Care Step Down Unit Surgical Recovery Unit Therapy Services (Inpatient Physical Therapy, Occupational Therapy, Speech Therapy) Tift Regional Medical Center Foundation Transfer Center Ultrasound Women’s Health Navigator Women’s Imaging Center
TIFT REGIONAL MEDICAL CENTER— WEST CAMPUS Affinity Clinic Building Affinity Clinic Cardiac Diagnostic Testing Central Scheduling—West Campus Coumadin Clinic Endoscopy ExpressCare (Convenient Care Clinic) Laboratory Radiology/Medical Imaging Musculoskeletal Center Building Affinity Neurology Arthritis and Osteoporosis Center of South Georgia Georgia Sports Medicine (Orthopedics and Sports Medicine) Tift Regional Chiropractic Services Tift Regional Outpatient Therapy Services (Physical Therapy, Occupational Therapy, Speech Therapy) Tift Regional Pain Management Center COOK MEDICAL CENTER—A CAMPUS OF TIFT REGIONAL MEDICAL CENTER Central Scheduling Cook Senior Living Center (Nursing Home Care) Human Resources/Employment Laboratory Health Information Management (Medical Records) Radiology Registration Rehabilitation Services Respiratory Therapy Sylvia Barr Center (Geriatric Psychiatric Care) SATELLITE SERVICES Anita Stewart Oncology Center Diabetes Learning Center Dialysis Center Hospice of Tift Area Outreach and Development Sleep Center Tift Regional Community Events Center/Tiftarea YMCA Partnership
TIFT REGIONAL PHYSICIAN GROUP Affinity Clinic (Multiple Specialties) Affinity Hospital Medicine (Hospital Medicine) Affinity Pediatrics (Pediatrics) Affinity Physicians for Women (Obstetrics/Gynecology) Allure Plastic and Reconstructive Surgery (Plastic and Reconstructive Surgery) Arthritis and Osteoporosis Center of South Georgia (Rheumatology) Ashburn Primary Care (Family Medicine) Cook Family Wellness Center (Family Medicine and Convenient Care) Cook Primary Care (Family Medicine) Georgia Sports Medicine (Orthopedic Surgery) Irwin Primary Care (Family Medicine) Nashville Primary Care (Family Medicine) Ocilla Pediatrics (Pediatrics) South Georgia Surgical (General Surgery) Sylvester Family Practice (Family Medicine) Tift Community Health Center (Internal Medicine) Tift Family Medicine and Weight Loss (Family Medicine) Tift Regional Vascular (Vascular Surgery) Tift Regional Ophthalmology (Ophthalmology) Tift Regional Urology (Urology) TRHS Anesthesiology (Anesthesiology) TRMC Pain Management Center (Pain Management) WorkSmart Occupational Health (Occupational Medicine) Wound Care & Hyperbaric Clinic (Wound Care)
www.tiftregional.com