community health assessment study discussion paper # 3€¦ · · 2010-12-09community health...
TRANSCRIPT

COMMUNITY HEALTH ASSESSMENT STUDY
DISCUSSION PAPER # 3
Socio demographic Description ofSocio-demographic Description of the Service Area &
Overview of Health Status Indicators
REPORT TO
COMMUNITY HEALTH ASSESSMENT STEERING COMMITTEESTEERING COMMITTEE
December 3, 2010
11
Community Health Assessment Study
• Discussion Paper #1 - Define Service Area• Discussion Paper #2 - St. Vincent’s CMC Medical Center
– The Origin of its Patients– A Review of Communities Receiving Care
• Discussion Paper #3– Sociodemographic Description of the Service Area– Overview of Health Status Indicators
• Discussion Paper # 4 - Service Area Utilization & Projected Need for Health Services• Discussion Paper #5 - Survey of Community Health and Access to Health Services• Discussion Paper # 6 - Identification of Service Area Health Needs/Service Gaps• Discussion Paper #7 - Recommendations for Community Health
2

Service AreaService Area
Primary Service Area (PSA)
Legend
Secondary Service Area‐I (SSA‐I)
Former SVCMC site
Secondary Service Area‐II (SSA‐II)
3
Community Board border
Former SVCMC site

Table 1 - Estimated Population and Projection, 2010 - 2015
Current populations estimates and projections for the Service Area have been p p p jdeveloped by Thomson Reuters, a data analysis service.
Preliminary information for the 2010 Census will be released in 2011
Estimated 2010 Population Estimated 2015 Population
# %Primary Service Area (PSA) 129,421 33.5%Secondary Service Area (SSA I) 82 787 21 5%
Estimated PopulationArea # % Absolute Percent
Primary Service Area (PSA) 131,470 33.3% 2,049 1.6%Secondary Service Area (SSA I) 84 457 21 4% 1 670 2 0%
Estimated PopulationArea
Growth
Secondary Service Area (SSA-I) 82,787 21.5%Secondary Service Area (SSA-II) 173,584 45.0%
Total Service Area 385,792 100.0%
Secondary Service Area (SSA-I) 84,457 21.4% 1,670 2.0%Secondary Service Area (SSA-II) 178,398 45.2% 4,814 2.8%
Total Service Area 394,325 100.0% 8,533 2.2%
44Source: Thomson Reuters; accessed November 5, 2010PSA = Primary Service Area; SSA-I = Secondary Service Area-I; SSA-II = Secondary Service Area-II

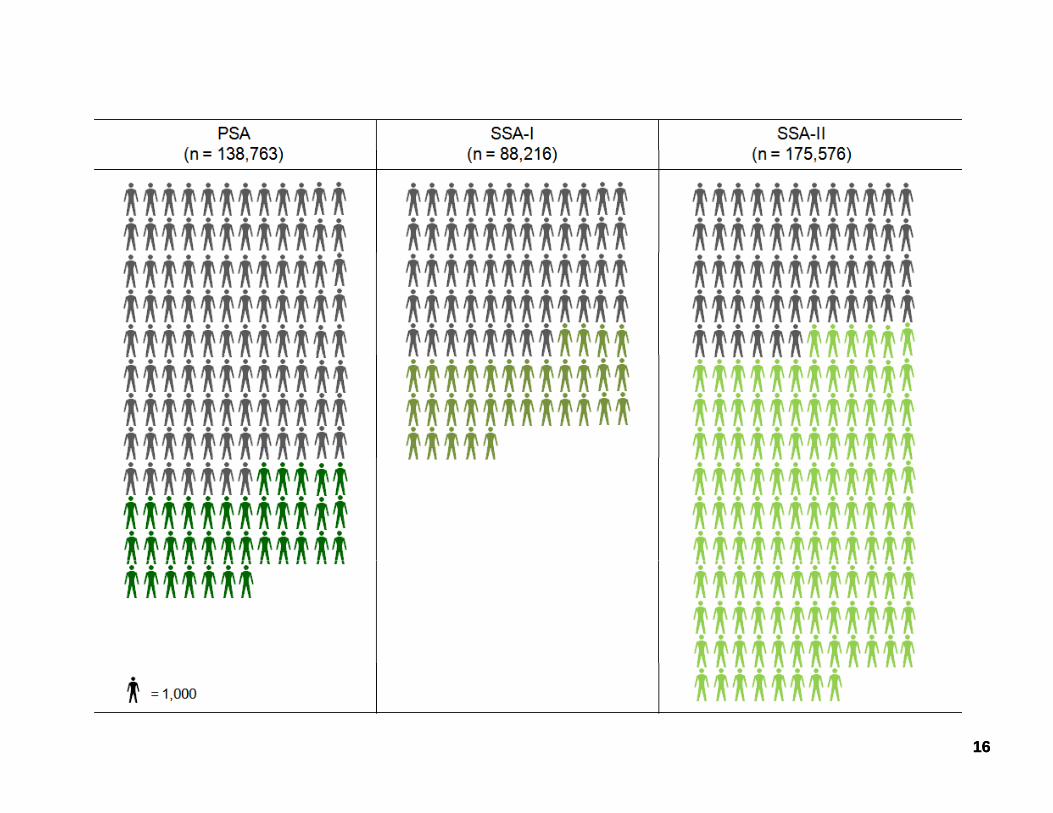
Table 2 - Service Area Population by Age Group, 2008
SSA-I is generally younger.SSA I is generally younger. The PSA has a relatively higher proportion of adults 35-64.
The SSA-II contains the highest percentage of persons over 65 years of ageand the frail elderly 85+.
65 74 75 84 850-17 18-34 35-64 65+PSA (n = 138,763) 10.0% 29.0% 49.6% 11.4%SSA-I (n = 88,216) 11.9% 32.2% 45.1% 10.8%SSA-II (n = 175,576) 17.7% 24.5% 42.1% 15.7%Manhattan (n = 1,634,795) 17.0% 26.5% 43.6% 12.9%
65-74 75-84 85+6.2% 3.7% 1.6%5.7% 3.6% 1.5%7.3% 5.8% 2.6%6.7% 4.2% 2.0%
55Source: NYC Department of Health and Mental Hygiene (NYC DHMH) Epidemiology Services (http://www.nyc.gov/html/doh/html/episrv/popest_methods.shtml); accessed November 5, 2010PSA = Primary Service Area; SSA-I = Secondary Service Area-I; SSA-II = Secondary Service Area-II

Table 3 - Age Distribution (by Census Tract), 2000
Population of Ages 65 and UnderPercent Total
93.9 to 10093.9 to 10091.4 to 93.989.8 to 91.487.9 to 89.8
Age DistributionPercent Total
Population of Ages 65 and Under (87.9%)Population of Ages 65 and Over (12.1%)
Population of Ages 65 and OverPercent Total
24.9 to 43.518.3 to 24.915.4 to 18.312 1 to 15 4
66Source: 2000 Decennial Census, Summary File-3 (SF3), Table P8 (Sex and Age) Accessed November 8, 2010
12.1 to 15.4

Table 4 - Population Growth by Age Group, Service Area and Manhattan, 2010-2015
Overall Service Area growth is modest, 2.2% but the population over 65 years is projected to increase by 12%.
Service Area+2.2% Growth (+8,533 residents)
Manhattan+2.5% Growth (+40,429 residents)
10.4%
0.2%
11.8%19.2%
4.0% 6.2%9.8%
1 3%
11.7%17.5%
5.2% 6.0%
-14.0% -14.6% -13.6% -13.8%
-1.3%
+12.1% +11.8%
0-17 18-24 25-34 35-44 45-64 65-74 75-84 85+ 0-17 18-24 25-34 35-44 45-64 65-74 75-84 85+
0-17 18-24 25-34 35-44 45-64 65-74 75-84 85+ 0-17 18-24 25-34 35-44 45-64 65-74 75-84 85+
77
Source: Thomson Reuters; accessed November 5, 2010PSA = Primary Service Area; SSA-I = Secondary Service Area-I; SSA-II = Secondary Service Area-II
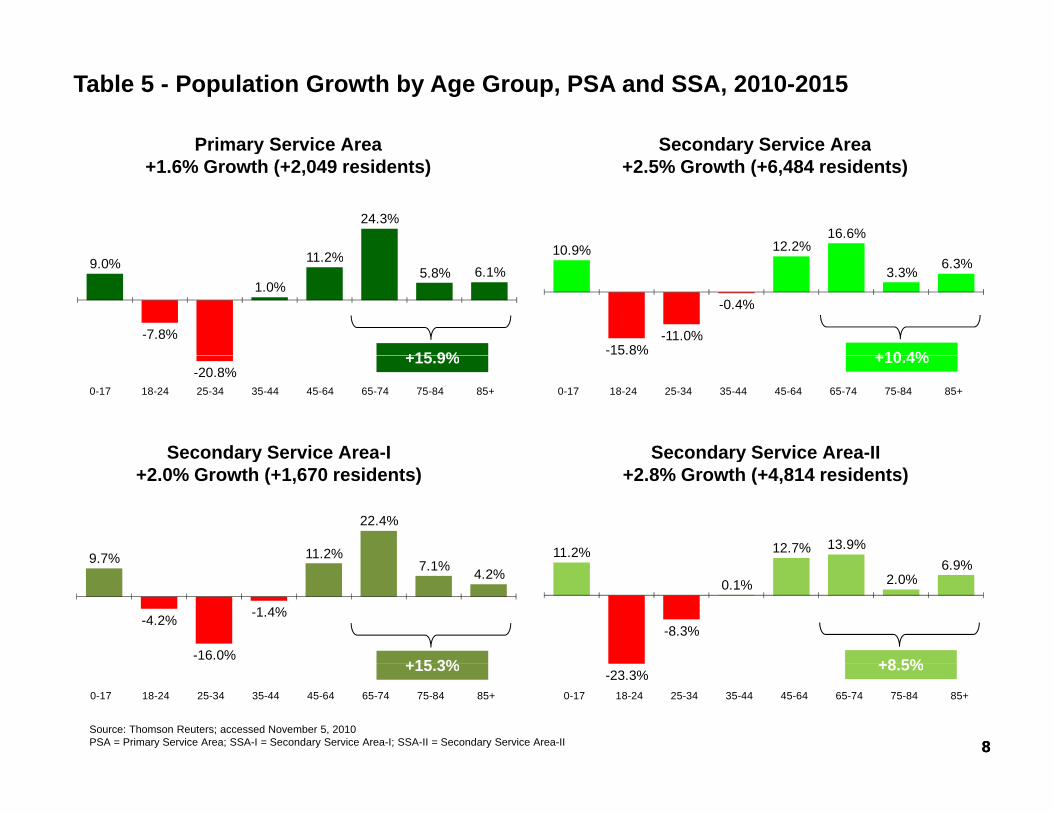
Table 5 - Population Growth by Age Group, PSA and SSA, 2010-2015
Primary Service Area Secondary Service Area
11 2%
24.3%
10 9% 12.2%16.6%
Primary Service Area+1.6% Growth (+2,049 residents)
Secondary Service Area+2.5% Growth (+6,484 residents)
9.0%
-7.8%
1.0%
11.2%5.8% 6.1%
10.9%
-15.8%-11.0%
-0.4%
3.3% 6.3%
+15 9% +10 4%-20.8%
0-17 18-24 25-34 35-44 45-64 65-74 75-84 85+
0-17 18-24 25-34 35-44 45-64 65-74 75-84 85+
0-17 18-24 25-34 35-44 45-64 65-74 75-84 85+
Secondary Service Area-I Secondary Service Area-II
+15.9% +10.4%
11.2% 12.7% 13.9%6 9%9 7% 11.2%
22.4%
0-17 18-24 25-34 35-44 45-64 65-74 75-84 85+0 17 18 24 25 34 35 44 45 64 65 74 75 84 85Secondary Service Area I
+2.0% Growth (+1,670 residents)Secondary Service Area II
+2.8% Growth (+4,814 residents)
-8.3%
0.1% 2.0%6.9%9.7%
-4.2%
-16.0%
-1.4%
7.1% 4.2%
+15 3% +8 5%
88
-23.3%0-17 18-24 25-34 35-44 45-64 65-74 75-84 85+ 0-17 18-24 25-34 35-44 45-64 65-74 75-84 85+
+15.3% +8.5%
Source: Thomson Reuters; accessed November 5, 2010PSA = Primary Service Area; SSA-I = Secondary Service Area-I; SSA-II = Secondary Service Area-II

Relationship Between Utilization and AgingService Area
/ /Inpatient Discharges ‐Med/Surg Utilization/1,000 Population
5X
472.83X
288.32X
175.3
288.3
23.3 25.090.1
99
0-17 18-44 45-64 65-74 75-84 85+
Source: SPARCSver06.21.2010adj/ja
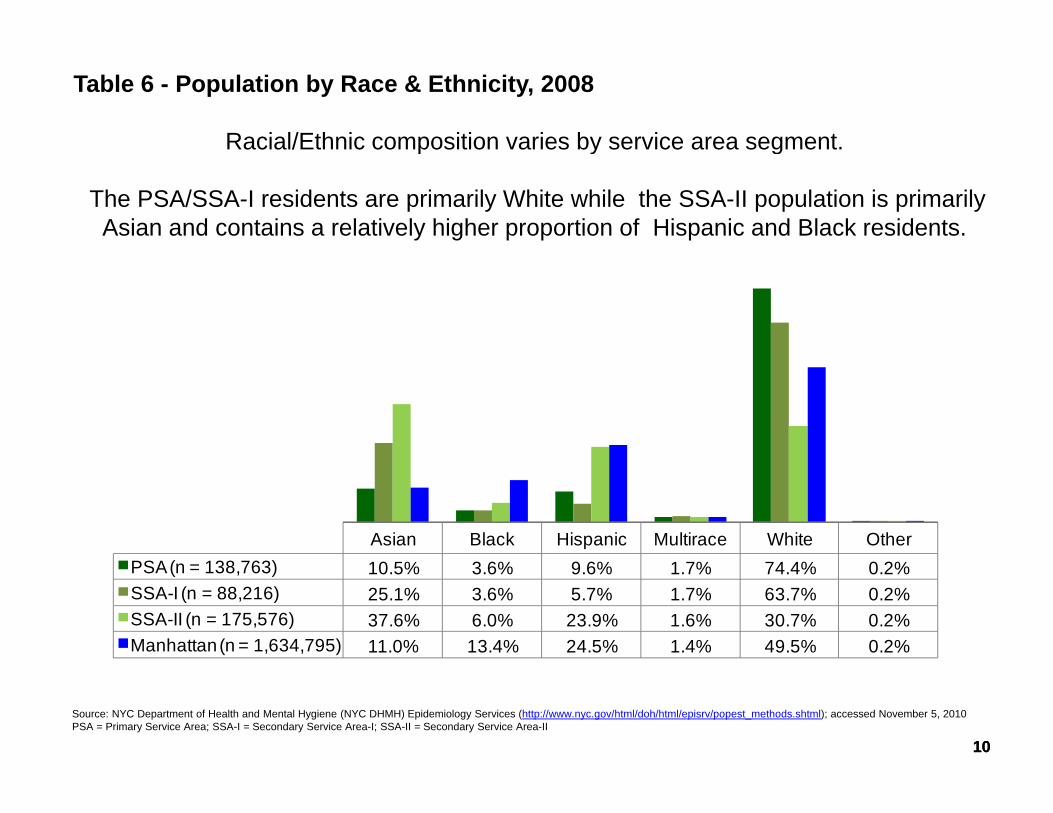
Table 6 - Population by Race & Ethnicity, 2008
Racial/Ethnic composition varies by service area segment. p y g
The PSA/SSA-I residents are primarily White while the SSA-II population is primarily Asian and contains a relatively higher proportion of Hispanic and Black residents.
Asian Black Hispanic Multirace White OtherPSA( 138 763)PSA (n = 138,763) 10.5% 3.6% 9.6% 1.7% 74.4% 0.2%SSA-I (n = 88,216) 25.1% 3.6% 5.7% 1.7% 63.7% 0.2%SSA-II (n = 175,576) 37.6% 6.0% 23.9% 1.6% 30.7% 0.2%Manhattan (n = 1,634,795) 11.0% 13.4% 24.5% 1.4% 49.5% 0.2%
1010
Source: NYC Department of Health and Mental Hygiene (NYC DHMH) Epidemiology Services (http://www.nyc.gov/html/doh/html/episrv/popest_methods.shtml); accessed November 5, 2010PSA = Primary Service Area; SSA-I = Secondary Service Area-I; SSA-II = Secondary Service Area-II
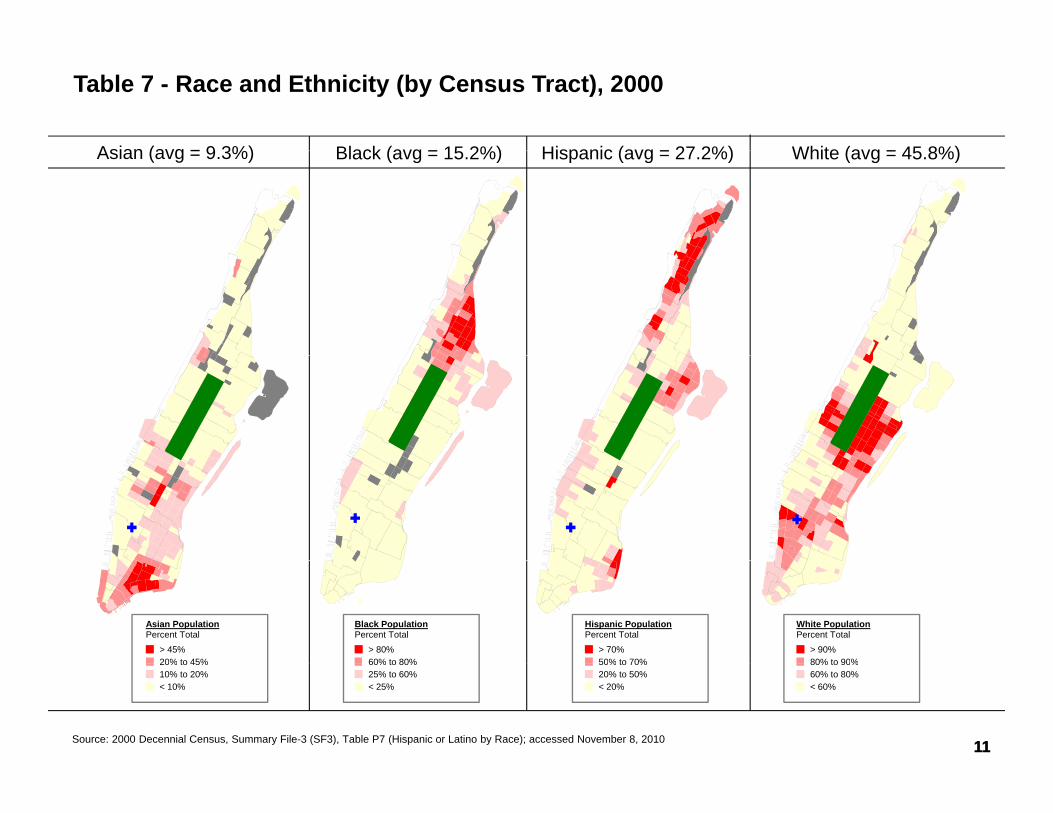
Table 7 - Race and Ethnicity (by Census Tract), 2000
Asian (avg = 9 3%) Black (avg = 15 2%) Hispanic (avg = 27 2%) White (avg = 45 8%)Asian (avg = 9.3%) Black (avg = 15.2%) Hispanic (avg = 27.2%) White (avg = 45.8%)
Asian PopulationPercent Total
> 45%20% to 45%
Black PopulationPercent Total
> 80%60% to 80%
Hispanic PopulationPercent Total
> 70%50% to 70%
White PopulationPercent Total
> 90%80% to 90%
1111
20% to 45%10% to 20%< 10%
60% to 80%25% to 60%< 25%
Source: 2000 Decennial Census, Summary File-3 (SF3), Table P7 (Hispanic or Latino by Race); accessed November 8, 2010
50% to 70%20% to 50%< 20%
80% to 90%60% to 80%< 60%

Table 8 - Race and Ethnicity by Census Tract, 2000 (below 58th Street)
Asian Black Hispanic White
> 50%
LegendRace and Ethnicity
1212
25% to 50%
10% to 25%
< 10%Source: 2000 Decennial Census, Summary File-3 (SF3), Table P7 (Hispanic or Latino by Race); accessed November 8, 2010

Table 9 - Population Growth by Race & Ethnicity, Service Area and Manhattan 2010-2015
Overall, the Service Area population is projected to experience double digit decreases in Hispanic and Black populations, double digit increases in Multirace and
single digit increases in Other categories.
Service Area+2.2% Growth
Manhattan+2.5% Growth
9.8%15.4%
6.1% 5.7%7.4% 6.2% 4.4% 4.8%
-6.9% -4.0%
-13.9% -16.1%
Asian Black Hispanic Multirace Other White Asian Black Hispanic Multirace Other White
Asian Black Hispanic Multirace Other WhiteAsian Black Hispanic Multirace Other White
Asian Black Hispanic Multirace Other White Asian Black Hispanic Multirace Other White
1313
pp
Source: Thomson Reuters; accessed November 5, 2010PSA = Primary Service Area; SSA-I = Secondary Service Area-I; SSA-II = Secondary Service Area-II

Table 10 - Population Growth by Race & Ethnicity, PSA & SSA, 2010-2015
P i S i A S d S i A
7.5% 7.2% 5.6% 6.0%7.0% 4.0% 1 2% 3.5%
Primary Service Area+1.6% Growth
Secondary Service Area+2.5% Growth
-12.8% -14.8%-17.2%
-21.9%
1.2%
Asian Black Hispanic Multirace Other WhiteAsian Black Hispanic Multirace Other White
Secondary Service Area-I Secondary Service Area-II
Asian Black Hispanic Multirace Other White Asian Black Hispanic Multirace Other White
2.4% 3.1%7.6%
4.0%9.0% 9.1%
3.6%7.7%
Secondary Service Area I+2.0% Growth
Secondary Service Area II+2.8% Growth
-17.8% -20.3%
-11.6% -14.2%
1414
Asian Black Hispanic Multirace Other White Asian Black Hispanic Multirace Other White
Source: Thomson Reuters; accessed November 5, 2010PSA = Primary Service Area; SSA-I = Secondary Service Area-I; SSA-II = Secondary Service Area-II

1515
1616

Table 11 - Languages Spoken at Home, Service Area and Manhattan, 2000
Top three languages spoken at home other than English are Chinese, Spanish or p g g p g , pFrench (including Patois/Cajun).
Service Area Manhattan
Language SpokenTotal
Manhattan% Total
ManhattanSpeak only English 849,603 58.1%
Language SpokenTotal
Service Area% Total
Service AreaSpeak only English 197,237 56.7% p y g ,
Spanish or Spanish Creole 364,141 24.9%Chinese 75,876 5.2%French (incl. Patois, Cajun) 32,200 2.2%German 13,053 0.9%
p y g ,Chinese 59,698 17.2%Spanish or Spanish Creole 51,919 14.9%French (incl. Patois, Cajun) 6,229 1.8%Italian 4,181 1.2%
Japanese 12,515 0.9%Italian 12,319 0.8%Hebrew 10,077 0.7%Russian 9,144 0.6%K 7 816 0 5%
Japanese 3,401 1.0%German 2,528 0.7%Other Indic languages 1,991 0.6%Hebrew 1,783 0.5%O h Sl i l 1 4 0 % Korean 7,816 0.5%
Total 1,462,015 100.0%Other Slavic languages 1,754 0.5%Total 347,867 100.0%
1717Source: 2000 Decennial Census, Summary File-3 (SF3), Table PCT10 (Age by Language Spoken at Home for the Population of 5+ Years); accessed November 8, 2010

Table 12 - Languages Spoken at Home, PSA and SSA, 2000
Primary Service Area Secondary Service Area
Language SpokenTotal SSA
% Total SSA
Speak only English 109,452 47.9%Chinese 54,530 23.9%
Languages SpokenTotal PSA
% Total PSA
Speak only English 87,785 73.6%Spanish or Spanish Creole 11,590 9.7%
Primary Service Area Secondary Service Area
Spanish or Spanish Creole 40,329 17.6%French (incl. Patois, Cajun) 3,072 1.3%Italian 2,023 0.9%Japanese 1,958 0.9%Other Indic languages 1,838 0.8%Other Slavic languages 1,571 0.7%
Chinese 5,168 4.3%French (incl. Patois, Cajun) 3,157 2.6%Italian 2,158 1.8%Japanese 1,443 1.2%German 1,040 0.9%Korean 673 0.6%
German 1,488 0.7%Tagalog 1,427 0.6%Total 228,521 100.0%
Hebrew 658 0.6%Portuguese or Portuguese Creole 615 0.5%Total 119,346 100.0%
Secondary Service Area-I Secondary Service Area-II
Language SpokenTotal
SSA-II% Total SSA-II
Speak only English 60,619 39.9%Chinese 43,023 28.3%Spanish or Spanish Creole 35,495 23.3%
Language SpokenTotal SSA-I
% Total SSA-I
Speak only English 48,833 63.9%Chinese 11,507 15.1%Spanish or Spanish Creole 4,834 6.3% Spanish or Spanish Creole 35,495 23.3%
Other Indic languages 1,321 0.9%French (incl. Patois, Cajun) 1,266 0.8%Yiddish 981 0.6%Italian 940 0.6%Polish 906 0.6%Tagalog 902 0.6%
p p ,French (incl. Patois, Cajun) 1,806 2.4%Japanese 1,208 1.6%Italian 1,083 1.4%Other Slavic languages 879 1.1%German 717 0.9%Tagalog 525 0.7%
1818
g gGerman 771 0.5%Total 152,066 100.0%
g gKorean 520 0.7%Total 76,455 100.0%
Source: 2000 Decennial Census, Summary File-3 (SF3), Table PCT10 (Age by Language Spoken at Home for the Population of 5+ Years); accessed November 8, 2010

Table 13 - Median Household Income, 2000 – 2015
The Median Household Income of the PSA is significantly higher thang y gthe rest of the Service Area, a trend which is projected to continue.
2000 2010 2015PSA $61 557 $87 932 $99 986PSA $61,557 $87,932 $99,986 SSA-I $50,654 $73,245 $83,446 SSA-II $31,406 $48,751 $55,795 Manhattan $49 963 $80 592 $78 156
1919
Manhattan $49,963 $80,592 $78,156
Source: Thomson Reuters; accessed November 23, 2010

Table 14 - Poverty Level, 2000
The Service Area contains pockets of povertyp p ywhich are primarily located in the SSA-II.
Income Above Poverty LevelPercent Total
94.7 to 10092.2 to 94.788.5 to 92.280.2 to 88.5
Poverty StatusPercent Total
Income Below Poverty Level (20%)Income Above Poverty Level (80%)
Income Below Poverty LevelPercent Total
43.9 to 67.735.8 to 43.929.6 to 35.820 8 to 29 6
2020
20.8 to 29.6
Source: 2000 Decennial Census, Summary File-3 (SF3), Table P87 (Poverty Status in 1999)Accessed November 8, 2010

Table 15 - Education Attainment, 2000
Educational attainment varies within the Service Area. The PSA contains the highest proportion of residents with
some college, a Bachelor’s degree or higher.
PSA (n = 101,833)
SSA-I (n = 58,663)
SSA-II (n = 113,392)
Manhattan (n = 1,125,987)
Less than high school graduate 8.6% 15.7% 39.3% 21.3%High school graduate 9.4% 9.6% 16.5% 13.5%Some college or associate degree 14.9% 13.8% 15.0% 15.8%Bachelor's degree or higher 67.1% 60.9% 29.2% 49.4%
2121Source: 2000 Decennial Census, Summary File-3 (SF3), Table QTP20 (Education Attainment by Sex); accessed November 23, 2010
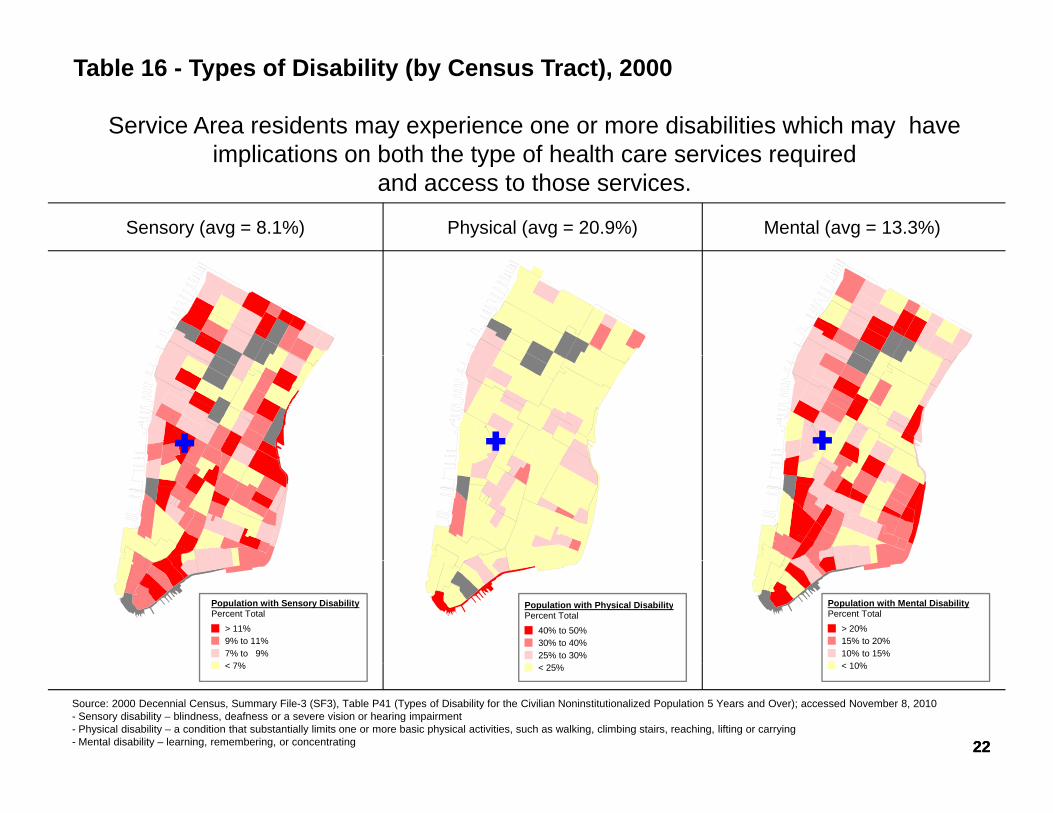
Table 16 - Types of Disability (by Census Tract), 2000
Service Area residents may experience one or more disabilities which may have implications on both the type of health care services required
Sensory (avg = 8.1%)
implications on both the type of health care services required and access to those services.
Physical (avg = 20.9%) Mental (avg = 13.3%)
Population with Sensory DisabilityPercent Total
> 11%9% to 11%7% to 9%
7%
Population with Physical DisabilityPercent Total
40% to 50%30% to 40%25% to 30%
Population with Mental DisabilityPercent Total
> 20%15% to 20%10% to 15%
10%
2222
Source: 2000 Decennial Census, Summary File-3 (SF3), Table P41 (Types of Disability for the Civilian Noninstitutionalized Population 5 Years and Over); accessed November 8, 2010- Sensory disability – blindness, deafness or a severe vision or hearing impairment- Physical disability – a condition that substantially limits one or more basic physical activities, such as walking, climbing stairs, reaching, lifting or carrying- Mental disability – learning, remembering, or concentrating
< 7% < 25% < 10%

HEALTHa state of complete physical, mental and social
well‐being and not merely the absence of disease or infirmity.
HEALTH CAREHEALTH CAREthe prevention, treatment, and management of
ill d h i f l d h i lillness and the preservation of mental and physical well‐being through the services offered by the
di l d lli d h l h f i
232323
medical and allied health professions
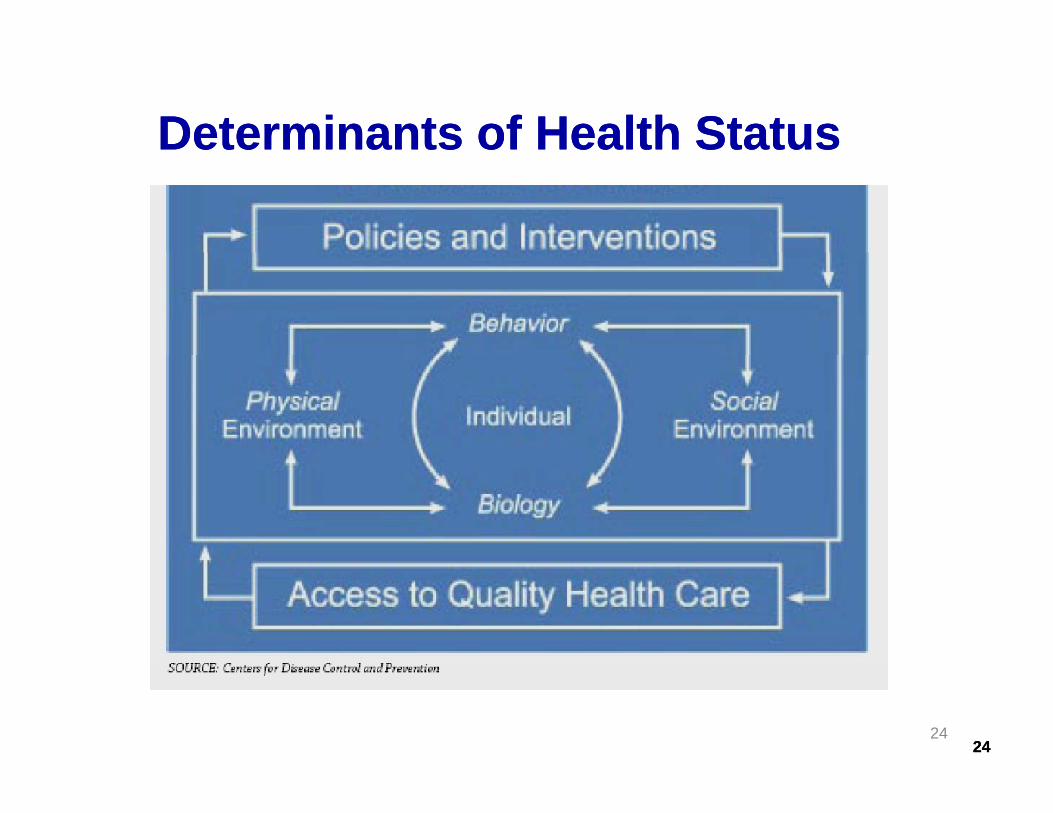
Determinants Determinants of of Health StatusHealth Status
242424

Death Rate Trend for the City of New York Death Rate Trend for the City of New York 18001800‐‐20082008
2525

Leading Causes of Death in NYC 2007Leading Causes of Death in NYC, 2007
• Heart diseaseC• Cancer
• Influenza and Pneumonia• Stroke• Diabetes• Chronic lower respiratory disease• HIV• HIV• Accidents • Accidental Drug Poisoning /Substance Abuse
• Source: New York City Department of Health and Mental Hygiene Epidemiology Services – EpiQuery NYC Interactive Data• Vital Statistics Death/Mortality Data (2000-2007) (https://a816-healthpsi.nyc.gov/epiquery/EpiQuery/VS/index.html) accessed 11/24/2010
2626

• Tobacco• Obesity Actual y• Alcohol Consumption• Microbial Agents (bacteria, virus)
Causes f D th• Toxic Agents (pollutants)
• Secondhand SmokeM t V hi l C h
of Death
• Motor Vehicle Crashes• Firearms• Sexual BehaviorSexual Behavior• Illegal Drug Use
Source: Centers for Disease Control and Prevention
2727

Table 16 Service Area Mortality Rate, 2007Age adjusted per 100,000 Population
Chelsea/Clinton Greenwich Village/SoHo Lower East Side Lower
Manhattan Manhattan NYC
2002 670.0 580.0 680.0 620.0 700.0 780.02007 640.0 540.0 630.0 770.0 630.0 710.0
2828
Source: New York City Department of Health and Mental Hygiene Epidemiology Services – EpiQuery NYC Interactive DataVital Statistics Death/Mortality Data (2000-2007) (https://a816-healthpsi.nyc.gov/epiquery/EpiQuery/VS/index.html)
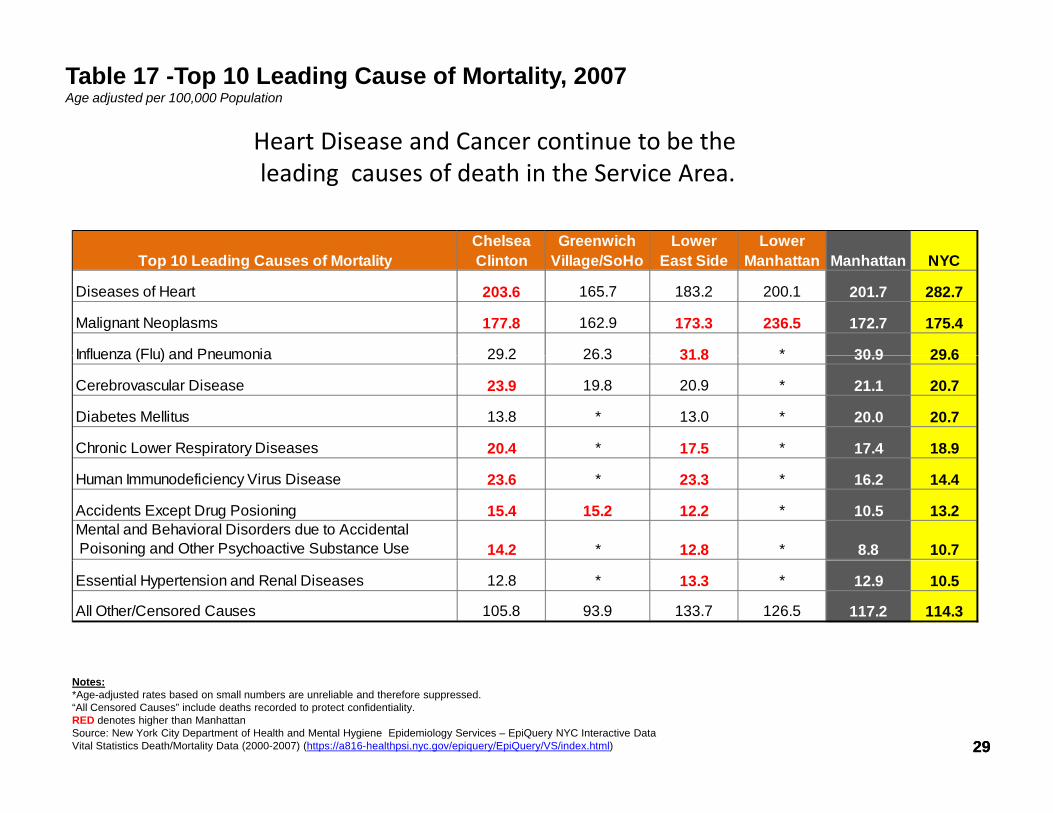
Table 17 -Top 10 Leading Cause of Mortality, 2007Age adjusted per 100,000 Population
Heart Disease and Cancer continue to be theleading causes of death in the Service Area.
Chelsea Greenwich Lower Lower Top 10 Leading Causes of Mortality Clinton Village/SoHo East Side Manhattan Manhattan NYC
Diseases of Heart 203.6 165.7 183.2 200.1 201.7 282.7
Malignant Neoplasms 177.8 162.9 173.3 236.5 172.7 175.4
Influenza (Flu) and Pneumonia 29 2 26 3 31 8 * 30 9 29 6Influenza (Flu) and Pneumonia 29.2 26.3 31.8 30.9 29.6
Cerebrovascular Disease 23.9 19.8 20.9 * 21.1 20.7
Diabetes Mellitus 13.8 * 13.0 * 20.0 20.7
Chronic Lower Respiratory Diseases 20.4 * 17.5 * 17.4 18.9
Human Immunodeficiency Virus Disease 23.6 * 23.3 * 16.2 14.4
Accidents Except Drug Posioning 15.4 15.2 12.2 * 10.5 13.2Mental and Behavioral Disorders due to Accidental Poisoning and Other Psychoactive Substance Use 14.2 * 12.8 * 8.8 10.7
Essential Hypertension and Renal Diseases 12.8 * 13.3 * 12.9 10.5
All Other/Censored Causes 105.8 93.9 133.7 126.5 117.2 114.3
2929
Notes:*Age-adjusted rates based on small numbers are unreliable and therefore suppressed.“All Censored Causes” include deaths recorded to protect confidentiality.RED denotes higher than ManhattanSource: New York City Department of Health and Mental Hygiene Epidemiology Services – EpiQuery NYC Interactive DataVital Statistics Death/Mortality Data (2000-2007) (https://a816-healthpsi.nyc.gov/epiquery/EpiQuery/VS/index.html)

Redefining the Service Area for Health Status Survey Responses(United Hospital Fund Neighborhoods) Chelsea/Greenwich Village
(UHF 306 & 308)• 1 0 0 0 1
1 0 0 1 1• 1 0 0 1 1• 1 0 0 1 2• 1 0 0 1 3• 1 0 0 1 4• 10018• 10019• 10020
10036
Washington Heights-InwoodUpper West Side
• 10036
g g(UHF 301)
Upper West Side(UHF 304)
Upper East Side(UHF 305)
East Harlem(UHF 303)
GP-MH(UHF 307)
Chelsea-Clinton(UHF 306) CH-MH
(UHF 302)GV-SoHo(UHF 308)LM
(UHF 310)(UHF 305) (UHF 303)(UHF 307)US-LES
(UHF 309)
Union Square/Lower Manhattan
Primary Service Area
Legend
10 Neighborhoods (UHF10)ABC
7 Neighborhoods (UHF7)ABC
Upper East Side/Gramercy(UHF 305 & 307)• 10010• 10016• 10017• 10021• 10022
• 10065• 10075• 10128• 10162• 10165
Union Square/Lower Manhattan(UHF 309 & 210)• 1 0 0 0 2• 1 0 0 0 3• 10004• 10005• 10006• 10007
3030
Primary Service Area
Secondary Service Area ‐ I
Secondary Service Area ‐ II
• 10022• 10028• 10044
• 10165• 10170• 10171
• 10007• 1 0 0 0 9• 1 0 0 3 8• 10048• 10280• 10282
Source: United Hospital Fund

G E N E R A L P H Y S I C A L A N D M E N T A L H E A L T HS e l f - r e p o r t e d h e a l t h s t a t u sQ: Would you say that in general your health is Excellent, Very Good, Good, Fair or Poor?
19 5% 28 7% 32 4% 19 5%
Excellent Very Good Good Fair or Poor
New York City
26.8%
19.5%
33.4%
28.7%
26.9%
32.4%
12.9%
19.5%
Manhattan
New York City
22.5% 32.2% 26.9% 18.3%Union Square/Lower Manhattan
30.0% 35.2% 25.9% 9.1%
0 0% 20 0% 40 0% 60 0% 80 0% 100 0%
Chelsea/Greenwich Village
Notes:Total estimated populations may not equal the sum of subgroup estimated populations due to rounding or missing data.Population estimates are NOT age adjusted but all percents are age adjusted
0.0% 20.0% 40.0% 60.0% 80.0% 100.0%
3131
Population estimates are NOT age adjusted, but all percents are age adjusted.Confidence Intervals (CIs) are a measure of estimate precision: the wider the CI, the more impressive the estimate.*Estimate should be interpreted with caution. Estimate’s Relative Standard Error (a measure of estimate precision) is greater than 30% or the sample size is less than 50, making the estimate potentially unreliable.#Data are suppressed due to imprecise and unreliable estimates.Source: New York City Department of Health and Mental Hygiene Epidemiology Services – EpiQuery NYC Interactive Data, 2009 Community Health Survey (https://a816-healthpsi.nyc.gov/epiquery/EpiQuery/CHS/index2009.html)

G E N E R A L P H Y S I C A L A N D M E N T A L H E A L T HM e n t a l h e a l t h c o u n s e l i n g o r t r e a t m e n tQ: In the last 12 months, have you received any counseling or taken a prescription medication for a mental health problem? Results restricted to adults with non-specific psychological distress.
33 4% 66 6%
Yes No
New York City
38.1%
33.4%
61.9%
66.6%
Manhattan
New York City
31.7% 68.3%Union Square/Lower Manhattan * *
53.2% 46.8%
0 0% 20 0% 40 0% 60 0% 80 0% 100 0%
Chelsea/Greenwich Village * *
0.0% 20.0% 40.0% 60.0% 80.0% 100.0%
Notes:Total estimated populations may not equal the sum of subgroup estimated populations due to rounding or missing data.Population estimates are NOT age adjusted but all percents are age adjusted
3232
Population estimates are NOT age adjusted, but all percents are age adjusted.Confidence Intervals (CIs) are a measure of estimate precision: the wider the CI, the more impressive the estimate.*Estimate should be interpreted with caution. Estimate’s Relative Standard Error (a measure of estimate precision) is greater than 30% or the sample size is less than 50, making the estimate potentially unreliable.#Data are suppressed due to imprecise and unreliable estimates.Source: New York City Department of Health and Mental Hygiene Epidemiology Services – EpiQuery NYC Interactive Data, 2009 Community Health Survey (https://a816-healthpsi.nyc.gov/epiquery/EpiQuery/CHS/index2009.html)
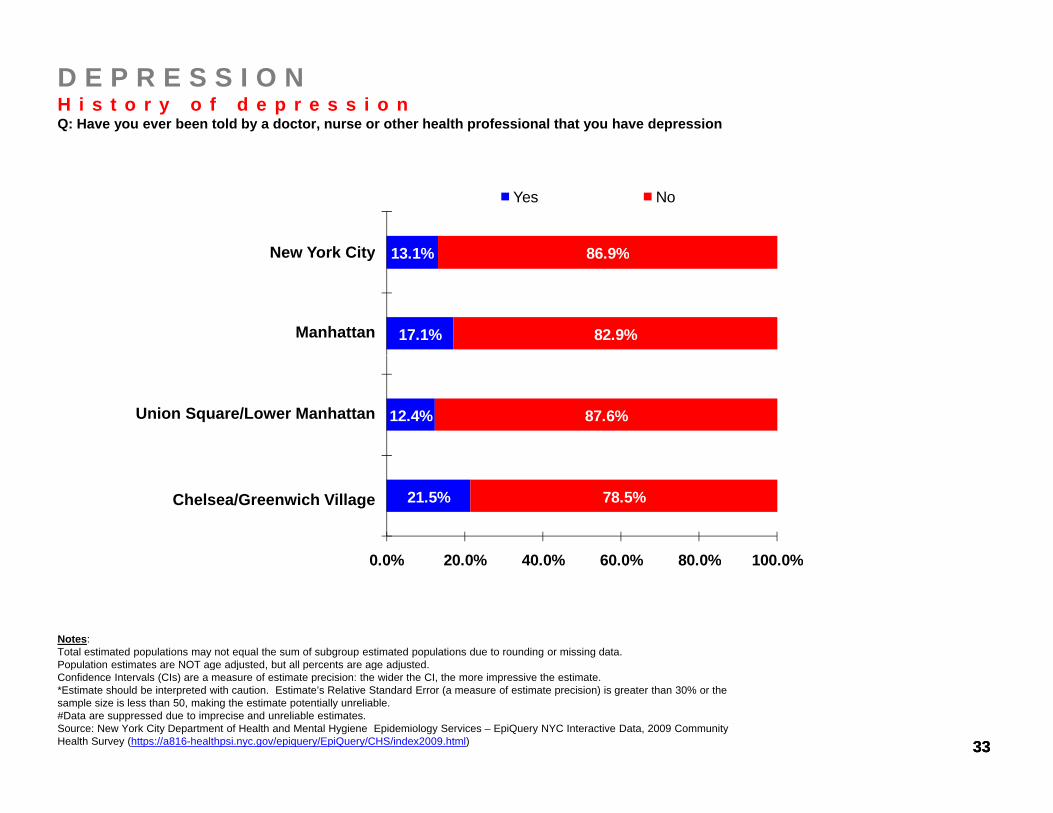
D E P R E S S I O NH i s t o r y o f d e p r e s s i o nQ: Have you ever been told by a doctor, nurse or other health professional that you have depression
13 1% 86 9%
Yes No
New York City
17.1%
13.1%
82.9%
86.9%
Manhattan
New York City
12.4% 87.6%Union Square/Lower Manhattan
21.5% 78.5%
0 0% 20 0% 40 0% 60 0% 80 0% 100 0%
Chelsea/Greenwich Village
Notes:Total estimated populations may not equal the sum of subgroup estimated populations due to rounding or missing data.Population estimates are NOT age adjusted but all percents are age adjusted
0.0% 20.0% 40.0% 60.0% 80.0% 100.0%
3333
Population estimates are NOT age adjusted, but all percents are age adjusted.Confidence Intervals (CIs) are a measure of estimate precision: the wider the CI, the more impressive the estimate.*Estimate should be interpreted with caution. Estimate’s Relative Standard Error (a measure of estimate precision) is greater than 30% or the sample size is less than 50, making the estimate potentially unreliable.#Data are suppressed due to imprecise and unreliable estimates.Source: New York City Department of Health and Mental Hygiene Epidemiology Services – EpiQuery NYC Interactive Data, 2009 Community Health Survey (https://a816-healthpsi.nyc.gov/epiquery/EpiQuery/CHS/index2009.html)

W E I G H T , E X E R C I S E , N U T R I T I O NO v e r w e i g h t a n d O b e s i t yBody Mass Index (BMI) is calculated based on respondents’ self-reported weight and height. A BMI between 25.0 and 29.9 is classified as overweight, and a BMI of 30 or greater is classified as obese.
43 3% 33 5% 23 3%
Under/normal weight Overweight but not obese Obese
New York City
54.1%
43.3%
29.4%
33.5%
16.5%
23.3%
Manhattan
New York City
57.6% 26.6% 15.8%Union Square/Lower Manhattan
63.4% 28.2% 8.4%
0 0% 20 0% 40 0% 60 0% 80 0% 100 0%
Chelsea/Greenwich Village
0.0% 20.0% 40.0% 60.0% 80.0% 100.0%
Notes:Total estimated populations may not equal the sum of subgroup estimated populations due to rounding or missing data.Population estimates are NOT age adjusted but all percents are age adjusted
3434
Population estimates are NOT age adjusted, but all percents are age adjusted.Confidence Intervals (CIs) are a measure of estimate precision: the wider the CI, the more impressive the estimate.*Estimate should be interpreted with caution. Estimate’s Relative Standard Error (a measure of estimate precision) is greater than 30% or the sample size is less than 50, making the estimate potentially unreliable.#Data are suppressed due to imprecise and unreliable estimates.Source: New York City Department of Health and Mental Hygiene Epidemiology Services – EpiQuery NYC Interactive Data, 2009 Community Health Survey (https://a816-healthpsi.nyc.gov/epiquery/EpiQuery/CHS/index2009.html)
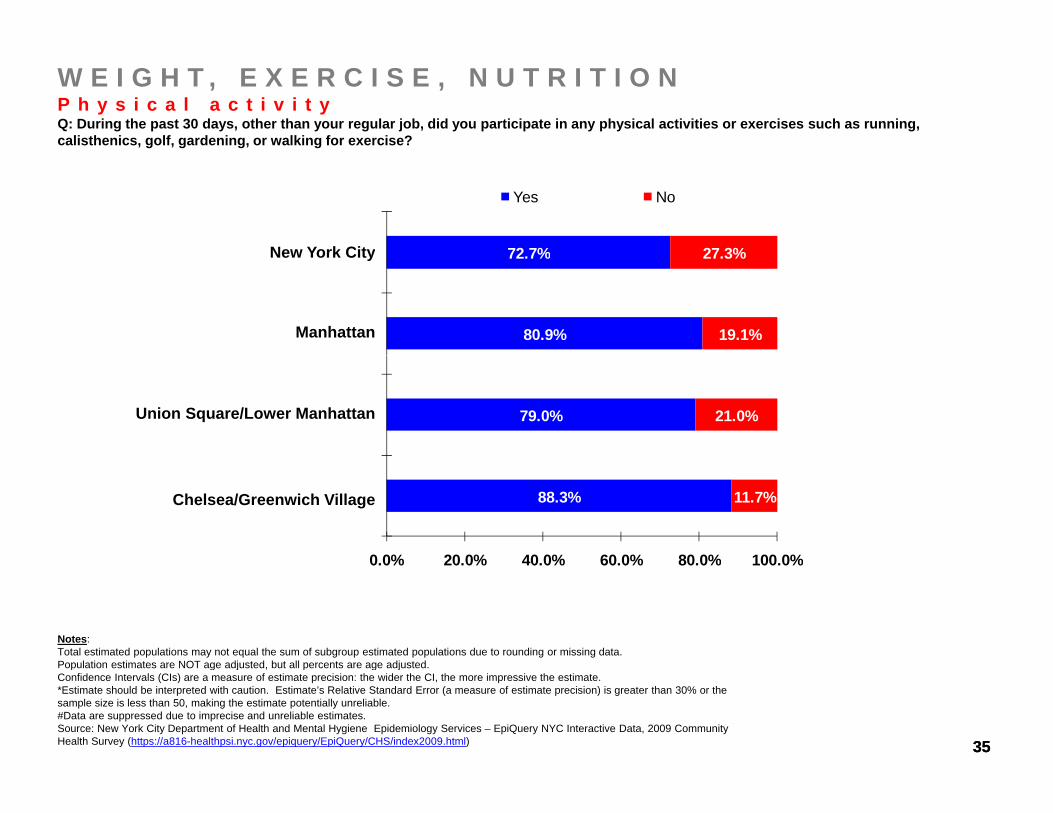
W E I G H T , E X E R C I S E , N U T R I T I O NP h y s i c a l a c t i v i t yQ: During the past 30 days, other than your regular job, did you participate in any physical activities or exercises such as running, calisthenics, golf, gardening, or walking for exercise?
New York City 72 7% 27 3%
Yes No
Manhattan
New York City
80.9%
72.7%
19.1%
27.3%
Union Square/Lower Manhattan 79.0% 21.0%
Chelsea/Greenwich Village 88.3% 11.7%
0 0% 20 0% 40 0% 60 0% 80 0% 100 0%
Notes:Total estimated populations may not equal the sum of subgroup estimated populations due to rounding or missing data.Population estimates are NOT age adjusted but all percents are age adjusted
0.0% 20.0% 40.0% 60.0% 80.0% 100.0%
3535
Population estimates are NOT age adjusted, but all percents are age adjusted.Confidence Intervals (CIs) are a measure of estimate precision: the wider the CI, the more impressive the estimate.*Estimate should be interpreted with caution. Estimate’s Relative Standard Error (a measure of estimate precision) is greater than 30% or the sample size is less than 50, making the estimate potentially unreliable.#Data are suppressed due to imprecise and unreliable estimates.Source: New York City Department of Health and Mental Hygiene Epidemiology Services – EpiQuery NYC Interactive Data, 2009 Community Health Survey (https://a816-healthpsi.nyc.gov/epiquery/EpiQuery/CHS/index2009.html)

C H R O N I C C O N D I T I O N SH i g h b l o o d p r e s s u r e e v e rQ: Have you ever been told by a doctor, nurse or other health professional that you have hypertension, also called high blood pressure?
New York City 28 3% 71 7%
Yes No
Manhattan
New York City
22.8%
28.3%
77.2%
71.7%
Union Square/Lower Manhattan 21.2% 78.8%
Chelsea/Greenwich Village 20.0% 80.0%
0 0% 20 0% 40 0% 60 0% 80 0% 100 0%
Notes:Total estimated populations may not equal the sum of subgroup estimated populations due to rounding or missing data.Population estimates are NOT age adjusted but all percents are age adjusted
0.0% 20.0% 40.0% 60.0% 80.0% 100.0%
3636
Population estimates are NOT age adjusted, but all percents are age adjusted.Confidence Intervals (CIs) are a measure of estimate precision: the wider the CI, the more impressive the estimate.*Estimate should be interpreted with caution. Estimate’s Relative Standard Error (a measure of estimate precision) is greater than 30% or the sample size is less than 50, making the estimate potentially unreliable.#Data are suppressed due to imprecise and unreliable estimates.Source: New York City Department of Health and Mental Hygiene Epidemiology Services – EpiQuery NYC Interactive Data, 2009 Community Health Survey (https://a816-healthpsi.nyc.gov/epiquery/EpiQuery/CHS/index2009.html)

C H R O N I C C O N D I T I O N SB l o o d p r e s s u r e m e d i c a t i o n e v e rQ: Have you ever been told by a doctor, nurse or other health professional that you need to take medication for your high blood pressure?
New York City 71 1% 28 9%
Yes No
Manhattan
New York City
69.4%
71.1%
30.6%
28.9%
Union Square/Lower Manhattan 70.8% 29.2%* *
Chelsea/Greenwich Village 86.2% 13.8%
0 0% 20 0% 40 0% 60 0% 80 0% 100 0%
* *
Notes:Total estimated populations may not equal the sum of subgroup estimated populations due to rounding or missing data.Population estimates are NOT age adjusted but all percents are age adjusted
0.0% 20.0% 40.0% 60.0% 80.0% 100.0%
3737
Population estimates are NOT age adjusted, but all percents are age adjusted.Confidence Intervals (CIs) are a measure of estimate precision: the wider the CI, the more impressive the estimate.*Estimate should be interpreted with caution. Estimate’s Relative Standard Error (a measure of estimate precision) is greater than 30% or the sample size is less than 50, making the estimate potentially unreliable.#Data are suppressed due to imprecise and unreliable estimates.Source: New York City Department of Health and Mental Hygiene Epidemiology Services – EpiQuery NYC Interactive Data, 2009 Community Health Survey (https://a816-healthpsi.nyc.gov/epiquery/EpiQuery/CHS/index2009.html)

C H R O N I C C O N D I T I O N SD i a b e t e s e v e rQ: Have you ever been told by a doctor, nurse or other health professional that you have diabetes?
New York City 9 7%90 3%
No Yes
Manhattan
New York City
7.7%
9.7%
92.3%
90.3%
Union Square/Lower Manhattan 11.9%88.1%
Chelsea/Greenwich Village 3.0%97.7%
0 0% 20 0% 40 0% 60 0% 80 0% 100 0%
Notes:Total estimated populations may not equal the sum of subgroup estimated populations due to rounding or missing data.Population estimates are NOT age adjusted but all percents are age adjusted
0.0% 20.0% 40.0% 60.0% 80.0% 100.0%
3838
Population estimates are NOT age adjusted, but all percents are age adjusted.Confidence Intervals (CIs) are a measure of estimate precision: the wider the CI, the more impressive the estimate.*Estimate should be interpreted with caution. Estimate’s Relative Standard Error (a measure of estimate precision) is greater than 30% or the sample size is less than 50, making the estimate potentially unreliable.#Data are suppressed due to imprecise and unreliable estimates.Source: New York City Department of Health and Mental Hygiene Epidemiology Services – EpiQuery NYC Interactive Data, 2009 Community Health Survey (https://a816-healthpsi.nyc.gov/epiquery/EpiQuery/CHS/index2009.html)
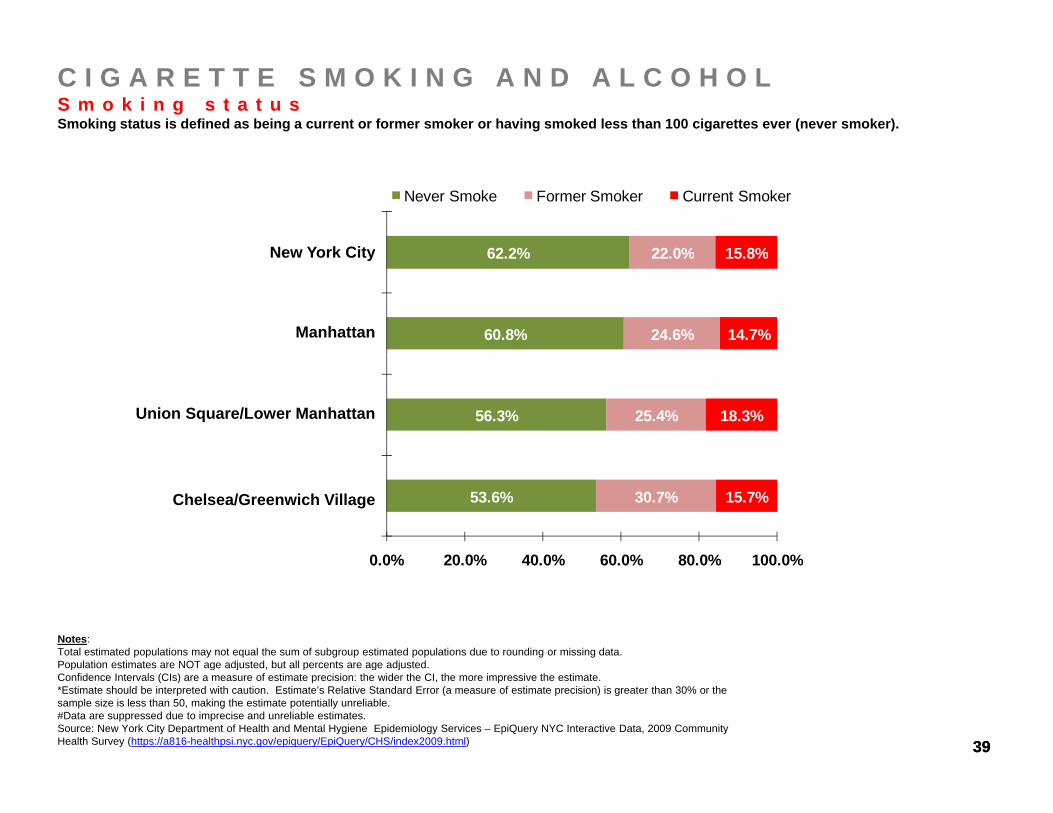
C I G A R E T T E S M O K I N G A N D A L C O H O LS m o k i n g s t a t u sSmoking status is defined as being a current or former smoker or having smoked less than 100 cigarettes ever (never smoker).
New York City 62 2% 15 8%22 0%
Never Smoke Former Smoker Current Smoker
Manhattan
New York City
60.8%
62.2%
14.7%
15.8%
24.6%
22.0%
Union Square/Lower Manhattan 56.3% 18.3%25.4%
Chelsea/Greenwich Village 53.6% 15.7%30.7%
0 0% 20 0% 40 0% 60 0% 80 0% 100 0%
Notes:Total estimated populations may not equal the sum of subgroup estimated populations due to rounding or missing data.Population estimates are NOT age adjusted but all percents are age adjusted
0.0% 20.0% 40.0% 60.0% 80.0% 100.0%
3939
Population estimates are NOT age adjusted, but all percents are age adjusted.Confidence Intervals (CIs) are a measure of estimate precision: the wider the CI, the more impressive the estimate.*Estimate should be interpreted with caution. Estimate’s Relative Standard Error (a measure of estimate precision) is greater than 30% or the sample size is less than 50, making the estimate potentially unreliable.#Data are suppressed due to imprecise and unreliable estimates.Source: New York City Department of Health and Mental Hygiene Epidemiology Services – EpiQuery NYC Interactive Data, 2009 Community Health Survey (https://a816-healthpsi.nyc.gov/epiquery/EpiQuery/CHS/index2009.html)

C I G A R E T T E S M O K I N G A N D A L C O H O LH e a v y d r i n k i n gHeavy drinking is defined as an average of more than 2 drinks per day for men and more than 1 drink per day for women.
New York City 4 6%95 4%
No Yes
Manhattan
New York City
7.6%
4.6%
92.4%
95.4%
Union Square/Lower Manhattan 4.4%95.6%
Chelsea/Greenwich Village 11.5%88.5%
0 0% 20 0% 40 0% 60 0% 80 0% 100 0%
Notes:Total estimated populations may not equal the sum of subgroup estimated populations due to rounding or missing data.Population estimates are NOT age adjusted but all percents are age adjusted
0.0% 20.0% 40.0% 60.0% 80.0% 100.0%
4040
Population estimates are NOT age adjusted, but all percents are age adjusted.Confidence Intervals (CIs) are a measure of estimate precision: the wider the CI, the more impressive the estimate.*Estimate should be interpreted with caution. Estimate’s Relative Standard Error (a measure of estimate precision) is greater than 30% or the sample size is less than 50, making the estimate potentially unreliable.#Data are suppressed due to imprecise and unreliable estimates.Source: New York City Department of Health and Mental Hygiene Epidemiology Services – EpiQuery NYC Interactive Data, 2009 Community Health Survey (https://a816-healthpsi.nyc.gov/epiquery/EpiQuery/CHS/index2009.html)

C I G A R E T T E S M O K I N G A N D A L C O H O LB i n g e d r i n k i n gBinge drinking is defined as five or more drinks on one occasion in the past 30 days.
New York City 14 6%85 4%
No Yes
Manhattan
New York City
19.3%
14.6%
80.7%
85.4%
Union Square/Lower Manhattan 14.6%85.4%
Chelsea/Greenwich Village 31.3%68.7%
0 0% 20 0% 40 0% 60 0% 80 0% 100 0%
Notes:Total estimated populations may not equal the sum of subgroup estimated populations due to rounding or missing data.Population estimates are NOT age adjusted but all percents are age adjusted
0.0% 20.0% 40.0% 60.0% 80.0% 100.0%
4141
Population estimates are NOT age adjusted, but all percents are age adjusted.Confidence Intervals (CIs) are a measure of estimate precision: the wider the CI, the more impressive the estimate.*Estimate should be interpreted with caution. Estimate’s Relative Standard Error (a measure of estimate precision) is greater than 30% or the sample size is less than 50, making the estimate potentially unreliable.#Data are suppressed due to imprecise and unreliable estimates.Source: New York City Department of Health and Mental Hygiene Epidemiology Services – EpiQuery NYC Interactive Data, 2009 Community Health Survey (https://a816-healthpsi.nyc.gov/epiquery/EpiQuery/CHS/index2009.html)

A S T H M AA s t h m a e v e rQ: Have you ever been told by a doctor, nurse or other health professional that you had asthma?
New York City 11 5%88 5%
No Yes
Manhattan
New York City
11.6%
11.5%
88.4%
88.5%
Union Square/Lower Manhattan 10.7%89.3%
Chelsea/Greenwich Village 11.4%88.6%
0 0% 20 0% 40 0% 60 0% 80 0% 100 0%
Notes:Total estimated populations may not equal the sum of subgroup estimated populations due to rounding or missing data.Population estimates are NOT age adjusted but all percents are age adjusted
0.0% 20.0% 40.0% 60.0% 80.0% 100.0%
4242
Population estimates are NOT age adjusted, but all percents are age adjusted.Confidence Intervals (CIs) are a measure of estimate precision: the wider the CI, the more impressive the estimate.*Estimate should be interpreted with caution. Estimate’s Relative Standard Error (a measure of estimate precision) is greater than 30% or the sample size is less than 50, making the estimate potentially unreliable.#Data are suppressed due to imprecise and unreliable estimates.Source: New York City Department of Health and Mental Hygiene Epidemiology Services – EpiQuery NYC Interactive Data, 2009 Community Health Survey (https://a816-healthpsi.nyc.gov/epiquery/EpiQuery/CHS/index2009.html)

A S T H M AE D v i s i t s d u e t o a s t h m aQ: During the past 12 months, how many times did you visit an emergency room or urgent care center because of asthma?Results restricted to adults who reported having an asthma attack during the past 12 months.
49 3% 50 7%
1 (No. of Visits) 2 (No. of Visits)
New York City
72.2%
49.3%
27.8%
50.7%
Manhattan
New York City
85.2% 14.8%Union Square/Lower Manhattan **
0 0% 20 0% 40 0% 60 0% 80 0% 100 0%
Chelsea/Greenwich Village #
0.0% 20.0% 40.0% 60.0% 80.0% 100.0%
Notes:Total estimated populations may not equal the sum of subgroup estimated populations due to rounding or missing data.Population estimates are NOT age adjusted but all percents are age adjusted
4343
Population estimates are NOT age adjusted, but all percents are age adjusted.Confidence Intervals (CIs) are a measure of estimate precision: the wider the CI, the more impressive the estimate.*Estimate should be interpreted with caution. Estimate’s Relative Standard Error (a measure of estimate precision) is greater than 30% or the sample size is less than 50, making the estimate potentially unreliable.#Data are suppressed due to imprecise and unreliable estimates.Source: New York City Department of Health and Mental Hygiene Epidemiology Services – EpiQuery NYC Interactive Data, 2009 Community Health Survey (https://a816-healthpsi.nyc.gov/epiquery/EpiQuery/CHS/index2009.html)

H I V T E S T I N G , S E X U A L O R I E N TAT I O N A N D B E H AV I O RH I V T e s t i n gRespondents were asked if they had an HIV test in the past 12 months, or ever.
Tested in the past 12 months Tested more than 12 months ago
39 0% 35 7% %90.0%
100.0%
Tested more than 12 months ago Never tested
30.4% 35.7%32.6% 29.1%
39.0% 40.0% 35.7% 39.9%
40.0%
50.0%
60.0%
70.0%
80.0%
30.3% 24.3% 31.7% 31.0%
0.0%
10.0%
20.0%
30.0%
Ch l /G i h U i S /L M h tt N Y k Cit
Notes:Total estimated populations may not equal the sum of subgroup estimated populations due to rounding or missing data.Population estimates are NOT age adjusted but all percents are age adjusted
Chelsea/Greenwich Village
Union Square/Lower Manhattan
Manhattan New York City
4444
Population estimates are NOT age adjusted, but all percents are age adjusted.Confidence Intervals (CIs) are a measure of estimate precision: the wider the CI, the more impressive the estimate.*Estimate should be interpreted with caution. Estimate’s Relative Standard Error (a measure of estimate precision) is greater than 30% or the sample size is less than 50, making the estimate potentially unreliable.#Data are suppressed due to imprecise and unreliable estimates.Source: New York City Department of Health and Mental Hygiene Epidemiology Services – EpiQuery NYC Interactive Data, 2009 Community Health Survey (https://a816-healthpsi.nyc.gov/epiquery/EpiQuery/CHS/index2009.html)

H I V T E S T I N G , S E X U A L O R I E N TAT I O N A N D B E H AV I O RS e x u a l I d e n t i t y ( u n a d j u s t e d f o r a g e )Now I'll read a list of terms people sometimes use to describe themselves -- heterosexual or straight; homosexual, gay or lesbian; and bisexual. As I read the list again, please stop me when I get to the term that best describes how you think of yourself.
Heterosexual Gay or lesbian Bisexual
11.9% 5.3% 5.3% 2.9%0.5% 0.9% 1.0%
90.0%
100.0%
Heterosexual Gay or lesbian Bisexual
**
*
87.6% 91.9% 93.7% 96.1%40.0%
50.0%
60.0%
70.0%
80.0%
0.0%
10.0%
20.0%
30.0%
Ch l /G i h U i S /L M h tt N Y k Cit
Notes:Total estimated populations may not equal the sum of subgroup estimated populations due to rounding or missing data.Population estimates are NOT age adjusted but all percents are age adjusted
Chelsea/Greenwich Village
Union Square/Lower Manhattan
Manhattan New York City
4545
Population estimates are NOT age adjusted, but all percents are age adjusted.Confidence Intervals (CIs) are a measure of estimate precision: the wider the CI, the more impressive the estimate.*Estimate should be interpreted with caution. Estimate’s Relative Standard Error (a measure of estimate precision) is greater than 30% or the sample size is less than 50, making the estimate potentially unreliable.#Data are suppressed due to imprecise and unreliable estimates.Source: New York City Department of Health and Mental Hygiene Epidemiology Services – EpiQuery NYC Interactive Data, 2009 Community Health Survey (https://a816-healthpsi.nyc.gov/epiquery/EpiQuery/CHS/index2009.html)

C A N C E R S C R E E N I N GC o l o n c a n c e r ( t i m e l y c o l o n o s c o p y )Timely colon cancer screening is defined as having had a colonoscopy in the past 10 years. Results restricted to adults aged 50 and older.
66 0% 34 0%
Yes No
New York City
67.8%
66.0%
32.2%
34.0%
Manhattan
New York City
55.5% 44.5%Union Square/Lower Manhattan
71.0% 29.0%
0 0% 20 0% 40 0% 60 0% 80 0% 100 0%
Chelsea/Greenwich Village
Notes:Total estimated populations may not equal the sum of subgroup estimated populations due to rounding or missing data.Population estimates are NOT age adjusted but all percents are age adjusted
0.0% 20.0% 40.0% 60.0% 80.0% 100.0%
4646
Population estimates are NOT age adjusted, but all percents are age adjusted.Confidence Intervals (CIs) are a measure of estimate precision: the wider the CI, the more impressive the estimate.*Estimate should be interpreted with caution. Estimate’s Relative Standard Error (a measure of estimate precision) is greater than 30% or the sample size is less than 50, making the estimate potentially unreliable.#Data are suppressed due to imprecise and unreliable estimates.Source: New York City Department of Health and Mental Hygiene Epidemiology Services – EpiQuery NYC Interactive Data, 2009 Community Health Survey (https://a816-healthpsi.nyc.gov/epiquery/EpiQuery/CHS/index2009.html)

C A N C E R S C R E E N I N GB r e a s t c a n c e r ( t i m e l y m a m m o g r a p h y )Timely breast cancer screening is defined as having had a mammography in the past 2 years. Results restricted to women aged 40 and older.
New York City 78 5% 21 5%
Yes No
Manhattan
New York City
78.4%
78.5%
21.6%
21.5%
Union Square/Lower Manhattan 81.9% 18.1%
Chelsea/Greenwich Village 80.4% 19.6%
0 0% 20 0% 40 0% 60 0% 80 0% 100 0%
Notes:Total estimated populations may not equal the sum of subgroup estimated populations due to rounding or missing data.Population estimates are NOT age adjusted but all percents are age adjusted
0.0% 20.0% 40.0% 60.0% 80.0% 100.0%
4747
Population estimates are NOT age adjusted, but all percents are age adjusted.Confidence Intervals (CIs) are a measure of estimate precision: the wider the CI, the more impressive the estimate.*Estimate should be interpreted with caution. Estimate’s Relative Standard Error (a measure of estimate precision) is greater than 30% or the sample size is less than 50, making the estimate potentially unreliable.#Data are suppressed due to imprecise and unreliable estimates.Source: New York City Department of Health and Mental Hygiene Epidemiology Services – EpiQuery NYC Interactive Data, 2009 Community Health Survey (https://a816-healthpsi.nyc.gov/epiquery/EpiQuery/CHS/index2009.html)

C A N C E R S C R E E N I N GC e r v i c a l c a n c e r ( t i m e l y P a p t e s t )Timely cervical cancer screening is defined as having had a pap test in the past 3 years. Results restricted to women.
New York City 81 6% 18 4%
Yes No
Manhattan
New York City
81.3%
81.6%
18.7%
18.4%
Union Square/Lower Manhattan 68.9% 31.1%
Chelsea/Greenwich Village 76.5% 23.5%
0 0% 20 0% 40 0% 60 0% 80 0% 100 0%
Notes:Total estimated populations may not equal the sum of subgroup estimated populations due to rounding or missing data.Population estimates are NOT age adjusted but all percents are age adjusted
0.0% 20.0% 40.0% 60.0% 80.0% 100.0%
4848
Population estimates are NOT age adjusted, but all percents are age adjusted.Confidence Intervals (CIs) are a measure of estimate precision: the wider the CI, the more impressive the estimate.*Estimate should be interpreted with caution. Estimate’s Relative Standard Error (a measure of estimate precision) is greater than 30% or the sample size is less than 50, making the estimate potentially unreliable.#Data are suppressed due to imprecise and unreliable estimates.Source: New York City Department of Health and Mental Hygiene Epidemiology Services – EpiQuery NYC Interactive Data, 2009 Community Health Survey (https://a816-healthpsi.nyc.gov/epiquery/EpiQuery/CHS/index2009.html)

V A C C I N A T I O NF l u v a c c i n a t i o nQ: During the past 12 months, have you had a flu shot in your arm or a flu vaccine that was sprayed in your nose? Results restricted to adults aged 50 and older.
New York City 43 1% 56 9%
Yes No
Manhattan
New York City
50.6%
43.1%
49.4%
56.9%
Union Square/Lower Manhattan 47.1% 52.9%
Chelsea/Greenwich Village 58.4% 41.6%
0 0% 20 0% 40 0% 60 0% 80 0% 100 0%
Notes:Total estimated populations may not equal the sum of subgroup estimated populations due to rounding or missing data.Population estimates are NOT age adjusted but all percents are age adjusted
0.0% 20.0% 40.0% 60.0% 80.0% 100.0%
4949
Population estimates are NOT age adjusted, but all percents are age adjusted.Confidence Intervals (CIs) are a measure of estimate precision: the wider the CI, the more impressive the estimate.*Estimate should be interpreted with caution. Estimate’s Relative Standard Error (a measure of estimate precision) is greater than 30% or the sample size is less than 50, making the estimate potentially unreliable.#Data are suppressed due to imprecise and unreliable estimates.Source: New York City Department of Health and Mental Hygiene Epidemiology Services – EpiQuery NYC Interactive Data, 2009 Community Health Survey (https://a816-healthpsi.nyc.gov/epiquery/EpiQuery/CHS/index2009.html)

A C C E S S T O H E A L T H C A R EH e a l t h i n s u r a n c eRespondents were asked if they were personally covered by a number of different types of health insurance, or if they had no health insurance at all.
Medicaid 5.1%
Others 6.4%
Uninsured 6.6%
Others 10.8%
Uninsured 10.9%
Chelsea/Greenwich Village Union Square/Lower Manhattan
**
*
Private 68.0%
Medicare 13.9%
Private 47.9%
Medicaid 15.3%
Medicare 15.2%
Uninsured 11.2%
Uninsured 16 2%
Manhattan New York City
Private 56 8%
Medicaid 12.1%
Others 6.6%
%
Private 49.8%Medicaid
15 2%
Others 4.6%
16.2%
Notes:Total estimated populations may not equal the sum of subgroup estimated populations due to rounding or missing data.Population estimates are NOT age adjusted but all percents are age adjusted
56.8%
Medicare 13.4% Medicare
14.1%
15.2%
5050
Population estimates are NOT age adjusted, but all percents are age adjusted.Confidence Intervals (CIs) are a measure of estimate precision: the wider the CI, the more impressive the estimate.*Estimate should be interpreted with caution. Estimate’s Relative Standard Error (a measure of estimate precision) is greater than 30% or the sample size is less than 50, making the estimate potentially unreliable.#Data are suppressed due to imprecise and unreliable estimates.Source: New York City Department of Health and Mental Hygiene Epidemiology Services – EpiQuery NYC Interactive Data, 2009 Community Health Survey (https://a816-healthpsi.nyc.gov/epiquery/EpiQuery/CHS/index2009.html)

A C C E S S T O H E A L T H C A R EI n s u r e d a l l y e a rRespondents were asked about their current insurance status and, if currently insured, whether they had been without insurance during the past year.
Continuously insured in the past 12 months Insured now but uninsured in the past 12 months
5.7%7.4% 7.3%
6.8% 10.9% 11.2% 16.3%90.0%
100.0%
Insured now but uninsured in the past 12 months Uninsured
87.5% 81.8% 81.5% 74 8%
%8.9%
40.0%
50.0%
60.0%
70.0%
80.0%
74.8%
0.0%
10.0%
20.0%
30.0%
Ch l /G i h U i S /L M h tt N Y k Cit
Notes:Total estimated populations may not equal the sum of subgroup estimated populations due to rounding or missing data.Population estimates are NOT age adjusted but all percents are age adjusted
Chelsea/Greenwich Village
Union Square/Lower Manhattan
Manhattan New York City
5151
Population estimates are NOT age adjusted, but all percents are age adjusted.Confidence Intervals (CIs) are a measure of estimate precision: the wider the CI, the more impressive the estimate.*Estimate should be interpreted with caution. Estimate’s Relative Standard Error (a measure of estimate precision) is greater than 30% or the sample size is less than 50, making the estimate potentially unreliable.#Data are suppressed due to imprecise and unreliable estimates.Source: New York City Department of Health and Mental Hygiene Epidemiology Services – EpiQuery NYC Interactive Data, 2009 Community Health Survey (https://a816-healthpsi.nyc.gov/epiquery/EpiQuery/CHS/index2009.html)

A C C E S S T O H E A L T H C A R EP e r s o n a l d o c t o rDo you have one person (or more than one person) you think as your personal doctor health care provider?
81 9% 18 1%
Yes No
New York City
83.2%
81.9%
16.8%
18.1%
Manhattan
New York City
73.6% 26.4%Union Square/Lower Manhattan
85.4% 14.6%
0 0% 20 0% 40 0% 60 0% 80 0% 100 0%
Chelsea/Greenwich Village
Notes:Total estimated populations may not equal the sum of subgroup estimated populations due to rounding or missing data.Population estimates are NOT age adjusted but all percents are age adjusted
0.0% 20.0% 40.0% 60.0% 80.0% 100.0%
5252
Population estimates are NOT age adjusted, but all percents are age adjusted.Confidence Intervals (CIs) are a measure of estimate precision: the wider the CI, the more impressive the estimate.*Estimate should be interpreted with caution. Estimate’s Relative Standard Error (a measure of estimate precision) is greater than 30% or the sample size is less than 50, making the estimate potentially unreliable.#Data are suppressed due to imprecise and unreliable estimates.Source: New York City Department of Health and Mental Hygiene Epidemiology Services – EpiQuery NYC Interactive Data, 2009 Community Health Survey (https://a816-healthpsi.nyc.gov/epiquery/EpiQuery/CHS/index2009.html)

A C C E S S T O H E A L T H C A R ED i d n o t g e t n e e d e d m e d i c a l c a r eWas there a time in the past 12 months when you needed medical care but did NOT get it? Medical care includes doctor visits, tests, procedures, prescription medication and hospitalizations.
88 5% 11 5%
No Yes
New York City
90.6%
88.5%
9.4%
11.5%
Manhattan
New York City
93.0% 7.0%* *Union Square/Lower Manhattan
92.6% 7.4%
0 0% 20 0% 40 0% 60 0% 80 0% 100 0%
* *Chelsea/Greenwich Village
Notes:Total estimated populations may not equal the sum of subgroup estimated populations due to rounding or missing data.Population estimates are NOT age adjusted but all percents are age adjusted
0.0% 20.0% 40.0% 60.0% 80.0% 100.0%
5353
Population estimates are NOT age adjusted, but all percents are age adjusted.Confidence Intervals (CIs) are a measure of estimate precision: the wider the CI, the more impressive the estimate.*Estimate should be interpreted with caution. Estimate’s Relative Standard Error (a measure of estimate precision) is greater than 30% or the sample size is less than 50, making the estimate potentially unreliable.#Data are suppressed due to imprecise and unreliable estimates.Source: New York City Department of Health and Mental Hygiene Epidemiology Services – EpiQuery NYC Interactive Data, 2009 Community Health Survey (https://a816-healthpsi.nyc.gov/epiquery/EpiQuery/CHS/index2009.html)

Adjusted Rate Ambulatory Case-Sensitive Condition Admissions, 2006
Conditions for which early intervention and the availability of primary care can prevent
PSA SSA-I SSA-II SSAService
AreaRest of
ManhattanConditions
Conditions for which early intervention and the availability of primary care can prevent hospital admissions, complications or more severe disease
Dehydration 126.0 103.0 128.0 121.0 122.0 121.0
Pneumonia 345.0 326.0 503.0 452.0 418.0 391.0
UTI 129.0 116.0 238.0 202.0 179.0 174.0
Acu
te
HTN 37.0 39.0 75.0 65.0 55.0 70.0
CHF 250.0 240.0 442.0 386.0 343.0 442.0
Angina 30 0 13 0 41 0 32 0 32 0 34 0Circ
ulat
ory
Angina 30.0 13.0 41.0 32.0 32.0 34.0
DM Short-Term 25.0 26.0 58.0 47.0 40.0 60.0
DM Long-Term 98.0 96.0 233.0 191.0 159.0 201.0
U t ll d DM 17 0 25 0 42 0 34 0 48 0
Cab
etes
Uncontrolled DM 17.0 25.0 51.0 42.0 34.0 48.0
LE Amputation 27.0 12.0 53.0 40.0 36.0 44.0
COPD 106.0 102.0 159.0 143.0 131.0 125.0
Di
Res
p
5454
Asthma 119.0 110.0 290.0 232.0 193.0 232.0R
Source: NYS DOH (https://apps.nyhealth.gov/statistics/prevention/quality_indicators/start.map); accessed November 5, 2010RED denotes higher than Rest of Manhattan

Overall Ambulatory Case-Sensitive Condition Admissions as % Expected by Race & Ethnicity
Asian Black Hispanic White Others a ac spa c e O ePSA (71%) 23% 333% 126% 48% 59%SSA-I (65%) 35% 288% 141% 49% 50%SSA-II (122%) 53% 275% 177% 70% 166%
5555
( )Manhattan (103%) 37% 212% 146% 51% 96%
Source: NYS DOH (https://apps.nyhealth.gov/statistics/prevention/quality_indicators/start.map); accessed November 5, 2010

Acute Ambulatory Case-Sensitive Condition Admissions as % Expected by Race & Ethnicity
Asian Black Hispanic White OtherPSA (90%) 40% 127% 71%SSA-I (82%) 46% 66%SSA-II (131%) 79% 233% 160% 87%
N/A N/AN/AN/A
N/AN/A
5656
Manhattan (104%) 55% 168% 127% 68% 109%
Source: NYS DOH (https://apps.nyhealth.gov/statistics/prevention/quality_indicators/start.map); accessed November 5, 2010

Circulatory Ambulatory Case-Sensitive Condition Admissions as % Expected by Race & Ethnicity
Asian Black Hispanic White OtherPSA (58%) 4% 106% 37%N/A N/APSA (58%) 4% 106% 37%SSA-I (53%) 23% 41%SSA-II (101%) 29% 280% 158% 57%Manhattan (93%) 22% 212% 135% 44% 72%
N/A
N/A
N/A N/A
N/A
5757
Manhattan (93%) 22% 212% 135% 44% 72%
Source: NYS DOH (https://apps.nyhealth.gov/statistics/prevention/quality_indicators/start.map); accessed November 5, 2010

Diabetes Ambulatory Case-Sensitive Condition Admissions as % Expected by Race & Ethnicity
Asian Black Hispanic White OtherPSA (59%) 39% 141% 28%SSA-I (57%) 37% 32%SSA-II (140%) 48% 349% 225% 69%
N/A
N/A
N/A
N/A
N/AN/A
5858
Manhattan (117%) 33% 310% 184% 36% 106%
Source: NYS DOH (https://apps.nyhealth.gov/statistics/prevention/quality_indicators/start.map); accessed November 5, 2010

Respiratory Ambulatory Case-Sensitive Condition Admissions as % Expected by Race & Ethnicity
Asian Black Hispanic White OtherPSA (64%) 7% 142% 39% N/AN/APSA (64%) 7% 142% 39%SSA-I (61%) 29% 44%SSA-II (127%) 42% 286% 200% 59%M h tt (103%) 29% 219% 162% 41% 99%
N/A
N/A
N/A
N/A
N/AN/A
5959
Manhattan (103%) 29% 219% 162% 41% 99%
Source: NYS DOH (https://apps.nyhealth.gov/statistics/prevention/quality_indicators/start.map); accessed November 5, 2010

Top Reasons for ED Visits (Treat & Release), 2009
ED Utilization (Rank)
1 2 3 4 5Oth U Vi l Otiti S fi i l I j
Age Category
ED Utilization (Rank)
0-17Other Upper
Respiratory InfectionViral
Infection AsthmaOtitis Media
Superficial Injury Contusion
Other Upper Superficial Injury Alcohol Abdominal Viral 18-34 Respiratory Infection Contusion Related Pain Infection
35-64Alcohol Related Spondylosis
Superficial Injury Contusion
Connective tissue disease
Other Upper Respiratory Infection35 64 Related Spondylosis Contusion tissue disease Respiratory Infection
65+Superficial Injury
Contusion Spondylosis Other connective tissue disease
Other injuries and conditions
Abdominal Pain
6060Source: NYS DOH SPARCS (Statewide Planning and Research Cooperative System)
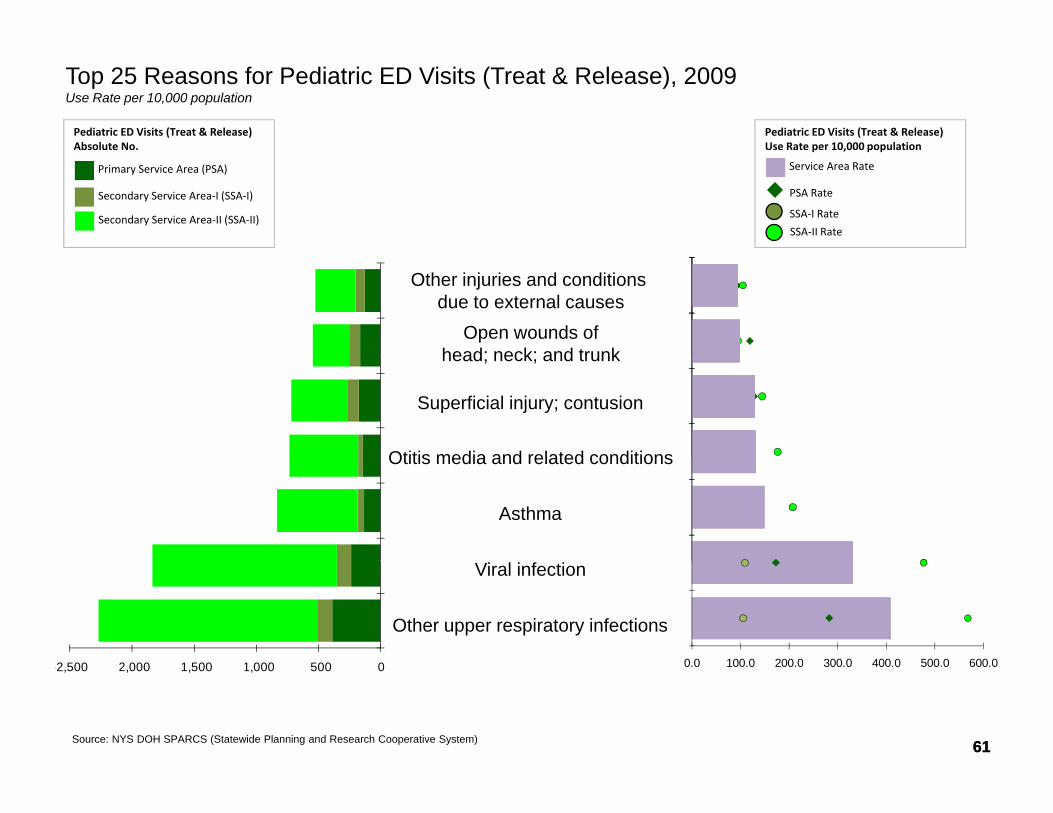
Top 25 Reasons for Pediatric ED Visits (Treat & Release), 2009Use Rate per 10,000 population
Pediatric ED Visits (Treat & Release)Absolute No.
Pediatric ED Visits (Treat & Release)Use Rate per 10,000 population
Primary Service Area (PSA)
Secondary Service Area‐I (SSA‐I)
Secondary Service Area‐II (SSA‐II)
Service Area Rate
p , p p
PSA Rate
SSA‐I Rate
SSA‐II Rate
Open wounds of head; neck; and trunk
Other injuries and conditions due to external causes
Otitis media and related conditions
Superficial injury; contusion
head; neck; and trunk
Asthma
Otitis media and related conditions
2 500 2 000 1 500 1 000 500 0 0 0 100 0 200 0 300 0 400 0 500 0 600 0
Other upper respiratory infections
Viral infection
6161
-2,500 -2,000 -1,500 -1,000 -500 0 0.0 100.0 200.0 300.0 400.0 500.0 600.0
Source: NYS DOH SPARCS (Statewide Planning and Research Cooperative System)

Top 25 Reasons for Pediatric ED Visits (Treat & Release), 2009Use Rate per 10,000 population
Oth ki di d
Nausea and vomiting Other aftercare
Urinary tract infections
Other ear and sense organ disorders
Primary Service Area (PSA)
Pediatric ED Visits (Treat & Release)Absolute No.
Secondary Service Area‐I (SSA‐I)
Service Area Rate
Pediatric ED Visits (Treat & Release)Use Rate per 10,000 population
PSA Rate
SSA I Rate
Other connective tissue disease
Pneumonia
Open wounds of extremities Other gastrointestinal disorders
Other lower respiratory disease
Other skin disorders Secondary Service Area‐II (SSA‐II) SSA‐I Rate
SSA‐II Rate
Abdominal pain
Inflammation; infection of eye
Noninfectious gastroenteritis Fracture of upper limb
Skin and subcutaneous tissue infections
Open wounds of head; neck; and trunk Other injuries and conditions due to external causes
Allergic reactions Fever of unknown origin
Sprains and strains
Other upper respiratory infections Viral infection
Asthma
Otitis media and related conditions
Superficial injury; contusion
6262
0.0 100.0 200.0 300.0 400.0 500.0 600.0-2,500 -2,000 -1,500 -1,000 -500 0
Source: NYS DOH SPARCS (Statewide Planning and Research Cooperative System)

Top 25 Reasons for Adults ED Visits (Treat & Release), 2009Use Rate per 10,000 population
Adults ED Visits (Treat & Release)Absolute No.
Adults ED Visits (Treat & Release)Use Rate per 10,000 population
Primary Service Area (PSA)
Secondary Service Area‐I (SSA‐I)
Secondary Service Area‐II (SSA‐II)
Service Area Rate
p , p p
PSA Rate
SSA‐I Rate
SSA‐II Rate
Other Injuries and conditions due to external causes
Open wounds of extremities
Abdominal pain
Other connective tissue disease
Sprains and strains
Superficial injury; contusion
Spondylosisintervetebral disc disorders
Abdominal pain
0 0 50 0 100 0 150 0 200 0
Alcohol-related disorders
Other upper respiratory infections
5 000 4 000 3 000 2 000 1 000 0
6363
0.0 50.0 100.0 150.0 200.0-5,000 -4,000 -3,000 -2,000 -1,000 0
Source: NYS DOH SPARCS (Statewide Planning and Research Cooperative System)

Top 25 Reasons for Adults ED Visits (Treat & Release), 2009Use Rate per 10,000 population
Residual codes; unclassifiedSubstance-related disorders
Other gastrointestinal disorders
Mood disorders
Primary Service Area (PSA)
Adults ED Visits (Treat & Release)Absolute No.
Secondary Service Area‐I (SSA‐I)
Service Area Rate
Adults ED Visits (Treat & Release)Use Rate per 10,000 population
PSA Rate
SSA I Rate
Headache; including migraine
Open wounds of head; neck; and trunkOther lower respiratory disease
Other aftercare
Allergic reactions
Fracture of upper limbSecondary Service Area‐II (SSA‐II) SSA‐I Rate
SSA‐II Rate
Skin and subcutaneous tissue infections
Asthma
Nonspecific chest painOther non-traumatic joint disorders
Urinary tract infections
; g g
Abd i l i
Other connective tissue disease
Sprains and strains
Other Injuries and conditions due to external causes
Open wounds of extremities
Viral infection
Alcohol-related disordersOther upper respiratory infections
Superficial injury; contusion
Spondylosis; intervetebral disc disorders
Abdominal pain
6464
-5,000 -4,000 -3,000 -2,000 -1,000 0 0.0 50.0 100.0 150.0 200.0
Source: NYS DOH SPARCS (Statewide Planning and Research Cooperative System)

Top 25 Reasons for Ages 18-34 ED Visits (Treat & Release), 2009Use Rate per 10,000 population
Ages 18‐34 ED Visits (Treat & Release)Absolute No.
Ages 18‐34 ED Visits (Treat & Release)Use Rate per 10,000 population
Primary Service Area (PSA)
Secondary Service Area‐I (SSA‐I)
Secondary Service Area‐II (SSA‐II)
Service Area Rate
p , p p
PSA Rate
SSA‐I Rate
SSA‐II Rate
Open wounds of extremities
Sprains and strains
Abdominal pain
Viral infection
Alcohol-related disorders
Abdominal pain
2 000 1 500 1 000 500 0 0 0 50 0 100 0 150 0 200 0 250 0 300 0
Other upper respiratory infections
Superficial Injury; contusion
6565
-2,000 -1,500 -1,000 -500 0 0.0 50.0 100.0 150.0 200.0 250.0 300.0
Source: NYS DOH SPARCS (Statewide Planning and Research Cooperative System)

Top 25 Reasons for Ages 18-34 ED Visits (Treat & Release), 2009Use Rate per 10,000 population
Primary Service Area (PSA)
Ages 18‐34 ED Visits (Treat & Release)Absolute No.
Secondary Service Area‐I (SSA‐I)
Service Area Rate
Ages 18‐34 ED Visits (Treat & Release)Use Rate per 10,000 population
PSA Rate
SSA I Rate
Disorders of teeth and jawMood disorders
Other lower respiratory disease
Noninfectious gastroenteritis
Secondary Service Area‐II (SSA‐II) SSA‐I Rate
SSA‐II Rate
Nonspecific chest pain
Early or threatened laborAllergic reactions
Other non-traumatic joint disorders
Other aftercare
Anxiety disorders
Spondylosis; intervertebral disc disorders
Other connective tissue disease
Headache; including migraineAsthma
Open wounds of head; neck; and trunk
p p
Vi l i f ti
Open wounds of extremities
Sprains and strains
Urinary tract infections
Other injuries and conditions due to external causes
Skin and subcutaneous tissue infections
Other upper respiratory infectionsSuperficial Injury; contusion
Alcohol-related disorders
Abdominal pain
Viral infection
6666
0.0 50.0 100.0 150.0 200.0 250.0 300.0-2,000 -1,500 -1,000 -500 0
Source: NYS DOH SPARCS (Statewide Planning and Research Cooperative System)
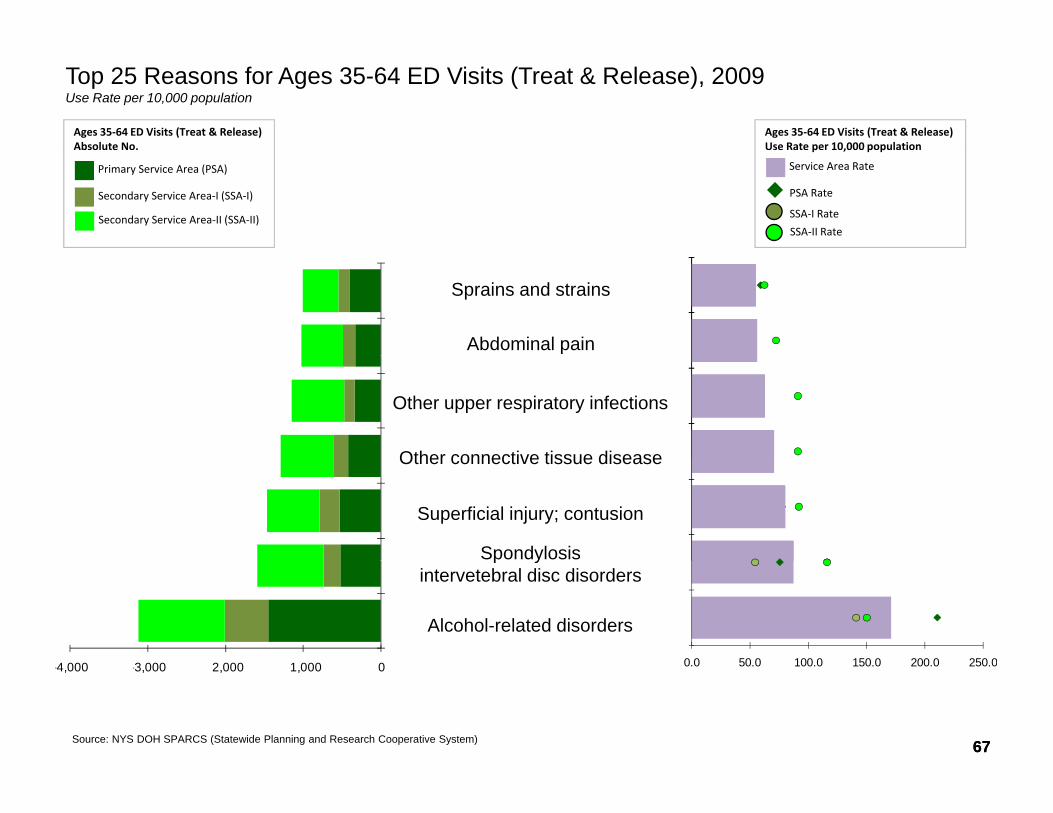
Top 25 Reasons for Ages 35-64 ED Visits (Treat & Release), 2009Use Rate per 10,000 population
Ages 35‐64 ED Visits (Treat & Release)Absolute No.
Ages 35‐64 ED Visits (Treat & Release)Use Rate per 10,000 population
Primary Service Area (PSA)
Secondary Service Area‐I (SSA‐I)
Secondary Service Area‐II (SSA‐II)
Service Area Rate
p , p p
PSA Rate
SSA‐I Rate
SSA‐II Rate
Abdominal pain
Sprains and strains
Other connective tissue disease
Other upper respiratory infections
Spondylosis
Superficial injury; contusion
Other connective tissue disease
4 000 3 000 2 000 1 000 0 0 0 50 0 100 0 150 0 200 0 250 0
Alcohol-related disorders
p yintervetebral disc disorders
6767
-4,000 -3,000 -2,000 -1,000 0 0.0 50.0 100.0 150.0 200.0 250.0
Source: NYS DOH SPARCS (Statewide Planning and Research Cooperative System)
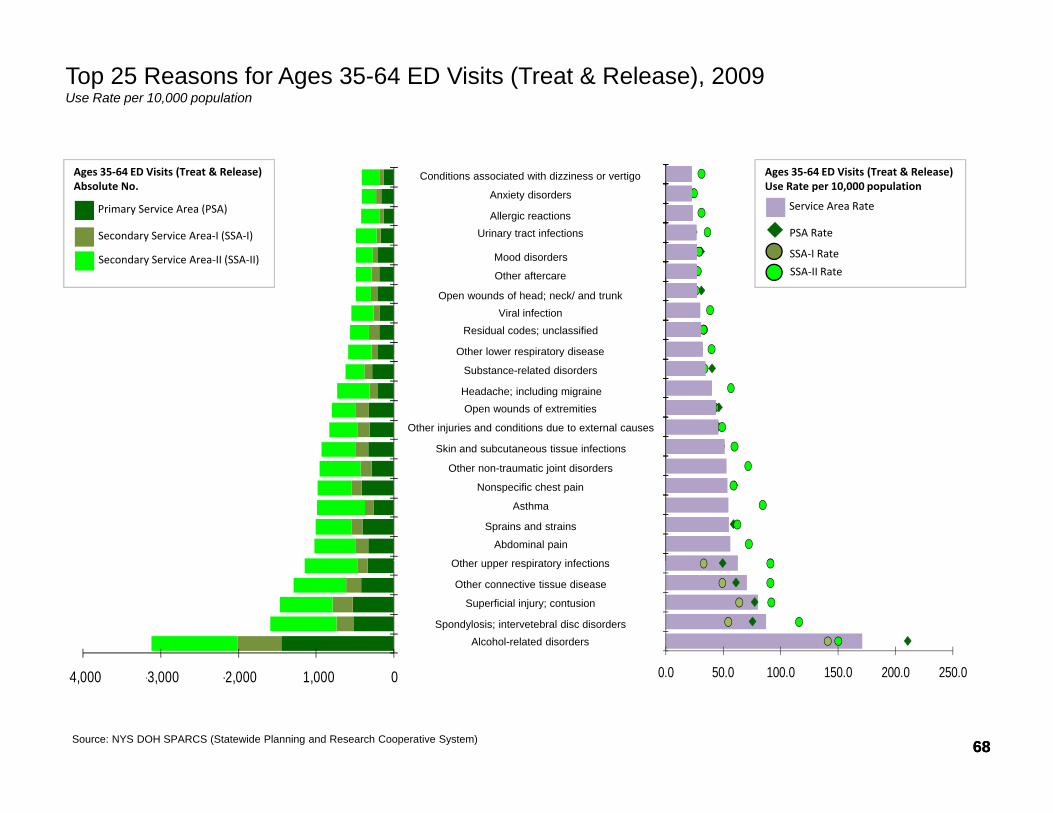
Top 25 Reasons for Ages 35-64 ED Visits (Treat & Release), 2009Use Rate per 10,000 population
Primary Service Area (PSA)
Ages 35‐64 ED Visits (Treat & Release)Absolute No.
Secondary Service Area‐I (SSA‐I)
Service Area Rate
Ages 35‐64 ED Visits (Treat & Release)Use Rate per 10,000 population
PSA Rate
SSA I Rate
Urinary tract infectionsAllergic reactions
Anxiety disorders
Conditions associated with dizziness or vertigo
Secondary Service Area‐II (SSA‐II) SSA‐I Rate
SSA‐II Rate
Other lower respiratory disease
Residual codes; unclassifiedViral infection
Open wounds of head; neck/ and trunk
Other aftercare
Mood disorders
Skin and subcutaneous tissue infections
Other injuries and conditions due to external causes
Open wounds of extremitiesHeadache; including migraine
Substance-related disorders
p y
Oth i t i f ti
Abdominal pain
Sprains and strains
Asthma
Nonspecific chest pain
Other non-traumatic joint disorders
Alcohol-related disordersSpondylosis; intervetebral disc disorders
Superficial injury; contusion
Other connective tissue disease
Other upper respiratory infections
6868
0.0 50.0 100.0 150.0 200.0 250.0-4,000 -3,000 -2,000 -1,000 0
Source: NYS DOH SPARCS (Statewide Planning and Research Cooperative System)

Top 25 Reasons for Ages 65 and Over ED Visits (Treat & Release), 2009Use Rate per 10,000 population
Ages 65+ ED Visits (Treat & Release)Absolute No.
Ages 65+ ED Visits (Treat & Release)Use Rate per 10,000 population
Primary Service Area (PSA)
Secondary Service Area‐I (SSA‐I)
Secondary Service Area‐II (SSA‐II)
Service Area Rate
p , p p
PSA Rate
SSA‐I Rate
SSA‐II Rate
Other non-traumatic joint disorders
Urinary tract infections
Other injuries and conditions due to
Abdominal pain
Spondylosis
Other connective tissue disease
external causes
600 500 400 300 200 100 0 0 0 50 0 100 0 150 0 200 0
Superficial injury; contusion
p yintervetebral disc disorders
6969Source: NYS DOH SPARCS (Statewide Planning and Research Cooperative System)
-600 -500 -400 -300 -200 -100 0 0.0 50.0 100.0 150.0 200.0

Top 25 Reasons for Ages 65 and Over ED Visits (Treat & Release), 2009Use Rate per 10,000 population
O d f t iti
Other aftercareResidual codes; unclassififed
Essential hypertension
Other upper respiratory disease
Primary Service Area (PSA)
Ages 65+ ED Visits (Treat & Release)Absolute No.
Secondary Service Area‐I (SSA‐I)
Service Area Rate
Ages 65+ ED Visits (Treat & Release)Use Rate per 10,000 population
PSA Rate
SSA I Rate
Alcohol related disorders
Asthma
Sprains and strains
Other upper respiratory infections
Headache; including migraineOpen wounds of extremitiesSecondary Service Area‐II (SSA‐II) SSA‐I Rate
SSA‐II Rate
Other lower respiratory disease
Non-specific chest pain
Open wounds of head; neck; and trunk
Fracture of upper limb
Skin and subcutaneous tissue infections
Other non-traumatic joint disorders
Urinary tract infections
Genitourinary symptoms and ill-defined conditions
Conditions associated with dizziness or vertigo
Other gastrointestinal disorders
Superficial injury; contusion
Spondylosis; intervertebral disc disorders
Other connective tissue disease
Other injuries and conditions due to external causes
Abdominal pain
7070
-600 -500 -400 -300 -200 -100 0 0.0 50.0 100.0 150.0 200.0
Source: NYS DOH SPARCS (Statewide Planning and Research Cooperative System)
Appendix SummaryAppendix Summary
7171

G E N E R A L P H Y S I C A L A N D M E N T A L H E A L T HS U M M A R Y
M RChelsea
G i h VillUnion Square
L M h tt M h tt N Y k CitMeasure Response Greenwich Village Lower Manhattan Manhattan New York City
Self-reported health status Fair or Poor 9.1% 18.3% 12.9% 19.5%
Non-specific psychological distress No # # 95.8% 95.0%
A C C E S S TO H E A LT H C A R ES U M M A R Y
Mental health counseling or treatment Yes 53.2%* 31.7%* 38.1% 33.4%
S U M M A R Y
Measure ResponseChelsea
Greenwich VillageUnion Square
Lower Manhattan Manhattan New York City
Health insuranceMedicaidUninsured
5.1%6.6%*
15.3%10.9%*
12.1%11.2%
15.2%16.2%
Personal doctor No 14.6% 26.4% 16.8% 18.1%
Insured all yearInsured but not past 12 monthUninsured
5.7%*6.8%*
7.4%10.9%*
7.3%11.2%
8.9%16.3%
Notes:Total estimated populations may not equal the sum of subgroup estimated populations due to rounding or missing data.Population estimates are NOT age adjusted but all percents are age adjusted
Did not get needed medical care Yes 7.4%* 7.0%* 9.4% 11.5%
7272
Population estimates are NOT age adjusted, but all percents are age adjusted.Confidence Intervals (CIs) are a measure of estimate precision: the wider the CI, the more impressive the estimate.*Estimate should be interpreted with caution. Estimate’s Relative Standard Error (a measure of estimate precision) is greater than 30% or the sample size is less than 50, making the estimate potentially unreliable.#Data are suppressed due to imprecise and unreliable estimates.Source: New York City Department of Health and Mental Hygiene Epidemiology Services – EpiQuery NYC Interactive Data, 2009 Community Health Survey (https://a816-healthpsi.nyc.gov/epiquery/EpiQuery/CHS/index2009.html)

W E I G H T, E X E R C I S E , N U T R I T I O NS U M M A R Y
Measure ResponseChelsea
Greenwich VillageUnion Square
Lower Manhattan Manhattan New York City
Overweight and ObesityOverweight but not obeseObese
28.2%8.4%
26.6%15.8%
29.4%16.5%
33.5%23.3%
Physical activity No 11.7% 21.0% 19.1% 27.3%
C H R O N I C C O N D I T I O N SS U M M A R Y
Measure ResponseChelsea
Greenwich VillageUnion Square
Lower Manhattan Manhattan New York City
S U M M A R Y
High blood pressure ever No 80.0% 78.8% 77.2% 71.7%
Blood pressure medication ever No 13.8%* 29.2%* 30.6% 28.9%
Diabetes ever Yes 3.0% 11.9% 7.7% 9.7%
Notes:Total estimated populations may not equal the sum of subgroup estimated populations due to rounding or missing data.Population estimates are NOT age adjusted but all percents are age adjusted
7373
Population estimates are NOT age adjusted, but all percents are age adjusted.Confidence Intervals (CIs) are a measure of estimate precision: the wider the CI, the more impressive the estimate.*Estimate should be interpreted with caution. Estimate’s Relative Standard Error (a measure of estimate precision) is greater than 30% or the sample size is less than 50, making the estimate potentially unreliable.#Data are suppressed due to imprecise and unreliable estimates.Source: New York City Department of Health and Mental Hygiene Epidemiology Services – EpiQuery NYC Interactive Data, 2009 Community Health Survey (https://a816-healthpsi.nyc.gov/epiquery/EpiQuery/CHS/index2009.html)

C I G A R E T T E S M O K I N G A N D A L C O H O LS U M M A R Y
Measure ResponseChelsea
Greenwich VillageUnion Square
Lower Manhattan Manhattan New York City
Smoking statusFormer SmokerCurrent Smoker
30.7%15.7%
25.4%18.3%
24.6%14.7%
22.0%15.8%
Heavy drinking Yes 11 5% 4 4% 7 6% 4 6%Heavy drinking Yes 11.5% 4.4% 7.6% 4.6%
Binge drinking Yes 31.3% 14.6% 19.3% 14.6%
A S T H M AS U M M A R Y
Measure ResponseChelsea
Greenwich VillageUnion Square
Lower Manhattan Manhattan New York City
S U M M A R Y
Asthma ever Yes 11.4% 10.7% 11.6% 11.5%
ED visits due to asthma1 visit2 visits
##
85.2%*14.8%*
72.2%27.8%
49.3%50.7%
Notes:Total estimated populations may not equal the sum of subgroup estimated populations due to rounding or missing data.Population estimates are NOT age adjusted but all percents are age adjusted
7474
Population estimates are NOT age adjusted, but all percents are age adjusted.Confidence Intervals (CIs) are a measure of estimate precision: the wider the CI, the more impressive the estimate.*Estimate should be interpreted with caution. Estimate’s Relative Standard Error (a measure of estimate precision) is greater than 30% or the sample size is less than 50, making the estimate potentially unreliable.#Data are suppressed due to imprecise and unreliable estimates.Source: New York City Department of Health and Mental Hygiene Epidemiology Services – EpiQuery NYC Interactive Data, 2009 Community Health Survey (https://a816-healthpsi.nyc.gov/epiquery/EpiQuery/CHS/index2009.html)

C A N C E R S C R E E N I N GS U M M A R Y
Measure ResponseChelsea
Greenwich VillageUnion Square
Lower Manhattan Manhattan New York City
Colon cancer No 29.0% 44.5% 32.2% 34.0%
Breast cancer No 19 6% 18 1% 21 6% 21 5%Breast cancer No 19.6% 18.1% 21.6% 21.5%
Cervical cancer No 23.5% 31.1% 18.7% 18.4%
Notes:Total estimated populations may not equal the sum of subgroup estimated populations due to rounding or missing data.Population estimates are NOT age adjusted but all percents are age adjusted
7575
Population estimates are NOT age adjusted, but all percents are age adjusted.Confidence Intervals (CIs) are a measure of estimate precision: the wider the CI, the more impressive the estimate.*Estimate should be interpreted with caution. Estimate’s Relative Standard Error (a measure of estimate precision) is greater than 30% or the sample size is less than 50, making the estimate potentially unreliable.#Data are suppressed due to imprecise and unreliable estimates.Source: New York City Department of Health and Mental Hygiene Epidemiology Services – EpiQuery NYC Interactive Data, 2009 Community Health Survey (https://a816-healthpsi.nyc.gov/epiquery/EpiQuery/CHS/index2009.html)