community demographic profile · community demographic profile caldwell county, texas prepared for...
TRANSCRIPT
COMMUNITY DEMOGRAPHIC PROFILECaldwell County, Texas
Prepared forBluebonnet Electric CooperativeFebruary 2015

2
DESCRIPTION DATA %
Population
2020 Projection 42,098
2015 Estimate 39,979
2010 Census 38,066
2000 Census 32,194
Growth 2015-2020 5.30%
Growth 2010-2015 5.03%
Growth 2000-2010 18.24%
2015 Est. Population by Single-Classification Race 39,979
White Alone 29,780 74.49
Black or African American Alone 2,651 6.63
Amer. Indian and Alaska Native Alone 359 0.90
Asian Alone 476 1.19
Native Hawaiian and Other Pac. Isl. Alone 11 0.03
Some Other Race Alone 5,568 13.93
Two or More Races 1,134 2.84
2015 Est. Population by Hispanic or Latino Origin 39,979
Not Hispanic or Latino 19,897 49.77
Hispanic or Latino: 20,082 50.23
Mexican 18,153 90.39
Puerto Rican 179 0.89
Cuban 43 0.21
All Other Hispanic or Latino 1,707 8.50
DESCRIPTION DATA %
2015 Est. Hisp. or Latino Pop by Single-Class. Race 20,082
White Alone 13,474 67.09
Black or African American Alone 145 0.72
American Indian and Alaska Native Alone 240 1.20
Asian Alone 14 0.07
Native Hawaiian and Other Pacific Islander Alone 5 0.02
Some Other Race Alone 5,515 27.46
Two or More Races 689 3.43
2015 Est. Pop by Race, Asian Alone, by Category 476
Chinese, except Taiwanese 57 11.97
Filipino 0 0.00
Japanese 66 13.87
Asian Indian 0 0.00
Korean 0 0.00
Vietnamese 0 0.00
Cambodian 0 0.00
Hmong 0 0.00
Laotian 0 0.00
Thai 0 0.00
All Other Asian Races Including 2+ Category 353 74.16
2015 Est. Population by Ancestry 39,979
Arab 9 0.02
Czech 304 0.76
Danish 97 0.24
Dutch 144 0.36
English 1,848 4.62
French (except Basque) 302 0.76
French Canadian 56 0.14
German 3,997 10.00
Greek 6 0.02
Community DemographicsCaldwell County, Texas
3
DESCRIPTION DATA %
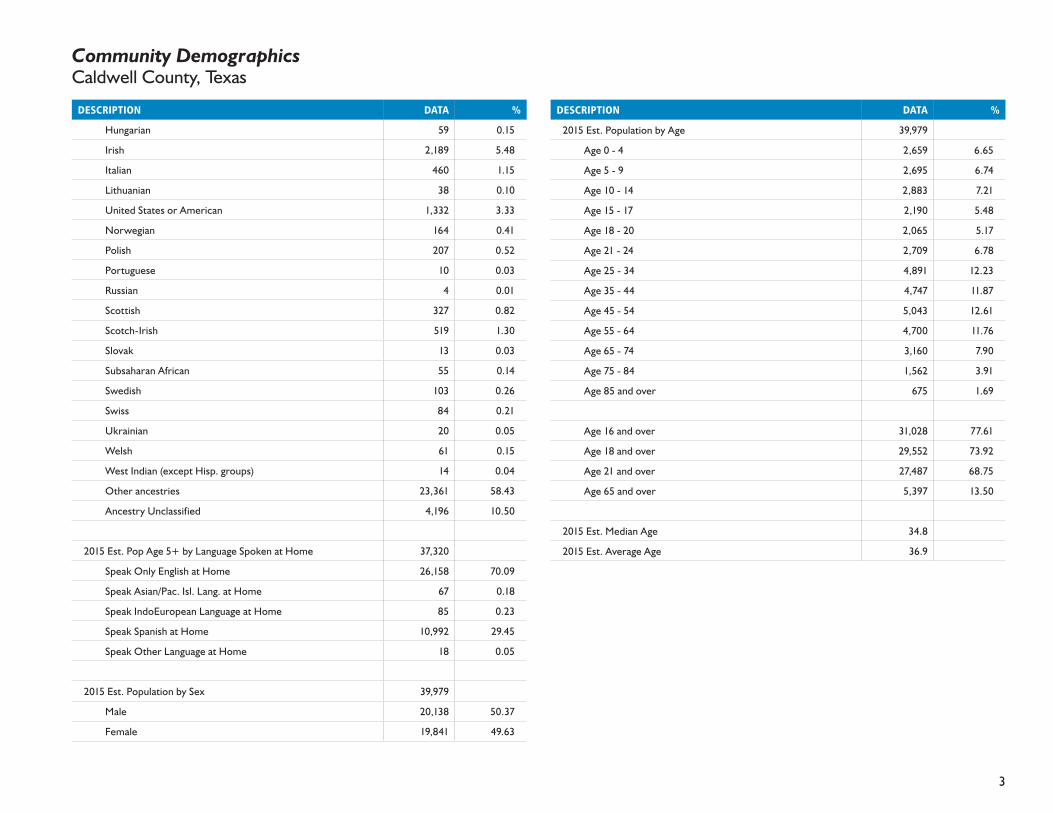
Hungarian 59 0.15
Irish 2,189 5.48
Italian 460 1.15
Lithuanian 38 0.10
United States or American 1,332 3.33
Norwegian 164 0.41
Polish 207 0.52
Portuguese 10 0.03
Russian 4 0.01
Scottish 327 0.82
Scotch-Irish 519 1.30
Slovak 13 0.03
Subsaharan African 55 0.14
Swedish 103 0.26
Swiss 84 0.21
Ukrainian 20 0.05
Welsh 61 0.15
West Indian (except Hisp. groups) 14 0.04
Other ancestries 23,361 58.43
Ancestry Unclassified 4,196 10.50
2015 Est. Pop Age 5+ by Language Spoken at Home 37,320
Speak Only English at Home 26,158 70.09
Speak Asian/Pac. Isl. Lang. at Home 67 0.18
Speak IndoEuropean Language at Home 85 0.23
Speak Spanish at Home 10,992 29.45
Speak Other Language at Home 18 0.05
2015 Est. Population by Sex 39,979
Male 20,138 50.37
Female 19,841 49.63
DESCRIPTION DATA %
2015 Est. Population by Age 39,979
Age 0 - 4 2,659 6.65
Age 5 - 9 2,695 6.74
Age 10 - 14 2,883 7.21
Age 15 - 17 2,190 5.48
Age 18 - 20 2,065 5.17
Age 21 - 24 2,709 6.78
Age 25 - 34 4,891 12.23
Age 35 - 44 4,747 11.87
Age 45 - 54 5,043 12.61
Age 55 - 64 4,700 11.76
Age 65 - 74 3,160 7.90
Age 75 - 84 1,562 3.91
Age 85 and over 675 1.69
Age 16 and over 31,028 77.61
Age 18 and over 29,552 73.92
Age 21 and over 27,487 68.75
Age 65 and over 5,397 13.50
2015 Est. Median Age 34.8
2015 Est. Average Age 36.9
Community DemographicsCaldwell County, Texas

4
DESCRIPTION DATA %
2015 Est. Male Population by Age 20,138
Age 0 - 4 1,350 6.70
Age 5 - 9 1,370 6.80
Age 10 - 14 1,496 7.43
Age 15 - 17 1,139 5.66
Age 18 - 20 1,157 5.75
Age 21 - 24 1,516 7.53
Age 25 - 34 2,477 12.30
Age 35 - 44 2,340 11.62
Age 45 - 54 2,533 12.58
Age 55 - 64 2,319 11.52
Age 65 - 74 1,495 7.42
Age 75 - 84 709 3.52
Age 85 and over 237 1.18
2015 Est. Median Age, Male 33.2
2015 Est. Average Age, Male 35.9
2015 Est. Female Population by Age 19,841
Age 0 - 4 1,309 6.60
Age 5 - 9 1,325 6.68
Age 10 - 14 1,387 6.99
Age 15 - 17 1,051 5.30
Age 18 - 20 908 4.58
Age 21 - 24 1,193 6.01
Age 25 - 34 2,414 12.17
Age 35 - 44 2,407 12.13
Age 45 - 54 2,510 12.65
Age 55 - 64 2,381 12.00
Age 65 - 74 1,665 8.39
Age 75 - 84 853 4.30
Age 85 and over 438 2.21
DESCRIPTION DATA %
2015 Est. Median Age, Female 36.4
2015 Est. Average Age, Female 37.9
2015 Est. Pop Age 15+ by Marital Status 31,742
Total, Never Married 10,461 32.96
Males, Never Married 5,975 18.82
Females, Never Married 4,486 14.13
Married, Spouse present 12,305 38.77
Married, Spouse absent 2,680 8.44
Widowed 1,876 5.91
Males Widowed 388 1.22
Females Widowed 1,488 4.69
Divorced 4,420 13.92
Males Divorced 2,133 6.72
Females Divorced 2,287 7.20
2015 Est. Pop Age 25+ by Edu. Attainment 24,778
Less than 9th grade 2,397 9.67
Some High School, no diploma 3,366 13.58
High School Graduate (or GED) 8,953 36.13
Some College, no degree 4,752 19.18
Associate Degree 1,430 5.77
Bachelor's Degree 2,736 11.04
Master's Degree 830 3.35
Professional School Degree 275 1.11
Doctorate Degree 39 0.16
2015 Est. Pop Age 25+ by Edu. Attain., Hisp./Lat. 10,700
No High School Diploma 4,113 38.44
High School Graduate 3,703 34.61
Some College or Associate's Degree 2,107 19.69
Bachelor's Degree or Higher 777 7.26
Community DemographicsCaldwell County, Texas

5
DESCRIPTION DATA %
Households
2020 Projection 13,733
2015 Estimate 12,984
2010 Census 12,301
2000 Census 10,816
Growth 2015-2020 5.77%
Growth 2010-2015 5.55%
Growth 2000-2010 13.73%
2015 Est. Households by Household Type 12,984
Family Households 9,406 72.44
Nonfamily Households 3,578 27.56
2015 Est. Group Quarters Population 3,373
2015 HHs by Ethnicity, Hispanic/Latino 5,311 40.90
2015 Est. Households by HH Income 12,984
Income < $15,000 1,898 14.62
Income $15,000 - $24,999 1,641 12.64
Income $25,000 - $34,999 1,638 12.62
Income $35,000 - $49,999 2,154 16.59
Income $50,000 - $74,999 2,409 18.55
Income $75,000 - $99,999 1,261 9.71
Income $100,000 - $124,999 761 5.86
Income $125,000 - $149,999 391 3.01
Income $150,000 - $199,999 368 2.83
Income $200,000 - $249,999 157 1.21
Income $250,000 - $499,999 209 1.61
Income $500,000+ 97 0.75
DESCRIPTION DATA %
2015 Est. Average Household Income $62,233
2015 Est. Median Household Income $44,157
2015 Median HH Inc. by Single-Class. Race or Eth.
White Alone 46,388
Black or African American Alone 25,374
American Indian and Alaska Native Alone 40,548
Asian Alone 50,500
Native Hawaiian and Other Pacific Islander Alone 62,500
Some Other Race Alone 35,184
Two or More Races 55,963
Hispanic or Latino 39,574
Not Hispanic or Latino 47,977
2015 Est. Family HH Type by Presence of Own Child. 9,406
Married-Couple Family, own children 2,771 29.46
Married-Couple Family, no own children 3,906 41.53
Male Householder, own children 401 4.26
Male Householder, no own children 450 4.78
Female Householder, own children 973 10.34
Female Householder, no own children 905 9.62
2015 Est. Households by Household Size 12,984
1-person 3,027 23.31
2-person 3,950 30.42
3-person 2,198 16.93
4-person 1,797 13.84
5-person 1,058 8.15
6-person 519 4.00
7-or-more-person 435 3.35
Community DemographicsCaldwell County, Texas

6
DESCRIPTION DATA %
2015 Est. Average Household Size 2.82
2015 Est. Households by Presence of People Under 18 12,984
Households with 1 or More People under Age 18: 4,997 38.49
Married-Couple Family 3,192 63.88
Other Family, Male Householder 515 10.31
Other Family, Female Householder 1,251 25.04
Nonfamily, Male Householder 27 0.54
Nonfamily, Female Householder 12 0.24
Households with No People under Age 18: 7,987 61.51
Married-Couple Family 3,488 43.67
Other Family, Male Householder 337 4.22
Other Family, Female Householder 628 7.86
Nonfamily, Male Householder 1,780 22.29
Nonfamily, Female Householder 1,754 21.96
2015 Est. Households by Number of Vehicles 12,984
No Vehicles 808 6.22
1 Vehicle 3,773 29.06
2 Vehicles 4,827 37.18
3 Vehicles 2,664 20.52
4 Vehicles 749 5.77
5 or more Vehicles 163 1.26
2015 Est. Average Number of Vehicles 2.0
DESCRIPTION DATA %
Family Households
2020 Projection 9,956
2015 Estimate 9,406
2010 Census 8,904
2000 Census 8,074
Growth 2015-2020 5.85%
Growth 2010-2015 5.64%
Growth 2000-2010 10.28%
2015 Est. Families by Poverty Status 9,406
2015 Families at or Above Poverty 8,127 86.40
2015 Families at or Above Poverty with Children 3,735 39.71
2015 Families Below Poverty 1,279 13.60
2015 Families Below Poverty with Children 1,031 10.96
2015 Est. Pop Age 16+ by Employment Status 31,028
In Armed Forces 51 0.16
Civilian - Employed 15,216 49.04
Civilian - Unemployed 1,846 5.95
Not in Labor Force 13,915 44.85
2015 Est. Civ. Employed Pop 16+ by Class of Worker 15,701
For-Profit Private Workers 9,921 63.19
Non-Profit Private Workers 759 4.83
Local Government Workers 1,415 9.01
State Government Workers 1,199 7.64
Federal Government Workers 515 3.28
Self-Employed Workers 1,890 12.04
Unpaid Family Workers 2 0.01
Community DemographicsCaldwell County, Texas

7
DESCRIPTION DATA %
2015 Est. Civ. Employed Pop 16+ by Occupation 15,701
Architect/Engineer 68 0.43
Arts/Entertainment/Sports 230 1.46
Building Grounds Maintenance 635 4.04
Business/Financial Operations 742 4.73
Community/Social Services 191 1.22
Computer/Mathematical 130 0.83
Construction/Extraction 1,557 9.92
Education/Training/Library 967 6.16
Farming/Fishing/Forestry 65 0.41
Food Prep/Serving 793 5.05
Health Practitioner/Technician 447 2.85
Healthcare Support 550 3.50
Maintenance Repair 733 4.67
Legal 242 1.54
Life/Physical/Social Science 77 0.49
Management 1,146 7.30
Office/Admin. Support 2,060 13.12
Production 1,028 6.55
Protective Services 512 3.26
Sales/Related 1,928 12.28
Personal Care/Service 412 2.62
Transportation/Moving 1,188 7.57
2015 Est. Pop 16+ by Occupation Classification 15,701
Blue Collar 4,506 28.70
White Collar 8,228 52.40
Service and Farm 2,967 18.90
DESCRIPTION DATA %
2015 Est. Workers Age 16+ by Transp. to Work 15,535
Drove Alone 11,569 74.47
Car Pooled 2,865 18.44
Public Transportation 8 0.05
Walked 191 1.23
Bicycle 3 0.02
Other Means 176 1.13
Worked at Home 723 4.65
2015 Est. Workers Age 16+ by Travel Time to Work *
Less than 15 Minutes 4,368
15 - 29 Minutes 3,132
30 - 44 Minutes 2,711
45 - 59 Minutes 2,223
60 or more Minutes 2,374
2015 Est. Avg. Travel Time to Work in Minutes 34.01
2015 Est. Occupied Housing Units by Tenure 12,984
Owner Occupied 9,062 69.79
Renter Occupied 3,922 30.21
2015 Owner Occ. HUs: Avg. Length of Residence 16.1
2015 Renter Occ. HUs: Avg. Length of Residence 7.6
Community DemographicsCaldwell County, Texas

8
DESCRIPTION DATA %
2015 Est. Owner-Occupied Housing Units by Value 9,062
Value Less than $20,000 305 3.37
Value $20,000 - $39,999 529 5.84
Value $40,000 - $59,999 519 5.73
Value $60,000 - $79,999 852 9.40
Value $80,000 - $99,999 1,000 11.04
Value $100,000 - $149,999 2,606 28.76
Value $150,000 - $199,999 1,245 13.74
Value $200,000 - $299,999 1,130 12.47
Value $300,000 - $399,999 404 4.46
Value $400,000 - $499,999 198 2.18
Value $500,000 - $749,999 133 1.47
Value $750,000 - $999,999 74 0.82
Value $1,000,000 or more 67 0.74
2015 Est. Median All Owner-Occupied Housing Value $125,441
2015 Est. Housing Units by Units in Structure 14,452
1 Unit Attached 156 1.08
1 Unit Detached 8,808 60.95
2 Units 661 4.57
3 or 4 Units 450 3.11
5 to 19 Units 510 3.53
20 to 49 Units 205 1.42
50 or More Units 7 0.05
Mobile Home or Trailer 3,611 24.99
Boat, RV, Van, etc. 44 0.30
DESCRIPTION DATA %
2015 Est. Housing Units by Year Structure Built 14,452
Housing Units Built 2010 or later 830 5.74
Housing Units Built 2000 to 2009 2,474 17.12
Housing Units Built 1990 to 1999 2,554 17.67
Housing Units Built 1980 to 1989 2,554 17.67
Housing Units Built 1970 to 1979 2,088 14.45
Housing Units Built 1960 to 1969 927 6.41
Housing Units Built 1950 to 1959 1,079 7.47
Housing Units Built 1940 to 1949 672 4.65
Housing Unit Built 1939 or Earlier 1,274 8.82
2015 Est. Median Year Structure Built** 1985
Community DemographicsCaldwell County, Texas

9
About The Retail Coach
The Retail Coach, LLC, is a national retail analytics and locational intelligence firm that specializes in all aspects of retail market analyses and recruitment, from “macro to micro” trade area assessment to actively recruiting retailers on behalf of our clients.
Through its unique Retail:360 process, The Retail Coach offers a dynamic system of products and services that better enable communities to maximize their retail development potential.
Retail:360 Process
Providing more than simple data reports of psychographic and demographic trends, The Retail Coach goes well beyond other retail consulting and market research firms’ offerings by combining current national and statewide demographics and trend data with real-world, “on-the-ground” data gathered through extensive visits within our clients’ communities.
Every community is different, and there is no “one size fits all” retail recruitment solution. Compiling the gathered data into client-tailored information packets that are uniquely designed for, and targeted to, specific retailers and restaurants who meet the community’s needs helps assure our clients that they are receiving the latest and best information for their retail recruitment efforts — all with personal service and coaching guidance that continues beyond the initial project scope and timeline.
Our Retail:360 process assures that communities get timely, accurate and relevant information. Translating that data into the information that retailers need and seek assures our clients even better possibilities for tremendous retail growth and success.
The Retail Coach -It’s not about data. It’s about your success.
The Retail Coach, LLC | P. O. Box 7272 | Tupelo, Mississippi 38802tel 800.851.0962 | fax 662.844.2738 | e-mail [email protected] | web www.theretailcoach.net
C. Kelly Cofer President & CEO
The Retail Coach, LLC

10
Acknowledgements
The observations, conclusions and recommendations contained in this study are solely those of The Retail Coach, LLC and should not be construed to represent the opinions of others, including its clients, or any other entity prior to such entity’s express approval of this study.
Sources used in completing this study include: infoUSA™, Applied Geographic Solutions, Nielsen 2014/2015, ESRI 2014, U.S. Census Bureau, Economy.com, Spatial Insights Inc., Urban Land Institute, CensusViewer.com, International Council of Shopping Centers, and/or U.S. Bureau of Labor and Statistics.
To better represent current data, where applicable, portions of estimated actual sales may be calculated using an average sales per square foot model.
Mapping data is provided by MapInfo, Nielsen, ESRI and/or Microsoft Corporation.
All information furnished is from sources deemed reliable and is submitted subject to errors, omissions, change of terms and/or conditions.