community composition of the intertidal in relation to the shellfish aquaculture industry in coastal...
TRANSCRIPT

Aquaculture 433 (2014) 384–394
Contents lists available at ScienceDirect
Aquaculture
j ourna l homepage: www.e lsev ie r .com/ locate /aqua-on l ine
Community composition of the intertidal in relation to the shellfishaquaculture industry in coastal British Columbia, Canada
L.I. Bendell ⁎Department of Biological Sciences, Simon Fraser University, 8888 University Dr., Burnaby, BC V5A 1S6, Canada
⁎ Tel.: +1 778 782 5621.E-mail address: [email protected].
http://dx.doi.org/10.1016/j.aquaculture.2014.06.0270044-8486/© 2014 Elsevier B.V. All rights reserved.
a b s t r a c t
a r t i c l e i n f oArticle history:Received 27 March 2014Received in revised form 21 June 2014Accepted 24 June 2014Available online 10 July 2014
Keywords:Marine aquacultureVenerupis philippinarumIntertidalBenthic communityHemigrapsus oregonensis
The intertidal region of the Pacific Northwest is under ever increasing pressure to be used exclusively for theindustrial sized operations of shellfish aquaculture. In British Columbia (BC), aquaculture practices includeseeding the intertidal with the non-indigenous Venerupis philippinarum followed by the application of anti-predator netting. Ecological consequences of such practices applied at large scales are unknown. To assess forpossible impacts 28 farm and reference sites from 3 geographically distinct regions of BC were surveyed ineach of two years and their epibenthic, endobenthic and macroflora communities compared. The three regionsdiffered in their intensity of industry from low (Barkley), medium (Desolation) to high (Baynes).Marked regionaldifferences in intertidal community composition were observed. Of the three regions Baynes Sound, which has101 tenures, was themost alteredwith the greatest numbers of the invasive species, Batillaria sp. andHemigrapsusoregonensis. Barkley Sound, the region with the lowest industrial intensity, was characterized byMytilus trossulusand the absence of H. oregonensis. The mid-intensity region, Desolation Sound, was characterized by Littorinascutulata and Tectura persona. Within Baynes Sound, seeding appears to be acting as an attractant for crabpredators with farm sites having on average 3-fold greater numbers as compared to reference sites. Farmingpractices were also found to encourage growth and biofouling of the intertidal with Ulva sp. Consequences ofchanges in community composition in this case, an increase in the abundance of a major intertidal predator,H. oregonensis, on ecosystem functioning within these sensitive coastal areas are not known.
© 2014 Elsevier B.V. All rights reserved.
1. Introduction
A major industrial development to coastal ecosystems as a conse-quence of the ever increasing demand for a secure source of protein isfinfish and shellfish aquaculture (Naylor et al., 2000). On the westcoast of British Columbia (BC), Canada, industry and the federal andprovincial governments are aggressively expanding shellfish aquaculturewith Venerupis (Ruditapes) philippinarum (A. Adams and Reeve, 1850)one of the main products farmed. V. philippinarum is an invasive specieswhich “hitch-hiked” on oyster seed brought over from Japan in the mid1930s (Gillespie et al., 2012; Quayle and Bourne, 1972).
Currently there are 284 tenures for V. philippinarum culture in BCwith the greatest intensity occurring within Baynes Sound (Gillespieet al., 2012). Dumbauld et al. (2009) have suggested that shellfishaquaculture can be viewed as a disturbance to the coastal environmentin threeways; 1) changes inmaterials processing (e.g., nutrient flux), 2)addition of physical structures (e.g., anti-predator netting) and 3) pulsedisturbances such as harvesting. Although not noted in their review,near-bottom marine aquaculture of V. philippinarum that includes
seeding with juvenile clams at densities of 200 to 700/m2 could alsobe considered as a “pulse disturbance”.
All of the above listed disturbances have the potential to alter theexisting intertidal environment and hence community. Sorokin et al.(1999), Bartoli et al. (2001), Beadman et al. (2004) and Bendell-Younget al. 2010 have all shown that netted farm sites accumulate more or-ganicmatter and silt as compared to sites not farmed. Intensive shellfishfarming has also been reported to decrease benthic diversity andchange the intertidal species composition to one dominated by bivalvesand deposit feedingworms (Bendell-Young, 2006; Spencer et al., 1997).By contrast, McKindsey et al. (2007) note that application of anti-predator nets to the intertidal increases its structural complexity andin some cases may increase the abundance of intertidal organismstaking advantage of the new three dimensional habitat. For example,Powers et al. (2007) report that macroalgae growing on anti-predatornetting enhanced nursery habitat for mobile invertebrates and juvenilefishes as compared to an unstructured sand flat.
Possibly contributing to the conflicting reports is that studies todate have been limited in geographical scope and have not taken intoconsideration the intensity of shellfish farming that can occur. Hence,the objective of this study was through a comparison of farm versusreference intertidal sites from three regions of coastal BC which
385L.I. Bendell / Aquaculture 433 (2014) 384–394
experience different intensities of industrial shellfish farming activity,to assess the potential effects of applying anti-predator netting incombination with seeding on the intertidal macroflora, epibenthic(surface) and endobenthic (sub-surface) communities. Such informationwill add to a better understanding as to how the intertidal communityresponds to the practices of shellfish farming structure such that wecan bettermanage these sensitive ecosystems. This study also representsthemost comprehensive intertidal survey of the low to high tide regionsof coastal BC.
2. Methods
2.1. Study area
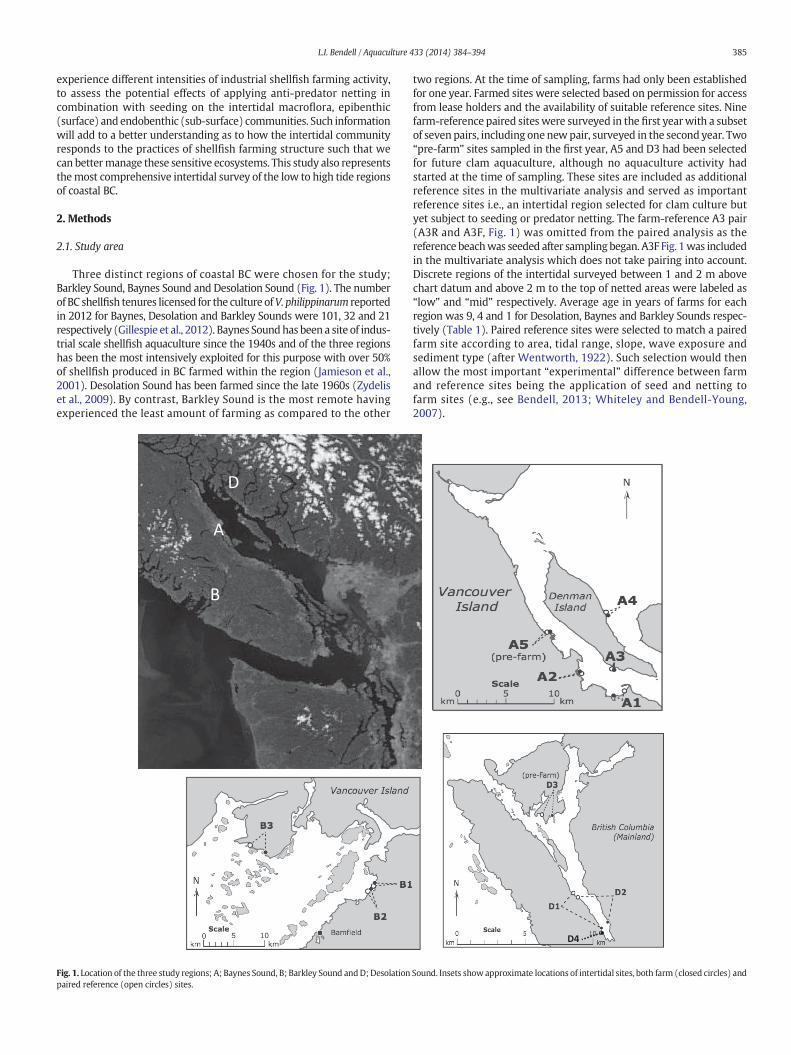
Three distinct regions of coastal BC were chosen for the study;Barkley Sound, Baynes Sound and Desolation Sound (Fig. 1). The numberof BC shellfish tenures licensed for the culture ofV. philippinarum reportedin 2012 for Baynes, Desolation and Barkley Sounds were 101, 32 and 21respectively (Gillespie et al., 2012). Baynes Soundhas been a site of indus-trial scale shellfish aquaculture since the 1940s and of the three regionshas been the most intensively exploited for this purpose with over 50%of shellfish produced in BC farmed within the region (Jamieson et al.,2001). Desolation Sound has been farmed since the late 1960s (Zydeliset al., 2009). By contrast, Barkley Sound is the most remote havingexperienced the least amount of farming as compared to the other
D
A
B
Fig. 1. Location of the three study regions; A; Baynes Sound, B; Barkley Sound andD; Desolationpaired reference (open circles) sites.
two regions. At the time of sampling, farms had only been establishedfor one year. Farmed sites were selected based on permission for accessfrom lease holders and the availability of suitable reference sites. Ninefarm-reference paired sites were surveyed in the first yearwith a subsetof seven pairs, including one newpair, surveyed in the second year. Two“pre-farm” sites sampled in the first year, A5 and D3 had been selectedfor future clam aquaculture, although no aquaculture activity hadstarted at the time of sampling. These sites are included as additionalreference sites in the multivariate analysis and served as importantreference sites i.e., an intertidal region selected for clam culture butyet subject to seeding or predator netting. The farm-reference A3 pair(A3R and A3F, Fig. 1) was omitted from the paired analysis as thereference beachwas seeded after sampling began. A3F Fig. 1was includedin the multivariate analysis which does not take pairing into account.Discrete regions of the intertidal surveyed between 1 and 2 m abovechart datum and above 2 m to the top of netted areas were labeled as“low” and “mid” respectively. Average age in years of farms for eachregion was 9, 4 and 1 for Desolation, Baynes and Barkley Sounds respec-tively (Table 1). Paired reference sites were selected to match a pairedfarm site according to area, tidal range, slope, wave exposure andsediment type (after Wentworth, 1922). Such selection would thenallow the most important “experimental” difference between farmand reference sites being the application of seed and netting tofarm sites (e.g., see Bendell, 2013; Whiteley and Bendell-Young,2007).
D4o.
Sound. Insets show approximate locations of intertidal sites, both farm (closed circles) and
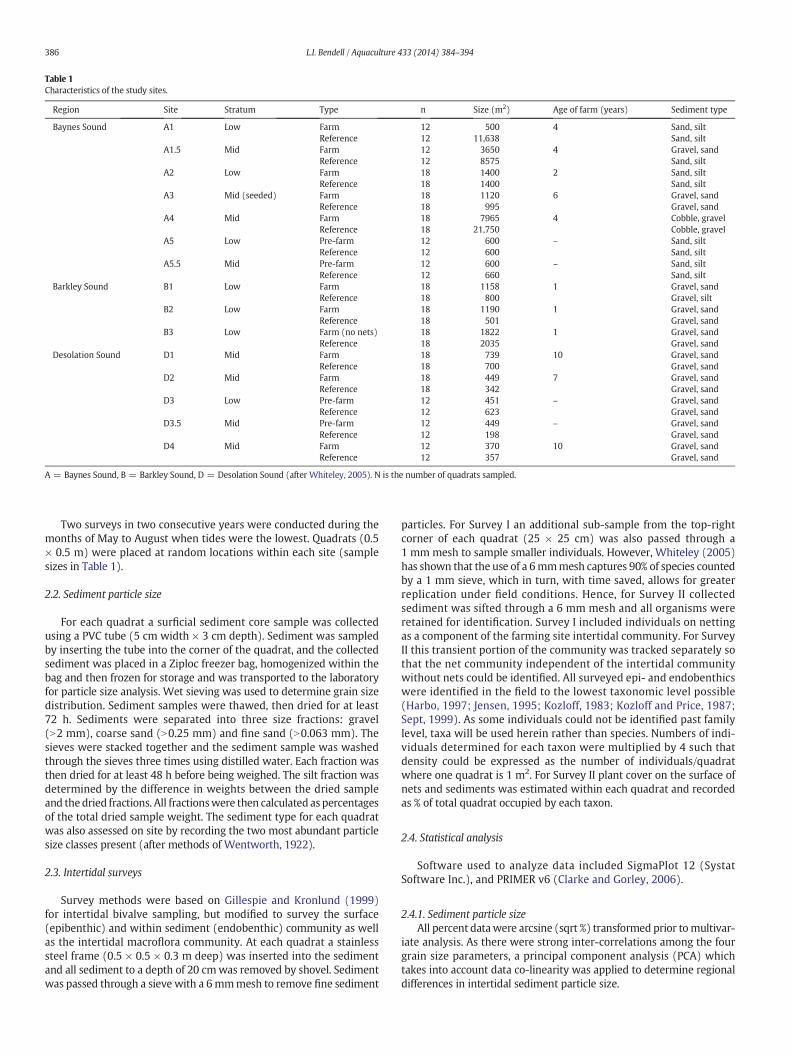
Table 1Characteristics of the study sites.
Region Site Stratum Type n Size (m2) Age of farm (years) Sediment type
Baynes Sound A1 Low Farm 12 500 4 Sand, siltReference 12 11,638 Sand, silt
A1.5 Mid Farm 12 3650 4 Gravel, sandReference 12 8575 Sand, silt
A2 Low Farm 18 1400 2 Sand, siltReference 18 1400 Sand, silt
A3 Mid (seeded) Farm 18 1120 6 Gravel, sandReference 18 995 Gravel, sand
A4 Mid Farm 18 7965 4 Cobble, gravelReference 18 21,750 Cobble, gravel
A5 Low Pre-farm 12 600 – Sand, siltReference 12 600 Sand, silt
A5.5 Mid Pre-farm 12 600 – Sand, siltReference 12 660 Sand, silt
Barkley Sound B1 Low Farm 18 1158 1 Gravel, sandReference 18 800 Gravel, silt
B2 Low Farm 18 1190 1 Gravel, sandReference 18 501 Gravel, sand
B3 Low Farm (no nets) 18 1822 1 Gravel, sandReference 18 2035 Gravel, sand
Desolation Sound D1 Mid Farm 18 739 10 Gravel, sandReference 18 700 Gravel, sand
D2 Mid Farm 18 449 7 Gravel, sandReference 18 342 Gravel, sand
D3 Low Pre-farm 12 451 – Gravel, sandReference 12 623 Gravel, sand
D3.5 Mid Pre-farm 12 449 – Gravel, sandReference 12 198 Gravel, sand
D4 Mid Farm 12 370 10 Gravel, sandReference 12 357 Gravel, sand
A = Baynes Sound, B = Barkley Sound, D = Desolation Sound (after Whiteley, 2005). N is the number of quadrats sampled.
386 L.I. Bendell / Aquaculture 433 (2014) 384–394
Two surveys in two consecutive years were conducted during themonths of May to August when tides were the lowest. Quadrats (0.5× 0.5 m) were placed at random locations within each site (samplesizes in Table 1).
2.2. Sediment particle size
For each quadrat a surficial sediment core sample was collectedusing a PVC tube (5 cm width × 3 cm depth). Sediment was sampledby inserting the tube into the corner of the quadrat, and the collectedsediment was placed in a Ziploc freezer bag, homogenized within thebag and then frozen for storage and was transported to the laboratoryfor particle size analysis. Wet sieving was used to determine grain sizedistribution. Sediment samples were thawed, then dried for at least72 h. Sediments were separated into three size fractions: gravel(N2 mm), coarse sand (N0.25 mm) and fine sand (N0.063 mm). Thesieves were stacked together and the sediment sample was washedthrough the sieves three times using distilled water. Each fraction wasthen dried for at least 48 h before being weighed. The silt fraction wasdetermined by the difference in weights between the dried sampleand the dried fractions. All fractionswere then calculated as percentagesof the total dried sample weight. The sediment type for each quadratwas also assessed on site by recording the two most abundant particlesize classes present (after methods of Wentworth, 1922).
2.3. Intertidal surveys
Survey methods were based on Gillespie and Kronlund (1999)for intertidal bivalve sampling, but modified to survey the surface(epibenthic) and within sediment (endobenthic) community as wellas the intertidal macroflora community. At each quadrat a stainlesssteel frame (0.5 × 0.5 × 0.3 m deep) was inserted into the sedimentand all sediment to a depth of 20 cmwas removed by shovel. Sedimentwas passed through a sieve with a 6mmmesh to remove fine sediment
particles. For Survey I an additional sub-sample from the top-rightcorner of each quadrat (25 × 25 cm) was also passed through a1 mm mesh to sample smaller individuals. However, Whiteley (2005)has shown that the use of a 6mmmesh captures 90% of species countedby a 1 mm sieve, which in turn, with time saved, allows for greaterreplication under field conditions. Hence, for Survey II collectedsediment was sifted through a 6 mm mesh and all organisms wereretained for identification. Survey I included individuals on nettingas a component of the farming site intertidal community. For SurveyII this transient portion of the community was tracked separately sothat the net community independent of the intertidal communitywithout nets could be identified. All surveyed epi- and endobenthicswere identified in the field to the lowest taxonomic level possible(Harbo, 1997; Jensen, 1995; Kozloff, 1983; Kozloff and Price, 1987;Sept, 1999). As some individuals could not be identified past familylevel, taxa will be used herein rather than species. Numbers of indi-viduals determined for each taxon were multiplied by 4 such thatdensity could be expressed as the number of individuals/quadratwhere one quadrat is 1 m2. For Survey II plant cover on the surface ofnets and sediments was estimated within each quadrat and recordedas % of total quadrat occupied by each taxon.
2.4. Statistical analysis
Software used to analyze data included SigmaPlot 12 (SystatSoftware Inc.), and PRIMER v6 (Clarke and Gorley, 2006).
2.4.1. Sediment particle sizeAll percent datawere arcsine (sqrt %) transformed prior tomultivar-
iate analysis. As there were strong inter-correlations among the fourgrain size parameters, a principal component analysis (PCA) whichtakes into account data co-linearity was applied to determine regionaldifferences in intertidal sediment particle size.
-20 -10 0 10 20 30-20
-10
0
10
A1FA1R
A1.5F
A1.5R
A3FA3R
A4F
A4R
B1FB1R
B2F
B2R
D1FD1R
D4F
D4R
Gravel
CS
FSMUD
-30 -20 -10 0 10 20-20
-10
0
10
20
A1FA1R A1.5FA1.5R
A2F
A2RA3F
A4F
A4R A5F
A5R
A5.5FA5.5R B1F
B1R
B2F
B2R B3F
B3R
D1R
D2FD2R
D3FD3R
D3.5FD3.5R
Gravel
CS
FS
MUD
Survey I
Survey II
80%
80%PC1
PC1
PC2
PC2
Fig. 2. Principle component analysis (PCA), Surveys I and II, with sediment variables of %gravel, coarse sand, fine sand and mud (particle size given within methods). The first PCaccounts for 80% of the variability in grain size among the sites in both survey yearswith sites A1 and A1.5 within Baynes Sound being most different from all other sites.Variables contributing to the separation of the sites are provided in the vector overlayfor each survey with the first PC in both surveys most heavily weighted by % percentgravel. CS is coarse sediment, FS is fine sediment. F is farmed, R is reference.
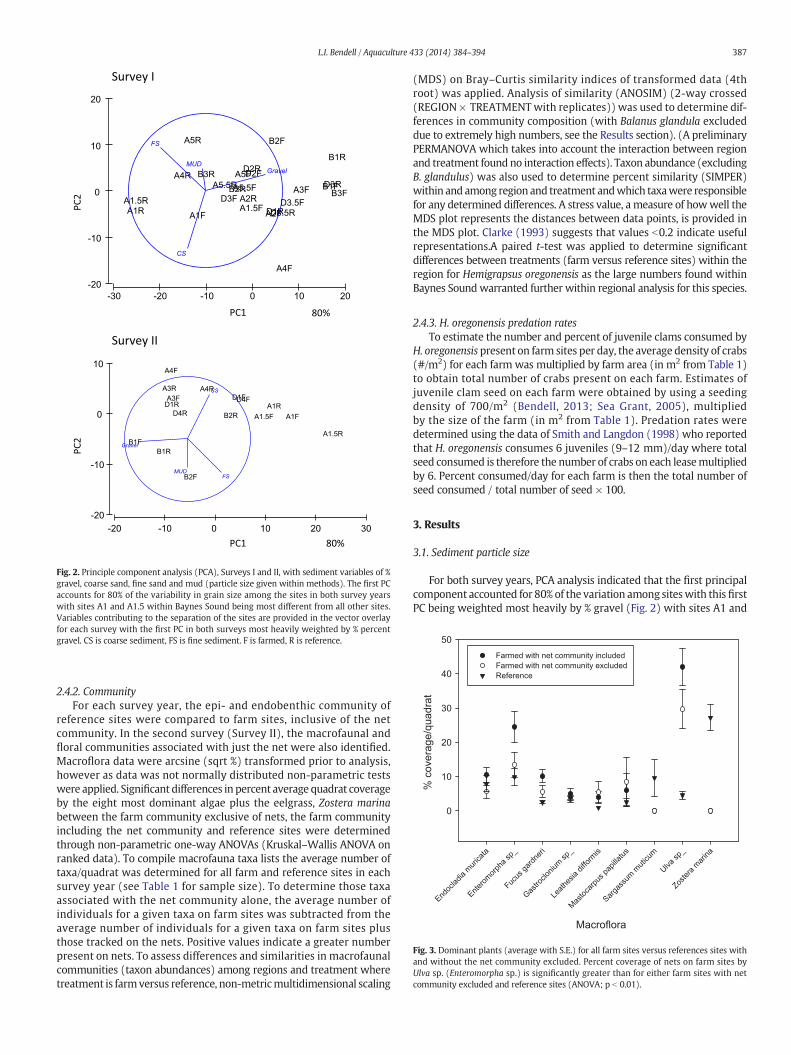
Fig. 3. Dominant plants (average with S.E.) for all farm sites versus references sites withand without the net community excluded. Percent coverage of nets on farm sites byUlva sp. (Enteromorpha sp.) is significantly greater than for either farm sites with netcommunity excluded and reference sites (ANOVA; p b 0.01).
387L.I. Bendell / Aquaculture 433 (2014) 384–394
2.4.2. CommunityFor each survey year, the epi- and endobenthic community of
reference sites were compared to farm sites, inclusive of the netcommunity. In the second survey (Survey II), the macrofaunal andfloral communities associated with just the net were also identified.Macroflora data were arcsine (sqrt %) transformed prior to analysis,however as data was not normally distributed non-parametric testswere applied. Significant differences in percent average quadrat coverageby the eight most dominant algae plus the eelgrass, Zostera marinabetween the farm community exclusive of nets, the farm communityincluding the net community and reference sites were determinedthrough non-parametric one-way ANOVAs (Kruskal–Wallis ANOVA onranked data). To compile macrofauna taxa lists the average number oftaxa/quadrat was determined for all farm and reference sites in eachsurvey year (see Table 1 for sample size). To determine those taxaassociated with the net community alone, the average number ofindividuals for a given taxa on farm sites was subtracted from theaverage number of individuals for a given taxa on farm sites plusthose tracked on the nets. Positive values indicate a greater numberpresent on nets. To assess differences and similarities in macrofaunalcommunities (taxon abundances) among regions and treatment wheretreatment is farmversus reference, non-metricmultidimensional scaling
(MDS) on Bray–Curtis similarity indices of transformed data (4throot) was applied. Analysis of similarity (ANOSIM) (2-way crossed(REGION × TREATMENTwith replicates)) was used to determine dif-ferences in community composition (with Balanus glandula excludeddue to extremely high numbers, see the Results section). (A preliminaryPERMANOVA which takes into account the interaction between regionand treatment found no interaction effects). Taxon abundance (excludingB. glandulus) was also used to determine percent similarity (SIMPER)within and among region and treatment andwhich taxawere responsiblefor any determined differences. A stress value, a measure of howwell theMDS plot represents the distances between data points, is provided inthe MDS plot. Clarke (1993) suggests that values b0.2 indicate usefulrepresentations.A paired t-test was applied to determine significantdifferences between treatments (farm versus reference sites) within theregion for Hemigrapsus oregonensis as the large numbers found withinBaynes Soundwarranted further within regional analysis for this species.
2.4.3. H. oregonensis predation ratesTo estimate the number and percent of juvenile clams consumed by
H. oregonensispresent on farm sites per day, the average density of crabs(#/m2) for each farm was multiplied by farm area (in m2 from Table 1)to obtain total number of crabs present on each farm. Estimates ofjuvenile clam seed on each farm were obtained by using a seedingdensity of 700/m2 (Bendell, 2013; Sea Grant, 2005), multipliedby the size of the farm (in m2 from Table 1). Predation rates weredetermined using the data of Smith and Langdon (1998) who reportedthat H. oregonensis consumes 6 juveniles (9–12 mm)/day where totalseed consumed is therefore the number of crabs on each leasemultipliedby 6. Percent consumed/day for each farm is then the total number ofseed consumed / total number of seed × 100.
3. Results
3.1. Sediment particle size
For both survey years, PCA analysis indicated that the first principalcomponent accounted for 80% of the variation among siteswith this firstPC being weighted most heavily by % gravel (Fig. 2) with sites A1 and

Table 2Taxon abundance across regions for farmed and reference sites. Values are means of average number of individuals/quadrat for each site. In Survey I, 9 farmed and 7 reference sites weresampled, in Survey II 7 farmed and reference sites were sampled. Total number of quadrats/site are provided in Table 1. SE is standard error. Net community included for both years.
Taxa Mean SE Taxa Mean SE
Farmed Reference
SURVEY IBalanus glandula 1081.01 374.5 Balanus glandula 1899.35 600.5Venerupis philippinarum 312.2 61.27 Phylum Nemertea 158.185 43.043Hemigrapsus oregonensis 232.733 68.841 Hemigrapsus oregonensis 157.074 53.469Phylum Nemertea 136.322 40.298 Tectura persona 115.284 58.454Littorina scutulata 113.589 75.684 Venerupis philippinarum 93.025 39.6Tectura persona 79.889 31.25 Littorina scutulata 85.309 49.613Mytilus trossulus 66.411 37.238 Spirorbis sp. 75.037 72.977Glycera sp. 60.078 9.19 Mytilus trossulus 67.975 60.003Macoma balthica 49.344 18.438 Glycera sp. 51.21 13.376Protothaca staminea 41.611 12.309 Macoma balthica 49.741 19.212Pagurus hirsutiusculus 36.222 29.604 Protothaca staminea 45.741 12.278Batillaria sp. 35.978 24.773 Batillaria sp. 39.247 32.383Spirorbis sp. 23.778 17.809 Nuttallia obscurata 35.605 24.651Order Amphipoda 22.467 10.936 Macoma natusata 25.284 13.405Littorina sitkana 20.9 8.504 Pagurus hirsutiusculus 17 9.996Cryptomya californica 18.4 5.822 Littorina sitkana 12.802 6.417Upogebia pugettensis 18.122 9.705 Cryptomya californica 10.531 4.721Macoma nasuta 14.156 6.782 Dendraster excentricus 10.531 6.9Macoma inquinata 9.533 3.676 Mya arenaria 9.321 3.419Scleroplax granulata 9.256 4.846 Nephtys sp. 8.346 3.996Nuttallia obscurata 7.511 4.308 Order Amphipoda 8.037 2.833Mya arenaria 6.267 3.867 Upogebia pugettensis 7.062 5.75Nereis vexillosa 4.5 1.084 Nereis vexillosa 5.481 1.567Crassostrea gigas 4.367 2.493 Phylum Nematoda 5.049 4.831Hemigrapsus nudus 3.7 1.758 Crassostrea gigas 4.704 3.552Nephtys sp. 3.322 1.709 Macoma inquinata 3.852 1.335Pagurus granosimanus 2.333 1.467 Hemigrapsus nudus 3.481 2.572Nereis brandti 1.589 0.614 Scleroplax granulata 3.395 3.106Heptacarpus sitchensis 1.5 1.106 Pagurus granosimanus 2.914 2.01Gnorimosphaeroma sp. 1.422 0.867 Tegula funebralis 2.79 2.79Family Idoteidae 1.222 1.082 Saxidomus gigantea 1.802 0.85Betaeus harrimani 1.122 0.787 Bittium eschrichtii 1.704 1.596Tegula funebralis 1.022 1.022 Alia carinata 0.802 0.529Neotrypaea californiensis 0.756 0.421 Amphiporus bimaculatus 0.519 0.289Saxidomus gigantea 0.667 0.331 Family Idoteidae 0.494 0.494Pagurus caurinus 0.622 0.552 Gnorimosphaeroma sp. 0.469 0.311Amphiporus bimaculatus 0.533 0.533 Neotrypaea californiensis 0.469 0.393Lirabuccinum dirum 0.467 0.395 Parvilucina tenuisculpta 0.469 0.214Tectura scutum 0.411 0.231 Macoma sp. 0.432 0.405Kaburakia excelsa 0.378 0.265 Macoma oblique 0.407 0.233Macoma oblique 0.3 0.178 Nereis brandti 0.395 0.127Rhamphidonta retifera 0.222 0.178 Nucella lamellos 0.321 0.321Pseudopythina rugifera 0.211 0.103 Ocenebra lurida 0.247 0.247Family buccinidae 0.133 0.133 Pholis ornata 0.247 0.15Macoma sp. 0.133 0.133 Family Buccinidae 0.198 0.198Neotrypaea californiensis 0.133 0.133 Pugettia producta 0.198 0.15Boltenia villosa 0.111 0.111 Betaeus harrimani 0.173 0.173Pholis ornata 0.0889 0.0491 Pseudopythina rugifera 0.173 0.147Lepidogobius lepidus 0.0444 0.0444 Tectura scutum 0.173 0.147Nucella lamellosa 0.0444 0.0444 Clinocardium nuttallii 0.16 0.0851Pugettia producta 0.0333 0.0333 Rhamphidonta retifera 0.123 0.0988Cancer magistea 0.0222 0.0222 Kaburakia excelsa 0.0988 0.0988Clinocardium nuttallii 0.0222 0.0222 Nemocardium centifilosum 0.0617 0.0419Ocenebra lurida 0.0222 0.0222 Boltenia villosa 0.0494 0.0494
Lepidogobius lepidus 0.0494 0.0494Anthopleura xanthogrammica 0.037 0.037Cancer magistea 0.037 0.037Neotrypaea affinis 0.0247 0.0247Pagurus caurinus 0.0247 0.0247
SURVEY IIBalanus glandula 1113.5 254.5 Balanus glandula 4059.5 1857.5Venerupis philippinarum 314.975 75.697 Mytilus trossulus 157.829 149.935Mytilus trossulus 167.55 120.768 Venerupis philippinarum 153.486 62.303Hemigrapsus oregonensis 61.4 19.795 Chthamalus dalli 127.171 117.233Protothaca staminea 49.75 12.764 Littorina scutulata 96.829 50.018Glycera sp. 42.45 5.676 Tectura persona 72.371 33.699Phylum Nemertea 37.675 11.223 Batillaria sp. 70.057 38.918Batillaria sp. 35.975 21.357 Nuttallia obscurata 51.371 41.236Tectura persona 29.025 6.886 Protothaca staminea 46.286 23.434
388 L.I. Bendell / Aquaculture 433 (2014) 384–394

Table 2 (continued)
Taxa Mean SE Taxa Mean SE
Farmed Reference
Littorina scutulata 27.375 12.808 Macoma balthica 44.057 21.708Macoma balthica 25.025 10.589 Hemigrapsus oregonensis 31.057 12.411Macoma nasuta 22.375 15.281 Glycera sp. 29.714 8.884Spirorbis sp. 17.375 17.375 Macoma natusata 28.486 17.41Macoma inquinata 12.5 6.516 Phylum Nemertea 22.229 6.694Semibalanus cariosus 9.775 8.757 Littorina sitkana 7.971 3.805Cryptomya californica 8.975 1.774 Cryptomya californica 7.829 5.237Littorina sitkana 8.65 2.972 Nephtys sp. 7.257 4.881Pagurus hirsutiusculus 7.75 5.284 Macoma inquinata 6.543 4.035Nuttallia obscurata 6.75 4.81 Mya arenaria 5.8 4Chthamalus dalli 6.65 3.726 Pagurus hirsutiusculus 4.829 3.52Pagurus granosimanus 4.925 3.202 Order Amphipoda 3.343 2.292Upogebia pugettensis 4.7 2.622 Crassostrea gigas 2.771 1.941Nereis vexillosa 4.35 2.251 Nucella emarginata 2.314 1.451Order Amphipoda 4.175 2.37 Tectura scutum 2.029 1.471Hemigrapsus nudus 3.2 1.156 Semibalanus cariosus 1.8 1.636Mya arenaria 2.875 0.948 Nereis vexillosa 1.429 0.642Gnorimosphaeroma sp. 2.25 1.691 Hemigrapsus nudus 1.257 0.719Neotrypaea californiensis 1.575 1.018 Upogebia pugettensis 1.057 0.552Nephtys sp. 1.475 0.8 Nassa mendicus 0.743 0.648Saxidomus gigantea 1.15 0.815 Spirorbis sp. 0.714 0.714Nereis brandti 1.075 0.233 Gnorimosphaeroma sp. 0.629 0.629Idotea wosnesenskii 1.025 0.592 Pagurus granosimanus 0.629 0.417Nucella emarginata 1 0.51 Saxidomus gigantea 0.629 0.471Crassostrea gigas 0.75 0.295 Nereis brandti 0.371 0.171Tectura scutum 0.525 0.441 Neotrypaea californiensis 0.286 0.162Scleroplax granulata 0.375 0.219 Boltenia villosa 0.0857 0.0857Lottia pelta 0.3 0.248 Idotea wosnesenskii 0.0857 0.0595Boltenia villosa 0.275 0.275 Lirabuccinum dirum 0.0857 0.0857Tellin carpenteri 0.2 0.151 Modiolus rectus 0.0857 0.0595Pagurus caurinus 0.2 0.2 Pagurus caurinus 0.0857 0.0857Modiolus rectus 0.175 0.175 Parvalucina tenuisculpta 0.0857 0.0595Betaeus harrimani 0.15 0.105 Hemigrapsus sp. 0.0571 0.0571Pseudopythina rugifera 0.1 0.0756 Kaburakia excelsa 0.0571 0.0571Lirabuccinum dirum 0.1 0.1 Lottia pelta 0.0571 0.0369Pholis ornata 0.075 0.0526 Betaeus harrimani 0.0286 0.0286Parvalucina tenuisculpta 0.075 0.0526 Lottia digitalis 0.0286 0.0286Rhamphidonta retifera 0.05 0.0327 Pseudopythina rugifera 0.0286 0.0286Hemigrapsus sp. 0.05 0.0327 Tectura fenestrata 0.0286 0.0286Kaburakia excelsa 0.025 0.025 Tellin carpenteri 0.0286 0.0286Tectura fenestrata 0.025 0.025
SURVEY II
389L.I. Bendell / Aquaculture 433 (2014) 384–394
A1.5 within Baynes Sound being most different from all other sites(Fig. 2).
3.2. Intertidal macroflora
With the net community included, farm sites were dominated byUlva sp. (Enteromorpha sp., Hayden et al., 2003) as compared to refer-ence sites (ANOVA p b 0.01, Fig. 3). Other important taxa presentincluded; Z. marina, Mastocarpus papillatus, Endocladia muricata, Fucusgardneri, Leathesia difformis, Gastroclonium sp., and Sargassum muticum.With the net community excluded, only one farm site was coveredby Ulva sp. Plant coverage of reference sites was less than 20% withthe exception of one site in Barkley Sound where high coverage byZ. marina occurred (Fig. 3).
3.3. Intertidal macrofauna
3.3.1. AbundancesBy far themost abundant taxon on both farm and reference siteswas
B. glandula (Table 2; taxon are listed in order of decreasing abundance).Following B. glandula, reference communities in Survey I were charac-terized by Nemertea, H. oregonensis, Tectura persona, V. philippinarumand Littorina scutulata (Table 2). The reference community in Survey IIwas characterized first by Mytilus trossulus, then V. philippinarum,L. scutulata, T. persona andBatillaria sp. (Table 2) (Note: the highnumbers
of the native barnacle Chthamalus dalli occurred only at 3 reference sitesin Baynes Sound). By contrast, farm sites in both survey years werecharacterizedfirst by V. philippinarum, second,H. oregonensis/M. trossulusthen Nemertea (Table 2). The epibenthics, B. glandula, L. scutulata,M. trossulus and T. persona were predominantly associated with thenets (Fig. 4).
3.3.2. Community compositionMultidimensional scaling (MDS) analysis of macrofaunal communi-
ties indicated distinct regional differences in both survey years (Fig. 5aand b; stress = 0.15 and 0.14 for Surveys I and II respectively;ANOSIM, p = 0.001 for Surveys I and II, Table 3) (Fig. 5a and b). Thisregional distinctiveness was mostly driven by Baynes and BarkleySounds, with differences between Baynes and Desolation and Barkleyand Desolation being less significant (Table 3). Treatment was notsignificant over all regions (significance level of sample statistic of53.7% and 56.2% for Surveys I and II respectively (Table 3)). Percent sim-ilarity (SIMPER) indicated that for Surveys I and II, the main taxa thatconsistently contributed to the dissimilarity among regions wereH. oregonensis, Batillaria sp., M. trossulus and L. scutulata (Tables 4 and5, Figs. 6a–d and 7a–d).H. oregonensis and Batillaria sp.were significantlygreater in Baynes as compared to Barkley andDesolation Sound (Tables 4and 5; Figs. 6a, b and7a, b). In both survey years, Barkley Soundwas char-acterized by greater numbers of M. trossulus as compared to Desolationand Baynes Sounds (Tables 4 and 5, Figs. 6c and 7c). Desolation Sound

Fig. 4. The difference between the average number of individuals/quadrat found on farmsites inclusive of the net community and farm sites excluding the net community.
390 L.I. Bendell / Aquaculture 433 (2014) 384–394
was characterized from Barkley and to a lesser extent Baynes Sound byL. scutulata (Tables 4 and 5, Figs. 6a, b, c and d and 7a, b, c and d).
Because of the large numbers of H. oregonensis present in BaynesSound this taxon was further analyzed for differences between farmand reference sites, within the region. For only Baynes Sound (withpre-farm sites excluded), in both survey years, farm sites had signifi-cantly greater numbers of H. oregonensis as compared to reference
a)
b)
Fig. 5. a and b. MDS analysis of macrofaunal communities for the 3 regions indicatingdistinct regional differences. Stress values are 0.15 and 0.14 for Surveys I (a) and II(b) respectively. Notation as, A; Baynes, B; Barkley, D; Desolation, number is replicate, F;farm, R; reference and P indicates “pre-farm” state (see also Table 1 for site identification).
sites (paired t-test; p ≤ 0.05; Fig. 8a and b). Pre-farm sites, which hadnot been seeded with juvenile clams did not have greater numbers ascompared to their reference sites and seeded farms had approximatelyfive times greater abundances of H. oregonensis as compared to thepre-farm sites (Fig. 8a and b). Estimated predation rates demonstratethat for farms within Baynes Sound, numbers of H. oregonensis havethe potential to consume greater than 100% of juvenile seed set at adensity of 700/m2 in one day (Fig. 9).
4. Discussion
Of the three regions surveyed, Baynes Sound which experiencesthe greatest intensity of shellfish aquaculture, was the most alteredwith the greatest numbers of the invasive species, Batillaria sp. andH. oregonensis. Barkley Sound, the region with the lowest industrialintensity, was characterized by M. trossulus and the absence ofH. oregonensis. The mid-intensity region, Desolation Sound, wascharacterized by L. scutulata and T. persona. Further, within BaynesSound, seeding appears to be acting as an attractant for crab predatorswith farm sites having on average 3-fold greater numbers as comparedto reference sites. Farming practices were also found to encouragegrowth and biofouling of the intertidal with Ulva sp.
4.1. Sediment particle size
As noted in Honkoop et al. (2006), the presence or absence of anintertidal species may be dependent on sediment grain size. Hencean important aspect of this study was a comparison of grain sizeattributes among the three geographically distinct regions. Eightypercent of the variation in sediment particle size among the three regionswas explained by differences in % gravel with only sites A1 and A1.5within Baynes Sound being unique to all other sites with respect toamounts of fine silt. Although there was characteristic “patchiness” inthe distribution of particular taxa, intertidal communities were bothregion and treatment (where treatment is the farming practices ofseeding and netting) dependent and did not relate to sediment grainsize.
4.2. Macroflora
Intertidal regions that were farmed and covered by anti-predatornetting were biofouled with Ulva sp. Little alga coverage occurred onreference beaches and when present it was either the eelgrass,Z. marina or F. gardneri. Powers et al. (2007) found that the macroalgaebiomass per unit bottom area was significantly greater on aquaculturemesh as compared to a sandy beach and was similar to a naturalseagrass bed biomass. Taxa of the mostly attached macroalga reported
Table 3ANOSIM results for the macrofaunal intertidal community determined in Surveys I and II.If no effect of groups (regions), then R = 0. A, B and D are Baynes, Barkley and DesolationSound respectively.
Differences between region groups across all treatment groups
Survey I Survey II
Global R: 0.638 Global R: 0.701Pairwise tests
GroupsR Significance R Significance
A versus B0.677 0.002 0.843 0.0013
A versus D0.529 0.003 0.367 0.0107
B versus D0.846 0.004 1 0.0111
Differences between treatment groups (across all REGION groups)
Sample statistic (Global R): −0.028 −0.054Significance level of sample statistic: 53.7% 56.2%

Table 4Average dissimilarity between groups; contributions of the top five taxa; Survey I.
Groups A & B
Average dissimilarity = 46.24
Group A Group B
Taxa Average Average Contribution Cumulative
Abundance Abundance % %
H. oregonensis 4.05 1.39 5.74 5.74Batillaria sp. 2.2 0 4.98 10.73M. trossulus 1.17 3.07 4.71 15.43P. hirsutiusculus 1.93 0.23 3.63 19.07Phylum Nemertea 3.81 2.27 3.47 22.54
Groups A & D
Average dissimilarity = 38.72
Group A Group D
Taxa Average Average Contribution Cumulative
Abundance Abundance % %
L. scutulata 1.94 3.28 5.37 5.37Batillaria sp. 2.2 0.2 4.92 10.29T. persona 2.32 3.42 4.3 14.59V. philippinarum 2.95 4.49 3.64 18.23Nephtys sp. 1.58 0.17 3.31 21.54
Groups B & D
Average dissimilarity = 41.10
Group B Group D
Taxa Average Average Contribution Cumulative
Abundance Abundance % %
L. scutulata 0.75 3.28 7.24 7.25H. oregonensis 1.39 3.84 6.45 13.7M. trossulus 3.07 1.39 4.98 18.68T. persona 1.65 3.42 4.69 23.36H. nudus 0.33 1.89 4.11 27.47
A, B and D are Baynes, Barkley and Desolation Sound respectively. Bolded taxa mostconsistently contribute to the dissimilarity between groups.
Table 5Average dissimilarity between groups; contributions of the top five taxa; Survey II.
Groups A & B
Average dissimilarity = 42.41
Group A Group B
Taxa Average Average Contribution Cumulative
Abundance Abundance % %
M. trossulus 1.35 4.49 8.44 8.44Batillaria sp. 2.37 0 6.4 14.84H. oregonensis 2.91 1.16 4.53 19.37M. nasuta 1.98 0.74 4.3 23.66L. scutulata 2.29 0.95 3.91 27.57
Groups A & D
Average dissimilarity = 35.99
Group A Group D
Taxa Average Average Contribution Cumulative
Abundance Abundance % %
Batillaria sp. 2.37 1.53 5.28 5.28M. nasuta 1.98 0.74 4.43 9.71M. balthica 1.63 0.72 4.18 13.89
391L.I. Bendell / Aquaculture 433 (2014) 384–394
by Powers et al. (2007) included (in order of relative contribution tobiomass) Codium sp., Dictyota dichotoma, Ulva sp. (f. Enteromorphaspp.), Fucus vesiculosus, Padina gymnospora, Gracilaria tikvahiae, Hypneamusicformiz and Sargassum filipendula. As reported in the current study,the dominant algae identified by Powers et al. (2007) was Ulva sp.Codium, also a dominant algae, is an invasive from Japan (Silva, 1955).Increases in Ulva sp. in association with shellfish farming activitieshave also been reported by Van Alstyne et al. (2011). These authorsfound that intertidal pools left behind by recreational clam harvesterswere enriched with nutrients, notably ammonium which in turn facili-tated the formation and persistence of an Ulva sp. bloom. Ulva sp. is anuisance algae, associated with eutrophication and generally poorerwater quality conditions.
Nephtys sp. 1.39 0 4.16 18.05N. obscurata 1.26 2.28 3.76 21.81
Groups B & D
Average dissimilarity = 45.18
Group B Group D
Taxa Average Average Contribution Cumulative
Abundance Abundance % %
M. trossulus 4.49 0.46 11.29 11.29M. balthica 2.69 0.72 5.48 16.77L. scutulata 0.95 2.85 5.37 22.14Batillaria sp. 0 1.53 4.42 26.56N. emarginata 0 1.39 3.91 30.47
A, B and D are Baynes, Barkley and Desolation Sound respectively. Bolded taxa mostconsistently contribute to the dissimilarity between groups.
4.3. Macrofauna
In their study which assessed the impact of shellfish farming inbivalve community composition within the same three regions as thecurrent study, Whiteley and Bendell-Young (2007) found that farmedsites were more similar to each other than reference sites leading to aloss of regional distinctiveness in the bivalve community that wasevident among references sites. In the current study, which includedall members of the intertidal community, the three study regionswere characterized by their own unique intertidal communities.Desolation Sound was primarily characterized by the presence ofL. scutulata and Barkley Sound by M. trossulus and the notable absenceof H. oregonensis and Batillaria sp. Barkley Sound appears to be the
least influenced by aquaculture likely as at the time of sampling thefarms had just been established. Most notable however was BaynesSound which had the greatest numbers of H. oregonensis and Batillariasp. as compared to the other two regions.
Since its introduction in 1930, Batillaria sp. has spread widelythroughout the Pacificwest coast and is reported to have reduced nativebiodiversity through superior competition for food resources (benthicdiatoms). Dispersal is thought to be restricted by its benthic larvaestage (Klinkenberg, 2012), which could also explain the absence fromBarkley Sound which is geographically isolated from the other tworegions. Greater abundances of H. oregonensis within Baynes Soundsuggest that within this region, the farming practice of seeding haveincreased the number of these predators attracted to a reliable andeasy food source. Further support for this finding comes from the twopre-farm sites within Baynes Sound. These sites had been selected foraquaculture, but no seeding had occurred. Numbers of H. oregonensiswere the same on the pre-farm sites as compared to their paired refer-ence sites and 5 fold lower as compared to the seeded farm sites.
Byers (2005) has suggested that V. philippinarum, by serving as anaccessible food source, would lead to a boost in regional crab abundanceand productivity which in turn could alter near shore community struc-ture and foodweb dynamics. In support of this suggestion are a numberof studies that have shown that crab predators are the main agent thathas shaped the structure of intertidal communities. For example,Jensen and Jensen (1985) noted that juvenile Carcinus maenas playeda key role in structuring the benthic community in the Wadden Sea bypreying on Cerastoderma edule which in turn prevented the formation

b)a)
c) d)
Fig. 6. a, b, c and d.MDS plots with circle overlays for the taxa contributingmost to the dissimilarities among the three regions; Survey I. Circle size correlates directly to taxon abundance.A; Baynes, B; Barkley, D; Desolation, number is replicate, F; farm, R; reference and P indicates “pre-farm” state.
392 L.I. Bendell / Aquaculture 433 (2014) 384–394
of cockle beds. Silva et al. (2010) in their study on the linkages betweenpredators and prey across the subtidal–intertidal boundary concludedthat crabswere a key intertidal predator and likely a key factor influenc-ing community structure on European shores. Christofoletti et al. (2010)also concluded that foraging by an omnivorous crab was a major deter-minant in structuring intertidal community composition on subtropical
a)
c)
Fig. 7. a, b, c and d.MDS plots with circle overlays for the taxa contributingmost to the dissimilaA; Baynes, B; Barkley, D; Desolation, number is replicate, F; farm, R; reference and P indicates
shores. Given these findings, the ecological consequences of the highdensities of a predatory crab within Baynes Sound with respect to itsrole in altering intertidal community structure and function warrantfurther study.
In addition to the ecological implications are the economic implica-tions that a high predator density could have on the shellfish industry.
b)
d)
rities among the three regions; Survey II. Circle size correlates directly to taxon abundance.“pre-farm” state.

Fig. 9. Estimated seed predation rates based on the numbers ofH. oregonensis on farm sitesfor each of the three regions. Squares are Survey I. Circles are Survey II. See the Methodssection for calculation of % of seed consumed/day.
393L.I. Bendell / Aquaculture 433 (2014) 384–394
A review of the literature suggests that crab bivalve feeding rates canrange from 3 to 10 individuals/day (Bourdeau and O'Conner, 2003;Breen and Metaxas, 2008; Jensen and Jensen, 1985; Palacios andFerraro, 2003; Smith and Langdon, 1998). Using the values of Smithand Langdon (1998) (6 juveniles/day) who specifically assessed preda-tion rates of H. oregonensis on juvenile V. philippinarum, densities ofH. oregonensison farm siteswithin Baynes Soundare such that predationwould consume all seed set at a density of 700/m2 in one day (acknowl-edging that given the range of reported feeding rates, this estimate issubject to much variability). Indeed, Smith and Langdon (1998) foundthat within the estuarine regions of Oregon Bay (US), high densitiesand high predation rates of shore crabs on V. philippinarum provideda possible explanation for the poor survival of V. philippinarum insites not protected from the shore crabs. It is possible then, that onfarmed sites where high rates of crab predation occur, numbers ofV. philippinarum are a result of natural spawn rather than attributedto the farming practice of seeding.
In a recent review Dumbauld et al. (2009) concluded that althoughlocal and short term effects from aquaculture are clearly evident inU.S. west coast estuaries, bivalve aquaculture does not remove thearea from the estuary or degradewater quality like other anthropogenicinfluences, and thus has not been implicated in shifts to alternate states
# of
indi
vidu
als/
quad
rat
0
50
100
150
200
250
# of
indi
vidu
als/
quad
rat
0
200
400
600
800
1000
a) Survey I
b) Survey II
Baynes Barkley Desola�on
Pre-farm
Baynes Barkley Desola�on
Region
Pre-farm
Fig. 8. a and b. Region dependent differences in H. oregonensis. Values are means with S.E.for paired farm (black bar) and reference sites (gray). For both surveys abundances ofH. oregonensis are significantly greater on farm sites versus references sites within BaynesSound only (p ≤ 0.05, paired t-test, excluding pre-farm sites).
or reduced adaptive capacity of the larger ecological system. Notconsidered in their review however were shifts to intertidal communitystructure that may have profound effects on the existing ecology of theregions used for aquaculture. One possible example of such a conse-quence may now be occurring within Baynes Sound. Although notremoving the area or degrading water quality, seeding the intertidal hasresulted in increases in a predatory crab which will feed not only on theseed but also on other readily available prey. How this will alter commu-nity structure and hence function within Baynes Sound are unknown.Previous studies (as noted above) have indicated that this influencecould be significant. Farming practices have also facilitated an increasein bivalve predation pressure by shore crabs that based on calculated pre-dation rates, outweigh the benefits of seeding. It is likely that maximumbivalve productivity within Baynes Sound has been reached in that anyfurther gains hoped to be achieved through seeding will not be realizedas a consequence of predation. In addition to the increase in predatorsin Baynes Sound is the concurrent spread of the invasive, Batillaria sp.which could compete with the juvenile V. philippinarum for food re-sources again negatively impacting product yield.
Ecological consequences of such shifts in community compositionsuch as those observed in Baynes Sound are at this time difficult topredict. Of the three regions studied, Baynes Sound has been the mostimpacted by shellfish aquaculture being exploited for this purpose forclose to 80 years. Thus the changes in intertidal community compositionshown here for Baynes Sound could be a “heads-up” for other regionswhere aquaculture practices have not been in place as long. If we areto continue to exploit these regions for aquaculture purposes and obtainmaximum product yields, then a good understanding of the ecologicalconsequences of these shifts in community composition and the impactthey have on ecosystem functioning is clearly warranted.
Acknowledgments
Thefield assistance of J.WhiteleyM. Kirk, I.McKeachie, K.Henderson,D. Leung, N.Martens, V. Sadler, R. Davidson, B. Bartezen, R. Dickson and T.Lewis is gratefully appreciated. Funding for this study was through aNational Science and Engineering Research Council (NSERC) Strate-gic Operating Grant (STPGP246079-01) awarded to LB as principleinvestigator.
References
Bartoli, M., Nissoli, D., Viaroli, P., Turolla, E., Castaldelli, G., Farro, A., Rossi, R., 2001. Impactof Tapes philippinarum on nutrient dynamics and benthic respiration in the Sacca eliGoro. Hydrobiologia 455, 203–212.

394 L.I. Bendell / Aquaculture 433 (2014) 384–394
Beadman, H.A., Kaiser, M.J., Galanidi, M., Shucksmith, R., Willows, R.I., 2004. Changes inspecies richness with stocking density of marine bivalves. J. Appl. Ecol. 41, 464–475.
Bendell, 2013. Evidence for declines in the native Leukoma staminea as a result of theintentional introduction of the non-native Venerupis philippinarum in coastal BritishColumbia, Canada. Estuar. Coasts 37, 369–380.
Bendell, L.I., Duckham, C., L'Esperance, T., Whiteley, J.A., 2010. Changes in geochemicalforeshore attributes as a consequence of intertidal shellfish aquaculture: a casestudy. Mar. Ecol. Prog. Ser. 404, 91–108.
Bendell-Young, L.I., 2006. Contrasting the community structure and select geochemicalcharacteristics of three intertidal regions in relation to shellfish farming. Environ.Conserv. 33, 21–27.
Bourdeau, P.E., O'Conner, N., 2003. Predation by the nonindigenous Asian shore crabHemigrapsus sanguineus on macroalgae and molluscs. Northeast. Nat. 10, 319–334.
Breen, E., Metaxas, A., 2008. A comparison of predation rates by non-indigenous andindigenous crabs (juvenile Carcinus maenas, juvenile Cancer irroratus, and adultDyspanopeus sayi) in laboratory and field experiments. Estuar. Coasts 31, 728–737.
Byers, J.E., 2005. Marine reserves enhance abundance but not competitive impacts of aharvested non indigneous species. Ecology 86 (2), 487–500.
Christofoletti, R.A., Murakami, V.A., Oliveira, D.N., Barreto, R.E., Flores, A.A.V., 2010. Foragingby the omnivorous crab Pachygrapsus transversus affects the structure of assemblageson sub-tropical rocky shores. Mar. Ecol. Prog. Ser. 420, 125–134.
Clarke, K.R., 1993. Non-parametricmultivariate analyses of changes in community structure.Aust. J. Ecol. 18, 117–143.
Clarke, K.R., Gorley, R.N., 2006. PRIMER v6: User Manual/Tutorial. PRIMER-E, Plymouth.Dumbauld, B.R., Ruesink, J.L., Rumrill, S.S., 2009. The ecological role of bivalve shellfish
aquaculture in the estuarine environment. A review with application to oysters andclam culture in West Coast (USA) estuaries. Aquaculture 290, 196–223.
Gillespie, G.E., Kronlund, A.R., 1999. A manual for intertidal clam surveys. CanadianTechnical Report Fisheries Aquatic Science, 2270 (144 pp.).
Gillespie, G.E., Bower, S.A., Marcus, K.L., Kieser, D., 2012. Biological synopsis for threeexotic mollusks, V. philippinarum (Venerupis philippinarum), Pacific Oyster (Crassostreagigas) and Japanese Scallop (Mizuhopecten yessoensis) licensed for aquaculture inBritish Columbia. DFO Can. Sci. Advis. Sec. Res. Doc. 2012/013 (v + 97 pp.).
Harbo, R.M., 1997. Shells & Shellfish of the Pacific Northwest: A Field Guide. HarbourPublishing, Madeira Park, BC.
Hayden, H.S., Blomster, J., Maggs, C.A., Silva, P.C., Wayland, M.G., 2003. Linnaeus was rightall along: Ulva and Enteromorpha are not distinct genera. Eur. J. Phycol. 38, 277–294.
Honkoop, P., Pearson, G.B., Lavaleye, M.S.S., Piersnma, T., 2006. Spatial variation of theintertidal sediments and macrozoo-benthic assemblages along Eighty-mile Beach,North-western Australia. J. Sea Res. 55, 278–291.
Jamieson, G.S., Chew, L., Gillespie, G.E., Robinson, A., Bendell-Young, L., Heath, W.,Bravender, B., Tompkins, A., Nishimura, D., Doucette, P., 2001. Phase 0 Review ofthe Environmental Impacts of Intertidal ShellfishAquaculture in Baynes Sound. CanadianScience Advisory Secretariat, Ottawa (001/125).
Jensen, G.C., 1995. Pacific Coast Crabs and Shrimps. Sea Challengers, Monterey, California.Jensen, K.T., Jensen, J.N., 1985. The importance of some epibenthic predators on the
density of juvenile benthic macroinfauna in the Danish Wadden Sea. J. Exp. Mar.Biol. Ecol. 89, 157–174.
Klinkenberg, B., 2012. E-Fauna BC: Electronic Atlas of the Fauna of British Columbia [efauna.bc.ca]. Editor. Lab for advanced spatial analysis, Department of Geography, Universityof British Columbia, Vancouver. [Accessed: November 2012].
Kozloff, E.N., 1983. Seashore Life of the Northern Pacific Coast: An Illustrated Guideto Northern California, Oregon, Washington, and British Columbia. University ofWashington Press, Seattle.
Kozloff, E.N., Price, L.H., 1987. Marine Invertebrates of the Pacific Northwest. University ofWashington Press, Seattle.
McKindsey, C., Landry, T., O'Beirn, F.X., Davies, I.M., 2007. Bivalve aquaculture and exotictaxa: a review of ecological considerations and management issues. J. Shellfish Res.26, 281–294.
Naylor, R., Goldberg, R., Primavera, J.H., Kautsky, N., Beveridge, M., Clay, J., Folke, C.,Lubchenco, J., Mooney, H., Trueil, M., 2000. Effect of aquaculture on world fishsupplies. Nature 405, 1018–1024.
Palacios, K.C., Ferraro, S.P., 2003. Green crab (Carcinus maencas Linnaeus) consumptionrates on and prey preferences among four bivalve prey species. J. Shellfish Res. 22,865–871.
Powers, M.J., Peterson, C.H., Summerson, H.C., Powers, S., 2007. Macroalgae growth onbivalve aquaculture netting enhances nursery habitat for mobile invertebrates andjuvenile fishes. Mar. Ecol. Prog. Ser. 339, 109–122.
Quayle, D.B., Bourne, N., 1972. The Clam Fisheries of British Columbia. EnvironmentalCanada, Fisheries Research Board of Canada, Ottawa (70 pp.).
Sea Grant, 2005. Small-scale Clam Farming for Pleasure and Profit in Washington.Washington Sea Grant Program (WSG-AS 03-02. 20 pp.).
Sept, J.D., 1999. The Beachcomber's Guide to Seashore Life in the Pacific Northwest.Harbour Publishing, Madeira Park, BC.
Silva, P.C., 1955. The dichotomous taxa of Codium in Britain. J. Mar. Biol. Assoc. UK 34,565–577.
Silva, A.C.F., Hawkins, S.J., Boaventura, D.M., Brewster, E., Thompson, R.C., 2010. Use ofthe intertidal zone by mobile predators: influence of wave exposure, tidal phaseand elevation on abundance and diet. Mar. Ecol. Prog. Ser. 406, 197–210.
Smith, M.D., Langdon, C.J., 1998. Manila clam aquaculture on shrimp-infested mudflats. J.Shellfish Res. 17, 223–229.
Sorokin, I., Giovanard, O., Pranovi, F., Sorokin, P., 1999. Need for restricting bivalve culturein the southern basin of the Lagoon of Venice. Hydrobiologia 400, 141–149.
Spencer, B.E., Kaiser, M.J., Edwards, D.B., 1997. Ecological effects of intertidal Manila clamcultivation: observations at the end of the cultivation phase. J. Appl. Ecol. 34,444–452.
Van Alstyne, K.L., Flanagan, J., Gifford, S.-A., 2011. Recreational clam harvesting affectssediment nutrient remineralization and the growth of the green macroalga Ulvalactuca. J. Exp. Mar. Biol. Ecol. 401, 57–62.
Wentworth, C.K., 1922. A scale of grade and class terms for clastic sediments. J. Geol. 30,377–392.
Whiteley, J.A., 2005. Macrofauna Community Responses to Clam Aquaculture Practices inBritish Columbia. Canada. M.Sc. Thesis. Simon Fraser University, Burnaby, BC Canada(134 pp.).
Whiteley, J.A., Bendell-Young, L., 2007. Ecological implications of intertidal mari-culture:observed differences in bivalve community structure between farm and referencesites. J. Appl. Ecol. 44, 495–505.
Zydelis, R.D., Esler, D., Kirk, M., Boyd, S., 2009. Effects of off-bottom shellfish aquacultureon winter habitat use by molluscivorous sea ducks. Aquatic Conservation: MarineFreshwater Ecosystems, 19, pp. 34–42.