community college survey of student engagement (ccsse… · community college survey of student...
TRANSCRIPT
Community College Survey of Student
Engagement (CCSSE) Report
Key Findings 2007 - 2012
2012
For additional information regarding this report contact: The Office of Assessment, Research and Planning
Survey Research Lab Midlands Technical College
Airport Campus, Saluda Hall Room 110 West Columbia, SC 29170
Phone: (803) 822-3581
i
Executive Summary
The research of Tinto and others shows that student success is directly related to the levels of engagement students have with their instructors, their coursework, other students, and their college as a whole. For that reason Midlands Technical College (MTC) administered the Community College Survey of Student Engagement (the CCSSE) in classes in the spring semesters of 2007, 2008, 2009, 2011 and 2012. The CCSSE is a nationally-recognized, comprehensive survey developed and coordinated by the Community College Leadership Program at the University of Texas at Austin that measures levels of student engagement. Thus, the results of the CCSSE can be used by campus leaders to identify strengths, weaknesses, and gaps in campus programs that impact student engagement.
In the fall of 2010, MTC developed its first Quality Enhancement Plan (QEP) based in part on the results of the 2007, 2008, and 2009 CCSSE administrations. This plan focuses on the development of programs and initiatives that can “provide new students with the tools and resources necessary to persist and succeed in their college education.” In the spring of 2011 and 2012, MTC again administered the CCSSE to continue building the information framework needed to support QEP decision-making. The Office of Assessment, Research and Planning (ARP) coordinated CCSSE activities on campus and analyzed the results.
The CCSSE survey instrument consists of approximately 122 questions. The University of Texas at Austin clusters the responses to many of these questions into five benchmark areas, each of which focuses on a distinct aspect of engagement:
Active and Collaborative Learning - This benchmark assesses the level to which students are actively involved in their education and have opportunities to think about and apply what they are learning in different settings. Higher scores on this benchmark indicate higher levels of student engagement.
Student Effort - This benchmark assesses the level to which students apply themselves to the learning process. Higher scores on this benchmark indicate higher levels of student engagement.
Academic Challenge - This benchmark assesses how challenging students perceive their curriculum to be at MTC. Challenging intellectual and creative work is central to student learning and collegiate quality. Higher scores on this benchmark indicate higher levels of student engagement.
Student-Faculty Interaction - This benchmark measures the amount of personal interaction a student experiences with members of the faculty. Higher scores on this benchmark indicate higher levels of student engagement.
Support for Learners - This benchmark measures student’s ratings of services that assist them in academic, career, and social areas. Higher scores on this benchmark indicate higher levels of student engagement.
Each year, the survey was administered during the spring semester by MTC instructors in approximately 85 randomly selected MTC course sections. Completed survey forms (approximately 950 each year) were shipped to the University of Texas during October and November for scanning.
During the late summer each year after administrations, the University of Texas provides ARP both standard reports as well as raw data files that included the current IPEDS full-time/part-time weights and raw benchmark calculations and benchmark scores.
ii
Comparison of CCSSE Benchmark Scores among Colleges
In accordance with CCSSE survey reporting protocols, ARP uses the weighted/standardized benchmark scores to compare MTC student perceptions with those of students at other colleges. Weighting, with current yearly IPEDS ratios, takes into account college-by-college differences in full-time/part-time enrollment ratios. To further ease cross-institution comparisons, the weighted data is also standardized; the midpoint score for each benchmark is set at 50%, with half of the CCSSE colleges falling below that percentage on the benchmark and half above. It is important to note that in order to calculate the CCSSE cohort 50% average, CCSSE uses a rolling three-year cohort of participating colleges to compute this average each year. For 2012, the CCSSE cohort was the years 2010 to 2012.
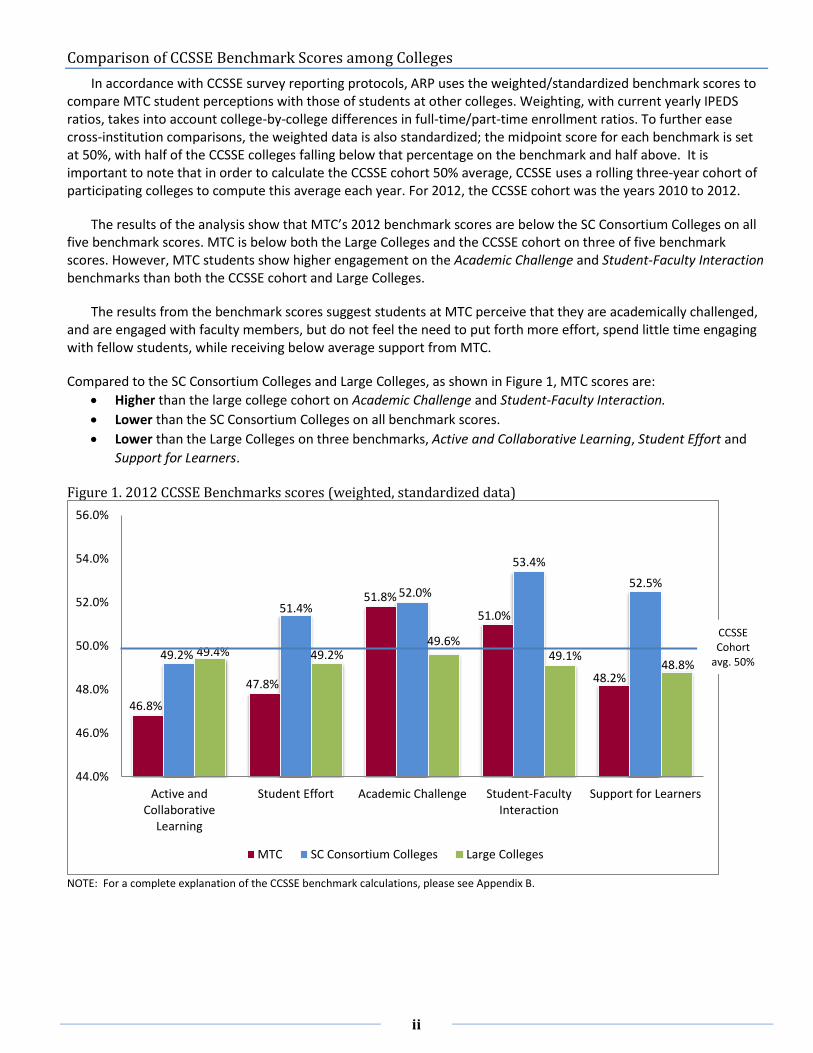
The results of the analysis show that MTC’s 2012 benchmark scores are below the SC Consortium Colleges on all five benchmark scores. MTC is below both the Large Colleges and the CCSSE cohort on three of five benchmark scores. However, MTC students show higher engagement on the Academic Challenge and Student-Faculty Interaction benchmarks than both the CCSSE cohort and Large Colleges.
The results from the benchmark scores suggest students at MTC perceive that they are academically challenged, and are engaged with faculty members, but do not feel the need to put forth more effort, spend little time engaging with fellow students, while receiving below average support from MTC.
Compared to the SC Consortium Colleges and Large Colleges, as shown in Figure 1, MTC scores are:
Higher than the large college cohort on Academic Challenge and Student-Faculty Interaction.
Lower than the SC Consortium Colleges on all benchmark scores.
Lower than the Large Colleges on three benchmarks, Active and Collaborative Learning, Student Effort and
Support for Learners.
Figure 1. 2012 CCSSE Benchmarks scores (weighted, standardized data)
NOTE: For a complete explanation of the CCSSE benchmark calculations, please see Appendix B.
46.8%
47.8%
51.8%
51.0%
48.2%
49.2%
51.4%52.0%
53.4%
52.5%
49.4% 49.2%49.6%
49.1%48.8%
44.0%
46.0%
48.0%
50.0%
52.0%
54.0%
56.0%
Active andCollaborative
Learning
Student Effort Academic Challenge Student-FacultyInteraction
Support for Learners
MTC SC Consortium Colleges Large Colleges
CCSSE Cohort
avg. 50%
iii
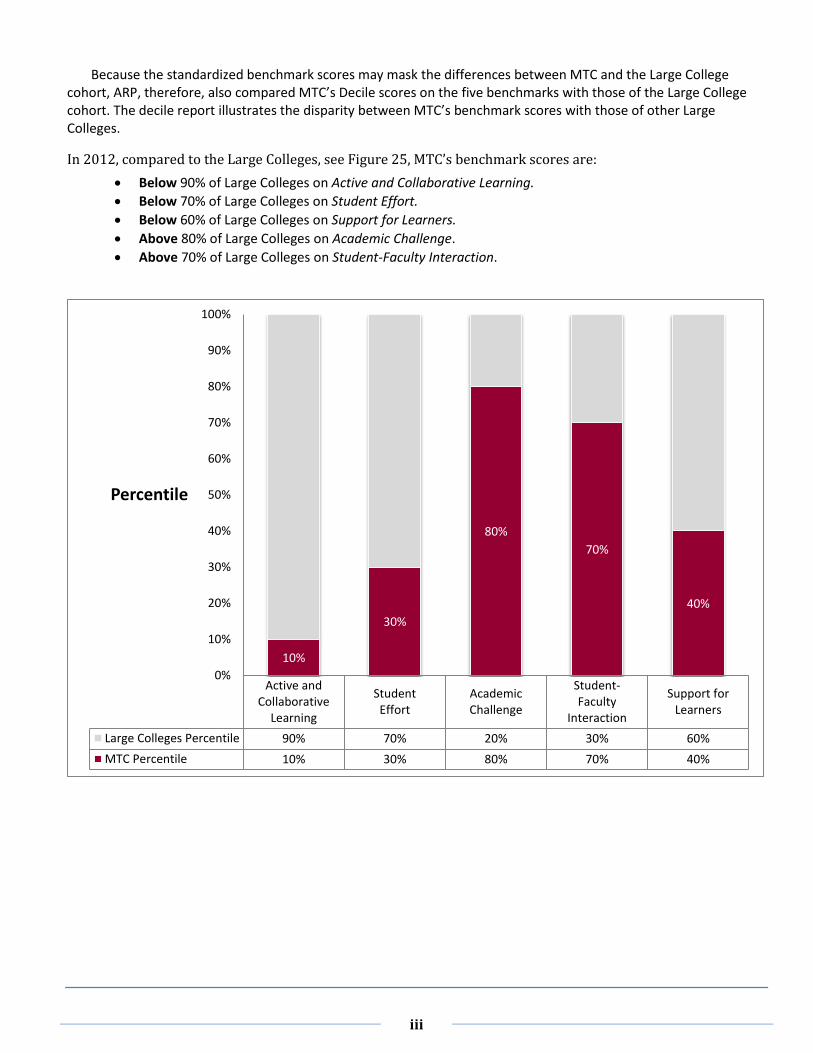
Because the standardized benchmark scores may mask the differences between MTC and the Large College
cohort, ARP, therefore, also compared MTC’s Decile scores on the five benchmarks with those of the Large College cohort. The decile report illustrates the disparity between MTC’s benchmark scores with those of other Large Colleges.
In 2012, compared to the Large Colleges, see Figure 25, MTC’s benchmark scores are:
Below 90% of Large Colleges on Active and Collaborative Learning.
Below 70% of Large Colleges on Student Effort.
Below 60% of Large Colleges on Support for Learners.
Above 80% of Large Colleges on Academic Challenge.
Above 70% of Large Colleges on Student-Faculty Interaction.
Active andCollaborative
Learning
StudentEffort
AcademicChallenge
Student-Faculty
Interaction
Support forLearners
Large Colleges Percentile 90% 70% 20% 30% 60%
MTC Percentile 10% 30% 80% 70% 40%
10%
30%
80%
70%
40%
0%
10%
20%
30%
40%
50%
60%
70%
80%
90%
100%
Percentile

iv
MTC Results over Time
ARP also assessed the MTC benchmark means from 2007 to 2012 to discover benchmark trends over the five year period, as well as explore historical trends and differences among MTC gender, ethnicity, enrollment, and developmental student cohorts. To perform theses longitudinal analyses, ARP followed the CCSSE survey protocol and used raw, weighted benchmark mean. Unfortunately, since CCSSE does not provide the historical, raw weighted benchmarks for other colleges, ARP could not compare MTC with non-MTC cohorts over the same five survey administrations.
MTC means increased in four of five benchmark scores over the five years. Student-Faculty Interaction (7.4%) the greatest increase. Student Effort (-1.8%) has the greatest decrease. See Figure 2.
Figure 2. Benchmark scores over time (raw, weighted data)
↑↓ Note: Directional arrows in charts highlight those items in 2011 that are significantly above or below the mean of 2007. Using a T-test (2-tailed), the differences in the means are significant at p < .05, a 95% confidence level.
0.327
0.463
0.566
0.390
0.432
0.362
0.460
0.577
0.402
0.442
0.337
0.462
0.594
0.396
0.427
0.358
0.461
0.602
0.407
0.435
0.352↑
0.454
0.589↑
0.422↑
0.433
0.000 0.100 0.200 0.300 0.400 0.500 0.600 0.700 0.800 0.900 1.000
Active and Collaborative Learning
Student Effort
Academic Challenge
Student-Faculty Interaction
Support for Learners
Active andCollaborative
LearningStudent Effort Academic Challenge
Student-FacultyInteraction
Support for Learners
2012 0.352 0.454 0.589 0.422 0.433
2011 0.358 0.461 0.602 0.407 0.435
2009 0.337 0.462 0.594 0.396 0.427
2008 0.362 0.460 0.577 0.402 0.442
2007 0.327 0.463 0.566 0.390 0.432↑ ↑ ↑
v
From 2007 to 2012, ARP found the following concerning benchmark means:
Active and Collaborative Learning – A statistically significant increase in students’ collaboration with other students to solve problems or master challenging content.
Student Effort – A decrease in “time on task” or the amount of time students’ own behaviors contribute to their learning.
Academic Challenge – A statistically significant increase over time in the nature and amount of assigned academic work, the complexity of cognitive tasks assigned and the standards faculty members use to evaluate students’ performance.
Student-Faculty Interaction – A statistically significant increase in students’ personal interaction with faculty members and working with an instructor on a project or serving with faculty members on a college committee.
Support for Learners - A slight increase in the services targeted to assist students with academic and career planning.
When analyzing the trend data for different demographic groups or cohorts, it is apparent that there are
statistically significant differences and trends. Full-time students appear more engaged than their part-time counterparts. In 2012, there are statistically significant differences between full-time and part-time students’ perceptions of engagement in four of the five benchmarks, Active and Collaborative Learners, Student Effort, Academic Challenge, and Student-Faculty Interaction.
Black students appear more engaged than white students throughout the period. In 2012, there are statistically significant differences between white and black students’ perceptions of engagement in four of the five benchmark means, Student Effort, Academic Challenge, Student-Faculty Interaction and Support for Learners.
Female students appear more engaged than male students. In 2012, there are statistically significant differences between male and female students’ perceptions of engagement in three of the five benchmark means, Student Effort, Academic Challenge and Support for Learners.
In summary, MTC’s benchmark means in Active and Collaborative Learning, Academic Challenge and Student-Faculty Interaction are up significantly since 2007. This suggests that MTC students are more engaged in these three important benchmark areas, but at the same time they are exerting less Student Effort while their perception for the Support for Learners they receive from MTC is essentially the same as in 2007. Significant differences between 2007 and 2012, and within 2012, unfold when analyzing the benchmark means by demographic groups within MTC. All demographic groups show differences from 2007 to 2012, but in many cases on different benchmarks. In addition, there are unique disparities between the demographic groups. Further research may be needed to determine the reasons behind the differing perceptions between the demographic groups at MTC and to not just look at MTC students as a homogenous group.
Conclusions
ARP’s analysis of the CCSSE data suggests several engagement issues. MTC’s scores are lower on all five benchmarks as compared to SC Consortium Colleges. While MTC scored higher than comparable Large Colleges on the Academic Challenge and Student-Faculty Interaction in 2012, MTC is below the Large College cohort on three of five benchmark scores. There is a trend for MTC’s benchmark scores to be lower when compared to both the Large Colleges as well as the SC Consortium Colleges.
One the other hand, when compared over time, MTC benchmark scores are rising. The analysis of 2007 to 2012 data shows significantly higher Active and Collaborative Learning, Academic Challenge, and Student-Faculty Interaction benchmark means. This indicates a statistically significant increase in students’ perceptions concerning the Active and Collaborative Learning atmosphere they function in, the Academic Challenges they are facing, as well as increased Student-Faculty Interaction. However, their perceptions of Student Effort and Support for Learners have dropped slightly.
↑ ↑
vi
The changes in benchmark means over time are also apparent when analyzing the different student demographic groups within MTC. Views on engagement within the groups have trended upward since 2007. However, what has remained the same since 2007 is that full-time students are more engaged than part-time students, DVS students are more engaged than non-DVS students, female students are more engaged than male students, and black students are more engaged than white students. In addition, there are significant differences between the demographic groups on the benchmark means in 2012. The results of this analysis points to a diversity of opinions that exist between the different demographic groups on the perception of engagement.
Simply put, MTC students’ perceptions of engagement, as evidenced by the benchmarks, is changing. ARP’s analysis of the CCSSE survey, from 2007 to 2012, provides staff and faculty with a starting point for the understanding of the perception of engagement from the perspective of the MTC student on a number of key benchmarks as well as individual questions. In addition, it also provides direction for further research to uncover why these differences exist.
Community College Survey of Student Engagement
Key Findings 2007 - 2012
ARP Assessment,
Research
and Planning
For additional information regarding this report contact: The Office of Assessment, Research and Planning
Survey Research Lab Midlands Technical College
Airport Campus, Saluda Hall Room 110 West Columbia, SC 29170
Phone: (803) 822-3581

Table of Contents
Executive Summary ...................................................................................................................................................... i
Comparison of CCSSE Benchmark Scores among Colleges ..................................................................................... ii
MTC Results over Time ........................................................................................................................................... iv
Conclusions ............................................................................................................................................................. v
Chapter 1 – Introduction ............................................................................................................................................. 1
Benchmark Definitions ............................................................................................................................................ 1
Computing Benchmark Scores ................................................................................................................................ 2
Summary ................................................................................................................................................................. 3
Chapter 2 – MTC Results over Time ............................................................................................................................ 4
Active and Collaborative Learning .......................................................................................................................... 6
Student Effort .......................................................................................................................................................... 8
Academic Challenge .............................................................................................................................................. 10
Student-Faculty Interaction .................................................................................................................................. 12
Support for Learners ............................................................................................................................................. 13
2007/2012 Benchmark Means of MTC Student Sub-Cohorts ............................................................................... 15
Full-time & Part-time students .......................................................................................................................... 15
Developmental & Non-Developmental Students .............................................................................................. 16
Benchmarks by Gender ..................................................................................................................................... 17
Benchmarks by Ethnicity ................................................................................................................................... 18
Benchmarks by Age ........................................................................................................................................... 19
Chapter 3 – 2012 MTC Comparison of Benchmark Scores ....................................................................................... 20
Benchmark Scores ................................................................................................................................................. 20
Active and Collaborative Learning ........................................................................................................................ 23
Student Effort ........................................................................................................................................................ 24
Academic Challenge .............................................................................................................................................. 25
Student-Faculty Interaction .................................................................................................................................. 26
Support for Learners ............................................................................................................................................. 27
Chapter 4 – Recommendations ................................................................................................................................. 28
Appendix A – MTC Survey Administration ................................................................................................................ 29
Appendix B – CCSSE Methodology ............................................................................................................................ 31
Benchmarks of Effective Educational Practice ...................................................................................................... 31
Benchmark Definitions .......................................................................................................................................... 32
Benchmark Calculation & Weighting .................................................................................................................... 33
Standards for Interpreting Mean Differences ....................................................................................................... 34
Defining Developmental vs. Non-Developmental Students ................................................................................. 34
Decile Reports ....................................................................................................................................................... 34
Summary Statistics ................................................................................................................................................ 34
Appendix H - CCSSE Survey ....................................................................................................................................... 35
Bibliography .............................................................................................................................................................. 43
1
Chapter 1 – Introduction
In the fall of 2010, Midlands Technical College (MTC) developed its first Quality Enhancement Plan (QEP) based in part on the results of the 2007, 2008, and 2009 Community College Survey of Student Engagement (CCSSE) administrations. This plan focuses on the development of programs and initiatives that can “provide new students with the tools and resources necessary to persist and succeed in their college education.” In the spring of 2011 and 2012 MTC again administered the CCSSE to continue building the information framework needed to support QEP decision-making.
Research shows that the more actively engaged students are—with college faculty and staff, with other students, and with the subject matter—the more likely they are to learn and to achieve their academic goals. The CCSSE is a nationally-recognized, comprehensive survey developed and coordinated by the University of Texas (Austin) that measures levels of student engagement. CCSSE reports national benchmarks of effective educational practices in community colleges. CCSSE’s survey instrument, The Community College Student Report, provides information on student engagement, a key indicator of learning and, therefore, of the quality of community colleges. The survey, administered to community college students, asks questions that assess institutional practices and student behaviors that are highly correlated with student learning and student retention. The Community College Student Report is a versatile, research-based tool appropriate for multiple uses. It is a:
Benchmarking instrument — establishing national norms on educational practice and performance by community and technical colleges.
Diagnostic tool — identifying areas in which a college can enhance students’ educational experiences.
Monitoring device — documenting and improving institutional effectiveness over time.
The Office of Assessment, Research and Planning (ARP) coordinates the administrations of the CCSSE and other national surveys on campus. A random sample of spring semester courses is selected by the University of Texas from a course/section listing submitted by MTC. Courses include virtually all for-credit courses offered in the spring semester. Surveys are administered during class time in the months of March and April. A survey administration script is read to the students outlining instructions for successfully completing the survey. The survey takes approximately 45 minutes to complete. In each year of the survey’s administration at MTC, approximately 950 students have completed the survey.
Benchmark Definitions
CCSSE benchmarks focus on institutional practices and student behaviors that promote student engagement—and that are positively related to student learning and persistence. The five benchmarks of effective educational practice in community colleges are Active and Collaborative Learning, Student Effort, Academic Challenge, Student-Faculty Interaction, and Support for Learners.
Each CCSSE benchmark is made up of conceptually-related survey questions that address key areas of student engagement. The five benchmarks denote areas that educational research has shown to be important to students’ college experiences and educational outcomes. Therefore, they provide colleges with a useful starting point for looking at institutional results and allow colleges to gauge and monitor their performance in areas that are central to their work. In addition, participating colleges have the opportunity to make appropriate and useful comparisons between their performance and that of other groups of similar colleges.
Active and Collaborative Learning Students learn more when they are actively involved in their education and have opportunities to think about and apply what they are learning in different settings. Through collaborating with others to solve problems or master challenging content, students develop valuable skills that prepare them to deal with the kinds of situations and problems they will encounter in the workplace, the community, and their personal lives.

2
Student Effort Students’ behaviors contribute significantly to their learning and the likelihood that they will attain their educational goals. “Time on task” is a key variable, and there are a variety of settings and means through which students may apply themselves to the learning process. Eight survey items indicate how frequently students engage in a number of activities important to their learning and success are associated with this benchmark.
Academic Challenge Challenging intellectual and creative work is central to student learning and collegiate quality. Ten survey items address the nature and amount of assigned academic work, the complexity of cognitive tasks presented to students, and the standards faculty members use to evaluate student performance.
Student-Faculty Interaction In general, the more interaction students have with their teachers, the more likely they are to learn effectively and persist toward achievement of their educational goals. Personal interaction with faculty members strengthens students’ connections to the college and helps them focus on their academic progress. Working with an instructor on a project or serving with faculty members on a college committee lets students see first-hand how experts identify and solve practical problems. Through such interactions, faculty members become role models, mentors, and guides for continuous, lifelong learning.
Support for Learners Students perform better and are more satisfied at colleges that are committed to their success and cultivate positive working and social relationships among different groups on campus. Community college students also benefit from services targeted to assist them with academic and career planning, academic skill development, and other areas that may affect learning and retention.
Computing Benchmark Scores
Benchmark scores provide a useful way to look at an institution’s data by creating groups of conceptually related questions that address key areas of student engagement. The five benchmarks encompass 38 engagement questions from the CCSSE survey that reflect many of the most important aspects of the student experience. These institutional practices and student behaviors are some of the most powerful contributors to effective teaching, learning, student retention, and student success.
Benchmark scores also allow for comparisons with different groups or cohorts. CCSSE utilizes a three-year cohort (2010 through 2012) of all participating colleges in its data analyses, including the computation of benchmark scores. This cohort is referred to as the 2012 CCSSE Cohort. Additional cohorts include small, medium, large, and extra-large institutions. MTC is part of the Large College cohort, those institutions with between 8,000 and 14,999 students.
In order to create the benchmark scores for comparing with other college cohorts, the survey items associated with each benchmark are first rescaled by the University so that all items are on the same scale (0 to 1). Next, the benchmark scores are computed by averaging the scores of the related survey items. Finally, the scores are “standardized” around the mean of the three-year college cohorts so that respondents' scores have an average of 50, weighted by full- and part-time attendance status, and a standard deviation of 25. Standardizing scores increases the value of the scores in the following two ways:
All of the benchmarks are on the same scale, enabling comparisons across benchmarks; and
The scores provide information about how an individual institution is doing relative to other institutions.
In addition, the three-year cohort approach minimizes the impact, in any given year, of statewide consortia participation. Finally, to compare a college’s own benchmark scores over time however, the University of Texas recommends using raw, un-weighted data.

3
Summary
The following chapters of this report focus on two areas of analysis. Chapter two compares MTC’s benchmark scores from 2007 to 2012 using raw, weighted data. The chapter highlights key differences and trends from year to year. This chapter of the report will focus on the five CCSSE benchmarks as well as the individual questions that make up the benchmarks, and details how levels of student engagement at MTC have changed over the years.
Chapter three compares MTC’s 2012 weighted benchmark scores with those of other colleges. The chapter highlights benchmark score differences between MTC and three other college cohorts:
A South Carolina regional consortium (SC Consortium Colleges) includes Aiken Technical College, Central Carolina Technical College, Greenville Technical College, Horry-Georgetown Technical College, Northeastern Technical College, Technical College of the Low Country, and Tri-County Technical College.
A Large College cohort (Large Colleges) includes 134 institutions with 8,000-14,999 credit students.
CCSSE Cohort includes all 710 community colleges who participated in the 2010 to 2012 CCSSE surveys.
The appendices contain information about the methodology, CCSSE background information, and weighted
response frequencies to each question in the survey.
4
Chapter 2 – MTC Results over Time
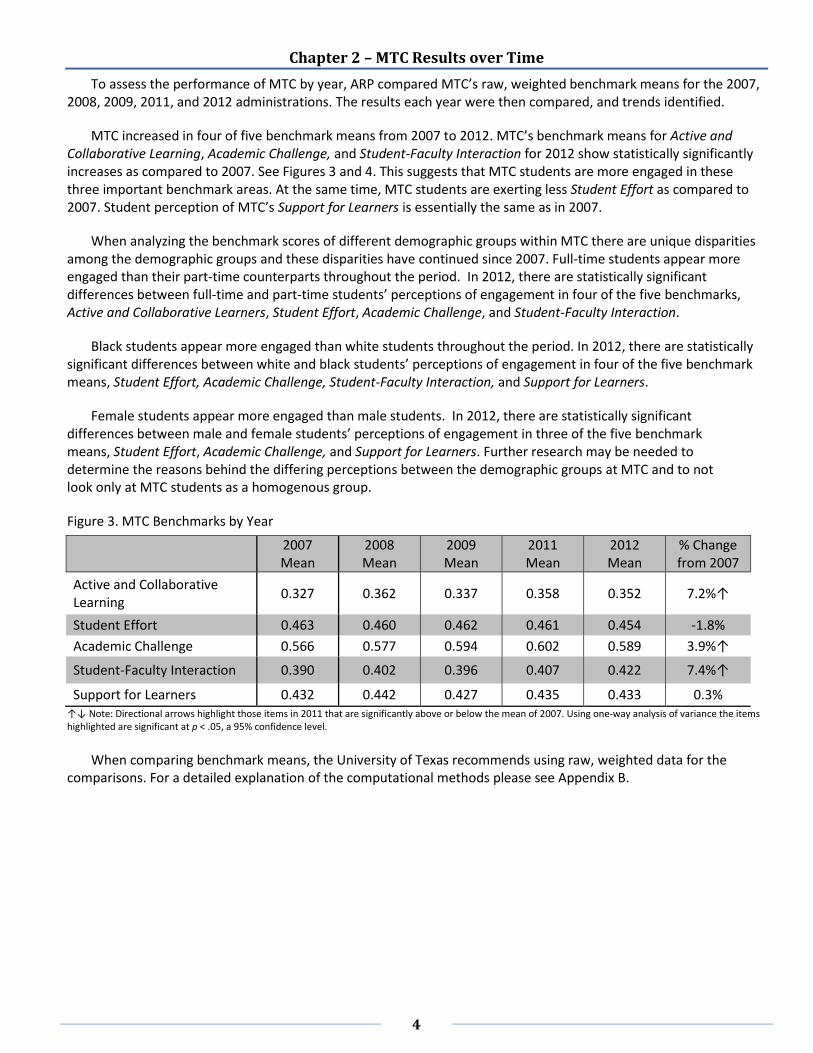
To assess the performance of MTC by year, ARP compared MTC’s raw, weighted benchmark means for the 2007, 2008, 2009, 2011, and 2012 administrations. The results each year were then compared, and trends identified.
MTC increased in four of five benchmark means from 2007 to 2012. MTC’s benchmark means for Active and Collaborative Learning, Academic Challenge, and Student-Faculty Interaction for 2012 show statistically significantly increases as compared to 2007. See Figures 3 and 4. This suggests that MTC students are more engaged in these three important benchmark areas. At the same time, MTC students are exerting less Student Effort as compared to 2007. Student perception of MTC’s Support for Learners is essentially the same as in 2007.
When analyzing the benchmark scores of different demographic groups within MTC there are unique disparities among the demographic groups and these disparities have continued since 2007. Full-time students appear more engaged than their part-time counterparts throughout the period. In 2012, there are statistically significant differences between full-time and part-time students’ perceptions of engagement in four of the five benchmarks, Active and Collaborative Learners, Student Effort, Academic Challenge, and Student-Faculty Interaction.
Black students appear more engaged than white students throughout the period. In 2012, there are statistically significant differences between white and black students’ perceptions of engagement in four of the five benchmark means, Student Effort, Academic Challenge, Student-Faculty Interaction, and Support for Learners.
Female students appear more engaged than male students. In 2012, there are statistically significant differences between male and female students’ perceptions of engagement in three of the five benchmark means, Student Effort, Academic Challenge, and Support for Learners. Further research may be needed to determine the reasons behind the differing perceptions between the demographic groups at MTC and to not look only at MTC students as a homogenous group.
Figure 3. MTC Benchmarks by Year
2007 Mean
2008 Mean
2009 Mean
2011 Mean
2012 Mean
% Change from 2007
Active and Collaborative Learning
0.327 0.362 0.337 0.358 0.352 7.2%↑
Student Effort 0.463 0.460 0.462 0.461 0.454 -1.8%
Academic Challenge 0.566 0.577 0.594 0.602 0.589 3.9%↑
Student-Faculty Interaction 0.390 0.402 0.396 0.407 0.422 7.4%↑
Support for Learners 0.432 0.442 0.427 0.435 0.433 0.3% ↑↓ Note: Directional arrows highlight those items in 2011 that are significantly above or below the mean of 2007. Using one-way analysis of variance the items highlighted are significant at p < .05, a 95% confidence level.
When comparing benchmark means, the University of Texas recommends using raw, weighted data for the
comparisons. For a detailed explanation of the computational methods please see Appendix B.
5
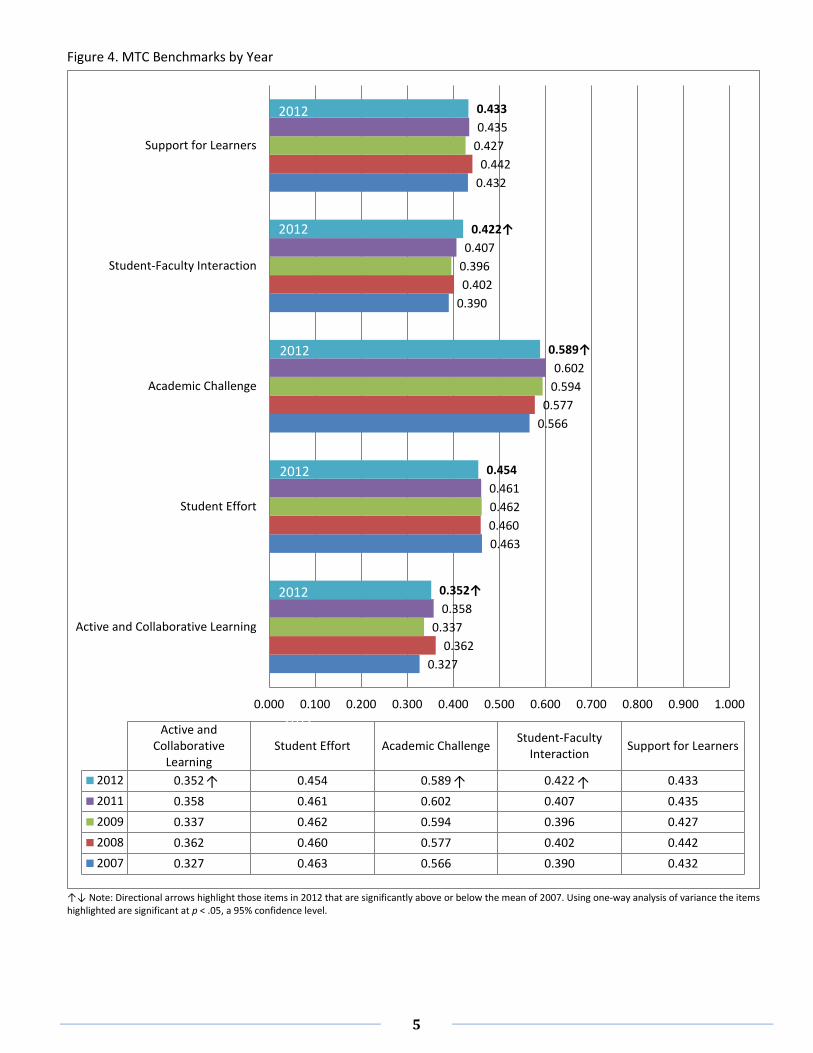
Figure 4. MTC Benchmarks by Year
↑↓ Note: Directional arrows highlight those items in 2012 that are significantly above or below the mean of 2007. Using one-way analysis of variance the items highlighted are significant at p < .05, a 95% confidence level.
0.327
0.463
0.566
0.390
0.432
0.362
0.460
0.577
0.402
0.442
0.337
0.462
0.594
0.396
0.427
0.358
0.461
0.602
0.407
0.435
0.352↑
0.454
0.589↑
0.422↑
0.433
0.000 0.100 0.200 0.300 0.400 0.500 0.600 0.700 0.800 0.900 1.000
Active and Collaborative Learning
Student Effort
Academic Challenge
Student-Faculty Interaction
Support for Learners
Active andCollaborative
LearningStudent Effort Academic Challenge
Student-FacultyInteraction
Support for Learners
2012 0.352 0.454 0.589 0.422 0.433
2011 0.358 0.461 0.602 0.407 0.435
2009 0.337 0.462 0.594 0.396 0.427
2008 0.362 0.460 0.577 0.402 0.442
2007 0.327 0.463 0.566 0.390 0.432
2012
2012
2012
2012
2012
↑ ↑ ↑
2012
6
Active and Collaborative Learning
Through collaborating with others to solve problems or master challenging content, MTC helps students develop valuable skills that prepare them to deal with the kinds of situations and problems they will encounter in the workplace, the community, and their personal lives. The development of these skills leads to a higher level of engagement at MTC.
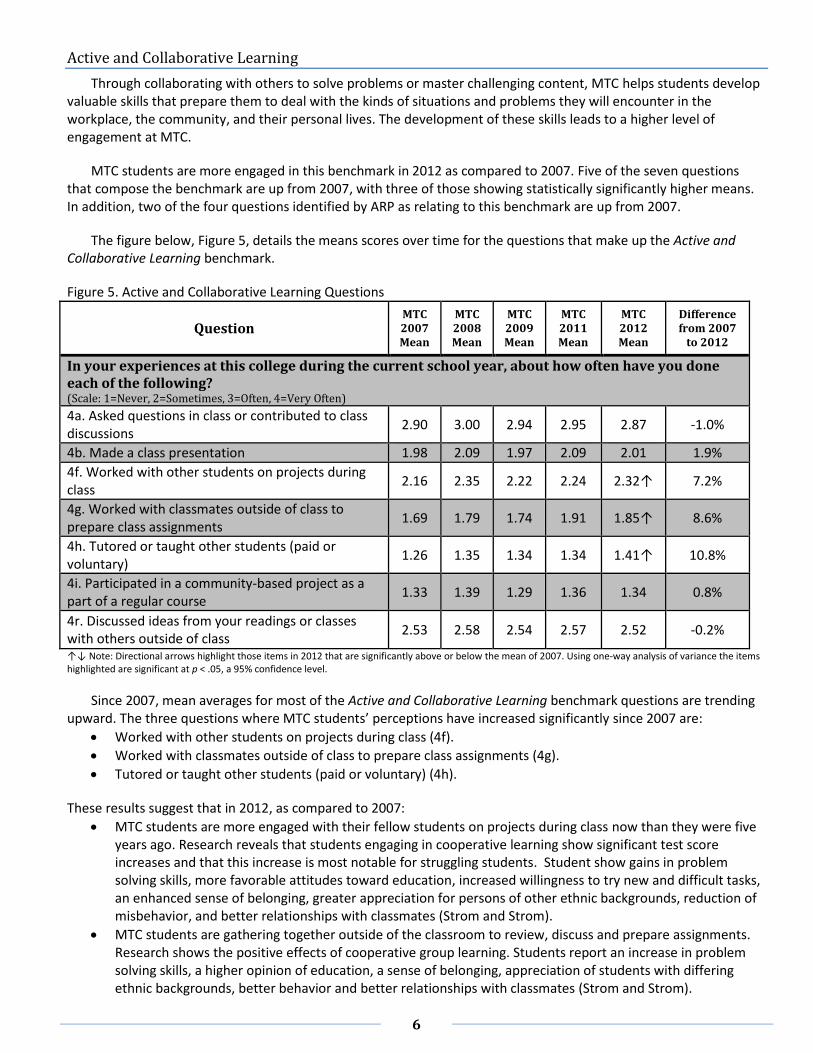
MTC students are more engaged in this benchmark in 2012 as compared to 2007. Five of the seven questions that compose the benchmark are up from 2007, with three of those showing statistically significantly higher means. In addition, two of the four questions identified by ARP as relating to this benchmark are up from 2007.
The figure below, Figure 5, details the means scores over time for the questions that make up the Active and Collaborative Learning benchmark.
Figure 5. Active and Collaborative Learning Questions
Question MTC 2007 Mean
MTC 2008 Mean
MTC 2009 Mean
MTC 2011 Mean
MTC 2012 Mean
Difference from 2007
to 2012
In your experiences at this college during the current school year, about how often have you done each of the following? (Scale: 1=Never, 2=Sometimes, 3=Often, 4=Very Often)
4a. Asked questions in class or contributed to class discussions
2.90 3.00 2.94 2.95 2.87 -1.0%
4b. Made a class presentation 1.98 2.09 1.97 2.09 2.01 1.9%
4f. Worked with other students on projects during class
2.16 2.35 2.22 2.24 2.32↑ 7.2%
4g. Worked with classmates outside of class to prepare class assignments
1.69 1.79 1.74 1.91 1.85↑ 8.6%
4h. Tutored or taught other students (paid or voluntary)
1.26 1.35 1.34 1.34 1.41↑ 10.8%
4i. Participated in a community-based project as a part of a regular course
1.33 1.39 1.29 1.36 1.34 0.8%
4r. Discussed ideas from your readings or classes with others outside of class
2.53 2.58 2.54 2.57 2.52 -0.2%
↑↓ Note: Directional arrows highlight those items in 2012 that are significantly above or below the mean of 2007. Using one-way analysis of variance the items highlighted are significant at p < .05, a 95% confidence level.
Since 2007, mean averages for most of the Active and Collaborative Learning benchmark questions are trending upward. The three questions where MTC students’ perceptions have increased significantly since 2007 are:
Worked with other students on projects during class (4f).
Worked with classmates outside of class to prepare class assignments (4g).
Tutored or taught other students (paid or voluntary) (4h).
These results suggest that in 2012, as compared to 2007:
MTC students are more engaged with their fellow students on projects during class now than they were five years ago. Research reveals that students engaging in cooperative learning show significant test score increases and that this increase is most notable for struggling students. Student show gains in problem solving skills, more favorable attitudes toward education, increased willingness to try new and difficult tasks, an enhanced sense of belonging, greater appreciation for persons of other ethnic backgrounds, reduction of misbehavior, and better relationships with classmates (Strom and Strom).
MTC students are gathering together outside of the classroom to review, discuss and prepare assignments. Research shows the positive effects of cooperative group learning. Students report an increase in problem solving skills, a higher opinion of education, a sense of belonging, appreciation of students with differing ethnic backgrounds, better behavior and better relationships with classmates (Strom and Strom).
7
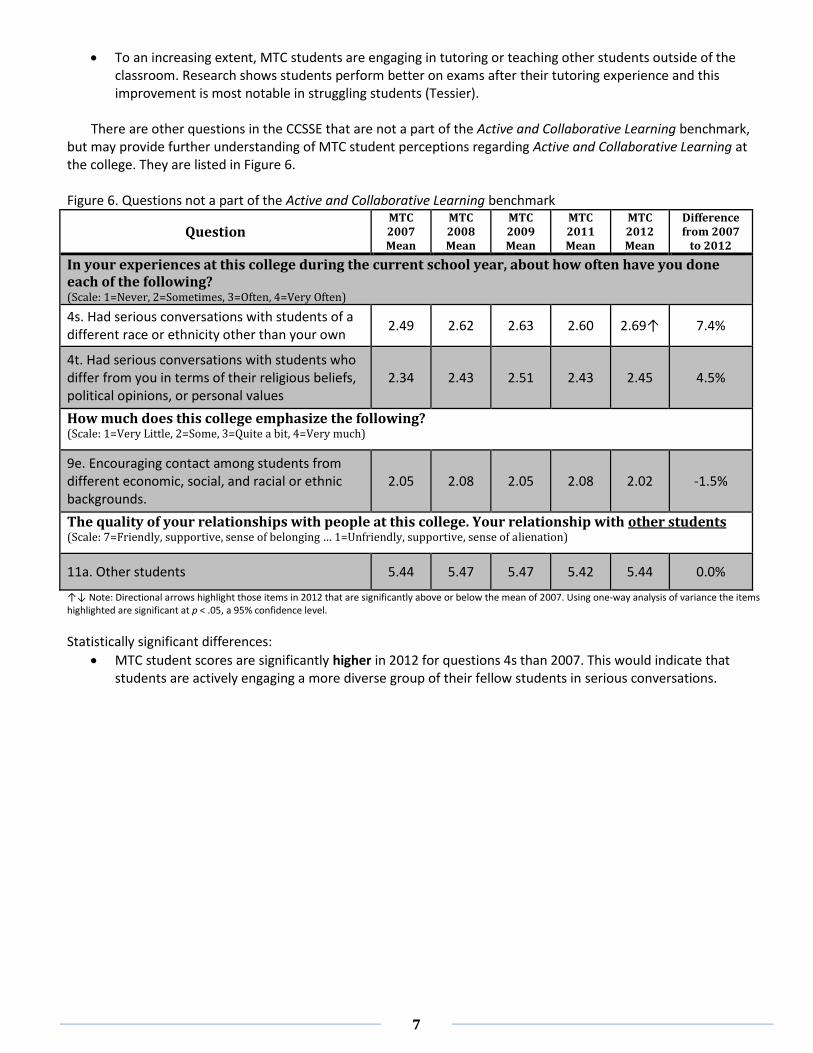
To an increasing extent, MTC students are engaging in tutoring or teaching other students outside of the classroom. Research shows students perform better on exams after their tutoring experience and this improvement is most notable in struggling students (Tessier).
There are other questions in the CCSSE that are not a part of the Active and Collaborative Learning benchmark,
but may provide further understanding of MTC student perceptions regarding Active and Collaborative Learning at the college. They are listed in Figure 6. Figure 6. Questions not a part of the Active and Collaborative Learning benchmark
Question MTC 2007 Mean
MTC 2008 Mean
MTC 2009 Mean
MTC 2011 Mean
MTC 2012 Mean
Difference from 2007
to 2012
In your experiences at this college during the current school year, about how often have you done each of the following? (Scale: 1=Never, 2=Sometimes, 3=Often, 4=Very Often)
4s. Had serious conversations with students of a different race or ethnicity other than your own
2.49 2.62 2.63 2.60 2.69↑ 7.4%
4t. Had serious conversations with students who differ from you in terms of their religious beliefs, political opinions, or personal values
2.34 2.43 2.51 2.43 2.45 4.5%
How much does this college emphasize the following? (Scale: 1=Very Little, 2=Some, 3=Quite a bit, 4=Very much)
9e. Encouraging contact among students from different economic, social, and racial or ethnic backgrounds.
2.05 2.08 2.05 2.08 2.02 -1.5%
The quality of your relationships with people at this college. Your relationship with other students (Scale: 7=Friendly, supportive, sense of belonging … 1=Unfriendly, supportive, sense of alienation)
11a. Other students 5.44 5.47 5.47 5.42 5.44 0.0%
↑↓ Note: Directional arrows highlight those items in 2012 that are significantly above or below the mean of 2007. Using one-way analysis of variance the items highlighted are significant at p < .05, a 95% confidence level.
Statistically significant differences:
MTC student scores are significantly higher in 2012 for questions 4s than 2007. This would indicate that students are actively engaging a more diverse group of their fellow students in serious conversations.
8
Student Effort
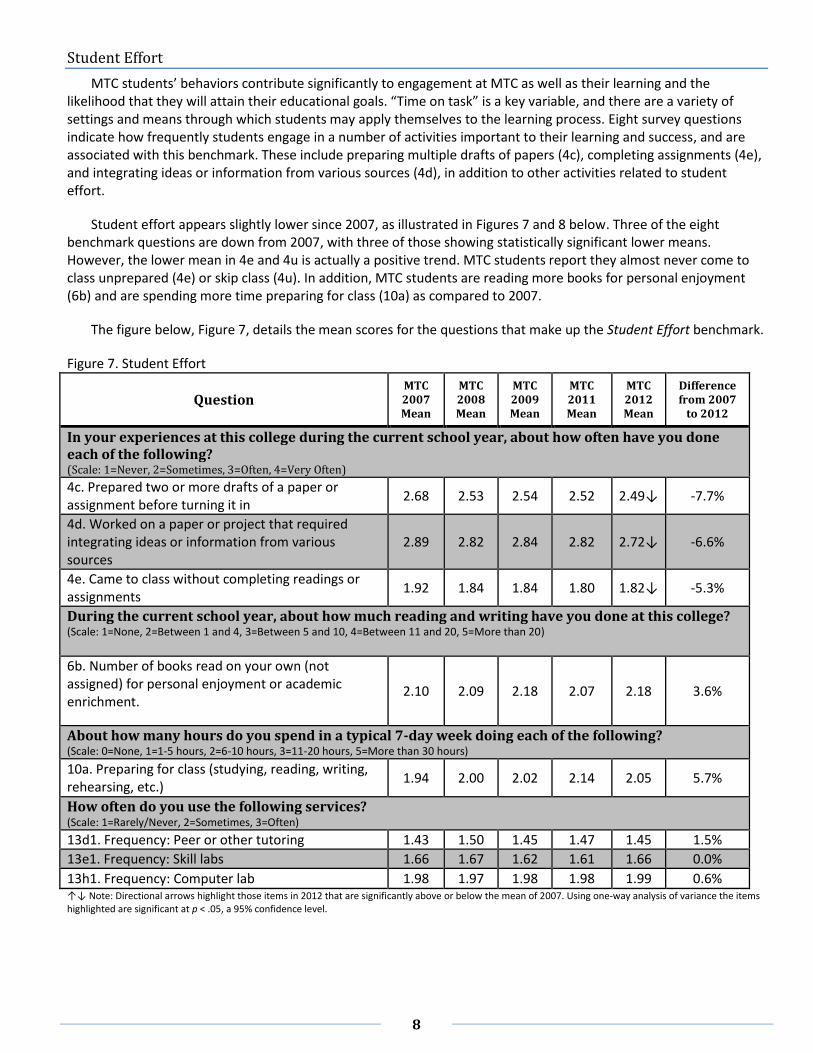
MTC students’ behaviors contribute significantly to engagement at MTC as well as their learning and the likelihood that they will attain their educational goals. “Time on task” is a key variable, and there are a variety of settings and means through which students may apply themselves to the learning process. Eight survey questions indicate how frequently students engage in a number of activities important to their learning and success, and are associated with this benchmark. These include preparing multiple drafts of papers (4c), completing assignments (4e), and integrating ideas or information from various sources (4d), in addition to other activities related to student effort.
Student effort appears slightly lower since 2007, as illustrated in Figures 7 and 8 below. Three of the eight benchmark questions are down from 2007, with three of those showing statistically significant lower means. However, the lower mean in 4e and 4u is actually a positive trend. MTC students report they almost never come to class unprepared (4e) or skip class (4u). In addition, MTC students are reading more books for personal enjoyment (6b) and are spending more time preparing for class (10a) as compared to 2007.
The figure below, Figure 7, details the mean scores for the questions that make up the Student Effort benchmark.
Figure 7. Student Effort
Question MTC 2007 Mean
MTC 2008 Mean
MTC 2009 Mean
MTC 2011 Mean
MTC 2012 Mean
Difference from 2007
to 2012
In your experiences at this college during the current school year, about how often have you done each of the following? (Scale: 1=Never, 2=Sometimes, 3=Often, 4=Very Often)
4c. Prepared two or more drafts of a paper or assignment before turning it in
2.68 2.53 2.54 2.52 2.49↓ -7.7%
4d. Worked on a paper or project that required integrating ideas or information from various sources
2.89 2.82 2.84 2.82 2.72↓ -6.6%
4e. Came to class without completing readings or assignments
1.92 1.84 1.84 1.80 1.82↓ -5.3%
During the current school year, about how much reading and writing have you done at this college? (Scale: 1=None, 2=Between 1 and 4, 3=Between 5 and 10, 4=Between 11 and 20, 5=More than 20)
6b. Number of books read on your own (not assigned) for personal enjoyment or academic enrichment.
2.10 2.09 2.18 2.07 2.18 3.6%
About how many hours do you spend in a typical 7-day week doing each of the following? (Scale: 0=None, 1=1-5 hours, 2=6-10 hours, 3=11-20 hours, 5=More than 30 hours)
10a. Preparing for class (studying, reading, writing, rehearsing, etc.)
1.94 2.00 2.02 2.14 2.05 5.7%
How often do you use the following services? (Scale: 1=Rarely/Never, 2=Sometimes, 3=Often)
13d1. Frequency: Peer or other tutoring 1.43 1.50 1.45 1.47 1.45 1.5%
13e1. Frequency: Skill labs 1.66 1.67 1.62 1.61 1.66 0.0%
13h1. Frequency: Computer lab 1.98 1.97 1.98 1.98 1.99 0.6% ↑↓ Note: Directional arrows highlight those items in 2012 that are significantly above or below the mean of 2007. Using one-way analysis of variance the items highlighted are significant at p < .05, a 95% confidence level.
9
Since 2007, the three questions where MTC students’ perceptions have decreased significantly:
Prepared two or more drafts of a paper or assignment before turning it in (4c).
Worked on a paper or project that required integrating ideas or information from various sources (4d).
Came to class without completing readings or assignments (4e). Please note that is a positive trend. This means that students are coming to class more prepared in 2012 as compared to 2007.
These results suggest that in 2012, as compared to 2007:
MTC students are preparing fewer drafts of papers or assignments before turning them in. Research reveals that students who receive written instructions that identify textual flaws as well as prescriptive comments revise their essay assignments more effectively as compared to students that only receive instructions stating that flaws need to be corrected (Carifio, Jackson and Dagostino).
Students at MTC are less required to integrate ideas or information from various sources into their papers or projects. Research has shown the importance of writing assignments that teach students how to evaluate and critique the written work of others (Smith, Broughton and Copley).
MTC students come to class better prepared by completing readings or assignments. Research shows that students report higher class attendance, increased study behavior and higher exam scores when instructors use infrequent, minimal-weight unannounced quizzes (Kouyoumdjian).
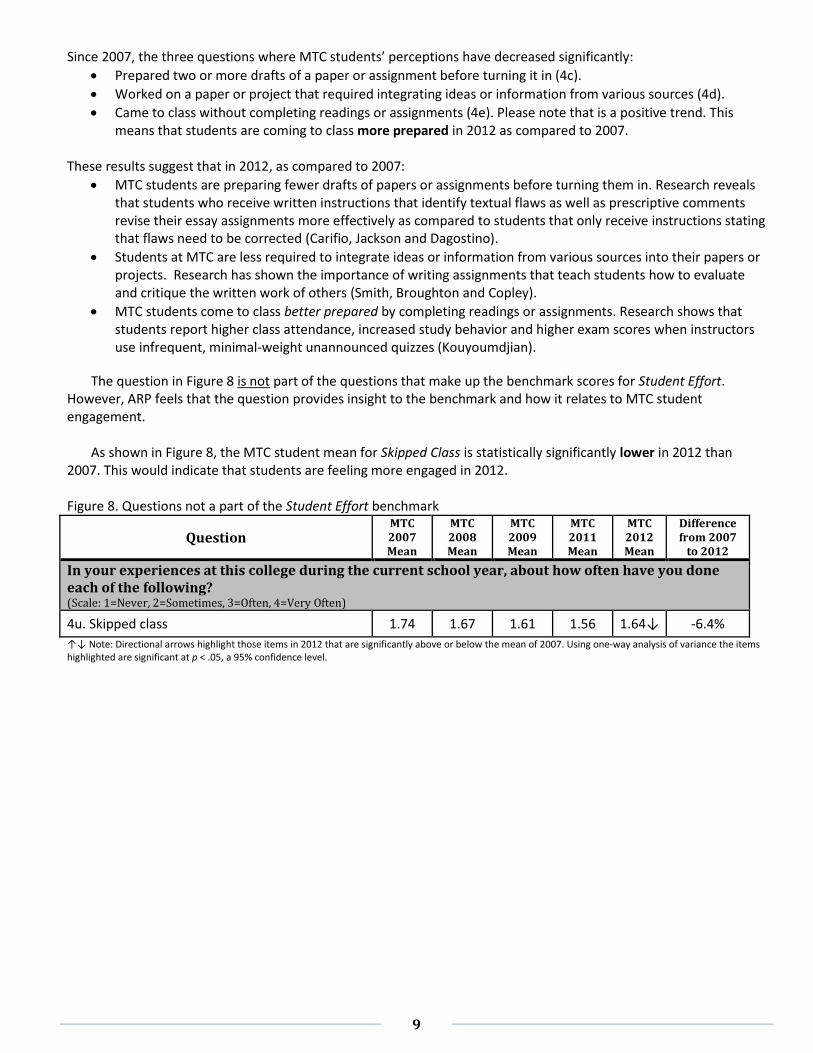
The question in Figure 8 is not part of the questions that make up the benchmark scores for Student Effort. However, ARP feels that the question provides insight to the benchmark and how it relates to MTC student engagement.
As shown in Figure 8, the MTC student mean for Skipped Class is statistically significantly lower in 2012 than 2007. This would indicate that students are feeling more engaged in 2012.
Figure 8. Questions not a part of the Student Effort benchmark
Question MTC 2007 Mean
MTC 2008 Mean
MTC 2009 Mean
MTC 2011 Mean
MTC 2012 Mean
Difference from 2007
to 2012
In your experiences at this college during the current school year, about how often have you done each of the following? (Scale: 1=Never, 2=Sometimes, 3=Often, 4=Very Often)
4u. Skipped class 1.74 1.67 1.61 1.56 1.64↓ -6.4%
↑↓ Note: Directional arrows highlight those items in 2012 that are significantly above or below the mean of 2007. Using one-way analysis of variance the items highlighted are significant at p < .05, a 95% confidence level.
10
Academic Challenge
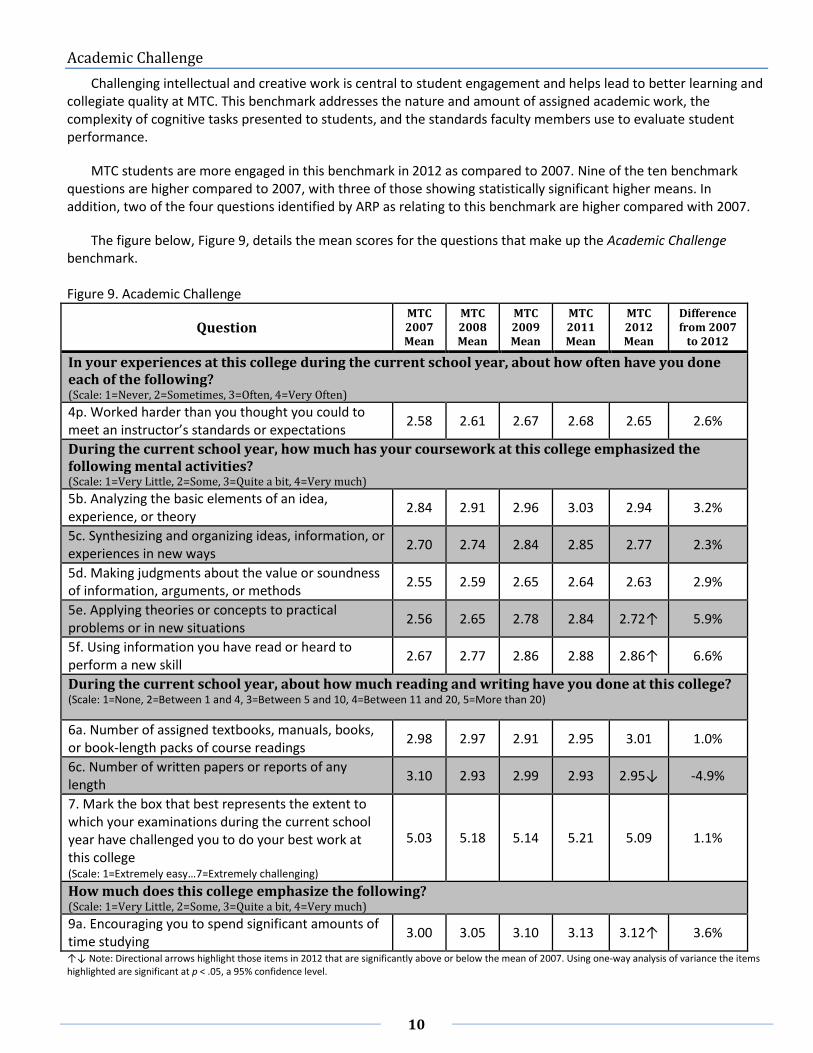
Challenging intellectual and creative work is central to student engagement and helps lead to better learning and collegiate quality at MTC. This benchmark addresses the nature and amount of assigned academic work, the complexity of cognitive tasks presented to students, and the standards faculty members use to evaluate student performance.
MTC students are more engaged in this benchmark in 2012 as compared to 2007. Nine of the ten benchmark questions are higher compared to 2007, with three of those showing statistically significant higher means. In addition, two of the four questions identified by ARP as relating to this benchmark are higher compared with 2007.
The figure below, Figure 9, details the mean scores for the questions that make up the Academic Challenge benchmark. Figure 9. Academic Challenge
Question MTC 2007 Mean
MTC 2008 Mean
MTC 2009 Mean
MTC 2011 Mean
MTC 2012 Mean
Difference from 2007
to 2012
In your experiences at this college during the current school year, about how often have you done each of the following? (Scale: 1=Never, 2=Sometimes, 3=Often, 4=Very Often)
4p. Worked harder than you thought you could to meet an instructor’s standards or expectations
2.58 2.61 2.67 2.68 2.65 2.6%
During the current school year, how much has your coursework at this college emphasized the following mental activities? (Scale: 1=Very Little, 2=Some, 3=Quite a bit, 4=Very much) 5b. Analyzing the basic elements of an idea, experience, or theory
2.84 2.91 2.96 3.03 2.94 3.2%
5c. Synthesizing and organizing ideas, information, or experiences in new ways
2.70 2.74 2.84 2.85 2.77 2.3%
5d. Making judgments about the value or soundness of information, arguments, or methods
2.55 2.59 2.65 2.64 2.63 2.9%
5e. Applying theories or concepts to practical problems or in new situations
2.56 2.65 2.78 2.84 2.72↑ 5.9%
5f. Using information you have read or heard to perform a new skill
2.67 2.77 2.86 2.88 2.86↑ 6.6%
During the current school year, about how much reading and writing have you done at this college? (Scale: 1=None, 2=Between 1 and 4, 3=Between 5 and 10, 4=Between 11 and 20, 5=More than 20)
6a. Number of assigned textbooks, manuals, books, or book-length packs of course readings
2.98 2.97 2.91 2.95 3.01 1.0%
6c. Number of written papers or reports of any length
3.10 2.93 2.99 2.93 2.95↓ -4.9%
7. Mark the box that best represents the extent to which your examinations during the current school year have challenged you to do your best work at this college (Scale: 1=Extremely easy…7=Extremely challenging)
5.03 5.18 5.14 5.21 5.09 1.1%
How much does this college emphasize the following? (Scale: 1=Very Little, 2=Some, 3=Quite a bit, 4=Very much) 9a. Encouraging you to spend significant amounts of time studying
3.00 3.05 3.10 3.13 3.12↑ 3.6%
↑↓ Note: Directional arrows highlight those items in 2012 that are significantly above or below the mean of 2007. Using one-way analysis of variance the items highlighted are significant at p < .05, a 95% confidence level.
11
Since 2007, the questions where MTC student’s perceptions have increased or decreased significantly are:
Applying theories or concepts to practical problems or in new situations (5e) has increased.
Using information you have read or heard to perform a new skill (5f) has increased.
Encouraging you to spend significant amounts of time studying (9a) has increased.
Number of written papers or reports of any length (6c) has decreased.
These results suggest that, as compared to 2007, in 2012:
Questions 5e and 5f suggest MTC instructors are requiring students to spend more time analyzing the basic elements of an idea, experience, or theory, synthesizing and organizing those ideas, applying theories or concepts to practical problems and using information they have read or heard to perform a new skill. Research shows that students are more successful when focused on cognitive efforts, such as applying information, as opposed to routine memorization techniques (Hynd, Holschuh and Nist).
MTC students are writing fewer papers or reports. Research has revealed that first-year college students’ writing skills and abilities improve when faced with demanding assignments, teacher modeling and classmate support (Simmons).
MTC students perceive they are encouraged to work hard to meet their instructor’s standards or expectations. Research suggests that instructor’s academic expectations about a person can lead that person to behave in order to meet and achieve those expectations, otherwise known as the Pygmalion effect (Tauber).
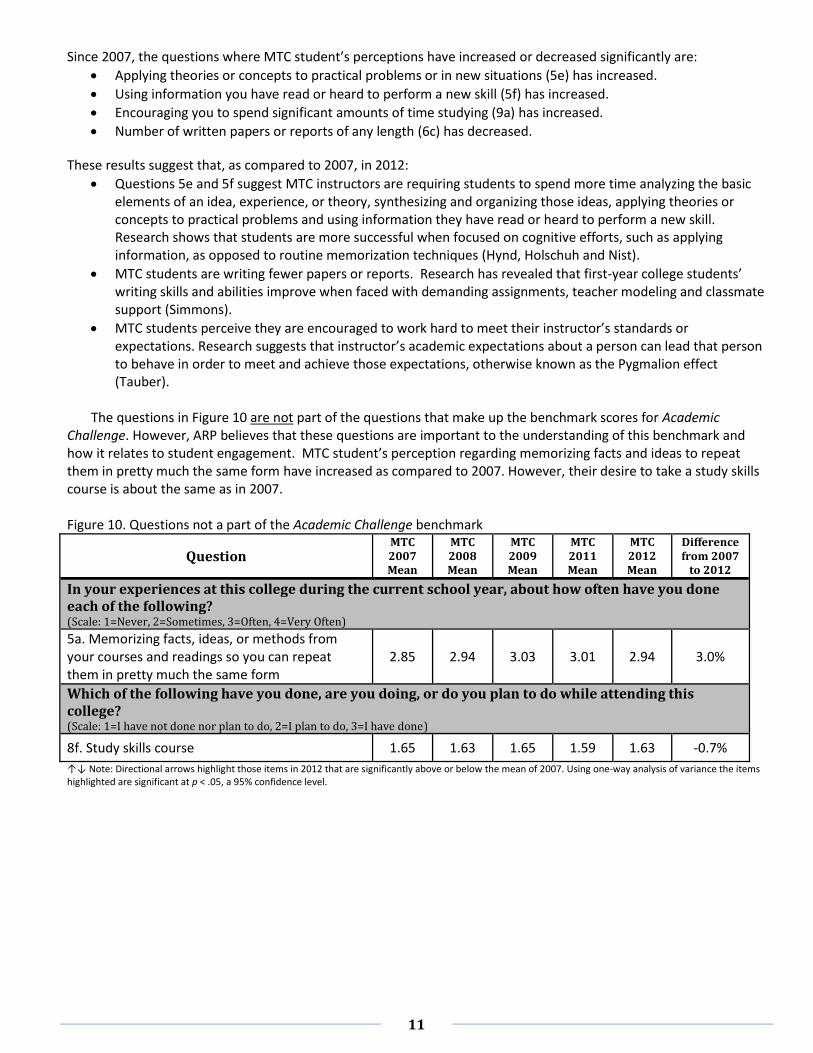
The questions in Figure 10 are not part of the questions that make up the benchmark scores for Academic
Challenge. However, ARP believes that these questions are important to the understanding of this benchmark and how it relates to student engagement. MTC student’s perception regarding memorizing facts and ideas to repeat them in pretty much the same form have increased as compared to 2007. However, their desire to take a study skills course is about the same as in 2007. Figure 10. Questions not a part of the Academic Challenge benchmark
Question MTC 2007 Mean
MTC 2008 Mean
MTC 2009 Mean
MTC 2011 Mean
MTC 2012 Mean
Difference from 2007
to 2012
In your experiences at this college during the current school year, about how often have you done each of the following? (Scale: 1=Never, 2=Sometimes, 3=Often, 4=Very Often)
5a. Memorizing facts, ideas, or methods from your courses and readings so you can repeat them in pretty much the same form
2.85 2.94 3.03 3.01 2.94 3.0%
Which of the following have you done, are you doing, or do you plan to do while attending this college? (Scale: 1=I have not done nor plan to do, 2=I plan to do, 3=I have done)
8f. Study skills course 1.65 1.63 1.65 1.59 1.63 -0.7%
↑↓ Note: Directional arrows highlight those items in 2012 that are significantly above or below the mean of 2007. Using one-way analysis of variance the items highlighted are significant at p < .05, a 95% confidence level.
12
Student-Faculty Interaction
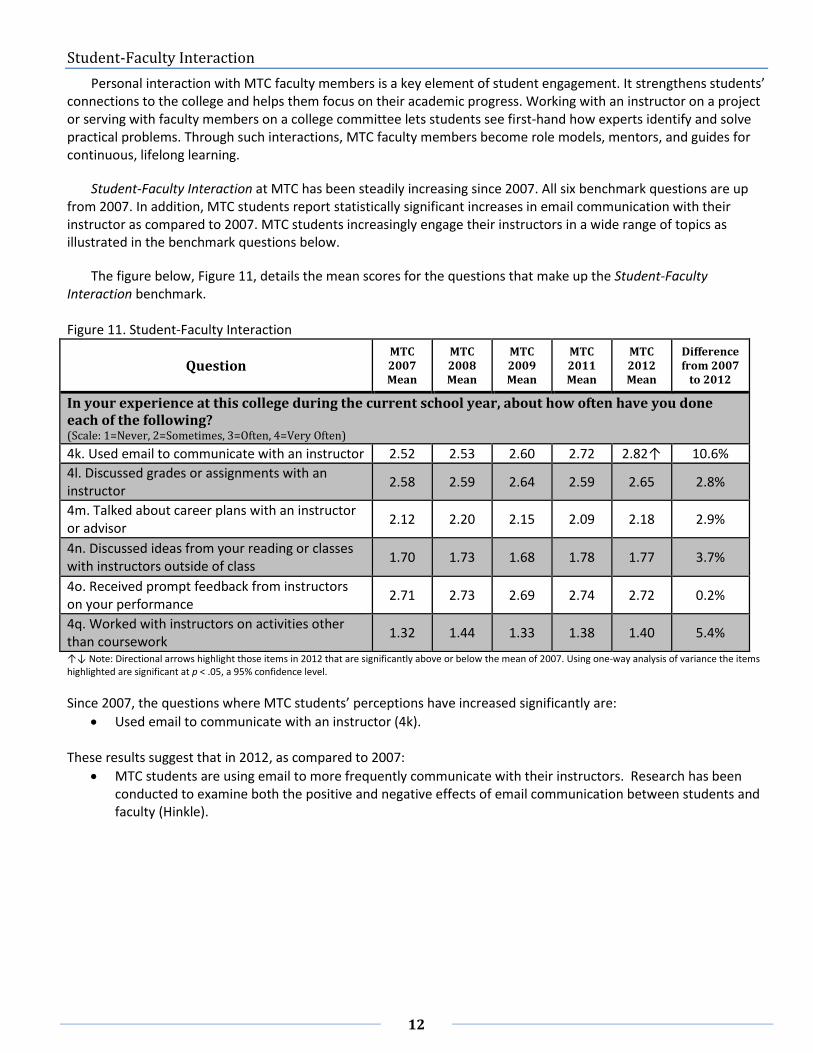
Personal interaction with MTC faculty members is a key element of student engagement. It strengthens students’ connections to the college and helps them focus on their academic progress. Working with an instructor on a project or serving with faculty members on a college committee lets students see first-hand how experts identify and solve practical problems. Through such interactions, MTC faculty members become role models, mentors, and guides for continuous, lifelong learning.
Student-Faculty Interaction at MTC has been steadily increasing since 2007. All six benchmark questions are up from 2007. In addition, MTC students report statistically significant increases in email communication with their instructor as compared to 2007. MTC students increasingly engage their instructors in a wide range of topics as illustrated in the benchmark questions below.
The figure below, Figure 11, details the mean scores for the questions that make up the Student-Faculty Interaction benchmark. Figure 11. Student-Faculty Interaction
Question MTC 2007 Mean
MTC 2008 Mean
MTC 2009 Mean
MTC 2011 Mean
MTC 2012 Mean
Difference from 2007
to 2012
In your experience at this college during the current school year, about how often have you done each of the following? (Scale: 1=Never, 2=Sometimes, 3=Often, 4=Very Often)
4k. Used email to communicate with an instructor 2.52 2.53 2.60 2.72 2.82↑ 10.6%
4l. Discussed grades or assignments with an instructor
2.58 2.59 2.64 2.59 2.65 2.8%
4m. Talked about career plans with an instructor or advisor
2.12 2.20 2.15 2.09 2.18 2.9%
4n. Discussed ideas from your reading or classes with instructors outside of class
1.70 1.73 1.68 1.78 1.77 3.7%
4o. Received prompt feedback from instructors on your performance
2.71 2.73 2.69 2.74 2.72 0.2%
4q. Worked with instructors on activities other than coursework
1.32 1.44 1.33 1.38 1.40 5.4%
↑↓ Note: Directional arrows highlight those items in 2012 that are significantly above or below the mean of 2007. Using one-way analysis of variance the items highlighted are significant at p < .05, a 95% confidence level.
Since 2007, the questions where MTC students’ perceptions have increased significantly are:
Used email to communicate with an instructor (4k). These results suggest that in 2012, as compared to 2007:
MTC students are using email to more frequently communicate with their instructors. Research has been conducted to examine both the positive and negative effects of email communication between students and faculty (Hinkle).
13
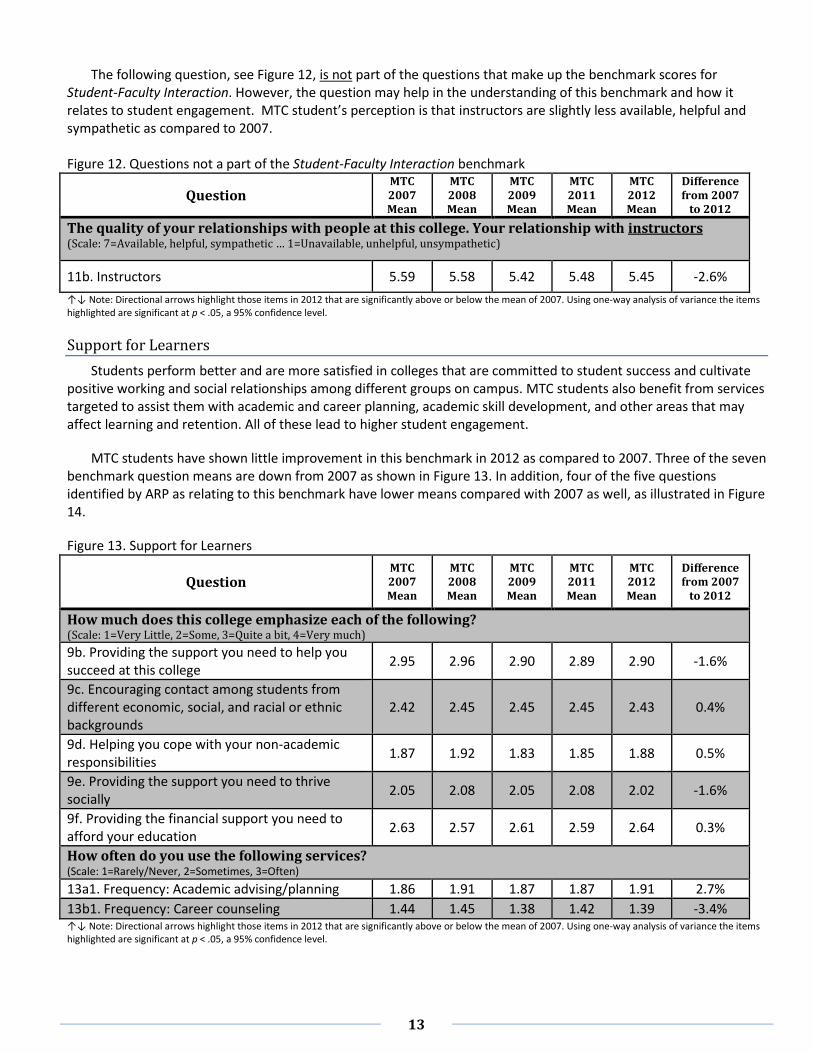
The following question, see Figure 12, is not part of the questions that make up the benchmark scores for
Student-Faculty Interaction. However, the question may help in the understanding of this benchmark and how it relates to student engagement. MTC student’s perception is that instructors are slightly less available, helpful and sympathetic as compared to 2007. Figure 12. Questions not a part of the Student-Faculty Interaction benchmark
Question MTC 2007 Mean
MTC 2008 Mean
MTC 2009 Mean
MTC 2011 Mean
MTC 2012 Mean
Difference from 2007
to 2012
The quality of your relationships with people at this college. Your relationship with instructors (Scale: 7=Available, helpful, sympathetic … 1=Unavailable, unhelpful, unsympathetic)
11b. Instructors 5.59 5.58 5.42 5.48 5.45 -2.6%
↑↓ Note: Directional arrows highlight those items in 2012 that are significantly above or below the mean of 2007. Using one-way analysis of variance the items highlighted are significant at p < .05, a 95% confidence level.
Support for Learners
Students perform better and are more satisfied in colleges that are committed to student success and cultivate positive working and social relationships among different groups on campus. MTC students also benefit from services targeted to assist them with academic and career planning, academic skill development, and other areas that may affect learning and retention. All of these lead to higher student engagement.
MTC students have shown little improvement in this benchmark in 2012 as compared to 2007. Three of the seven benchmark question means are down from 2007 as shown in Figure 13. In addition, four of the five questions identified by ARP as relating to this benchmark have lower means compared with 2007 as well, as illustrated in Figure 14.
Figure 13. Support for Learners
Question MTC 2007 Mean
MTC 2008 Mean
MTC 2009 Mean
MTC 2011 Mean
MTC 2012 Mean
Difference from 2007
to 2012
How much does this college emphasize each of the following? (Scale: 1=Very Little, 2=Some, 3=Quite a bit, 4=Very much)
9b. Providing the support you need to help you succeed at this college
2.95 2.96 2.90 2.89 2.90 -1.6%
9c. Encouraging contact among students from different economic, social, and racial or ethnic backgrounds
2.42 2.45 2.45 2.45 2.43 0.4%
9d. Helping you cope with your non-academic responsibilities
1.87 1.92 1.83 1.85 1.88 0.5%
9e. Providing the support you need to thrive socially
2.05 2.08 2.05 2.08 2.02 -1.6%
9f. Providing the financial support you need to afford your education
2.63 2.57 2.61 2.59 2.64 0.3%
How often do you use the following services? (Scale: 1=Rarely/Never, 2=Sometimes, 3=Often)
13a1. Frequency: Academic advising/planning 1.86 1.91 1.87 1.87 1.91 2.7%
13b1. Frequency: Career counseling 1.44 1.45 1.38 1.42 1.39 -3.4% ↑↓ Note: Directional arrows highlight those items in 2012 that are significantly above or below the mean of 2007. Using one-way analysis of variance the items highlighted are significant at p < .05, a 95% confidence level.
14
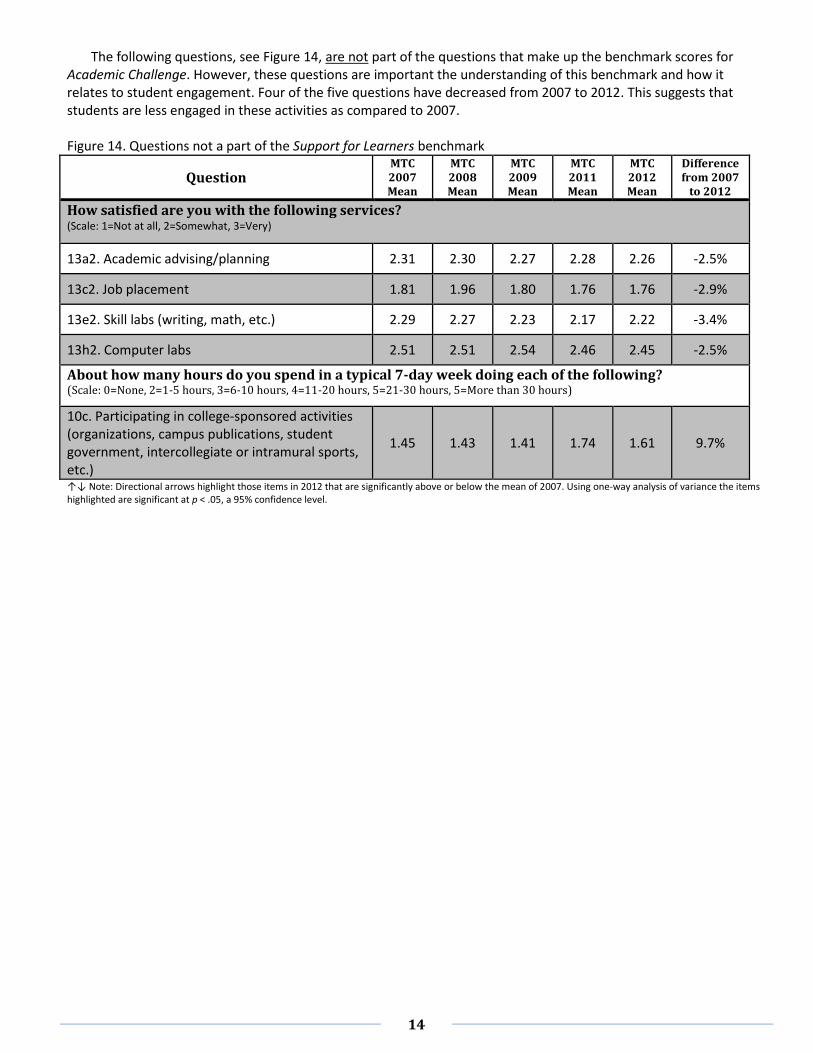
The following questions, see Figure 14, are not part of the questions that make up the benchmark scores for Academic Challenge. However, these questions are important the understanding of this benchmark and how it relates to student engagement. Four of the five questions have decreased from 2007 to 2012. This suggests that students are less engaged in these activities as compared to 2007. Figure 14. Questions not a part of the Support for Learners benchmark
Question MTC 2007 Mean
MTC 2008 Mean
MTC 2009 Mean
MTC 2011 Mean
MTC 2012 Mean
Difference from 2007
to 2012
How satisfied are you with the following services? (Scale: 1=Not at all, 2=Somewhat, 3=Very)
13a2. Academic advising/planning 2.31 2.30 2.27 2.28 2.26 -2.5%
13c2. Job placement 1.81 1.96 1.80 1.76 1.76 -2.9%
13e2. Skill labs (writing, math, etc.) 2.29 2.27 2.23 2.17 2.22 -3.4%
13h2. Computer labs 2.51 2.51 2.54 2.46 2.45 -2.5%
About how many hours do you spend in a typical 7-day week doing each of the following? (Scale: 0=None, 2=1-5 hours, 3=6-10 hours, 4=11-20 hours, 5=21-30 hours, 5=More than 30 hours)
10c. Participating in college-sponsored activities (organizations, campus publications, student government, intercollegiate or intramural sports, etc.)
1.45 1.43 1.41 1.74 1.61 9.7%
↑↓ Note: Directional arrows highlight those items in 2012 that are significantly above or below the mean of 2007. Using one-way analysis of variance the items highlighted are significant at p < .05, a 95% confidence level.

15
2007/2012 Benchmark Means of MTC Student Sub-Cohorts
Assessment, Research and Planning (ARP) also analyzed 2007 to 2012 benchmark mean trends of several groups (or sub-cohorts) of MTC students:
Full-time & Part-time students
Developmental & Non-Developmental coursework
Gender
Race
Age
Full-time & Part-time students
Full-time students are more engaged across all benchmarks than part-time students as evidenced by the higher means for full-time students in 2012. In addition, there are statistically significant differences between both groups in four of five benchmark means in 2012, Active and Collaborative Learning, Student Effort, Academic Challenge, and Student-Faculty Interaction.
Both groups show increases in Active and Collaborative Learning, Academic Challenge, and Student-Faculty Interaction in 2012 as compared to 2007. However, part-time students have a larger percentage increase on these benchmarks from 2007 to 2012. This suggests that part-time students may be more sensitive to changes in coursework, curriculum, and school policies. Finally, part-time students are statistically significantly more engaged in Active and Collaborative Learning in 2012 as compared to 2007.
Statistically significant differences:
Part-time student means are significantly higher in 2012 for Active and Collaborative Learning than 2007.
Full-time student means are significantly higher in 2012 for Student-Faculty Interaction than 2007.
There are significant differences in 2012 between full-time and part-time students’ perceptions of engagement in four of the five benchmark means, those being Active and Collaborative Learners, Student Effort, Academic Challenge, and Student-Faculty Interaction. These results suggest that further research may be needed to determine the root cause of the differences.
Figure 15. MTC Benchmarks by year and Full-time (F-T) & Part-time (P-T) Status
Active and Collaborative
Learning Student Effort
Academic Challenge
Student-Faculty Interaction
Support for Learners
Year Mean % chg. Mean % chg. Mean % chg. Mean % chg. Mean % chg.
2007 F-T 0.355
0.483
0.597
0.405
0.451
2008 F-T 0.380 6.5% 0.477 -1.1% 0.595 -0.3% 0.425 4.5% 0.449 -0.4%
2009 F-T 0.357 0.6% 0.474 -1.8% 0.605 1.5% 0.417 2.8% 0.447 -0.8%
2011 F-T 0.375 5.2% 0.482 0.0% 0.625 4.5% 0.443 8.4% 0.436 -3.3%
2012 F-T 0.364 2.6% 0.477 -1.2% 0.608 1.9% 0.437↑ 7.2% 0.440 -2.5%
2007 P-T 0.305
0.447
0.541
0.378
0.417
2008 P-T 0.347 12.2% 0.445 -0.3% 0.563 3.8% 0.383 1.4% 0.436 4.2%
2009 P-T 0.319 4.4% 0.451 1.0% 0.585 7.4% 0.378 0.0% 0.409 -1.9%
2011 P-T 0.343 11.0% 0.442 -1.2% 0.581 6.9% 0.376 -0.7% 0.433 3.7%
2012 P-T 0.341↑* 10.6% 0.435* -2.8% 0.572* 5.3% 0.408* 7.3% 0.427 2.4% ↑↓ Note: Directional arrows highlight those items in 2012 that are significantly above or below the mean of 2007. Using one-way analysis of variance the items highlighted are significant at p < .05, a 95% confidence level. *Note: Significant difference between the groups in 2012. Using a T-test (2-tailed) the differences in the means are significant at p < .05, a 95% confidence level.

16
Developmental & Non-Developmental Students
Developmental students are more engaged than non-developmental students. Developmental students show increases in all benchmarks from 2007 to 2012. In addition, there is statistically significant difference in the mean for Student-Faculty Interaction in 2012 as compared to 2007. The scores for developmental students, while increasing over time, appear to fluctuate less and may indicate the importance of taking a developmental or skills course to help increase engagement with MTC. The exception to this is the Student Effort benchmark score. The 2012 mean for this benchmark is essentially the same as in 2007.
Non-developmental students show increases in three of five benchmark means with statistically significant differences in Active and Collaborative Learning, Academic Challenge, and Student-Faculty Interaction in 2012 as compared to 2007. They also show decreases in Student Effort and Support for Learners over the same time period. Benchmark means for non-developmental students appear to fluctuate more over time. This suggests that their perception of engagement is changing and that they may benefit by taking a skills course early in their academic careers.
Statistically significant differences:
Developmental student means are significantly higher in 2012 for Student-Faculty Interaction than 2007.
Non-Developmental student means are significantly higher in 2012 for Active and Collaborative Learning, Academic Challenge, and Student-Faculty Interaction than 2007.
There are significant differences in 2012 between developmental and non-developmental students’ perceptions of engagement in four of the five benchmark means, those being Academic Challenge, Student Effort, Student-Faculty Interaction, and Support for Learners. These results suggest that further research may be needed to determine the root cause of the differences.
Figure 16. MTC Benchmarks by year and Developmental (DVS) & Non-Developmental (Non-DVS) coursework
Active and Collaborative
Learning Student Effort
Academic Challenge
Student-Faculty Interaction
Support for Learners
Year Mean % chg. Mean % chg. Mean % chg. Mean % chg. Mean % chg.
2007 DVS 0.333 0.477 0.578 0.399 0.459
2008 DVS 0.381 12.5% 0.486 1.9% 0.599 3.5% 0.413 3.4% 0.487 5.7%
2009 DVS 0.369 9.6% 0.491 2.8% 0.603 4.1% 0.403 1.0% 0.466 1.5%
2011 DVS 0.359 7.1% 0.482 1.0% 0.610 5.2% 0.417 4.3% 0.453 -1.2%
2012 DVS 0.360 7.3% 0.480 0.6% 0.603 4.1% 0.437↑ 8.6% 0.473 2.9%
2007 Non-DVS 0.315
0.446
0.549
0.377
0.403
2008 Non-DVS 0.346 9.0% 0.433 -3.0% 0.558 1.6% 0.391 3.6% 0.402 -0.1%
2009 Non-DVS 0.311 -1.3% 0.438 -1.9% 0.585 6.1% 0.386 2.3% 0.397 -1.4%
2011 Non-DVS 0.352 10.5% 0.443 -0.8% 0.595 7.7% 0.397 5.0% 0.418 3.8%
2012 Non-DVS 0.347↑ 9.1% 0.434* -2.7% 0.578↑* 5.1% 0.408↑* 7.6% 0.402* -0.3% ↑↓ Note: Directional arrows highlight those items in 2012 that are significantly above or below the mean of 2007. Using one-way analysis of variance the items highlighted are significant at p < .05, a 95% confidence level. *Note: Significant difference between the groups in 2012. Using a T-test (2-tailed) the differences in the means are significant at p < .05, a 95% confidence level.
For a detailed explanation of how respondents are defined as developmental students and non-developmental students, please see Appendix B.

17
Benchmarks by Gender
Male and female students at MTC have differing levels of engagement. With the exception of Student Effort, both groups show the same increases in benchmark means since 2007 but with a wide percentage difference between the two groups. For example, in 2012 male students perceived that less individual effort is needed as compared to 2007; female students’ perceptions of effort needed is virtually the same since 2007 but significantly different from their male counterparts in 2012. What this means is that female students feel the need to exert more effort than male students.
Statistically significant differences:
Male student means are significantly higher in 2012 for Active and Collaborative Learning than 2007.
Female student means are significantly higher in 2012 for Student-Faculty Interaction than 2007.
There are significant differences in 2012 between male and female students’ perceptions of engagement in four of the five benchmark means, those being Student Effort, Academic Challenge, Student-Faculty Interaction, and Support for Learners. These results suggest that further research may be needed to determine the root cause of the differences.
Figure 17. MTC Benchmarks by Year and Gender
Active and Collaborative
Learning Student Effort
Academic Challenge
Student-Faculty Interaction
Support for Learners
Year Mean % chg. Mean % chg. Mean % chg. Mean % chg. Mean % chg.
2007 Male 0.299
0.451
0.545
0.376
0.418
2008 Male 0.346 13.6% 0.428 -5.4% 0.549 0.8% 0.389 3.4% 0.427 2.3%
2009 Male 0.321 6.8% 0.436 -3.4% 0.566 3.8% 0.389 3.2% 0.416 -0.5%
2011 Male 0.353 15.1% 0.435 -3.7% 0.569 4.3% 0.403 6.6% 0.420 0.6%
2012 Male 0.340↑ 11.9% 0.436 -3.3% 0.566 3.8% 0.403 6.7% 0.420 0.6%
2007 Female 0.343
0.467
0.578
0.401
0.443
2008 Female 0.373 8.2% 0.477 2.1% 0.595 2.8% 0.412 2.5% 0.452 2.2%
2009 Female 0.347 1.3% 0.481 2.8% 0.615 6.1% 0.403 0.3% 0.434 -2.0%
2011 Female 0.363 5.6% 0.482 3.0% 0.630 8.2% 0.409 1.9% 0.446 0.9%
2012 Female 0.362* 5.3% 0.470* 0.5% 0.608↑* 4.9% 0.438↑* 8.3% 0.446 0.9% ↑↓ Note: Directional arrows highlight those items in 2012 that are significantly above or below the mean of 2007. Using one-way analysis of variance the items highlighted are significant at p < .05, a 95% confidence level. *Note: Significant difference between the groups in 2012. Using a T-test (2-tailed) the differences in the means are significant at p < .05, a 95% confidence level.
18
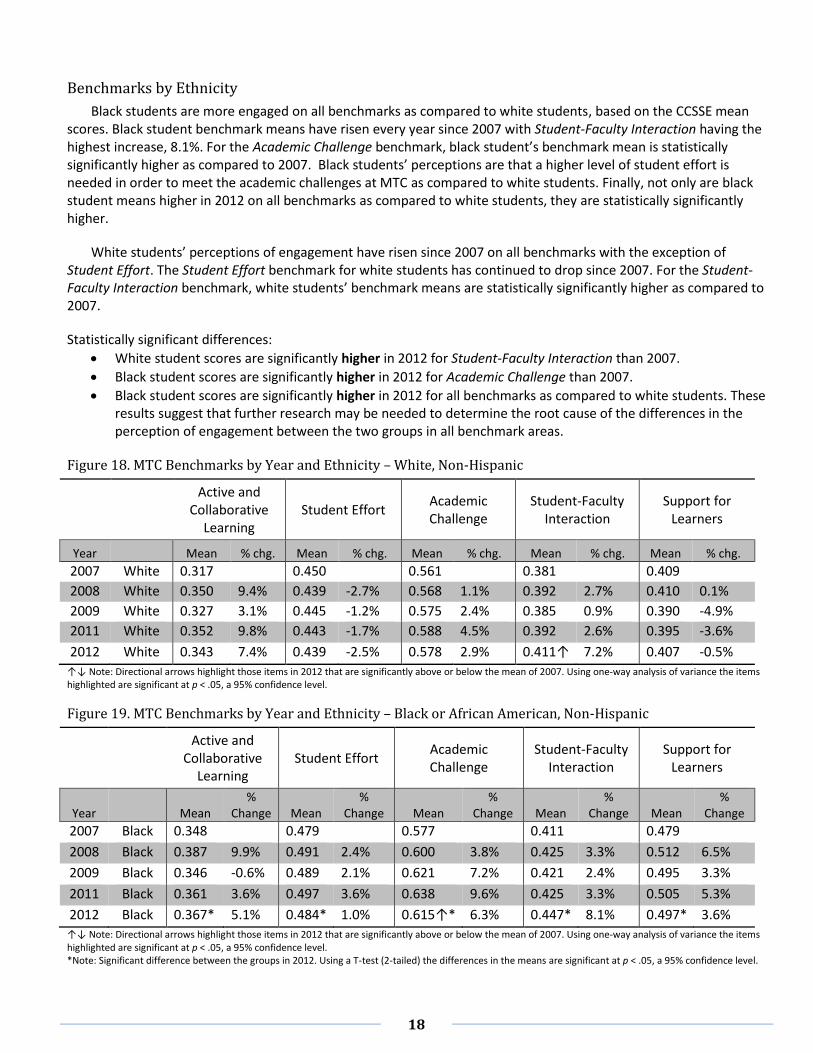
Benchmarks by Ethnicity
Black students are more engaged on all benchmarks as compared to white students, based on the CCSSE mean scores. Black student benchmark means have risen every year since 2007 with Student-Faculty Interaction having the highest increase, 8.1%. For the Academic Challenge benchmark, black student’s benchmark mean is statistically significantly higher as compared to 2007. Black students’ perceptions are that a higher level of student effort is needed in order to meet the academic challenges at MTC as compared to white students. Finally, not only are black student means higher in 2012 on all benchmarks as compared to white students, they are statistically significantly higher.
White students’ perceptions of engagement have risen since 2007 on all benchmarks with the exception of Student Effort. The Student Effort benchmark for white students has continued to drop since 2007. For the Student-Faculty Interaction benchmark, white students’ benchmark means are statistically significantly higher as compared to 2007.
Statistically significant differences:
White student scores are significantly higher in 2012 for Student-Faculty Interaction than 2007.
Black student scores are significantly higher in 2012 for Academic Challenge than 2007.
Black student scores are significantly higher in 2012 for all benchmarks as compared to white students. These results suggest that further research may be needed to determine the root cause of the differences in the perception of engagement between the two groups in all benchmark areas.
Figure 18. MTC Benchmarks by Year and Ethnicity – White, Non-Hispanic
Active and Collaborative
Learning Student Effort
Academic Challenge
Student-Faculty Interaction
Support for Learners
Year
Mean % chg. Mean % chg. Mean % chg. Mean % chg. Mean % chg.
2007 White 0.317 0.450 0.561 0.381 0.409
2008 White 0.350 9.4% 0.439 -2.7% 0.568 1.1% 0.392 2.7% 0.410 0.1%
2009 White 0.327 3.1% 0.445 -1.2% 0.575 2.4% 0.385 0.9% 0.390 -4.9%
2011 White 0.352 9.8% 0.443 -1.7% 0.588 4.5% 0.392 2.6% 0.395 -3.6%
2012 White 0.343 7.4% 0.439 -2.5% 0.578 2.9% 0.411↑ 7.2% 0.407 -0.5%
↑↓ Note: Directional arrows highlight those items in 2012 that are significantly above or below the mean of 2007. Using one-way analysis of variance the items highlighted are significant at p < .05, a 95% confidence level.
Figure 19. MTC Benchmarks by Year and Ethnicity – Black or African American, Non-Hispanic
Active and Collaborative
Learning Student Effort
Academic Challenge
Student-Faculty Interaction
Support for Learners
Year
Mean %
Change Mean %
Change Mean %
Change Mean %
Change Mean %
Change
2007 Black 0.348 0.479 0.577 0.411 0.479
2008 Black 0.387 9.9% 0.491 2.4% 0.600 3.8% 0.425 3.3% 0.512 6.5%
2009 Black 0.346 -0.6% 0.489 2.1% 0.621 7.2% 0.421 2.4% 0.495 3.3%
2011 Black 0.361 3.6% 0.497 3.6% 0.638 9.6% 0.425 3.3% 0.505 5.3%
2012 Black 0.367* 5.1% 0.484* 1.0% 0.615↑* 6.3% 0.447* 8.1% 0.497* 3.6%
↑↓ Note: Directional arrows highlight those items in 2012 that are significantly above or below the mean of 2007. Using one-way analysis of variance the items highlighted are significant at p < .05, a 95% confidence level. *Note: Significant difference between the groups in 2012. Using a T-test (2-tailed) the differences in the means are significant at p < .05, a 95% confidence level.
19
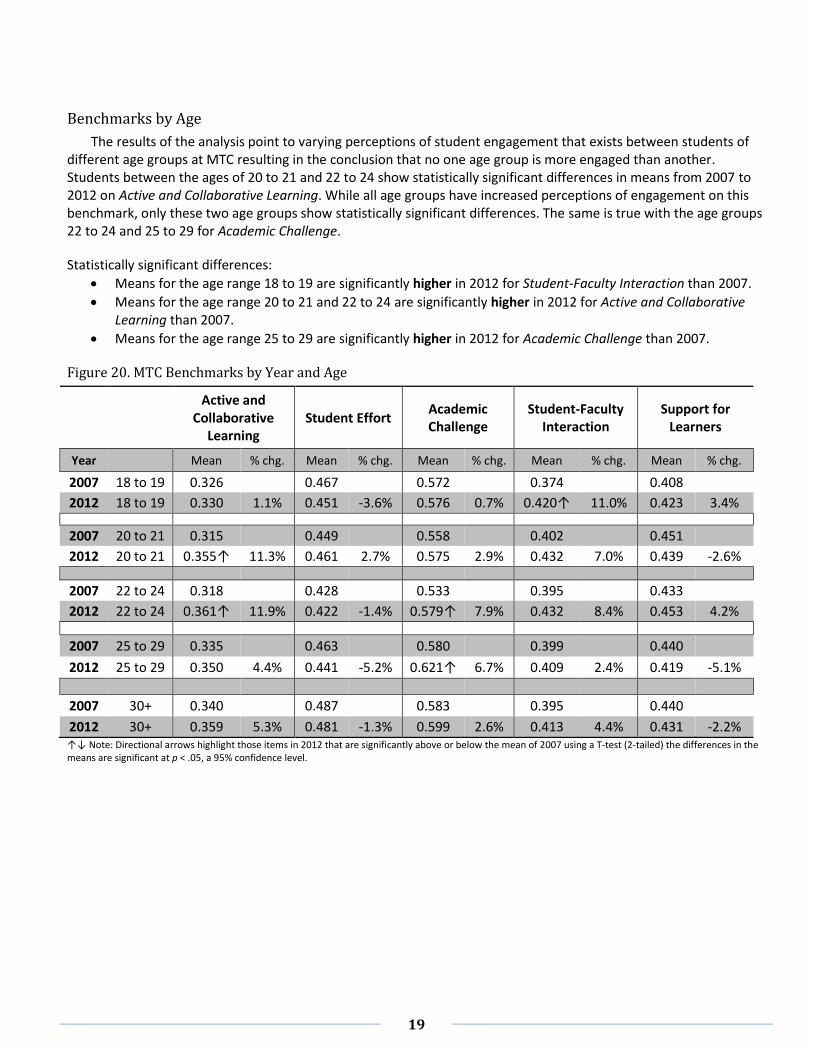
Benchmarks by Age
The results of the analysis point to varying perceptions of student engagement that exists between students of different age groups at MTC resulting in the conclusion that no one age group is more engaged than another. Students between the ages of 20 to 21 and 22 to 24 show statistically significant differences in means from 2007 to 2012 on Active and Collaborative Learning. While all age groups have increased perceptions of engagement on this benchmark, only these two age groups show statistically significant differences. The same is true with the age groups 22 to 24 and 25 to 29 for Academic Challenge.
Statistically significant differences:
Means for the age range 18 to 19 are significantly higher in 2012 for Student-Faculty Interaction than 2007.
Means for the age range 20 to 21 and 22 to 24 are significantly higher in 2012 for Active and Collaborative Learning than 2007.
Means for the age range 25 to 29 are significantly higher in 2012 for Academic Challenge than 2007.
Figure 20. MTC Benchmarks by Year and Age
Active and Collaborative
Learning Student Effort
Academic Challenge
Student-Faculty Interaction
Support for Learners
Year
Mean % chg. Mean % chg. Mean % chg. Mean % chg. Mean % chg.
2007 18 to 19 0.326
0.467
0.572
0.374
0.408
2012 18 to 19 0.330 1.1% 0.451 -3.6% 0.576 0.7% 0.420↑ 11.0% 0.423 3.4%
2007 20 to 21 0.315 0.449 0.558 0.402 0.451
2012 20 to 21 0.355↑ 11.3% 0.461 2.7% 0.575 2.9% 0.432 7.0% 0.439 -2.6%
2007 22 to 24 0.318 0.428 0.533 0.395 0.433
2012 22 to 24 0.361↑ 11.9% 0.422 -1.4% 0.579↑ 7.9% 0.432 8.4% 0.453 4.2%
2007 25 to 29 0.335 0.463 0.580 0.399 0.440
2012 25 to 29 0.350 4.4% 0.441 -5.2% 0.621↑ 6.7% 0.409 2.4% 0.419 -5.1%
2007 30+ 0.340 0.487 0.583 0.395 0.440
2012 30+ 0.359 5.3% 0.481 -1.3% 0.599 2.6% 0.413 4.4% 0.431 -2.2% ↑↓ Note: Directional arrows highlight those items in 2012 that are significantly above or below the mean of 2007 using a T-test (2-tailed) the differences in the means are significant at p < .05, a 95% confidence level.
20
Chapter 3 – 2012 MTC Comparison of Benchmark Scores
Assessment, Research and Planning (ARP) analyzed Midlands Technical College’s (MTC) 2012 benchmark and question scores and compared them to other groups of colleges. CCSSE utilizes a three-year cohort (2010 through 2012) of all participating colleges in all of its data analyses, including the computation of benchmark scores. This cohort is referred to as the 2012 CCSSE Cohort. The comparison groups used in this section are:
South Carolina regional consortium (SC Consortium Colleges) includes Aiken Technical College, Central
Carolina Technical College, Greenville Technical College, Horry-Georgetown Technical College, Northeastern
Technical College, Technical College of the Low Country, and Tri-County Technical College.
The Large College cohort (Large Colleges) includes 134 institutions with 8,000-14,999 credit students.
CCSSE Cohort includes all 710 community colleges who participated in the 2010 to 2012 CCSSE surveys.
Benchmark Scores
The results of the analysis show that MTC’s 2012 benchmark scores are below the SC Consortium College on all five benchmark scores. MTC is below both the Large Colleges and the CCSSE cohort on three of five benchmark scores. However, MTC students show higher engagement on the Academic Challenge and Student-Faculty Interaction benchmarks than both the CCSSE cohort and Large Colleges.
The results from the benchmark scores suggests students at MTC perceive that they are both academically challenged and engaged with faculty members, but do not feel the need to put forth more personal effort, spend less time engaging with fellow students on active and collaborative learning, while receiving below average support from MTC.
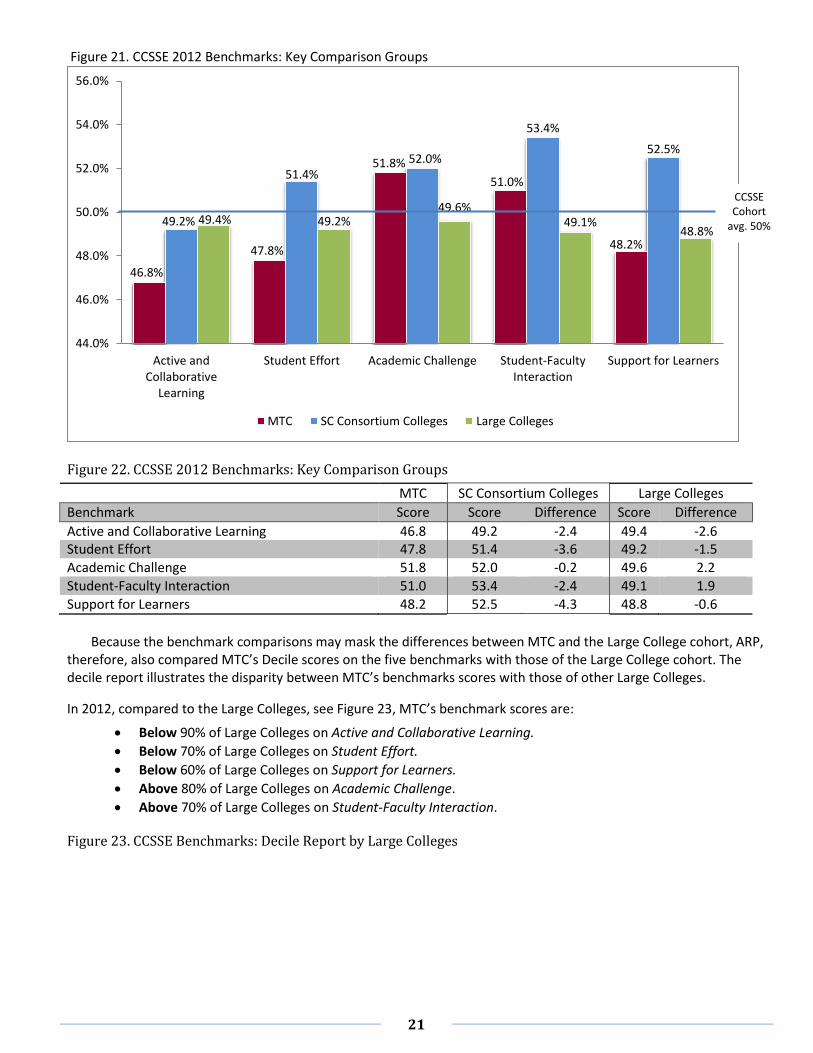
Compared to the SC Consortium Colleges and Large Colleges, as shown in Figure 21, MTC scores are:
Higher than the Large College cohort on Academic Challenge and Student-Faculty Interaction.
Lower than the SC Consortium Colleges on all benchmark scores.
Lower than the Large Colleges on three benchmarks, Active and Collaborative Learning, Student Effort and
Support for Learners.
21
Figure 21. CCSSE 2012 Benchmarks: Key Comparison Groups
Figure 22. CCSSE 2012 Benchmarks: Key Comparison Groups
MTC SC Consortium Colleges Large Colleges
Benchmark Score Score Difference Score Difference
Active and Collaborative Learning 46.8 49.2 -2.4 49.4 -2.6 Student Effort 47.8 51.4 -3.6 49.2 -1.5 Academic Challenge 51.8 52.0 -0.2 49.6 2.2
Student-Faculty Interaction 51.0 53.4 -2.4 49.1 1.9 Support for Learners 48.2 52.5 -4.3 48.8 -0.6
Because the benchmark comparisons may mask the differences between MTC and the Large College cohort, ARP,
therefore, also compared MTC’s Decile scores on the five benchmarks with those of the Large College cohort. The decile report illustrates the disparity between MTC’s benchmarks scores with those of other Large Colleges.
In 2012, compared to the Large Colleges, see Figure 23, MTC’s benchmark scores are:
Below 90% of Large Colleges on Active and Collaborative Learning.
Below 70% of Large Colleges on Student Effort.
Below 60% of Large Colleges on Support for Learners.
Above 80% of Large Colleges on Academic Challenge.
Above 70% of Large Colleges on Student-Faculty Interaction.
Figure 23. CCSSE Benchmarks: Decile Report by Large Colleges
46.8%
47.8%
51.8%
51.0%
48.2%
49.2%
51.4%52.0%
53.4%
52.5%
49.4% 49.2%49.6%
49.1%48.8%
44.0%
46.0%
48.0%
50.0%
52.0%
54.0%
56.0%
Active andCollaborative
Learning
Student Effort Academic Challenge Student-FacultyInteraction
Support for Learners
MTC SC Consortium Colleges Large Colleges
CCSSE Cohort
avg. 50%

22
* The comparison and cohort columns on this page INCLUDE MTC.
Active andCollaborative
Learning
StudentEffort
AcademicChallenge
Student-Faculty
Interaction
Support forLearners
Large Colleges Percentile 90% 70% 20% 30% 60%
MTC Percentile 10% 30% 80% 70% 40%
10%
30%
80%
70%
40%
0%
10%
20%
30%
40%
50%
60%
70%
80%
90%
100%
Percentile
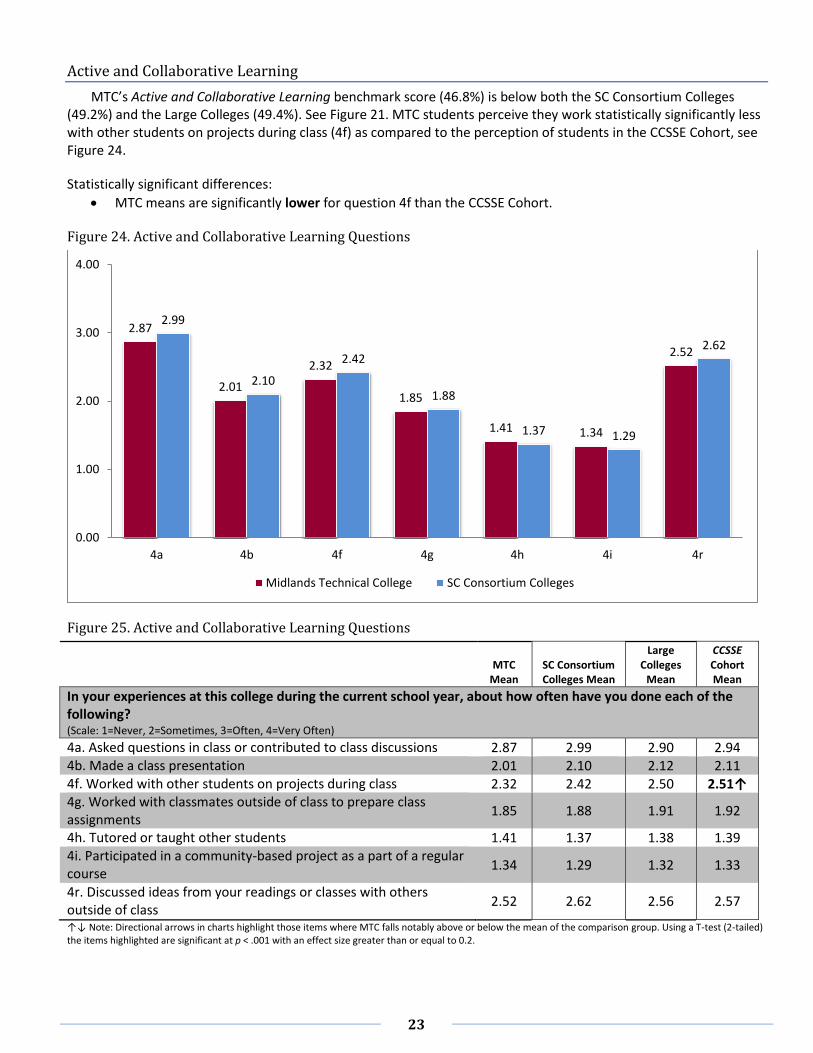
23
Active and Collaborative Learning
MTC’s Active and Collaborative Learning benchmark score (46.8%) is below both the SC Consortium Colleges (49.2%) and the Large Colleges (49.4%). See Figure 21. MTC students perceive they work statistically significantly less with other students on projects during class (4f) as compared to the perception of students in the CCSSE Cohort, see Figure 24.
Statistically significant differences:
MTC means are significantly lower for question 4f than the CCSSE Cohort.
Figure 24. Active and Collaborative Learning Questions
Figure 25. Active and Collaborative Learning Questions
MTC
Mean SC Consortium Colleges Mean
Large Colleges
Mean
CCSSE Cohort Mean
In your experiences at this college during the current school year, about how often have you done each of the following? (Scale: 1=Never, 2=Sometimes, 3=Often, 4=Very Often)
4a. Asked questions in class or contributed to class discussions 2.87 2.99 2.90 2.94 4b. Made a class presentation 2.01 2.10 2.12 2.11 4f. Worked with other students on projects during class 2.32 2.42 2.50 2.51↑ 4g. Worked with classmates outside of class to prepare class assignments
1.85 1.88 1.91 1.92
4h. Tutored or taught other students 1.41 1.37 1.38 1.39 4i. Participated in a community-based project as a part of a regular course
1.34 1.29 1.32 1.33
4r. Discussed ideas from your readings or classes with others outside of class
2.52 2.62 2.56 2.57
↑↓ Note: Directional arrows in charts highlight those items where MTC falls notably above or below the mean of the comparison group. Using a T-test (2-tailed) the items highlighted are significant at p < .001 with an effect size greater than or equal to 0.2.
2.87
2.01
2.32
1.85
1.41 1.34
2.52
2.99
2.10
2.42
1.88
1.37 1.29
2.62
0.00
1.00
2.00
3.00
4.00
4a 4b 4f 4g 4h 4i 4r
Midlands Technical College SC Consortium Colleges
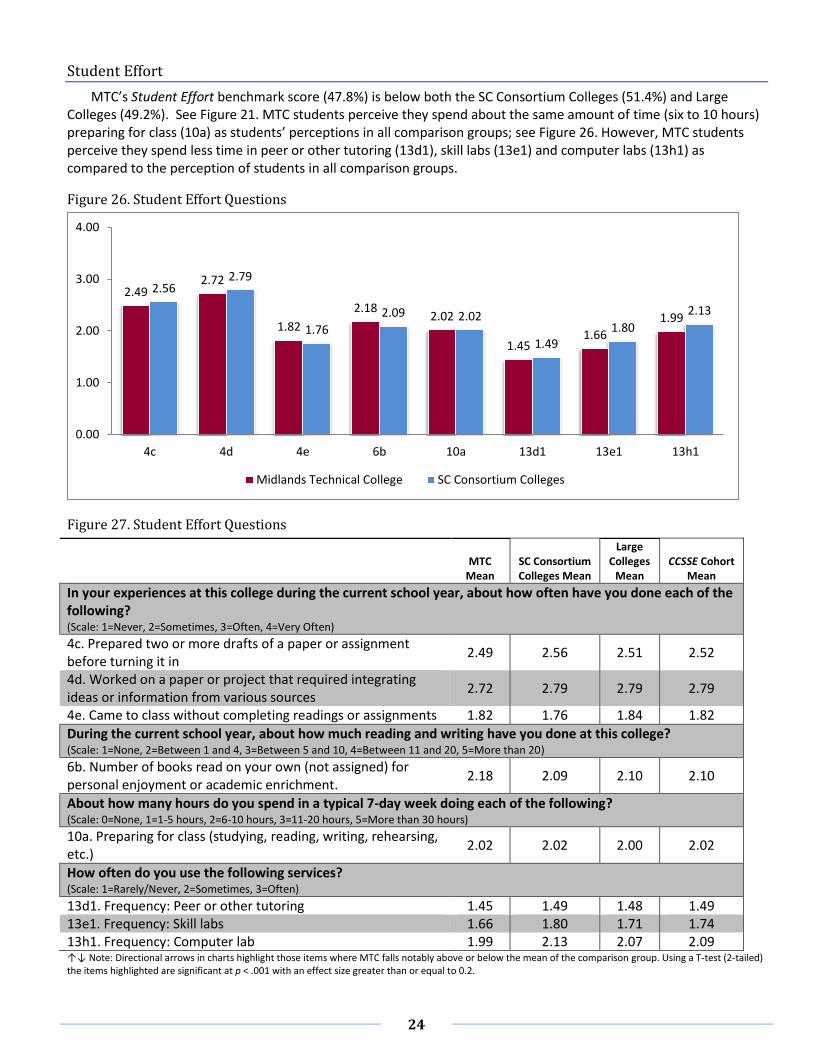
24
Student Effort
MTC’s Student Effort benchmark score (47.8%) is below both the SC Consortium Colleges (51.4%) and Large Colleges (49.2%). See Figure 21. MTC students perceive they spend about the same amount of time (six to 10 hours) preparing for class (10a) as students’ perceptions in all comparison groups; see Figure 26. However, MTC students perceive they spend less time in peer or other tutoring (13d1), skill labs (13e1) and computer labs (13h1) as compared to the perception of students in all comparison groups.
Figure 26. Student Effort Questions
Figure 27. Student Effort Questions
MTC
Mean SC Consortium Colleges Mean
Large Colleges
Mean CCSSE Cohort
Mean
In your experiences at this college during the current school year, about how often have you done each of the following? (Scale: 1=Never, 2=Sometimes, 3=Often, 4=Very Often)
4c. Prepared two or more drafts of a paper or assignment before turning it in
2.49 2.56 2.51 2.52
4d. Worked on a paper or project that required integrating ideas or information from various sources
2.72 2.79 2.79 2.79
4e. Came to class without completing readings or assignments 1.82 1.76 1.84 1.82
During the current school year, about how much reading and writing have you done at this college? (Scale: 1=None, 2=Between 1 and 4, 3=Between 5 and 10, 4=Between 11 and 20, 5=More than 20) 6b. Number of books read on your own (not assigned) for personal enjoyment or academic enrichment.
2.18 2.09 2.10 2.10
About how many hours do you spend in a typical 7-day week doing each of the following? (Scale: 0=None, 1=1-5 hours, 2=6-10 hours, 3=11-20 hours, 5=More than 30 hours) 10a. Preparing for class (studying, reading, writing, rehearsing, etc.)
2.02 2.02 2.00 2.02
How often do you use the following services? (Scale: 1=Rarely/Never, 2=Sometimes, 3=Often) 13d1. Frequency: Peer or other tutoring 1.45 1.49 1.48 1.49 13e1. Frequency: Skill labs 1.66 1.80 1.71 1.74 13h1. Frequency: Computer lab 1.99 2.13 2.07 2.09 ↑↓ Note: Directional arrows in charts highlight those items where MTC falls notably above or below the mean of the comparison group. Using a T-test (2-tailed) the items highlighted are significant at p < .001 with an effect size greater than or equal to 0.2.
2.492.72
1.82
2.182.02
1.451.66
1.99
2.562.79
1.76
2.09 2.02
1.491.80
2.13
0.00
1.00
2.00
3.00
4.00
4c 4d 4e 6b 10a 13d1 13e1 13h1
Midlands Technical College SC Consortium Colleges

25
Academic Challenge
MTC’s Academic Challenge benchmark score (51.8%) is below the SC Consortium Colleges (52.0%) and above the Large Colleges (49.6%). See Figure 21. MTC has continued to score above average on this benchmark, as well as the individual questions that make up the benchmark, since 2007. However, MTC students’ perceptions of their academic challenges are beginning to fall into line with the SC Consortium Colleges, see Figure 28.
Statistically significant differences:
MTC means are significantly higher for question 6c than SC Consortium Colleges.
Figure 28. Academic Challenge Questions
Figure 29. Academic Challenge Questions
MTC Mean
SC Consortium Colleges Mean
Large Colleges
Mean
CCSSE Cohort Mean
In your experiences at this college during the current school year, about how often have you done each of the following? (Scale: 1=Never, 2=Sometimes, 3=Often, 4=Very Often)
4p. Worked harder than you thought you could to meet an instructor’s standards or expectations
2.65 2.73 2.59 2.61
During the current school year, how much has your coursework at this college emphasized the following mental activities? (Scale: 1=Very Little, 2=Some, 3=Quite a bit, 4=Very much) 5b. Analyzing the basic elements of an idea, experience, or theory
2.94 2.94 2.91 2.90
5c. Synthesizing and organizing ideas, information, or experiences in new ways
2.77 2.82 2.77 2.78
5d. Making judgments about the value or soundness of information, arguments, or methods
2.63 2.64 2.61 2.61
5e. Applying theories or concepts to practical problems or in new ways
2.72 2.74 2.71 2.71
5f. Using information you have read or heard to perform a new skill
2.86 2.91 2.81 2.83
During the current school year, about how much reading and writing have you done at this college? (Scale: 1=None, 2=Between 1 and 4, 3=Between 5 and 10, 4=Between 11 and 20, 5=More than 20)
2.652.94 2.77
2.63 2.722.86
3.01 2.95
5.09
3.12
2.732.94 2.82
2.64 2.742.91 2.93
2.73↓
5.16
3.13
0.00
1.00
2.00
3.00
4.00
5.00
6.00
4p 5b 5c 5d 5e 5f 6a 6c 7 9a
Midlands Technical College SC Consortium Colleges
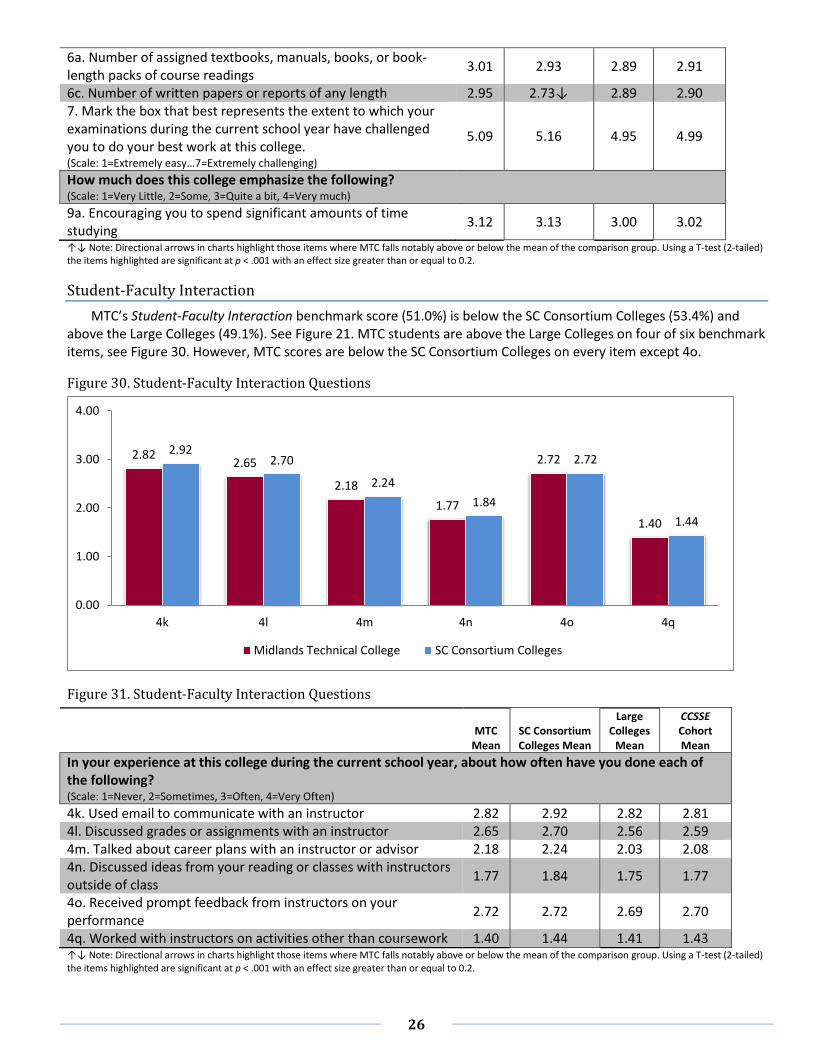
26
6a. Number of assigned textbooks, manuals, books, or book-length packs of course readings
3.01 2.93 2.89 2.91
6c. Number of written papers or reports of any length 2.95 2.73↓ 2.89 2.90 7. Mark the box that best represents the extent to which your examinations during the current school year have challenged you to do your best work at this college. (Scale: 1=Extremely easy…7=Extremely challenging)
5.09 5.16 4.95 4.99
How much does this college emphasize the following? (Scale: 1=Very Little, 2=Some, 3=Quite a bit, 4=Very much) 9a. Encouraging you to spend significant amounts of time studying
3.12 3.13 3.00 3.02
↑↓ Note: Directional arrows in charts highlight those items where MTC falls notably above or below the mean of the comparison group. Using a T-test (2-tailed) the items highlighted are significant at p < .001 with an effect size greater than or equal to 0.2.
Student-Faculty Interaction
MTC’s Student-Faculty Interaction benchmark score (51.0%) is below the SC Consortium Colleges (53.4%) and above the Large Colleges (49.1%). See Figure 21. MTC students are above the Large Colleges on four of six benchmark items, see Figure 30. However, MTC scores are below the SC Consortium Colleges on every item except 4o.
Figure 30. Student-Faculty Interaction Questions
Figure 31. Student-Faculty Interaction Questions
MTC
Mean SC Consortium Colleges Mean
Large Colleges
Mean
CCSSE Cohort Mean
In your experience at this college during the current school year, about how often have you done each of the following? (Scale: 1=Never, 2=Sometimes, 3=Often, 4=Very Often)
4k. Used email to communicate with an instructor 2.82 2.92 2.82 2.81 4l. Discussed grades or assignments with an instructor 2.65 2.70 2.56 2.59 4m. Talked about career plans with an instructor or advisor 2.18 2.24 2.03 2.08 4n. Discussed ideas from your reading or classes with instructors outside of class
1.77 1.84 1.75 1.77
4o. Received prompt feedback from instructors on your performance
2.72 2.72 2.69 2.70
4q. Worked with instructors on activities other than coursework 1.40 1.44 1.41 1.43 ↑↓ Note: Directional arrows in charts highlight those items where MTC falls notably above or below the mean of the comparison group. Using a T-test (2-tailed) the items highlighted are significant at p < .001 with an effect size greater than or equal to 0.2.
2.822.65
2.18
1.77
2.72
1.40
2.922.70
2.24
1.84
2.72
1.44
0.00
1.00
2.00
3.00
4.00
4k 4l 4m 4n 4o 4q
Midlands Technical College SC Consortium Colleges

27
Support for Learners
MTC’s Support for Learners benchmark score (48.2%) is below both the SC Consortium Colleges (52.5%) and the Large Colleges (48.8%). See Figure 21. MTC students perceive they use academic advising/planning (13a1) more often as compared to students’ perceptions from all comparison groups, see Figure 32. MTC means are below the SC Consortium Colleges on every benchmark item except 13a1.
Statistically significant differences:
MTC means are significantly lower for question 9e than SC Consortium Colleges.
Figure 32. Support for Learners Questions
Figure 33. Support for Learners Questions
MTC
Mean SC Consortium Colleges Mean
Large Colleges
Mean
CCSSE Cohort Mean
How much does this college emphasize each of the following? (Scale: 1=Very Little, 2=Some, 3=Quite a bit, 4=Very much)
9b. Providing the support you need to help you succeed at this college
2.90 3.02 2.97 3.00
9c. Encouraging contact among students from different economic, social, and racial or ethnic backgrounds
2.43 2.58 2.56 2.55
9d. Helping you cope with your non-academic responsibilities
1.88 1.98 1.95 1.97
9e. Providing the support you need to thrive socially 2.02 2.22↑ 2.16 2.19 9f. Providing the financial support you need to afford your education
2.64 2.80 2.50 2.56
How often do you use the following services? (Scale: 1=Rarely/Never, 2=Sometimes, 3=Often) 13a1. Frequency: Academic advising/planning 1.91 1.88 1.75 1.79 13b1. Frequency: Career counseling 1.39 1.43 1.42 1.44 ↑↓ Note: Directional arrows in charts highlight those items where MTC falls notably above or below the mean of the comparison group. Using a T-test (2-tailed) the items highlighted are significant at p < .001 with an effect size greater than or equal to 0.2.
2.90
2.43
1.882.02
2.64
1.91
1.39
3.02
2.58
1.982.22↑
2.80
1.88
1.43
0.00
1.00
2.00
3.00
4.00
9b 9c 9d 9e 9f 13a1 13b1
Midlands Technical College SC Consortium Colleges
28
Chapter 4 – Recommendations
Improvements in the area of student engagement are something that all colleges and universities should be
actively working toward. The CCSSE survey provides MTC with a survey instrument designed specifically to measure student engagement on a range of topics in the form of benchmark scores, means, and individual questions as well as comparisons over time and between different cohorts.
ARP believes that it is important to be able to present areas of concern as well as highlight specific topics that may need to be addressed in order to effect improvements. Of the three benchmarks that are below the 2012 CCSSE cohort 50% average (Active and Collaborative Learning, Student Effort, and Support for Learners), ARP recommends focusing on the following benchmark questions:
Active and Collaborative Learning
(4r) Discussed ideas from your readings or classes with others outside of class.
(4b) Made a class presentation.
(4f) Worked with other students on projects during class.
Student Effort
(13h1) Frequency: Computer lab.
(13e1) Frequency: Skill labs.
(4c) Prepared two or more drafts of a paper or assignment before turning it in.
Support for Learners
(9f) Providing the financial support you need to afford your education.
(9c) Encouraging contact among students from different economic, social, and racial or ethnic backgrounds.
(9d) Helping you cope with your non-academic responsibilities.
In addition to benchmark scores, ARP sees the need for further research into the differences among the demographic groups and their perceptions on engagement. For example, why are black students more engaged than white students, developmental students more engaged than non-developmental students, female students (to a lesser degree) more engaged than male students, and full-time students more engaged than part time students?
By reviewing the results of the CCSSE administrations from 2007 to 2012, MTC can gain deeper insight into students’ perceptions on engagement. By addressing specific areas of concern, MTC can begin to move the perception of engagement at MTC to be more in line or above similar cohorts such as Large College cohort or State Consortium. Increasing student engagement will enrich students’ academic experiences and provide them with a solid foundation for personal and professional success.

27
Appendices
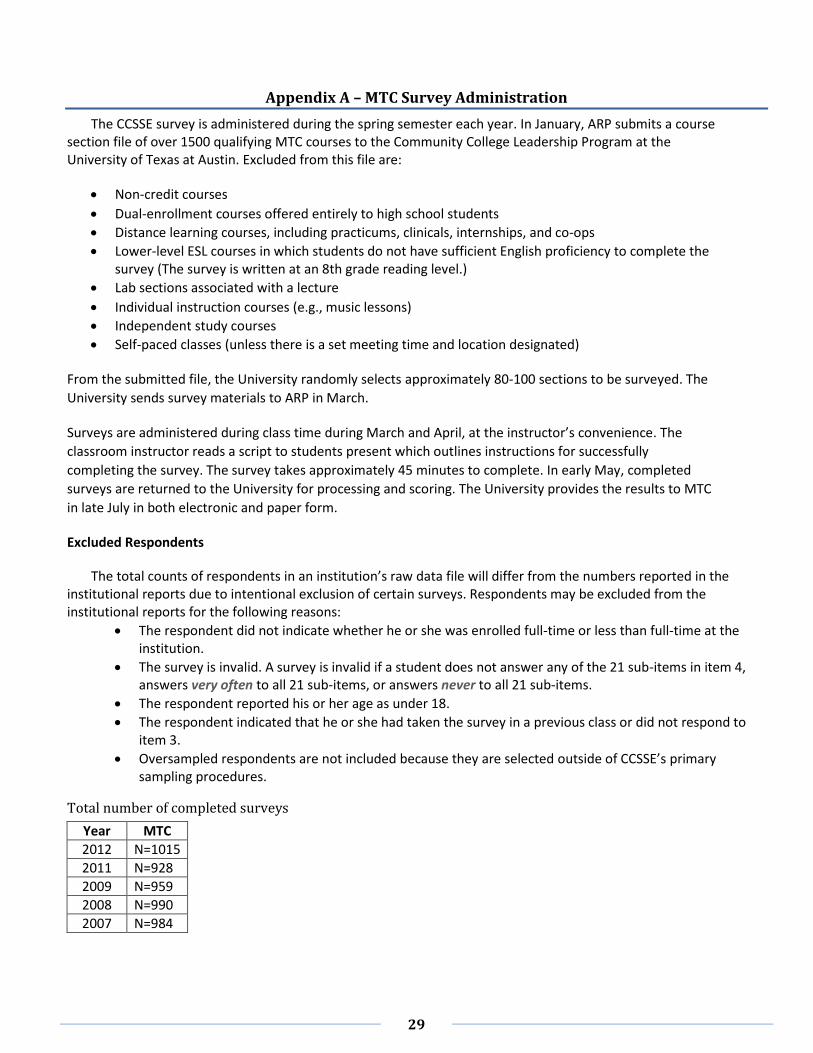
29
Appendix A – MTC Survey Administration
The CCSSE survey is administered during the spring semester each year. In January, ARP submits a course section file of over 1500 qualifying MTC courses to the Community College Leadership Program at the University of Texas at Austin. Excluded from this file are:
Non-credit courses
Dual-enrollment courses offered entirely to high school students
Distance learning courses, including practicums, clinicals, internships, and co-ops
Lower-level ESL courses in which students do not have sufficient English proficiency to complete the survey (The survey is written at an 8th grade reading level.)
Lab sections associated with a lecture
Individual instruction courses (e.g., music lessons)
Independent study courses
Self-paced classes (unless there is a set meeting time and location designated)
From the submitted file, the University randomly selects approximately 80-100 sections to be surveyed. The
University sends survey materials to ARP in March.
Surveys are administered during class time during March and April, at the instructor’s convenience. The
classroom instructor reads a script to students present which outlines instructions for successfully
completing the survey. The survey takes approximately 45 minutes to complete. In early May, completed
surveys are returned to the University for processing and scoring. The University provides the results to MTC
in late July in both electronic and paper form.
Excluded Respondents
The total counts of respondents in an institution’s raw data file will differ from the numbers reported in the institutional reports due to intentional exclusion of certain surveys. Respondents may be excluded from the institutional reports for the following reasons:
The respondent did not indicate whether he or she was enrolled full-time or less than full-time at the institution.
The survey is invalid. A survey is invalid if a student does not answer any of the 21 sub-items in item 4, answers very often to all 21 sub-items, or answers never to all 21 sub-items.
The respondent reported his or her age as under 18.
The respondent indicated that he or she had taken the survey in a previous class or did not respond to item 3.
Oversampled respondents are not included because they are selected outside of CCSSE’s primary sampling procedures.
Total number of completed surveys
Year MTC
2012 N=1015
2011 N=928
2009 N=959
2008 N=990
2007 N=984
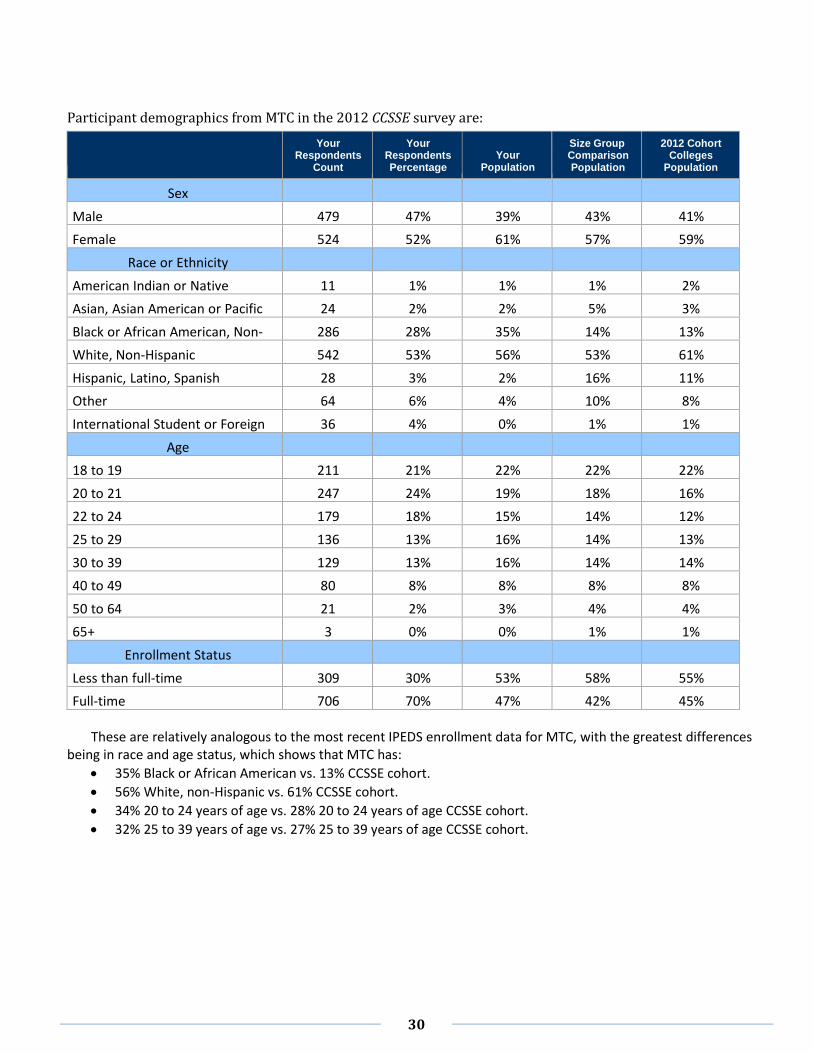
30
Participant demographics from MTC in the 2012 CCSSE survey are:
Your
Respondents
Count
Your
Respondents
Percentage
Your
Population
Size Group
Comparison
Population
2012 Cohort Colleges
Population
Sex
Male 479 47% 39%%
43% 41%
Female 524 52% 61% 57% 59%
Race or Ethnicity
American Indian or Native American
11 1% 1% 1% 2%
Asian, Asian American or Pacific Islander
24 2% 2% 5% 3%
Black or African American, Non-Hispanic
286 28% 35% 14% 13%
White, Non-Hispanic 542 53% 56% 53% 61%
Hispanic, Latino, Spanish 28 3% 2% 16% 11%
Other 64 6% 4% 10% 8%
International Student or Foreign National
36 4% 0% 1% 1%
Age
18 to 19 211 21% 22% 22% 22%
20 to 21 247 24% 19% 18% 16%
22 to 24 179 18% 15% 14% 12%
25 to 29 136 13% 16% 14% 13%
30 to 39 129 13% 16% 14% 14%
40 to 49 80 8% 8% 8% 8%
50 to 64 21 2% 3% 4% 4%
65+ 3 0% 0% 1% 1%
Enrollment Status
Less than full-time 309 30% 53% 58% 55%
Full-time 706 70% 47% 42% 45%
These are relatively analogous to the most recent IPEDS enrollment data for MTC, with the greatest differences being in race and age status, which shows that MTC has:
35% Black or African American vs. 13% CCSSE cohort.
56% White, non-Hispanic vs. 61% CCSSE cohort.
34% 20 to 24 years of age vs. 28% 20 to 24 years of age CCSSE cohort.
32% 25 to 39 years of age vs. 27% 25 to 39 years of age CCSSE cohort.
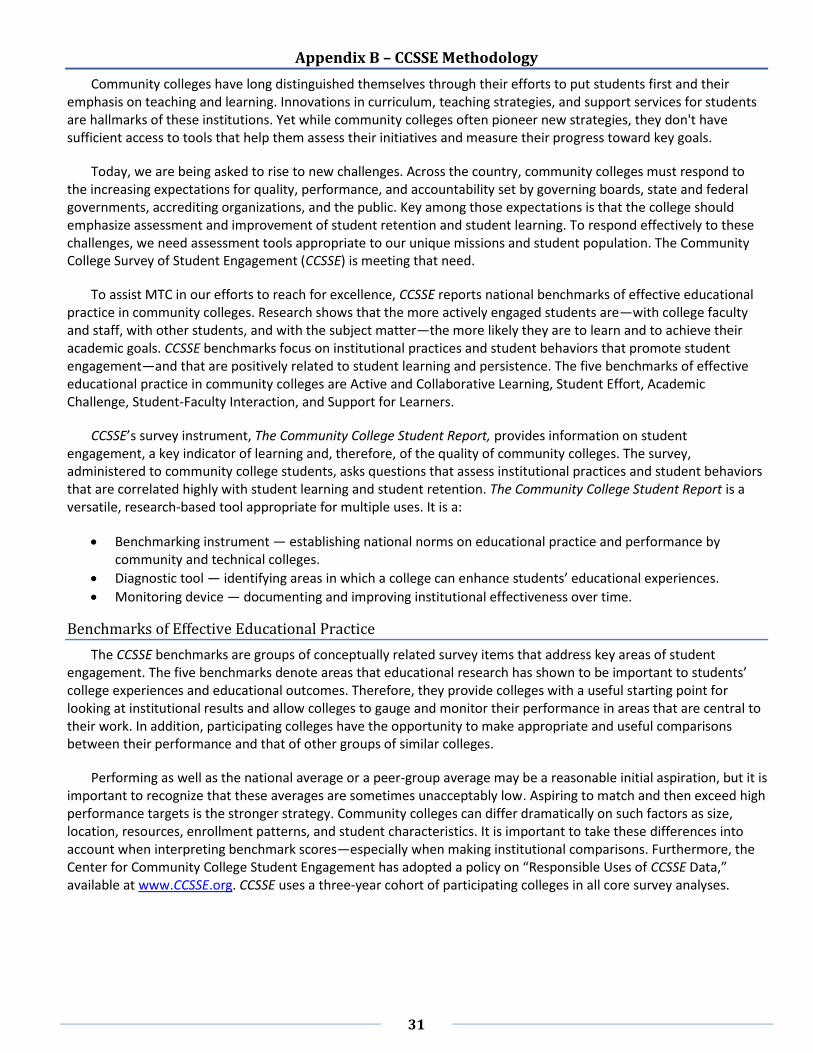
31
Appendix B – CCSSE Methodology
Community colleges have long distinguished themselves through their efforts to put students first and their emphasis on teaching and learning. Innovations in curriculum, teaching strategies, and support services for students are hallmarks of these institutions. Yet while community colleges often pioneer new strategies, they don't have sufficient access to tools that help them assess their initiatives and measure their progress toward key goals.
Today, we are being asked to rise to new challenges. Across the country, community colleges must respond to the increasing expectations for quality, performance, and accountability set by governing boards, state and federal governments, accrediting organizations, and the public. Key among those expectations is that the college should emphasize assessment and improvement of student retention and student learning. To respond effectively to these challenges, we need assessment tools appropriate to our unique missions and student population. The Community College Survey of Student Engagement (CCSSE) is meeting that need.
To assist MTC in our efforts to reach for excellence, CCSSE reports national benchmarks of effective educational practice in community colleges. Research shows that the more actively engaged students are—with college faculty and staff, with other students, and with the subject matter—the more likely they are to learn and to achieve their academic goals. CCSSE benchmarks focus on institutional practices and student behaviors that promote student engagement—and that are positively related to student learning and persistence. The five benchmarks of effective educational practice in community colleges are Active and Collaborative Learning, Student Effort, Academic Challenge, Student-Faculty Interaction, and Support for Learners.
CCSSE’s survey instrument, The Community College Student Report, provides information on student engagement, a key indicator of learning and, therefore, of the quality of community colleges. The survey, administered to community college students, asks questions that assess institutional practices and student behaviors that are correlated highly with student learning and student retention. The Community College Student Report is a versatile, research-based tool appropriate for multiple uses. It is a:
Benchmarking instrument — establishing national norms on educational practice and performance by community and technical colleges.
Diagnostic tool — identifying areas in which a college can enhance students’ educational experiences.
Monitoring device — documenting and improving institutional effectiveness over time.
Benchmarks of Effective Educational Practice
The CCSSE benchmarks are groups of conceptually related survey items that address key areas of student engagement. The five benchmarks denote areas that educational research has shown to be important to students’ college experiences and educational outcomes. Therefore, they provide colleges with a useful starting point for looking at institutional results and allow colleges to gauge and monitor their performance in areas that are central to their work. In addition, participating colleges have the opportunity to make appropriate and useful comparisons between their performance and that of other groups of similar colleges.
Performing as well as the national average or a peer-group average may be a reasonable initial aspiration, but it is important to recognize that these averages are sometimes unacceptably low. Aspiring to match and then exceed high performance targets is the stronger strategy. Community colleges can differ dramatically on such factors as size, location, resources, enrollment patterns, and student characteristics. It is important to take these differences into account when interpreting benchmark scores—especially when making institutional comparisons. Furthermore, the Center for Community College Student Engagement has adopted a policy on “Responsible Uses of CCSSE Data,” available at www.CCSSE.org. CCSSE uses a three-year cohort of participating colleges in all core survey analyses.
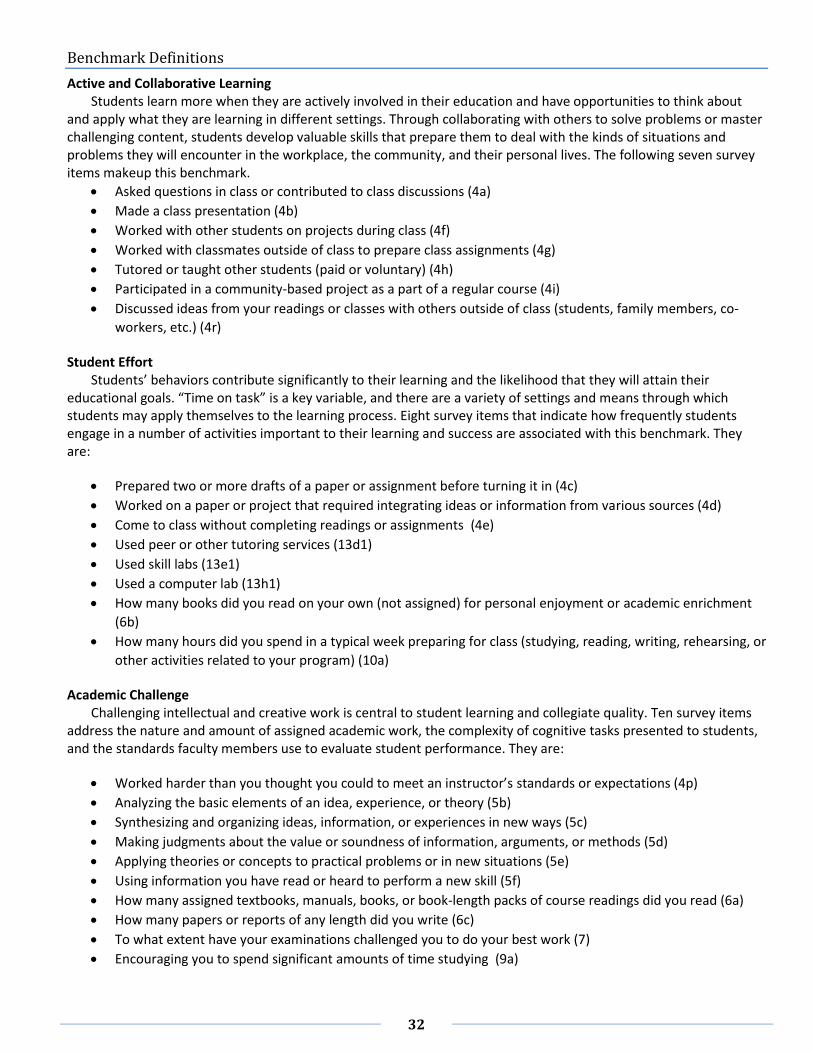
32
Benchmark Definitions
Active and Collaborative Learning Students learn more when they are actively involved in their education and have opportunities to think about
and apply what they are learning in different settings. Through collaborating with others to solve problems or master challenging content, students develop valuable skills that prepare them to deal with the kinds of situations and problems they will encounter in the workplace, the community, and their personal lives. The following seven survey items makeup this benchmark.
Asked questions in class or contributed to class discussions (4a)
Made a class presentation (4b)
Worked with other students on projects during class (4f)
Worked with classmates outside of class to prepare class assignments (4g)
Tutored or taught other students (paid or voluntary) (4h)
Participated in a community-based project as a part of a regular course (4i)
Discussed ideas from your readings or classes with others outside of class (students, family members, co-
workers, etc.) (4r)
Student Effort Students’ behaviors contribute significantly to their learning and the likelihood that they will attain their
educational goals. “Time on task” is a key variable, and there are a variety of settings and means through which students may apply themselves to the learning process. Eight survey items that indicate how frequently students engage in a number of activities important to their learning and success are associated with this benchmark. They are:
Prepared two or more drafts of a paper or assignment before turning it in (4c)
Worked on a paper or project that required integrating ideas or information from various sources (4d)
Come to class without completing readings or assignments (4e)
Used peer or other tutoring services (13d1)
Used skill labs (13e1)
Used a computer lab (13h1)
How many books did you read on your own (not assigned) for personal enjoyment or academic enrichment
(6b)
How many hours did you spend in a typical week preparing for class (studying, reading, writing, rehearsing, or
other activities related to your program) (10a)
Academic Challenge Challenging intellectual and creative work is central to student learning and collegiate quality. Ten survey items
address the nature and amount of assigned academic work, the complexity of cognitive tasks presented to students, and the standards faculty members use to evaluate student performance. They are:
Worked harder than you thought you could to meet an instructor’s standards or expectations (4p)
Analyzing the basic elements of an idea, experience, or theory (5b)
Synthesizing and organizing ideas, information, or experiences in new ways (5c)
Making judgments about the value or soundness of information, arguments, or methods (5d)
Applying theories or concepts to practical problems or in new situations (5e)
Using information you have read or heard to perform a new skill (5f)
How many assigned textbooks, manuals, books, or book-length packs of course readings did you read (6a)
How many papers or reports of any length did you write (6c)
To what extent have your examinations challenged you to do your best work (7)
Encouraging you to spend significant amounts of time studying (9a)

33
Student-Faculty Interaction In general, the more interaction students have with their teachers, the more likely they are to learn effectively
and persist toward achievement of their educational goals. Personal interaction with faculty members strengthens students’ connections to the college and helps them focus on their academic progress. Working with an instructor on a project or serving with faculty members on a college committee lets students see first-hand how experts identify and solve practical problems. Through such interactions, faculty members become role models, mentors, and guides for continuous, lifelong learning. The six items used in this benchmark are:
Used e-mail to communicate with an instructor (4k)
Discussed grades or assignments with an instructor (4l)
Talked about career plans with an instructor or advisor (4m)
Discussed ideas from your readings or classes with instructors outside of class (4n)
Received prompt feedback (written or oral) from instructors on your performance (4o)
Worked with instructors on activities other than coursework (4q)
Support for Learners Students perform better and are more satisfied at colleges that are committed to their success and cultivate
positive working and social relationships among different groups on campus. Community college students also benefit from services targeted to assist them with academic and career planning, academic skill development, and other areas that may affect learning and retention. The following seven survey items contribute to this benchmark:
Providing the support you need to help you succeed at this college (9b)
Encouraging contact among students from different economic, social, and racial or ethnic backgrounds (9c)
Helping you cope with your nonacademic responsibilities (work, family, etc.) (9d)
Providing the support you need to thrive socially (9e)
Providing the financial support you need to afford your education (9f)
Used academic advising/planning services (13a1)
Used career counseling services (13b1)
Benchmark Calculation & Weighting
Benchmark scores provide a useful way to look at an institution’s data by creating groups of conceptually related items that address key areas of student engagement. In order to create the benchmark scores, the survey items associated with each benchmark are first rescaled so that all items are on the same scale (0 to 1). Next, the benchmark scores are computed by averaging the scores of the related survey items. Finally, the scores are standardized around the mean of the three-year cohort so that respondents' scores have a mean of 50, weighted by full- and part-time attendance status, and a standard deviation of 25. Benchmark scores are then computed by averaging the scores on the associated items. Standardizing scores increases the value of the scores in the following two ways:
All of the benchmarks are on the same scale, enabling comparisons across benchmarks; and
The scores provide information about how an individual institution is doing relative to other institutions. Having scores on the same scale makes comparisons across benchmarks more meaningful than comparisons using raw scores.
Raw scores, however, are useful when analyzing longitudinal data from different groups within one population. In CCSSE sampling procedures, students are sampled at the classroom level. As a result, full-time students, who by definition are enrolled in more classes than part-time students, are more likely to be sampled. To adjust for this sampling bias, a statistical weighting procedure—based on the most recent publicly available IPEDS data—is applied to CCSSE results. This procedure accounts for the sampling bias when student groups contain both full- and part-time students. As an additional option, colleges can choose to produce reports via the CCSSE online reporting system with the statistical weighting procedure disabled if they feel it is appropriate.

34
Standards for Interpreting Mean Differences
When interpreting mean differences across comparison groups, CCSSE uses a combination of two measures: (1) a t-test with a very conservative alpha level of .001 or less is used to determine if the difference between two means is significant and not likely due to chance, and (2) an effect size of .20 (absolute value) or more using Cohen’s d is used to show the magnitude of difference between the two means. If a comparison is significant at an alpha level of .001 or less and has an effect size of .20 or greater, then it is considered to be a statistically significant difference worthy of further investigation. Comparisons that meet these criteria are marked with an asterisk (*). For internal analysis of small groups, it may make sense for colleges to use a larger alpha level but typically not a larger effect size.
Defining Developmental vs. Non-Developmental Students
There are three questions on the CCSSE survey that are used for categorizing MTC students as developmental or non-developmental. If a student responded that he or she had taken or planned to take any one or more of these three types of courses, development/remedial reading, writing or math (8c, 8d, 8e), he or she is classified as developmental; otherwise, he or she is classified as non-developmental.
Decile Reports
Deciles are percentile scores that divide the frequency of benchmark scores into ten equal groups. A percentile represents the point at or below which a specified percentage of the college benchmark scores fall. For example, the 60th percentile represents the point at or below which 60 percent of the college benchmark scores fall for the respective comparison group.
Summary Statistics
Data in this report will be presented in benchmark scores, means, benchmark differences, and percent changes:
Benchmark scores are those scores calculated by normalizing, standardizing, and weighting the results of the
specific questions that make up the benchmark questions. Benchmark scores are only used to compare MTC
benchmark scores to different cohorts’ benchmark scores within a given year.
Means are an average of all responses for a specific question or benchmark item. These analyses compare
average item responses for survey items that have scaled responses (e.g., strongly agree to strongly disagree)
between member colleges and various groups (e.g., similarly sized colleges), or between subgroups within a
college. Means also provide a t-test statistic and a visual indicator of whether these two means are
statistically significant and therefore may warrant further research.
Benchmark differences are the difference between MTC and a key comparison group. Differences are
calculated by subtracting the key comparison group’s benchmark score from MTC’s benchmark score. A
positive value of a difference score indicates that MTC scored higher than the comparison group, and a
negative value indicates that the comparison group scored higher than MTC.
Percent changes are presented in the raw data tables. Percent change scores show the percent increase or
decrease MTC saw compared to the 2007, the baseline year. A positive percent change indicates that MTC’s
benchmark scores improved compared to 2007, and a negative benchmark score indicates that MTC’s scores
decreased compared to the 2007 year.
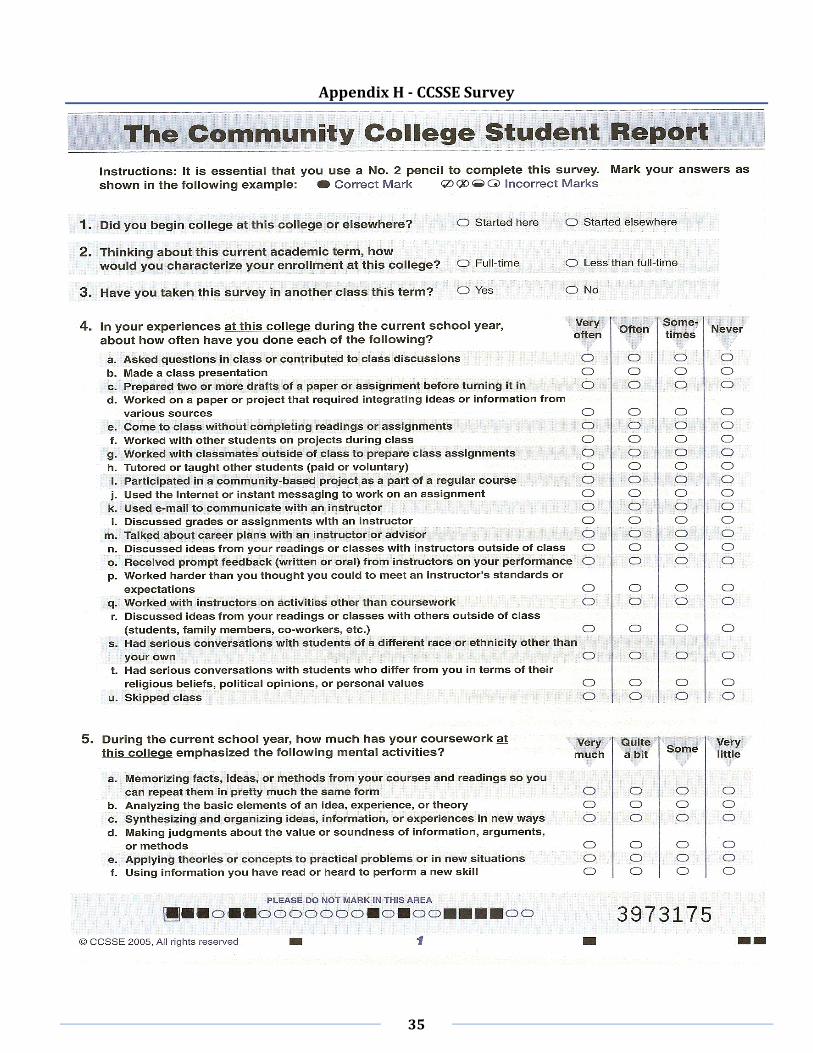
35
Appendix H - CCSSE Survey
36
37

38

39
40

41
42
43
Bibliography
Bain, K. "What makes a great teacher great?" The Chronicle of Higher Education, 50(31) (2004): B7-9. Burdge, J. R. and S. W. Daubenmire. "Raising success rates in freshman chemistry." Journal of College Science
Teaching. 30(5) (2001): 295-299. Carifio, J., I. Jackson and L. Dagostino. "Effects of diagnostic and prescriptive comments on the revising behaviors of
community college students." Community College Journal of Research & Practice. 25(2) (2001): 109-123. Hinkle, S. E. "The impact of e-mail use on student-faculty interaction." Journal of the Indiana Univesity Student
Personnel Association (2002): 27-34. Hynd, C., J. Holschuh and S. Nist. "Learning complex scientific information: Motivation theory and its relation to
student perceptions." Reading and Writing Quarterly, 16 (2000): 23-57. Jaasma, M. A. and R. J. Koper. "Out-of-class communication between female and male students and faculty: The
relationship to student perceptions of instructor immediacy." Women's Studies in Communication, 25(1) (2002): 119-137.
Kouyoumdjian, H. "Influence of unannounced quizzes and cumulative exam on attendance and study behavior." Teaching of Psychology. 31(2) (2004): 110-111.
Simmons, J. "Improving writing for college: The conditions to do it well." English Journal, 94(6) (2005): 75-80. Smith, H. M., A. Broughton and J. Copley. "Evaluating the written work of others: One way economics students can
learn to write." The Journal of Economics Education 36(1) (2005): 43-58. Strom, P. S. and R. D. Strom. "Overcoming limitations of cooperative learning among community college students."
Community College Journal of Research and Practice. 26(4) (2002): 315-331. Tauber, Robert T. "Good or bad, what teachers expect from students they generally get!" 1998. Tessier, J. "Using peer teaching to promote learning in biology." Journal of College Science. 36(6) (2004): 16-19.