community college survey of student engagement - 2016 ... · page 1 - 14jun16 community college...
TRANSCRIPT

page 1 - 14JUN16
Community College Survey of Student Engagement - 2016 Cohort2016 Frequency Distributions - Main Survey
Breakout by Sex[Weighted]
Males Females
Item Variable Responses Count Percent Count Percent
Item 1
1. Did you begin college at this college orelsewhere?
ENTER Started here 132,749 72.6 167,880 69.6
Started elsewhere 50,055 27.4 73,426 30.4
Total 182,804 100.0 241,305 100.0
Item 4: In your experiences at this college during the current school year, about how often have you done each of the following?
4a. Asked questions in class or contributedto class discussions [ACTCOLL]
CLQUEST Never 4,869 2.7 6,671 2.8
Sometimes 59,337 32.5 77,311 32.0
Often 68,718 37.6 81,536 33.8
Very often 49,854 27.3 75,936 31.4
Total 182,777 100.0 241,453 100.0
4b. Made a class presentation [ACTCOLL] CLPRESEN Never 46,985 25.8 64,121 26.7
Sometimes 77,196 42.4 95,029 39.5
Often 41,787 22.9 55,048 22.9
Very often 16,207 8.9 26,364 11.0
Total 182,176 100.0 240,563 100.0
4c. Prepared two or more drafts of a paperor assignment before turning it in [STUEFF]
REWROPAP Never 38,918 21.5 43,209 18.0
Sometimes 56,893 31.4 66,614 27.8
Often 54,679 30.2 71,711 29.9
Very often 30,682 16.9 58,212 24.3
Total 181,171 100.0 239,746 100.0
4d. Worked on a paper or project thatrequired integrating ideas or informationfrom various sources [STUEFF]
INTEGRAT Never 17,290 9.5 21,960 9.2
Sometimes 48,601 26.7 57,390 23.9
Often 71,415 39.3 86,436 36.0
Very often 44,486 24.5 74,055 30.9
Total 181,792 100.0 239,840 100.0
4e. Came to class without completingreadings or assignments [STUEFF]
CLUNPREP Never 54,321 29.9 89,212 37.3
Sometimes 98,395 54.2 122,310 51.1
Often 20,620 11.4 19,571 8.2
Very often 8,060 4.4 8,179 3.4
Total 181,396 100.0 239,272 100.0
4f. Worked with other students on projectsduring class [ACTCOLL]
CLASSGRP Never 20,439 11.3 28,944 12.1
Sometimes 68,157 37.6 88,932 37.2
Often 63,592 35.1 79,348 33.2
Very often 29,205 16.1 41,535 17.4
Total 181,392 100.0 238,759 100.0

page 2 - 14JUN16
Community College Survey of Student Engagement - 2016 Cohort2016 Frequency Distributions - Main Survey
Breakout by Sex[Weighted]
Males Females
Item Variable Responses Count Percent Count Percent
Item 4: In your experiences at this college during the current school year, about how often have you done each of the following?
4g. Worked with classmates outside of classto prepare class assignments [ACTCOLL]
OCCGRP Never 67,934 37.4 87,841 36.7
Sometimes 69,540 38.3 89,126 37.2
Often 31,594 17.4 42,117 17.6
Very often 12,698 7.0 20,526 8.6
Total 181,766 100.0 239,611 100.0
4h. Tutored or taught other students (paidor voluntary) [ACTCOLL]
TUTOR Never 124,774 68.5 180,347 75.1
Sometimes 39,015 21.4 41,997 17.5
Often 12,278 6.7 11,348 4.7
Very often 5,978 3.3 6,552 2.7
Total 182,045 100.0 240,245 100.0
4i. Participated in a community-basedproject as a part of a regular course[ACTCOLL]
COMMPROJ Never 133,180 73.4 179,660 75.2
Sometimes 33,477 18.5 41,020 17.2
Often 10,713 5.9 12,172 5.1
Very often 4,075 2.2 6,211 2.6
Total 181,445 100.0 239,064 100.0
4j. Used the Internet or instant messaging towork on an assignment
INTERNET Never 13,742 7.6 12,798 5.4
Sometimes 42,100 23.2 46,800 19.6
Often 58,629 32.3 68,203 28.5
Very often 66,898 36.9 111,376 46.6
Total 181,369 100.0 239,178 100.0
4k. Used e-mail to communicate with aninstructor [STUFAC]
EMAIL Never 15,210 8.4 10,404 4.3
Sometimes 59,498 32.8 57,831 24.1
Often 60,031 33.1 75,590 31.6
Very often 46,655 25.7 95,709 40.0
Total 181,394 100.0 239,534 100.0
4l. Discussed grades or assignments withan instructor [STUFAC]
FACGRADE Never 17,533 9.6 18,903 7.9
Sometimes 77,097 42.4 89,947 37.5
Often 58,184 32.0 73,494 30.7
Very often 28,967 15.9 57,405 23.9
Total 181,780 100.0 239,748 100.0
4m. Talked about career plans with aninstructor or advisor [STUFAC]
FACPLANS Never 48,610 26.8 58,967 24.6
Sometimes 79,273 43.7 101,449 42.4
Often 36,962 20.4 48,782 20.4
Very often 16,634 9.2 30,090 12.6
Total 181,479 100.0 239,288 100.0

page 3 - 14JUN16
Community College Survey of Student Engagement - 2016 Cohort2016 Frequency Distributions - Main Survey
Breakout by Sex[Weighted]
Males Females
Item Variable Responses Count Percent Count Percent
Item 4: In your experiences at this college during the current school year, about how often have you done each of the following?
4n. Discussed ideas from your readings orclasses with instructors outside of class[STUFAC]
FACIDEAS Never 75,267 41.5 108,258 45.3
Sometimes 69,435 38.3 86,580 36.2
Often 26,495 14.6 29,125 12.2
Very often 10,041 5.5 14,952 6.3
Total 181,238 100.0 238,916 100.0
4o. Received prompt feedback (written ororal) from instructors on your performance[STUFAC]
FACFEED Never 13,131 7.2 16,001 6.7
Sometimes 60,567 33.4 74,800 31.2
Often 73,944 40.8 91,127 38.0
Very often 33,736 18.6 57,571 24.0
Total 181,377 100.0 239,498 100.0
4p. Worked harder than you thought youcould to meet an instructor's standards orexpectations [ACCHALL]
WORKHARD Never 20,375 11.2 18,456 7.7
Sometimes 71,342 39.3 79,787 33.3
Often 63,503 35.0 88,503 37.0
Very often 26,455 14.6 52,767 22.0
Total 181,675 100.0 239,513 100.0
4q. Worked with instructors on activitiesother than coursework [STUFAC]
FACOTH Never 109,295 60.7 165,268 69.7
Sometimes 46,765 26.0 47,119 19.9
Often 17,604 9.8 16,846 7.1
Very often 6,493 3.6 7,821 3.3
Total 180,157 100.0 237,053 100.0
4r. Discussed ideas from your readings orclasses with others outside of class(students, family members, co-workers, etc.)[ACTCOLL]
OOCIDEAS Never 28,708 15.8 29,849 12.4
Sometimes 72,632 39.9 85,635 35.7
Often 52,839 29.0 70,248 29.2
Very often 27,851 15.3 54,454 22.7
Total 182,030 100.0 240,186 100.0
4s. Had serious conversations with studentsof a different race or ethnicity other thanyour own
DIVRSTUD Never 39,393 21.7 54,761 22.8
Sometimes 56,568 31.1 74,822 31.2
Often 46,767 25.7 56,035 23.3
Very often 38,931 21.4 54,463 22.7
Total 181,658 100.0 240,081 100.0
4t. Had serious conversations with studentswho differ from you in terms of their religiousbeliefs, political opinions, or personal values
DIFFSTUD Never 43,046 23.7 61,084 25.5
Sometimes 60,517 33.3 78,936 32.9
Often 44,671 24.6 53,423 22.3
Very often 33,296 18.3 46,421 19.4
Total 181,530 100.0 239,863 100.0

page 4 - 14JUN16
Community College Survey of Student Engagement - 2016 Cohort2016 Frequency Distributions - Main Survey
Breakout by Sex[Weighted]
Males Females
Item Variable Responses Count Percent Count Percent
Item 4: In your experiences at this college during the current school year, about how often have you done each of the following?
4u. Skipped class SKIPCLAS Never 91,376 50.2 133,176 55.4
Sometimes 77,917 42.8 96,100 39.9
Often 8,934 4.9 8,025 3.3
Very often 3,901 2.1 3,304 1.4
Total 182,128 100.0 240,604 100.0
Item 5: During the current school year, how much has your coursework at this college emphasized the following mental activities?
5a. Memorizing facts, ideas, or methodsfrom your courses and readings so you canrepeat them in pretty much the same form
MEMORIZE Very little 10,754 5.9 16,491 6.8
Some 51,612 28.3 62,241 25.8
Quite a bit 76,398 41.8 88,614 36.8
Very much 43,793 24.0 73,724 30.6
Total 182,557 100.0 241,069 100.0
5b. Analyzing the basic elements of an idea,experience, or theory [ACCHALL]
ANALYZE Very little 7,221 4.0 10,666 4.4
Some 46,787 25.7 59,769 24.9
Quite a bit 82,798 45.5 99,180 41.3
Very much 45,175 24.8 70,737 29.4
Total 181,981 100.0 240,351 100.0
5c. Synthesizing and organizing ideas,information, or experiences in new ways[ACCHALL]
SYNTHESZ Very little 12,723 7.0 14,328 6.0
Some 59,805 33.0 66,973 28.0
Quite a bit 71,654 39.6 92,828 38.8
Very much 36,852 20.4 65,348 27.3
Total 181,035 100.0 239,476 100.0
5d. Making judgments about the value orsoundness of information, arguments, ormethods [ACCHALL]
EVALUATE Very little 19,265 10.6 28,814 12.0
Some 62,338 34.4 77,207 32.2
Quite a bit 65,653 36.2 81,014 33.8
Very much 34,223 18.9 52,605 22.0
Total 181,479 100.0 239,640 100.0
5e. Applying theories or concepts topractical problems or in new situations[ACCHALL]
APPLYING Very little 16,438 9.0 21,749 9.1
Some 58,766 32.3 72,092 30.0
Quite a bit 67,804 37.3 84,416 35.2
Very much 38,802 21.3 61,810 25.7
Total 181,810 100.0 240,067 100.0
5f. Using information you have read orheard to perform a new skill [ACCHALL]
PERFORM Very little 14,849 8.1 17,686 7.3
Some 51,259 28.1 61,558 25.5
Quite a bit 68,404 37.5 85,262 35.4
Very much 47,886 26.3 76,427 31.7
Total 182,398 100.0 240,932 100.0

page 5 - 14JUN16
Community College Survey of Student Engagement - 2016 Cohort2016 Frequency Distributions - Main Survey
Breakout by Sex[Weighted]
Males Females
Item Variable Responses Count Percent Count Percent
Item 6: During the current school year, about how much reading and writing have you done at this college?
6a. Number of assigned textbooks, manuals,books, or book-length packs of coursereadings [ACCHALL]
READASGN None 7,004 3.9 6,396 2.7
1 to 4 81,235 45.0 93,811 39.3
5 to 10 54,753 30.3 69,683 29.2
11 to 20 23,246 12.9 36,515 15.3
More than 20 14,419 8.0 32,183 13.5
Total 180,657 100.0 238,587 100.0
6b. Number of books read on your own (notassigned) for personal enjoyment oracademic enrichment [STUEFF]
READOWN None 63,588 35.2 73,055 30.6
1 to 4 81,202 45.0 110,120 46.2
5 to 10 22,359 12.4 31,049 13.0
11 to 20 7,414 4.1 12,236 5.1
More than 20 6,021 3.3 12,140 5.1
Total 180,584 100.0 238,600 100.0
6c. Number of written papers or reports ofany length [ACCHALL]
WRITEANY None 18,832 10.4 20,185 8.5
1 to 4 55,537 30.8 74,385 31.2
5 to 10 58,059 32.2 75,842 31.8
11 to 20 31,451 17.4 43,187 18.1
More than 20 16,555 9.2 24,832 10.4
Total 180,434 100.0 238,431 100.0
Item 7
7. Mark the response that best representsthe extent to which your examinations duringthe current school year have challengedyou to do your best work at this college[ACCHALL]
EXAMS (1) Extremely easy 2,300 1.3 1,602 0.7
(2) 4,785 2.7 3,242 1.4
(3) 13,700 7.9 10,668 4.6
(4) 47,509 27.3 53,073 23.1
(5) 60,999 35.0 76,980 33.5
(6) 33,108 19.0 56,049 24.4
(7) Extremely challenging 11,812 6.8 27,959 12.2
Total 174,211 100.0 229,572 100.0
Item 8: Which of the following have you done, are you doing, or do you plan to do while attending this college?
8a. Internship, field experience, co-opexperience, or clinical assignment
INTERN I have not done nor plan to do 74,011 41.2 83,254 35.1
I plan to do 79,019 44.0 112,607 47.5
I have done 26,411 14.7 41,116 17.4
Total 179,441 100.0 236,977 100.0
8b. English as a second language course ESL I have not done nor plan to do 149,987 83.5 198,475 83.7
I plan to do 11,375 6.3 12,223 5.2
I have done 18,166 10.1 26,429 11.1
Total 179,529 100.0 237,127 100.0

page 6 - 14JUN16
Community College Survey of Student Engagement - 2016 Cohort2016 Frequency Distributions - Main Survey
Breakout by Sex[Weighted]
Males Females
Item Variable Responses Count Percent Count Percent
Item 8: Which of the following have you done, are you doing, or do you plan to do while attending this college?
8c. Developmental/remedial reading course DEVREAD I have not done nor plan to do 131,810 73.5 168,547 71.0
I plan to do 17,732 9.9 20,182 8.5
I have done 29,835 16.6 48,525 20.5
Total 179,377 100.0 237,254 100.0
8d. Developmental/remedial writing course DEVWRITE I have not done nor plan to do 122,163 68.0 155,317 65.5
I plan to do 20,551 11.4 24,249 10.2
I have done 36,841 20.5 57,681 24.3
Total 179,555 100.0 237,247 100.0
8e. Developmental/remedial math course DEVMATH I have not done nor plan to do 103,973 58.0 123,352 52.1
I plan to do 26,906 15.0 32,420 13.7
I have done 48,470 27.0 80,912 34.2
Total 179,349 100.0 236,684 100.0
8f. Study skills course STUDSKIL I have not done nor plan to do 114,075 63.7 146,626 62.0
I plan to do 36,791 20.5 47,047 19.9
I have done 28,222 15.8 42,812 18.1
Total 179,089 100.0 236,485 100.0
8g. Honors course HONORS I have not done nor plan to do 126,030 70.6 165,316 70.1
I plan to do 41,975 23.5 56,581 24.0
I have done 10,503 5.9 13,813 5.9
Total 178,509 100.0 235,710 100.0
8h. College orientation program or course ORIEN I have not done nor plan to do 100,159 55.9 121,651 51.4
I plan to do 25,591 14.3 30,908 13.1
I have done 53,361 29.8 84,013 35.5
Total 179,111 100.0 236,572 100.0
8i. Organized learning communities (linkedcourses/study groups led by faculty orcounselors)
LRNCOMM I have not done nor plan to do 127,136 70.8 158,271 66.7
I plan to do 35,326 19.7 50,498 21.3
I have done 17,031 9.5 28,552 12.0
Total 179,493 100.0 237,321 100.0
Item 9: How much does this college emphasize each of the following?
9a. Encouraging you to spend significantamounts of time studying [ACCHALL]
ENVSCHOL Very little 7,722 4.3 7,768 3.3
Some 42,769 23.7 43,745 18.3
Quite a bit 80,525 44.6 94,822 39.7
Very much 49,667 27.5 92,338 38.7
Total 180,684 100.0 238,673 100.0

page 7 - 14JUN16
Community College Survey of Student Engagement - 2016 Cohort2016 Frequency Distributions - Main Survey
Breakout by Sex[Weighted]
Males Females
Item Variable Responses Count Percent Count Percent
Item 9: How much does this college emphasize each of the following?
9b. Providing the support you need to helpyou succeed at this college [SUPPORT]
ENVSUPRT Very little 7,899 4.4 10,816 4.5
Some 37,928 21.0 48,109 20.2
Quite a bit 76,883 42.6 89,682 37.6
Very much 57,585 31.9 89,749 37.7
Total 180,296 100.0 238,355 100.0
9c. Encouraging contact among studentsfrom different economic, social, and racial orethnic backgrounds [SUPPORT]
ENVDIVRS Very little 29,060 16.2 36,549 15.4
Some 55,817 31.1 67,745 28.5
Quite a bit 55,805 31.1 69,903 29.4
Very much 39,037 21.7 63,510 26.7
Total 179,719 100.0 237,707 100.0
9d. Helping you cope with yournon-academic responsibilities (work, family,etc.) [SUPPORT]
ENVNACAD Very little 63,746 35.4 89,518 37.7
Some 62,550 34.8 76,080 32.0
Quite a bit 35,331 19.6 42,562 17.9
Very much 18,201 10.1 29,596 12.4
Total 179,828 100.0 237,757 100.0
9e. Providing the support you need to thrivesocially [SUPPORT]
ENVSOCAL Very little 43,701 24.4 60,685 25.6
Some 69,158 38.6 86,402 36.5
Quite a bit 45,405 25.3 55,087 23.3
Very much 20,869 11.6 34,556 14.6
Total 179,133 100.0 236,731 100.0
9f. Providing the financial support you needto afford your education [SUPPORT]
FINSUPP Very little 38,142 21.3 48,995 20.6
Some 49,792 27.7 59,668 25.1
Quite a bit 50,595 28.2 60,576 25.5
Very much 40,934 22.8 68,117 28.7
Total 179,464 100.0 237,356 100.0
9g. Using computers in academic work ENVCOMP Very little 9,237 5.1 10,016 4.2
Some 30,829 17.1 33,232 13.9
Quite a bit 61,633 34.2 70,031 29.4
Very much 78,621 43.6 125,045 52.5
Total 180,320 100.0 238,325 100.0
Item 10: About how many hours do you spend in a typical 7-day week doing each of the following?
10a. Preparing for class (studying, reading,writing, rehearsing, doing homework, orother activites related to your program)[STUEFF]
ACADPR01 None 4,505 2.5 1,920 0.8
1-5 hours 78,976 43.8 86,541 36.3
6-10 hours 54,174 30.0 72,580 30.4
11-20 hours 29,028 16.1 47,853 20.1
21-30 hours 8,868 4.9 19,098 8.0
More than 30 hours 4,859 2.7 10,482 4.4
Total 180,409 100.0 238,473 100.0

page 8 - 14JUN16
Community College Survey of Student Engagement - 2016 Cohort2016 Frequency Distributions - Main Survey
Breakout by Sex[Weighted]
Males Females
Item Variable Responses Count Percent Count Percent
Item 10: About how many hours do you spend in a typical 7-day week doing each of the following?
10b. Working for pay PAYWORK None 42,778 23.8 57,162 24.1
1-5 hours 12,539 7.0 14,251 6.0
6-10 hours 12,627 7.0 16,707 7.0
11-20 hours 23,838 13.3 32,727 13.8
21-30 hours 32,339 18.0 46,264 19.5
More than 30 hours 55,701 31.0 70,555 29.7
Total 179,822 100.0 237,666 100.0
10c. Participating in college-sponsoredactivities (organizations, campuspublications, student government,intercollegiate or intramural sports, etc.)
COCURR01 None 137,829 76.5 193,949 81.6
1-5 hours 27,566 15.3 31,744 13.3
6-10 hours 7,588 4.2 6,073 2.6
11-20 hours 3,915 2.2 3,182 1.3
21-30 hours 1,536 0.9 1,429 0.6
More than 30 hours 1,702 0.9 1,413 0.6
Total 180,135 100.0 237,788 100.0
10d. Providing care for dependents livingwith you (parents, children, spouse, etc.)
CAREDE01 None 95,322 53.0 94,910 40.0
1-5 hours 32,665 18.2 37,511 15.8
6-10 hours 15,740 8.8 19,123 8.1
11-20 hours 10,582 5.9 14,575 6.1
21-30 hours 5,662 3.1 10,094 4.3
More than 30 hours 19,828 11.0 61,172 25.8
Total 179,799 100.0 237,384 100.0
10e. Commuting to and from classes COMMUTE None 15,186 8.4 15,656 6.6
1-5 hours 121,622 67.5 159,170 66.9
6-10 hours 28,364 15.7 39,089 16.4
11-20 hours 9,141 5.1 13,415 5.6
21-30 hours 2,550 1.4 4,361 1.8
More than 30 hours 3,264 1.8 6,155 2.6
Total 180,126 100.0 237,846 100.0
Item 11: Mark the number that best represents the quality of your relationships with people at this college.
11a. Other students ENVSTU (1) Unfriendly, unsupportive, sense ofalienation
2,489 1.4 2,257 0.9
(2) 4,543 2.5 5,440 2.3
(3) 8,745 4.8 11,940 5.0
(4) 30,266 16.8 37,261 15.6
(5) 41,293 22.9 49,672 20.8
(6) 49,491 27.4 60,488 25.3
(7) Friendly, supportive, sense of belonging 43,686 24.2 71,556 30.0
Total 180,513 100.0 238,614 100.0

page 9 - 14JUN16
Community College Survey of Student Engagement - 2016 Cohort2016 Frequency Distributions - Main Survey
Breakout by Sex[Weighted]
Males Females
Item Variable Responses Count Percent Count Percent
Item 11: Mark the number that best represents the quality of your relationships with people at this college.
11b. Instructors ENVFAC (1) Unavailable, unhelpful, unsympathetic 1,333 0.7 1,450 0.6
(2) 2,518 1.4 3,494 1.5
(3) 6,017 3.3 8,623 3.6
(4) 20,164 11.2 26,534 11.1
(5) 36,668 20.3 46,045 19.3
(6) 58,563 32.4 70,400 29.5
(7) Available, helpful, sympathetic 55,277 30.6 82,141 34.4
Total 180,540 100.0 238,687 100.0
11c. Administrative personnel and offices ENVADM (1) Unhelpful, inconsiderate, rigid 5,871 3.3 7,237 3.0
(2) 7,636 4.2 11,002 4.6
(3) 12,783 7.1 19,155 8.0
(4) 34,876 19.3 42,421 17.8
(5) 39,227 21.8 48,790 20.5
(6) 41,779 23.2 52,822 22.2
(7) Helpful, considerate, flexible 38,077 21.1 56,932 23.9
Total 180,250 100.0 238,360 100.0
Item 12: How much has your experience at this college contributed to your knowledge, skills, and personal development in the following areas?
12a. Acquiring a broad general education GNGENLED Very little 9,730 5.4 12,458 5.2
Some 41,793 23.2 46,766 19.7
Quite a bit 75,648 42.0 94,120 39.6
Very much 53,128 29.5 84,517 35.5
Total 180,300 100.0 237,861 100.0
12b. Acquiring job or work-relatedknowledge and skills
GNWORK Very little 32,709 18.2 39,839 16.8
Some 54,040 30.0 66,024 27.8
Quite a bit 54,546 30.3 70,563 29.7
Very much 38,685 21.5 61,159 25.7
Total 179,980 100.0 237,585 100.0
12c. Writing clearly and effectively GNWRITE Very little 19,167 10.6 20,534 8.6
Some 52,937 29.4 57,422 24.1
Quite a bit 68,500 38.1 89,521 37.6
Very much 39,391 21.9 70,349 29.6
Total 179,995 100.0 237,826 100.0
12d. Speaking clearly and effectively GNSPEAK Very little 23,670 13.2 25,777 10.8
Some 54,262 30.2 60,245 25.3
Quite a bit 64,094 35.6 85,062 35.8
Very much 37,901 21.1 66,591 28.0
Total 179,928 100.0 237,676 100.0
page 10 - 14JUN16
Community College Survey of Student Engagement - 2016 Cohort2016 Frequency Distributions - Main Survey
Breakout by Sex[Weighted]
Males Females
Item Variable Responses Count Percent Count Percent
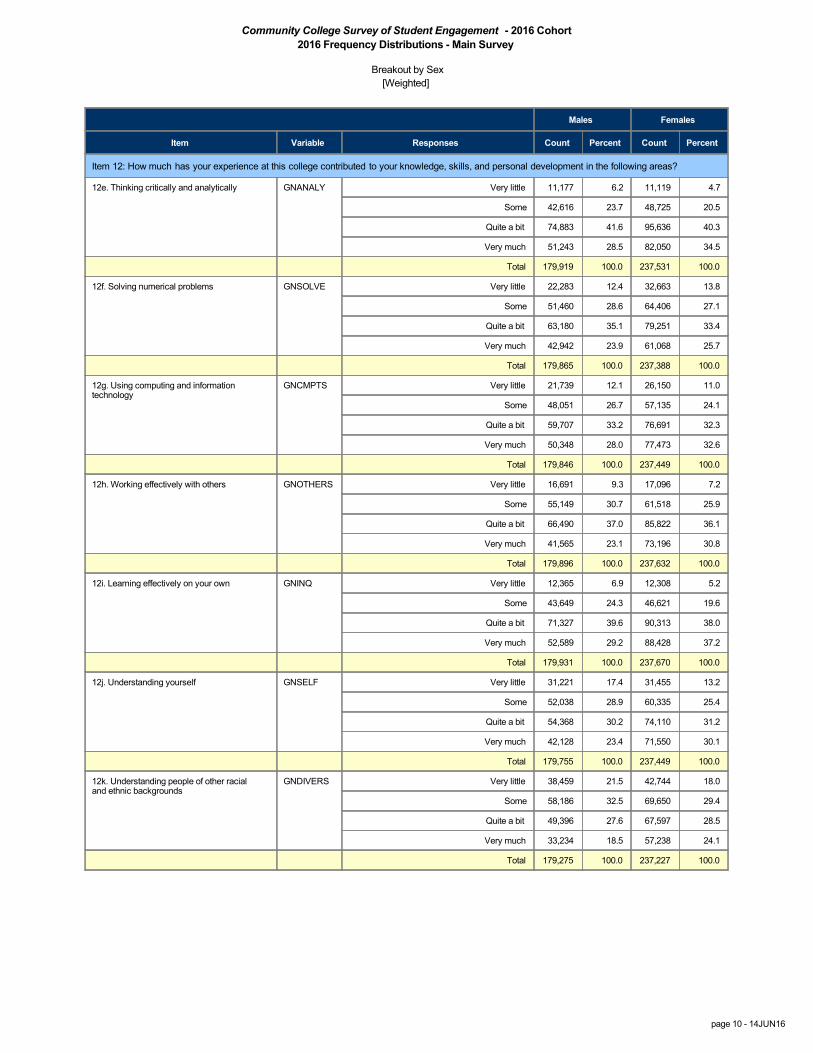
Item 12: How much has your experience at this college contributed to your knowledge, skills, and personal development in the following areas?
12e. Thinking critically and analytically GNANALY Very little 11,177 6.2 11,119 4.7
Some 42,616 23.7 48,725 20.5
Quite a bit 74,883 41.6 95,636 40.3
Very much 51,243 28.5 82,050 34.5
Total 179,919 100.0 237,531 100.0
12f. Solving numerical problems GNSOLVE Very little 22,283 12.4 32,663 13.8
Some 51,460 28.6 64,406 27.1
Quite a bit 63,180 35.1 79,251 33.4
Very much 42,942 23.9 61,068 25.7
Total 179,865 100.0 237,388 100.0
12g. Using computing and informationtechnology
GNCMPTS Very little 21,739 12.1 26,150 11.0
Some 48,051 26.7 57,135 24.1
Quite a bit 59,707 33.2 76,691 32.3
Very much 50,348 28.0 77,473 32.6
Total 179,846 100.0 237,449 100.0
12h. Working effectively with others GNOTHERS Very little 16,691 9.3 17,096 7.2
Some 55,149 30.7 61,518 25.9
Quite a bit 66,490 37.0 85,822 36.1
Very much 41,565 23.1 73,196 30.8
Total 179,896 100.0 237,632 100.0
12i. Learning effectively on your own GNINQ Very little 12,365 6.9 12,308 5.2
Some 43,649 24.3 46,621 19.6
Quite a bit 71,327 39.6 90,313 38.0
Very much 52,589 29.2 88,428 37.2
Total 179,931 100.0 237,670 100.0
12j. Understanding yourself GNSELF Very little 31,221 17.4 31,455 13.2
Some 52,038 28.9 60,335 25.4
Quite a bit 54,368 30.2 74,110 31.2
Very much 42,128 23.4 71,550 30.1
Total 179,755 100.0 237,449 100.0
12k. Understanding people of other racialand ethnic backgrounds
GNDIVERS Very little 38,459 21.5 42,744 18.0
Some 58,186 32.5 69,650 29.4
Quite a bit 49,396 27.6 67,597 28.5
Very much 33,234 18.5 57,238 24.1
Total 179,275 100.0 237,227 100.0

page 11 - 14JUN16
Community College Survey of Student Engagement - 2016 Cohort2016 Frequency Distributions - Main Survey
Breakout by Sex[Weighted]
Males Females
Item Variable Responses Count Percent Count Percent
Item 12: How much has your experience at this college contributed to your knowledge, skills, and personal development in the following areas?
12l. Developing a personal code of valuesand ethics
GNETHICS Very little 39,879 22.2 43,006 18.1
Some 57,823 32.2 69,603 29.3
Quite a bit 49,531 27.6 68,288 28.8
Very much 32,285 18.0 56,311 23.7
Total 179,518 100.0 237,208 100.0
12m. Contributing to the welfare of yourcommunity
GNCOMMUN Very little 63,120 35.2 75,213 31.8
Some 62,780 35.0 80,758 34.1
Quite a bit 34,337 19.2 48,165 20.3
Very much 19,057 10.6 32,685 13.8
Total 179,294 100.0 236,820 100.0
12n. Developing clearer career goals CARGOAL Very little 25,403 14.1 28,509 12.0
Some 50,389 28.0 57,533 24.2
Quite a bit 59,637 33.2 75,217 31.7
Very much 44,378 24.7 76,330 32.1
Total 179,807 100.0 237,589 100.0
12o. Gaining information about careeropportunities
GAINCAR Very little 30,330 16.8 40,139 16.9
Some 52,978 29.4 63,246 26.6
Quite a bit 55,169 30.6 67,718 28.5
Very much 41,623 23.1 66,836 28.1
Total 180,100 100.0 237,940 100.0
Item 13.1: How often do you use the following services at this college?
13.1a. Academic advising/planning[SUPPORT]
USEACAD Don't know/N.A. 14,263 8.0 14,213 6.0
Rarely/Never 60,419 33.9 69,163 29.3
Sometimes 79,542 44.7 107,635 45.6
Often 23,765 13.4 44,976 19.1
Total 177,989 100.0 235,986 100.0
13.1b. Career counseling [SUPPORT] USECACOU Don't know/N.A. 35,982 20.3 46,029 19.6
Rarely/Never 89,319 50.4 117,777 50.1
Sometimes 40,981 23.1 54,144 23.0
Often 10,876 6.1 17,174 7.3
Total 177,158 100.0 235,123 100.0
13.1c. Job placement assistance USEJOBPL Don't know/N.A. 64,741 36.8 95,219 40.8
Rarely/Never 83,840 47.7 113,224 48.5
Sometimes 20,599 11.7 18,728 8.0
Often 6,679 3.8 6,358 2.7
Total 175,859 100.0 233,528 100.0

page 12 - 14JUN16
Community College Survey of Student Engagement - 2016 Cohort2016 Frequency Distributions - Main Survey
Breakout by Sex[Weighted]
Males Females
Item Variable Responses Count Percent Count Percent
Item 13.1: How often do you use the following services at this college?
13.1d. Peer or other tutoring [STUEFF] USETUTOR Don't know/N.A. 41,910 23.8 50,879 21.8
Rarely/Never 82,418 46.9 105,200 45.1
Sometimes 36,965 21.0 52,055 22.3
Often 14,609 8.3 25,065 10.7
Total 175,902 100.0 233,199 100.0
13.1e. Skill labs (writing, math, etc.)[STUEFF]
USELAB Don't know/N.A. 35,862 20.4 46,911 20.1
Rarely/Never 66,812 38.1 84,662 36.4
Sometimes 45,840 26.1 57,804 24.8
Often 26,969 15.4 43,446 18.7
Total 175,484 100.0 232,823 100.0
13.1f. Child care USECHLD Don't know/N.A. 97,657 55.6 128,405 55.1
Rarely/Never 67,732 38.6 92,454 39.7
Sometimes 7,021 4.0 5,701 2.4
Often 3,244 1.8 6,526 2.8
Total 175,653 100.0 233,087 100.0
13.1g. Financial aid advising USEFAADV Don't know/N.A. 36,077 20.5 36,488 15.6
Rarely/Never 60,492 34.4 67,423 28.9
Sometimes 53,726 30.6 77,113 33.1
Often 25,464 14.5 52,226 22.4
Total 175,758 100.0 233,249 100.0
13.1h. Computer lab [STUEFF] USECOMLB Don't know/N.A. 23,576 13.4 28,711 12.3
Rarely/Never 48,354 27.5 59,683 25.6
Sometimes 56,192 32.0 70,124 30.1
Often 47,696 27.1 74,826 32.1
Total 175,817 100.0 233,343 100.0
13.1i. Student organizations USESTORG Don't know/N.A. 57,784 33.1 80,031 34.5
Rarely/Never 80,212 45.9 105,820 45.7
Sometimes 25,714 14.7 30,679 13.2
Often 10,870 6.2 15,180 6.6
Total 174,581 100.0 231,709 100.0
13.1j. Transfer credit assistance USETRCRD Don't know/N.A. 57,397 32.6 78,505 33.6
Rarely/Never 68,952 39.2 88,865 38.0
Sometimes 36,517 20.8 46,643 20.0
Often 12,966 7.4 19,761 8.5
Total 175,833 100.0 233,774 100.0

page 13 - 14JUN16
Community College Survey of Student Engagement - 2016 Cohort2016 Frequency Distributions - Main Survey
Breakout by Sex[Weighted]
Males Females
Item Variable Responses Count Percent Count Percent
Item 13.1: How often do you use the following services at this college?
13.1k. Services to students with disabilities USEDISAB Don't know/N.A. 93,205 52.9 129,432 55.3
Rarely/Never 62,039 35.2 82,834 35.4
Sometimes 12,020 6.8 10,601 4.5
Often 8,881 5.0 11,365 4.9
Total 176,145 100.0 234,233 100.0
Item 13.2: How satisfied are you with the following services at this college?
13.2a. Academic advising/planning SATACAD N.A. 28,651 16.6 31,939 13.9
Not at all 15,645 9.0 21,172 9.2
Somewhat 74,818 43.2 94,670 41.1
Very 53,888 31.1 82,333 35.8
Total 173,002 100.0 230,113 100.0
13.2b. Career counseling SATCACOU N.A. 69,170 40.3 97,328 42.7
Not at all 21,459 12.5 27,155 11.9
Somewhat 50,363 29.4 60,029 26.3
Very 30,449 17.8 43,490 19.1
Total 171,442 100.0 228,002 100.0
13.2c. Job placement assistance SATJOBPL N.A. 97,754 57.6 147,038 65.2
Not at all 23,024 13.6 27,949 12.4
Somewhat 32,923 19.4 32,869 14.6
Very 16,068 9.5 17,571 7.8
Total 169,770 100.0 225,427 100.0
13.2d. Peer or other tutoring SATTUTOR N.A. 75,835 44.6 100,846 44.7
Not at all 16,047 9.4 18,543 8.2
Somewhat 44,553 26.2 53,823 23.8
Very 33,608 19.8 52,476 23.3
Total 170,044 100.0 225,687 100.0
13.2e. Skill labs (writing, math, etc.) SATLAB N.A. 64,934 38.3 88,951 39.6
Not at all 13,007 7.7 14,002 6.2
Somewhat 51,831 30.6 60,702 27.0
Very 39,652 23.4 61,051 27.2
Total 169,424 100.0 224,707 100.0
13.2f. Child care SATCHLD N.A. 128,211 75.9 177,065 79.0
Not at all 16,448 9.7 20,463 9.1
Somewhat 15,880 9.4 14,250 6.4
Very 8,286 4.9 12,372 5.5
Total 168,825 100.0 224,150 100.0

page 14 - 14JUN16
Community College Survey of Student Engagement - 2016 Cohort2016 Frequency Distributions - Main Survey
Breakout by Sex[Weighted]
Males Females
Item Variable Responses Count Percent Count Percent
Item 13.2: How satisfied are you with the following services at this college?
13.2g. Financial aid advising SATFAADV N.A. 56,148 33.1 60,689 26.9
Not at all 20,461 12.1 26,551 11.8
Somewhat 48,120 28.4 63,554 28.2
Very 44,915 26.5 74,836 33.2
Total 169,643 100.0 225,630 100.0
13.2h. Computer lab SATCOMLB N.A. 39,234 23.1 51,983 23.0
Not at all 10,454 6.2 10,434 4.6
Somewhat 52,561 30.9 59,485 26.4
Very 67,606 39.8 103,683 46.0
Total 169,855 100.0 225,585 100.0
13.2i. Student organizations SATSTORG N.A. 90,891 54.1 130,529 58.4
Not at all 18,218 10.8 20,005 9.0
Somewhat 39,228 23.3 44,431 19.9
Very 19,758 11.8 28,364 12.7
Total 168,095 100.0 223,329 100.0
13.2j. Transfer credit assistance SATTRCRD N.A. 82,197 48.5 115,283 51.1
Not at all 19,275 11.4 23,716 10.5
Somewhat 40,847 24.1 48,273 21.4
Very 27,078 16.0 38,296 17.0
Total 169,397 100.0 225,568 100.0
13.2k. Services to students with disabilities SATDISAB N.A. 117,476 69.6 168,266 74.7
Not at all 13,015 7.7 15,862 7.0
Somewhat 20,770 12.3 19,088 8.5
Very 17,454 10.3 22,141 9.8
Total 168,715 100.0 225,357 100.0
Item 13.3: How important are the following services to you at this college?
13.3a. Academic advising/planning IMPACAD Not at all 17,336 10.1 14,730 6.4
Somewhat 51,434 30.0 48,913 21.4
Very 102,607 59.9 165,074 72.2
Total 171,377 100.0 228,717 100.0
13.3b. Career counseling IMPCACOU Not at all 35,190 20.8 39,526 17.5
Somewhat 53,713 31.7 59,658 26.4
Very 80,533 47.5 126,998 56.1
Total 169,437 100.0 226,183 100.0
13.3c. Job placement assistance IMPJOBPL Not at all 51,843 30.9 66,995 30.0
Somewhat 53,123 31.7 62,030 27.8
Very 62,701 37.4 94,479 42.3
Total 167,667 100.0 223,504 100.0

page 15 - 14JUN16
Community College Survey of Student Engagement - 2016 Cohort2016 Frequency Distributions - Main Survey
Breakout by Sex[Weighted]
Males Females
Item Variable Responses Count Percent Count Percent
Item 13.3: How important are the following services to you at this college?
13.3d. Peer or other tutoring IMPTUTOR Not at all 45,598 27.2 48,562 21.7
Somewhat 58,177 34.7 65,589 29.3
Very 63,965 38.1 109,581 49.0
Total 167,741 100.0 223,732 100.0
13.3e. Skill labs (writing, math, etc.) IMPLAB Not at all 39,388 23.6 44,354 19.9
Somewhat 57,412 34.4 64,262 28.9
Very 70,243 42.1 114,117 51.2
Total 167,043 100.0 222,734 100.0
13.3f. Child care IMPCHLD Not at all 90,433 54.3 111,750 50.3
Somewhat 36,846 22.1 38,232 17.2
Very 39,270 23.6 72,110 32.5
Total 166,549 100.0 222,092 100.0
13.3g. Financial aid advising IMPFAADV Not at all 34,819 20.8 31,633 14.1
Somewhat 37,457 22.4 34,550 15.4
Very 95,258 56.9 158,079 70.5
Total 167,535 100.0 224,263 100.0
13.3h. Computer lab IMPCOMLB Not at all 27,391 16.3 31,381 14.0
Somewhat 50,966 30.4 54,864 24.5
Very 89,559 53.3 137,827 61.5
Total 167,917 100.0 224,072 100.0
13.3i. Student organizations IMPSTORG Not at all 62,578 37.8 76,925 34.8
Somewhat 61,707 37.2 78,371 35.4
Very 41,477 25.0 66,059 29.8
Total 165,762 100.0 221,355 100.0
13.3j. Transfer credit assistance IMPTRCRD Not at all 44,176 26.4 53,822 24.0
Somewhat 42,581 25.5 46,157 20.6
Very 80,415 48.1 123,873 55.3
Total 167,172 100.0 223,852 100.0
13.3k. Services to students with disabilities IMPDISAB Not at all 64,705 38.8 80,931 36.2
Somewhat 31,702 19.0 30,085 13.5
Very 70,411 42.2 112,295 50.3
Total 166,818 100.0 223,311 100.0
Item 14: How likely is it that the following issues would cause you to withdraw from class or from this college?
14a. Working full-time WRKFULL Not likely 67,966 37.6 91,409 38.2
Somewhat likely 40,211 22.3 51,104 21.4
Likely 35,056 19.4 43,006 18.0
Very likely 37,319 20.7 53,756 22.5
Total 180,552 100.0 239,274 100.0

page 16 - 14JUN16
Community College Survey of Student Engagement - 2016 Cohort2016 Frequency Distributions - Main Survey
Breakout by Sex[Weighted]
Males Females
Item Variable Responses Count Percent Count Percent
Item 14: How likely is it that the following issues would cause you to withdraw from class or from this college?
14b. Caring for dependents CAREDEP Not likely 89,390 49.7 111,420 46.7
Somewhat likely 41,380 23.0 53,795 22.5
Likely 30,387 16.9 39,190 16.4
Very likely 18,746 10.4 34,249 14.4
Total 179,903 100.0 238,654 100.0
14c. Academically unprepared ACADUNP Not likely 99,833 55.6 130,957 55.1
Somewhat likely 44,175 24.6 56,812 23.9
Likely 22,986 12.8 30,546 12.8
Very likely 12,500 7.0 19,464 8.2
Total 179,493 100.0 237,779 100.0
14d. Lack of finances LACKFIN Not likely 60,457 33.6 63,748 26.7
Somewhat likely 41,641 23.2 53,398 22.4
Likely 35,253 19.6 46,480 19.5
Very likely 42,432 23.6 74,807 31.4
Total 179,783 100.0 238,433 100.0
14e. Transfer to a 4-year college oruniversity
TRANSFER Not likely 58,052 32.2 82,445 34.6
Somewhat likely 32,327 18.0 42,941 18.0
Likely 34,558 19.2 42,025 17.6
Very likely 55,089 30.6 71,202 29.8
Total 180,027 100.0 238,614 100.0
Item 15
15. How supportive are your friends of yourattending this college?
FRNDSUPP Not very 9,881 5.5 7,310 3.1
Somewhat 39,587 21.9 36,515 15.2
Quite a bit 55,466 30.7 60,436 25.2
Extremely 75,739 41.9 135,369 56.5
Total 180,673 100.0 239,630 100.0
Item 16
16. How supportive is your immediate familyof your attending this college?
FAMSUPP Not very 5,883 3.3 6,448 2.7
Somewhat 20,668 11.5 23,209 9.7
Quite a bit 39,820 22.1 40,869 17.1
Extremely 113,615 63.1 168,356 70.5
Total 179,985 100.0 238,882 100.0
Item 17: Indicate which of the following are your reasons/goals for attending this college.
17a. Complete a certificate program CERTPRGM Not a goal 80,699 45.8 112,857 48.3
Secondary goal 40,020 22.7 47,983 20.6
Primary goal 55,505 31.5 72,629 31.1
Total 176,224 100.0 233,469 100.0

page 17 - 14JUN16
Community College Survey of Student Engagement - 2016 Cohort2016 Frequency Distributions - Main Survey
Breakout by Sex[Weighted]
Males Females
Item Variable Responses Count Percent Count Percent
Item 17: Indicate which of the following are your reasons/goals for attending this college.
17b. Obtain an associate degree ASSOCDEG Not a goal 30,087 16.9 34,907 14.8
Secondary goal 42,622 23.9 44,561 18.8
Primary goal 105,591 59.2 157,051 66.4
Total 178,300 100.0 236,519 100.0
17c. Transfer to a 4-year college oruniversity
TR4YR Not a goal 41,631 23.3 57,580 24.4
Secondary goal 36,735 20.6 54,866 23.2
Primary goal 100,030 56.1 123,785 52.4
Total 178,396 100.0 236,231 100.0
17d. Obtain or update job-related skills OBUPSKIL Not a goal 44,037 24.9 61,431 26.2
Secondary goal 52,518 29.6 64,396 27.4
Primary goal 80,582 45.5 108,863 46.4
Total 177,137 100.0 234,690 100.0
17e. Self-improvement/personal enjoyment SLFIMP Not a goal 40,954 23.0 58,205 24.7
Secondary goal 63,351 35.6 77,359 32.8
Primary goal 73,703 41.4 100,343 42.5
Total 178,008 100.0 235,907 100.0
17f. Change careers CARCHNG Not a goal 103,976 58.5 132,998 56.4
Secondary goal 30,955 17.4 37,122 15.7
Primary goal 42,863 24.1 65,860 27.9
Total 177,794 100.0 235,979 100.0
Item 18: Indicate which of the following are sources you use to pay your tuition at this college.
18a. My own income/savings OWNINC Not a source 55,357 30.9 84,036 35.4
Minor source 58,094 32.5 73,905 31.1
Major source 65,551 36.6 79,338 33.4
Total 179,001 100.0 237,279 100.0
18b. Parent or spouse/significant other'sincome/savings
PARSPINC Not a source 89,039 49.9 129,448 54.8
Minor source 36,866 20.7 44,083 18.6
Major source 52,478 29.4 62,881 26.6
Total 178,382 100.0 236,412 100.0
18c. Employer contributions EMPLOYER Not a source 149,466 84.5 207,183 88.4
Minor source 15,154 8.6 16,252 6.9
Major source 12,214 6.9 10,871 4.6
Total 176,834 100.0 234,306 100.0
18d. Grants & scholarships GRANTS Not a source 85,298 47.8 95,457 40.3
Minor source 27,085 15.2 31,702 13.4
Major source 66,113 37.0 109,791 46.3
Total 178,496 100.0 236,949 100.0

page 18 - 14JUN16
Community College Survey of Student Engagement - 2016 Cohort2016 Frequency Distributions - Main Survey
Breakout by Sex[Weighted]
Males Females
Item Variable Responses Count Percent Count Percent
Item 18: Indicate which of the following are sources you use to pay your tuition at this college.
18e. Student loans (bank, etc.) STULOANS Not a source 123,967 69.7 152,939 64.7
Minor source 17,535 9.9 22,067 9.3
Major source 36,445 20.5 61,267 25.9
Total 177,948 100.0 236,273 100.0
18f. Public assistance PUBASSIT Not a source 152,174 85.7 200,722 85.2
Minor source 11,837 6.7 13,689 5.8
Major source 13,572 7.6 21,224 9.0
Total 177,583 100.0 235,635 100.0
Item 19: Since high school, which of the following types of schools have you attended other than the one you are now attending?
19. Proprietary (private) school or trainingprogram
PROPSCH No response 171,333 93.6 224,218 92.8
Response 11,754 6.4 17,507 7.2
Total 183,087 100.0 241,726 100.0
19. Public vocational-technical school VOCTECH No response 169,454 92.6 219,137 90.7
Response 13,633 7.4 22,589 9.3
Total 183,087 100.0 241,726 100.0
19. Another community or technical college COMMCOLL No response 149,731 81.8 188,769 78.1
Response 33,357 18.2 52,957 21.9
Total 183,087 100.0 241,726 100.0
19. 4-year college or university FOURYEAR No response 147,278 80.4 191,264 79.1
Response 35,809 19.6 50,462 20.9
Total 183,087 100.0 241,726 100.0
19. None NONESC No response 77,503 42.3 115,227 47.7
Response 105,584 57.7 126,499 52.3
Total 183,087 100.0 241,726 100.0
Item 20
20. When do you plan to take classes at thiscollege again?
TAKAGAIN I will accomplish my goal(s) during this termand will not be returning
26,099 14.4 35,092 14.6
I have no current plan to return 10,607 5.9 11,296 4.7
Within the next 12 months 110,986 61.3 156,797 65.4
Uncertain 33,274 18.4 36,510 15.2
Total 180,966 100.0 239,695 100.0

page 19 - 14JUN16
Community College Survey of Student Engagement - 2016 Cohort2016 Frequency Distributions - Main Survey
Breakout by Sex[Weighted]
Males Females
Item Variable Responses Count Percent Count Percent
Item 21
21. At this college, in what range is youroverall college grade average?
GPA Pass/fail classes only 1,432 0.8 1,640 0.7
Do not have a GPA at this school 3,767 2.1 4,347 1.8
C- or lower 5,307 2.9 5,413 2.3
C 14,298 7.9 14,918 6.3
B- to C+ 36,855 20.4 44,923 18.8
B 42,506 23.6 50,871 21.3
A- to B+ 50,956 28.3 76,842 32.2
A 25,211 14.0 39,544 16.6
Total 180,331 100.0 238,498 100.0
Item 22
22. When do you most frequently takeclasses at this college?
TIMCLASS Day classes (morning or afternoon) 139,989 78.0 184,642 78.0
Evening classes 38,571 21.5 51,076 21.6
Weekend classes 882 0.5 1,123 0.5
Total 179,441 100.0 236,842 100.0
Item 23
23. How many total credit hours have youearned at this college, not counting thecourses you are currently taking this term?
TOTCHRS None 19,416 10.8 23,219 9.7
1-14 credits 55,614 30.9 77,006 32.3
15-29 credits 41,571 23.1 52,668 22.1
30-44 credits 26,018 14.5 34,111 14.3
45-60 credits 21,461 11.9 28,567 12.0
Over 60 credits 15,945 8.9 23,190 9.7
Total 180,025 100.0 238,761 100.0
Item 24: At what other types of institutions are you taking classes this term?
24. None OTCLSNON No response 22,628 12.4 25,770 10.7
Response 160,459 87.6 215,956 89.3
Total 183,087 100.0 241,726 100.0
24. High school OTCLSHS No response 177,696 97.1 235,535 97.4
Response 5,392 2.9 6,190 2.6
Total 183,087 100.0 241,726 100.0
24. Vocational/technical school OTCLSVT No response 180,825 98.8 239,696 99.2
Response 2,262 1.2 2,030 0.8
Total 183,087 100.0 241,726 100.0
24. Another community or technical college OTCLSCC No response 177,774 97.1 235,337 97.4
Response 5,313 2.9 6,389 2.6
Total 183,087 100.0 241,726 100.0

page 20 - 14JUN16
Community College Survey of Student Engagement - 2016 Cohort2016 Frequency Distributions - Main Survey
Breakout by Sex[Weighted]
Males Females
Item Variable Responses Count Percent Count Percent
Item 24: At what other types of institutions are you taking classes this term?
24. 4-year college/university OTCLS4Y No response 177,134 96.7 233,827 96.7
Response 5,953 3.3 7,899 3.3
Total 183,087 100.0 241,726 100.0
24. Other OTCLASS No response 176,896 96.6 235,283 97.3
Response 6,191 3.4 6,443 2.7
Total 183,087 100.0 241,726 100.0
Item 25
25. How many classes are you presentlytaking at other institutions?
OTHINST None 153,269 83.9 203,518 84.3
1 class 6,336 3.5 8,575 3.6
2 classes 7,787 4.3 10,253 4.2
3 classes 6,324 3.5 8,212 3.4
4 classes or more 8,879 4.9 10,740 4.5
Total 182,596 100.0 241,298 100.0
Item 26
26. Would you recommend this college to afriend or family member?
RECOMMEN Yes 168,844 92.7 226,806 94.2
No 13,364 7.3 13,970 5.8
Total 182,207 100.0 240,776 100.0
Item 27
27. How would you evaluate your entireeducational experience at this college?
ENTIREXP Poor 3,670 2.0 3,099 1.3
Fair 28,564 15.6 31,804 13.2
Good 97,883 53.6 127,066 52.7
Excellent 52,533 28.8 79,338 32.9
Total 182,649 100.0 241,307 100.0
Item 28
28. Do you have children who live with you? HAVKID Yes 32,601 17.9 81,698 33.9
No 149,599 82.1 159,230 66.1
Total 182,201 100.0 240,928 100.0
Item 31
31. Are you married? MARRY Yes 23,798 13.0 47,434 19.6
No 159,073 87.0 194,011 80.4
Total 182,871 100.0 241,445 100.0
Item 32
32. Is English your native (first) language? ENGFIRST Yes 154,211 84.3 200,907 83.2
No 28,678 15.7 40,637 16.8
Total 182,889 100.0 241,544 100.0

page 21 - 14JUN16
Community College Survey of Student Engagement - 2016 Cohort2016 Frequency Distributions - Main Survey
Breakout by Sex[Weighted]
Males Females
Item Variable Responses Count Percent Count Percent
Item 35
35. What is the highest academic credentialyou have earned?
HIACCRED None 5,105 2.8 5,975 2.5
High school diploma or GED 143,889 79.7 170,398 71.7
Vocational/technical certificate 11,570 6.4 25,771 10.8
Associate degree 11,554 6.4 20,467 8.6
Bachelor's degree 6,504 3.6 12,431 5.2
Master's/doctoral/professional degree 1,881 1.0 2,742 1.2
Total 180,502 100.0 237,783 100.0
Item 36: What is the highest level of education obtained by your:
36. Mother MOTHED Not a high school graduate 18,751 11.1 33,242 15.3
High school diploma or GED 43,447 25.7 62,689 28.8
Some college, did not complete degree 25,687 15.2 37,994 17.5
Associate degree 21,120 12.5 27,711 12.7
Bachelor's degree 30,485 18.1 29,064 13.3
Master's degree/1st professional 14,419 8.5 13,387 6.1
Doctorate degree 2,233 1.3 1,930 0.9
Unknown 12,685 7.5 11,690 5.4
Total 168,826 100.0 217,706 100.0
36. Father FATHED Not a high school graduate 23,539 13.8 41,470 18.7
High school diploma or GED 47,632 28.0 69,489 31.4
Some college, did not complete degree 23,798 14.0 31,015 14.0
Associate degree 14,550 8.5 17,449 7.9
Bachelor's degree 26,360 15.5 25,212 11.4
Master's degree/1st professional 13,210 7.8 12,460 5.6
Doctorate degree 4,211 2.5 3,689 1.7
Unknown 17,027 10.0 20,832 9.4
Total 170,328 100.0 221,615 100.0