community-based, regional delivery of natural … regional delivery of ... community-based regional...
TRANSCRIPT

Community-based, Regional Delivery of Natural Resource Management
—Building system-wide capacities to motivate voluntary farmer adoption of conservation practices—
by Graham R. Marshall
October 2008
RIRDC Publication No 08/175
RIRDC Project No. UNE 91-A
ii
© 2008 Rural Industries Research and Development Corporation. All rights reserved. ISBN 1 74151 764 8 ISSN 1440-6845 Community-based Regional Delivery of Natural Resource Management – Building System-wide Capacities to Motivate Voluntary Farmer Adoption of Conservation Practices Publication No. 08/175 Project No. UNE 91-A The information contained in this publication is intended for general use to assist public knowledge and discussion and to help improve the development of sustainable regions. You must not rely on any information contained in this publication without taking specialist advice relevant to your particular circumstances.
While reasonable care has been taken in preparing this publication to ensure that information is true and correct, the Commonwealth of Australia gives no assurance as to the accuracy of any information in this publication.
The Commonwealth of Australia, the Rural Industries Research and Development Corporation (RIRDC), the authors or contributors expressly disclaim, to the maximum extent permitted by law, all responsibility and liability to any person, arising directly or indirectly from any act or omission, or for any consequences of any such act or omission, made in reliance on the contents of this publication, whether or not caused by any negligence on the part of the Commonwealth of Australia, RIRDC, the authors or contributors..
The Commonwealth of Australia does not necessarily endorse the views in this publication.
This publication is copyright. Apart from any use as permitted under the Copyright Act 1968, all other rights are reserved. However, wide dissemination is encouraged. Requests and inquiries concerning reproduction and rights should be addressed to the RIRDC Publications Manager on phone 02 6271 4165.
Researcher Contact Details Dr Graham Roy Marshall The Institute for Rural Futures, University of New England Armidale, New South Wales, Australia 2351 Phone: 61 (0)2 6773 3250 Fax: 61 (0)2 6773 3245 Email: [email protected]
In submitting this report, the researcher has agreed to RIRDC publishing this material in its edited form. RIRDC Contact Details Rural Industries Research and Development Corporation Level 2, 15 National Circuit BARTON ACT 2600 PO Box 4776 KINGSTON ACT 2604 Phone: 02 6271 4100 Fax: 02 6271 4199 Email: [email protected]. Web: http://www.rirdc.gov.au Electronically published by RIRDC in October 2008

iii
Foreword Since the 1980s, community-based natural resource management (NRM) in rural areas of Australia has evolved from its origins with small groups of farmers to the present situation, under the ‘regional delivery model’, where regional bodies are expected to foster community ownership and voluntary cooperation from the large and diverse populations inhabiting their regions. This scaling up of expectations regarding community-based approaches has brought with it substantial challenges. The research discussed in this report examines the potential of nested multi-level systems of community-based NRM to help address these challenges. On the basis of case studies in three NRM regions – in Queensland, Victoria and Western Australia, respectively – the report identifies eight guidelines for leaders and decision-makers at all levels of the regional delivery model to apply in adaptively designing community-based approaches capable of motivating farmers’ cooperation and thereby sustaining the natural resources under their management. This project was funded through the Cooperative Venture for Capacity Building in Rural Industries, which is made up of the research and development corporations: Australian Wool Innovation; Cotton Research and Development Corporation; Dairy Australia; Grains Research and Development Corporation; Grape and Wine Research and Development Corporation; Horticulture Australia Limited; Land & Water Australia; Meat & Livestock Australia; Murray-Darling Basin Commission; Rural Industries Research and Development Corporation; Sugar Research and Development Corporation; and the Australian Government Department of Agriculture, Fisheries and Forestry. This report is an addition to RIRDC’s diverse range of over 1800 research publications which can be viewed and freely downloaded from our website www.rirdc.gov.au. Information on the CVCB is available online at http://www.rirdc.gov.au/capacitybuilding/. • downloads at www.rirdc.gov.au/fullreports/index.html
• purchases at www.rirdc.gov.au/eshop
Peter O’Brien Managing Director Rural Industries Research and Development Corporation
iv
Acknowledgments The research that forms the subject of this report has been supported by a grant from the Cooperative Venture for Capacity Building in Rural Industries, which is made up of various research and development corporations. The views expressed are the responsibility of the author and not necessarily those of the Cooperative Venture or its constituent corporations. We are indebted to the farmers who gave their time to complete the survey and without whom the study would not have been possible. We are very grateful also to all those who attended the workshops and consultation meetings, and who participated in the key informant interviews. Their comments provided vital insights into how community-based approaches to natural resource management are working under the regional delivery model. Assistance from the following regional and subregional NRM bodies in arranging workshops and key informant interviews, in providing feedback on questionnaire drafts, in compiling sampling frames, and providing advice on appropriate mail-out strategies was greatly appreciated: Blackwood Basin Group, Central Highlands Regional Resources Use Planning Cooperative, Fitzroy Basin Association, Mallee Catchment Management Authority, and South West Catchments Council. We are grateful to the Victorian Farmers Federation for providing us indirect access to its membership list (via its mailhouse) for use as a sampling frame for the Mallee Region case. Sincere appreciation goes to Tim Cummins, of Tim Cummins and Associates, in leading the workshops, helping with key informant interviews, and offering advice, feedback and support during all stages of the project. Special thanks are due to Ruth McGregor for her efficiency in transcribing the workshop and interview discussions, and to Joanne Lenehan for her great work in transcribing the final consultation meetings. The dedicated work of Holly Hutchens, Joanne Lenehan, Lucienne Pham and Penny Taber in filling and addressing envelopes for postal distribution of the questionnaires was much appreciated, as was the efficient work of Lucienne Pham in entering data from the completed questionnaires. We are indebted to Cathy Coleman for her vital assistance in recruiting and supervising these project staff. All errors and omissions remain the responsibility of the author.
About the Author Graham Marshall is Program Leader: Economics, Environment and Institutions in the Institute for Rural Futures at the University of New England. He has a degree in agricultural science (majoring in agricultural economics), a Masters in economics, and a PhD in economics (conferred the PhD Thesis Award in 2003 by the Australian Agricultural and Resource Economics Society). Graham was until 1995 a senior economist at the New South Wales Department of Agriculture’s Yanco Research Institute. He is author of Economics for Collaborative Environmental Management: Renegotiating the Commons.

v
Abbreviations
BBG Blackwood Basin Group
CHRRUP Central Highlands Regional Resources Use Planning Cooperative
CMA Catchment Management Authority
FBA Fitzroy Basin Association
ICM Integrated catchment management
IGA Intergovernmental Agreement on the NAP
LCDC Land Conservation District Committee
na Not applicable
NAP National Action Plan for Salinity and Water Quality
nc Not calculated
NHT Natural Heritage Trust
NHT1 1st phase of the Natural Heritage Trust
NHT2 2nd phase of the Natural Heritage Trust
NLP National Landcare Program
NRM Natural resource management
SWCC South West Catchments Council
WA Western Australia

vi
Contents Foreword.......................................................................................................................................................... iii Acknowledgments........................................................................................................................................... iv About the Author............................................................................................................................................ iv Abbreviations ....................................................................................................................................................v List of Tables ................................................................................................................................................... ix Executive Summary....................................................................................................................................... xii 1. Introduction...................................................................................................................................................1 1.1 Community-based natural resource management in Australia ...................................................................1
1.1.1 Early influences.................................................................................................................................1 1.1.2 Landcare ............................................................................................................................................3 1.1.3 Integrated catchment management ...................................................................................................3 1.1.4 The Natural Heritage Trust ...............................................................................................................4 1.1.5 The ‘regional delivery model’ ..........................................................................................................6
1.2 Challenges in making the regional delivery model community-based.......................................................8 1.2.1 Widening the scale of community-based processes.........................................................................8 1.2.2 Increasing accountability demands on community-based processes............................................ 10
1.3 Towards ‘good science’ for community-based processes under the regional delivery model................ 12 1.4 Theory for nested governance of complex social-ecological systems ..................................................... 14
1.4.1 The collective-action perspective .................................................................................................. 14 1.4.2 The complexity perspective........................................................................................................... 18
1.5 Objectives of the study .............................................................................................................................. 19 1.6 Structure of the report................................................................................................................................ 20 2. Methodology............................................................................................................................................... 21 2.1 Case-study method of this study ............................................................................................................... 21 2.2 The cases.................................................................................................................................................... 22
2.2.1 The Blackwood Basin case............................................................................................................ 22 2.2.2 The Central Highlands case ........................................................................................................... 24 2.2.3 The Mallee Region dryland case ................................................................................................... 25
2.3 Fieldwork for the qualitative research....................................................................................................... 27 2.4 Details of the quantitative method............................................................................................................. 28
2.4.1 Questionnaire content .................................................................................................................... 28 2.4.2 Survey administration .................................................................................................................... 28 2.4.3 Sampling frames............................................................................................................................. 28 2.4.4 Response rates................................................................................................................................ 30 2.4.5 Testing for non-response bias ........................................................................................................ 31
2.5 Closing remarks ........................................................................................................................................ 31

vii
3. Results: Qualitative Research .................................................................................................................. 32 3.1 Theme 1: Don’t do for a lower-level group what it can do for itself ...................................................... 32 3.2 Theme 2: Appraise lower-level capacities carefully, and recruit with respect ....................................... 33 3.3 Theme 3: Invest in lower-level capacities................................................................................................ 35 3.4 Theme 4: Establish and maintain vertical trust........................................................................................ 38
3.4.1 A legacy of mistrust in government............................................................................................... 38 3.4.2 Scepticism of government motives for introducing the regional delivery model ........................ 39 3.4.3 Nesting as a way of engaging individuals and local groups with the regional model ................. 40 3.4.4 Building vertical trust across levels of a nested community-based system.................................. 41 3.4.5 Maintaining accountability without alienating the community .................................................... 42 3.4.6 Allowing lower-level groups substantive autonomy .................................................................... 43 3.4.7 Bridging barriers to vertical trust................................................................................................... 44
3.5 Summary and closing remarks .................................................................................................................. 46 4. Quantitative Research Design.................................................................................................................. 47 4.1 Dependent variables .................................................................................................................................. 47
4.1.1 Definition........................................................................................................................................ 47 4.1.2 ‘Censored’ dependent variables..................................................................................................... 49 4.1.3 Testing for differences between ‘green’ and ‘brown’ practices ................................................... 51
4.2 Explanatory variables and corresponding hypotheses.............................................................................. 52 4.2.1 Property characteristics .................................................................................................................. 56 4.2.2 Farmers’ human capital.................................................................................................................. 58 4.2.3 Attachment to place........................................................................................................................ 60 4.2.4 Farmers’ financial situation ........................................................................................................... 62 4.2.5 Contribution of adoption to farmers’ goals ................................................................................... 65 4.2.6 Farmers’ perceptions of adoption as a commons problem ........................................................... 67 4.2.7 Farmers’ expectations of future adoption across their district ...................................................... 71 4.2.8 Farmers’ trust in the regional delivery model ............................................................................... 73
4.3 Closing remarks ......................................................................................................................................... 85 5. Results: Quantitative research................................................................................................................. 86 5.1 Introduction................................................................................................................................................ 86 5.2 Terminology............................................................................................................................................... 86 5.3 Regression results for the three cases........................................................................................................ 88
5.3.1 Blackwood Basin case ................................................................................................................... 88 5.3.2 Central Highlands case................................................................................................................... 90 5.3.3 Mallee dryland case........................................................................................................................ 93 5.3.4 Patterns across the practices and cases .......................................................................................... 95
5.4 Substantive significance of farmers’ trust in their subregional body ....................................................... 99 5.5 Differences between adoption of ‘green’ and ‘brown’ practices ........................................................... 102 5.6 Summary of findings ............................................................................................................................... 103
viii
6. Guidelines for Community-based NRM under the Regional Delivery Model ................................ 106 6.1 The design principles approach: critiques and responses....................................................................... 106 6.2 Recent contributions to normative guidelines for multi-level environmental governance.................... 108 6.3 This study’s contributions to guidelines for multi-level environmental governance............................. 114
6.3.1 Distinguishing nested systems of multi-level governance.......................................................... 114 6.3.2 The principle of subsidiarity ........................................................................................................ 115 6.3.3 The question of capacity .............................................................................................................. 115 6.3.4 Barriers and bridges to nested governance.................................................................................. 116 6.3.5 Preliminary guidelines for community-based governance of complex environmental problems............................................................................................................................................................... 118 6.3.6 Validating and revising the preliminary guidelines .................................................................... 118
6.4 Closing remarks ....................................................................................................................................... 120 7. Conclusions, Implications, and Recommendations............................................................................. 123 7.1 Overview of the research and its conclusions......................................................................................... 123
7.1.1 Research problem......................................................................................................................... 123 7.1.2 Method.......................................................................................................................................... 123 7.1.3 Qualitative conclusions................................................................................................................ 124 7.1.4 Quantitative conclusions.............................................................................................................. 124 7.1.5 Guidelines for community-based governance under the regional delivery model for natural resource management............................................................................................................................ 126
7.2 Policy implications .................................................................................................................................. 127 7.2.1 Getting to ‘good science’ in designing community-based processes ......................................... 127 7.2.2 Steps forward and back................................................................................................................ 128 7.2.3 Encouraging signs ........................................................................................................................ 128 7.2.4 Integration, deliberation and politics ........................................................................................... 129
7.3 Recommendations ................................................................................................................................... 130 References..................................................................................................................................................... 131 Appendix A: Regression results for the Blackwood Basin case............................................................. 137 Appendix B: Regression results for the Central Highlands case............................................................ 141 Appendix C: Regression results for the Mallee Region dryland case.................................................... 145
ix
List of Tables Table 2.1: Details of case-study fieldwork for the qualitative research ................................................... 27 Table 2.2 Sample size and response rates for the Blackwood Basin case............................................... 30 Table 2.3: Sample size and response rates for the Central Highlands case.............................................. 30 Table 4.1: Frequency distributions for expected adoption changes for relevant practices by applicable Blackwood Basin respondents ................................................................................................. 48 Table 4.2: Frequency distributions for expected adoption changes for relevant practices by Central Highlands respondents ............................................................................................................. 48 Table 4.3: Frequency distributions for expected adoption changes for relevant practices by Mallee dryland respondents.................................................................................................................. 49 Table 4.4: Frequency distributions for expected adoption rates after 10 years by applicable Blackwood Basin respondents..................................................................................................................... 50 Table 4.5: Frequency distributions for expected adoption rates after 10 years by applicable Central Highlands respondents ............................................................................................................. 50 Table 4.6: Frequency distributions for expected adoption rates after 10 years by applicable Mallee respondents ............................................................................................................................... 51 Table 4.7: Explanatory variables and associated hypotheses and questionnaire items............................ 53 Table 4.8: Frequency distribution for property size of Blackwood Basin respondents........................... 56 Table 4.9: Frequency distribution for property size of Central Highlands respondents .......................... 56 Table 4.10: Frequency distribution for property size of Mallee dryland respondents ............................... 56 Table 4.11: Percentage of net farm income derived from various enterprise types: frequency distributions for the Blackwood Basin .......................................................................................................... 57 Table 4.12: Percentage of net farm income derived from various enterprise types: frequency distributions for the Central Highlands ......................................................................................................... 57 Table 4.13: Percentage of net farm income derived from various enterprise types: frequency distributions for Mallee dryland respondents................................................................................................ 58 Table 4.14: Frequency distribution for years experience farming of Blackwood Basin respondents....... 58 Table 4.15: Frequency distribution for years experience farming of Central Highlands respondents...... 58 Table 4.16: Frequency distribution for years experience farming of Mallee dryland respondents........... 59 Table 4.17: Frequency distribution for local group involvement of Blackwood Basin respondents ........ 59 Table 4.18: Frequency distribution for local group involvement of Central Highlands respondents........ 59 Table 4.19: Frequency distribution for local group involvement of Mallee dryland respondents............. 59 Table 4.20: Frequency distribution for formal education of Blackwood Basin respondents .................... 60 Table 4.21: Frequency distribution for formal education of Central Highlands respondents ................... 60 Table 4.22: Frequency distribution for formal education of Mallee dryland respondents ........................ 60 Table 4.23: Frequency distributions of Blackwood Basin responses to statements concerning attachment to place...................................................................................................................................... 61 Table 4.24: Frequency distributions of Central Highlands responses to statements concerning attachment to place...................................................................................................................................... 61 Table 4.25: Frequency distributions of Mallee dryland responses to statements concerning attachment to place .......................................................................................................................................... 61 Table 4.26: Frequency distribution for profitability of Blackwood Basin respondents............................. 63 Table 4.27: Frequency distribution for profitability of Central Highlands respondents............................ 63 Table 4.28: Frequency distribution for profitability of Mallee dryland respondents................................. 63 Table 4.29: Frequency distribution for equity ratio of Blackwood Basin respondents ............................. 64 Table 4.30: Frequency distribution for equity ratio of Central Highlands respondents............................. 64 Table 4.31: Frequency distribution for equity ratio of Mallee dryland respondents ................................. 64 Table 4.32: Frequency distribution for % income from farm business of Blackwood Basin respondents 64 Table 4.33: Frequency distribution for % income from farm business of Central Highlands respondents65 Table 4.34: Frequency distribution for % income from farm business of Mallee dryland respondents.... 65
x
Table 4.35: Frequency distributions of contribution to goals responses from applicable Blackwood Basin respondents ............................................................................................................................... 66 Table 4.36: Frequency distributions of contribution to goals responses from applicable Central Highlands respondents ............................................................................................................................... 66 Table 4.37: Frequency distributions of contribution to goals responses from applicable Mallee dryland respondents ............................................................................................................................... 67 Table 4.38: Frequency distribution for perceived commons problem of Blackwood Basin respondents . 69 Table 4.39: Frequency distribution for perceived commons problem of Central Highlands respondents 69 Table 4.40: Frequency distribution for perceived commons problem of Mallee dryland respondents ..... 70 Table 4.41: Frequency distributions for expected future district adoption responses from applicable Blackwood Basin respondents ................................................................................................. 72 Table 4.42: Frequency distributions for expected future district adoption responses from applicable Central Highlands respondents ................................................................................................ 72 Table 4.43: Frequency distributions for expected future district adoption responses from applicable Mallee dryland respondents ..................................................................................................... 73 Table 4.44: Issues associated with farmers’ trust in the regional delivery model...................................... 74 Table 4.45: Frequency distributions of Blackwood Basin responses to items associated with trust in subregional body ...................................................................................................................... 77 Table 4.46: Frequency distributions of Central Highlands responses to items associated with trust in subregional body ...................................................................................................................... 78 Table 4.47: Frequency distributions of Blackwood Basin responses to items associated with trust in regional body ............................................................................................................................ 78 Table 4.48: Frequency distributions of Central Highlands responses to items associated with trust in regional body ............................................................................................................................ 79 Table 4.49: Frequency distributions of Mallee dryland responses to items associated with trust in regional body ............................................................................................................................ 79 Table 4.50: Frequency distributions of Blackwood Basin responses to items associated with trust in government commitment to community empowerment ........................................................... 80 Table 4.51: Frequency distributions of Central Highlands responses to items associated with trust in government commitment to community empowerment ........................................................... 80 Table 4.52: Frequency distributions of Mallee dryland responses to items associated with trust in government commitment to community empowerment ........................................................... 81 Table 4.53: Frequency distributions of Blackwood Basin responses to items associated with trust in government integrity................................................................................................................. 81 Table 4.54: Frequency distributions of Central Highlands responses to items associated with trust in government integrity................................................................................................................. 82 Table 4.55: Frequency distributions of Mallee dryland responses to items associated with trust in government integrity................................................................................................................. 82 Table 4.56: Frequency distributions of Blackwood Basin responses to items associated with trust in regional/subregional autonomy ............................................................................................... 83 Table 4.57: Frequency distributions of Central Highlands responses to items associated with trust in regional/subregional autonomy ............................................................................................... 83 Table 4.58: Frequency distributions of Mallee dryland responses to items associated with trust in regional/subregional autonomy ............................................................................................... 83 Table 5.1: Summary of regression results for the Blackwood Basin case ............................................... 89 Table 5.2: Summary of regression results for the Central Highlands case............................................... 91 Table 5.3: Summary of regression results for the Mallee dryland case.................................................... 94 Table 5.4: Summary of hypothesis-test findings and associated coefficient signs .................................. 96 Table 5.5: Elasticities of statistically-significant explanatory variables for the Blackwood Basin case100 Table 5.6: Elasticities of statistically-significant explanatory variables for the Central Highlands case ..... ................................................................................................................................................. 101 Table 5.7: Proportions of models for ‘green’ and ‘brown’ practices that supported the hypotheses for trust in subregional body and trust in regional body ............................................................ 102 Table 6.1: Selected attributes of adaptive, multi-level governance, as compiled by Armitage (2008). 109 Table 6.2: Environmental subsidiarity principles as proposed by Ribot (2004).................................... 110
xi
Table 6.3: Recommendations in Ribot (2004) on dealing with resistance to democratic decentralisation.. ................................................................................................................................................. 111 Table 6.4: Normative principles for good governance under Australia’s regional delivery model, from Lockwood et al. (2007) .......................................................................................................... 112 Table 6.5: Ratings by Lockwood et al. (2007) of the regional delivery model against their eight normative principles for good governance* .......................................................................... 113 Table 6.6: Preliminary guidelines for community-based governance of complex environmental problems, as proposed by Marshall (2008)............................................................................ 118 Table 6.7: Guidelines for community-based governance under the regional delivery model for natural resource management............................................................................................................. 121 Table A.1: Double-censored regression model for revegetation and protective fencing ....................... 137 Table A.2: Double-censored regression model for establish perennial vegetation ................................ 137 Table A.3: Double-censored regression model for establish perennial pastures ................................... 138 Table A.4: Double-censored regression model for soil remediation....................................................... 138 Table A.5: Double-censored regression model for surface water management..................................... 139 Table A.6: Double-censored regression model for groundwater management ...................................... 139 Table A.7: Double-censored regression model for pest and weed control ............................................. 140 Table A.8: Double-censored regression model for zero or minimum tillage cropping .......................... 140 Table B.1: Double-censored regression model for fencing riparian areas & installing watering points .... ................................................................................................................................................. 141 Table B.2: Double-censored regression model for environmental weeds control.................................. 141 Table B.3: Double-censored regression model for maintain groundcover on grazing land.................. 142 Table B.4: Double-censored regression model for soil conservation measures..................................... 142 Table B.5: Double-censored regression model for fencing to land type for grazing.............................. 143 Table B.6: Double-censored regression model for property management planning.............................. 143 Table B.7: Double-censored regression model for minimum or zero tillage cropping .......................... 144 Table C.1: Double-censored regression model for link patches of native vegetation ............................ 145 Table C.2: Double-censored regression model for remove grazing pressure from native vegetation... 145 Table C.3: Double-censored regression model for control environmental weeds.................................. 146 Table C.4: Double-censored regression model for establish high water-use plants .............................. 146 Table C.5: Double-censored regression model for continuous cropping ............................................... 147 Table C.6: Double-censored regression models for control pest animals .............................................. 147 Table C.7: Double-censored regression model for reduced or minimum tillage.................................... 148

xii
Executive Summary What this research is about The research was concerned with the challenges of succeeding with a community-based approach to governance under Australia’s regional delivery model for natural resource management (NRM). More particularly, it explored the potential that ‘nesting’ of community-based systems within regions offers for addressing these challenges. Who this report is aimed at This reported is aimed at leaders and decision makers at all levels of the Australian policy community (from local groups through to the Commonwealth Government) responsible for, or concerned with, promoting voluntary adoption of strategic on-ground NRM actions through community-based NRM. Background Since the 1980s, community-based NRM has evolved from its origins with small groups of landholders to the present situation where regional bodies, each responsible for an extensive landscape, are expected to foster ‘community ownership’ and voluntary cooperation from the large and diverse populations (comprising up to hundreds of thousands of people) inhabiting their regions. Aside from the challenge presented by this quantum up-scaling of the community-based approach, another challenge derives from the pressures on regional bodies to assume responsibilities (e.g. demonstration of upward accountability to the governments funding them) that risk them becoming perceived by their constituents as extensions of government. A further challenge follows from governmental expectations that regional bodies will invest their funds strategically, rather than spread available funds across their constituency, and the consequent risk that community ownership of regional decisions may be weakened by perceptions of inequity, favouritism or ‘playing politics’. International research has identified ‘nested’ approaches to community-based NRM as a potential way of responding to such challenges. This response involves structuring programs concerned with larger-scale NRM problems as nested multi-level systems of community-based governance. Nested governance systems of this kind differ from conventional multi-level systems which tend to be designed from the top down. In contrast, a nested multi-level system arises predominantly from a bottom-up process in which lower-level units are active participants in the design and operation of higher levels of the system. Such a bottom-up process offers the possibility of making manageable the problems of establishing voluntary cooperation from large and diverse populations that otherwise would likely remain insurmountable. This is not to deny important roles for governments in resourcing and facilitating the bottom-up process of institutional development, and in defining parameters for the process so that it might integrate effectively with governmental programs. Objectives The purpose of the project was to strengthen the capacities of all levels of the Australian policy community, from local groups to regional bodies to the Commonwealth Government, to establish successful community-based arrangements under the regional delivery model for NRM. Accordingly, the primary objective of the project was to identify a set of guidelines that leaders and decision-makers at all levels might apply in designing nested systems of community-based NRM. Methods used A case-study method was used that involved complementary application of qualitative techniques (data from workshops and semi-structured interviews) and quantitative techniques (data from mail-out farmer surveys analysed by multiple regression). This method was used to explore whether and how nested community-based NRM applies to the regional delivery model, particularly in respect of engaging farmers’ voluntary cooperation in achieving targets set under this model. The qualitative research involved workshops and key informant interviews. It elicited stakeholders’ perceptions of the regional delivery model as an exercise in community-based NRM, their assessments of its strengths and weaknesses in this respect, and their views on how the weaknesses might be ameliorated. The quantitative research involved

xiii
multiple regression analyses, and was concerned with identifying whether farmers’ trust in the regional delivery model was associated with their plans to cooperate with that model by adopting the kinds of conservation practices promoted to them under the model. The three regions used as case studies were the South West Catchments Region in Western Australia (for which the regional body is the South West Catchments Council), the Fitzroy Basin Region in Queensland (for which the regional body is the Fitzroy Basin Association (FBA), and the Mallee Region in Victoria (for which the regional body is the Mallee Catchment Management Authority). In the South West Catchments Region, the subregional focus was on the Blackwood Basin, with the Blackwood Basin Group (BBG) as its subregional body. In the Fitzroy Basin Region, the subregional focus was on the Central Highlands subregion, with the Central Highlands Regional Resources Use Planning Cooperative (CHRRUP) as its subregional body. The focus in the Mallee Region was on dryland districts, to facilitate comparability with the other two subregions where agriculture was also mainly dryland-based. Key findings From the qualitative research, four main themes concerning how the regional delivery model might be made more community-based were identified: (i) don’t do what a lower-level group can do for itself; (ii) appraise lower-level capacities, and recruit with respect; (iii) invest in strengthening lower-level capacities; and (iv) establish and maintain vertical trust. The qualitative research also identified an array of issues associated with farmers’ vertical trust in the regional delivery model. These issues were used in developing questionnaire items for measuring farmers’ trust in the regional delivery model, and thus providing data on such trust for the subsequent quantitative analysis. The quantitative analysis indicated that farmers’ vertical trust in the regional delivery model was associated with their adoption plans for most of the conservation practices promoted to them under that model that were analysed in the present study. It also found, at least in the Blackwood Basin case and Central Highlands case for which a subregional body existed, that farmers’ trust in their relevant subregional body (BBG and CHRRUP, respectively) was the element of farmers’ trust in the regional delivery model most likely to be associated with their adoption plans. Farmers’ trust in their regional body was the element of this trust second most likely to be associated with farmers’ adoption plans. Of all 17 variables included in the models, the quantitative analysis indicated that farmers’ trust in their subregional body, where relevant (i.e., not in the Mallee dryland case where a subregional body does not exist), was second most likely to be associated with farmers’ adoption plans. Farmers’ adoption plans were also found in the quantitative analysis to be more sensitive to changes in their trust in their subregional body (in the two cases where this variable was relevant) than to most other variables found to be associated with such plans. Hence, it appears that trust of this kind was not only more likely than most other variables to be associated statistically with farmers’ adoption plans in these cases but also, when association exists, to be relatively strongly associated with those plans in a substantive sense (i.e., such that a relatively small proportionate change in this trust is associated with a relatively large proportionate change in these plans). The quantitative analysis also indicated that farmers’ vertical trust in the regional delivery model was more likely to be associated with their adoption plans for ‘green’ practices (i.e. concerned with biodiversity conservation) than for ‘brown’ conservation practices (i.e. concerned with sustaining agricultural production). This is consistent with claims that the introduction of government regulations restricting farmers’ rights to clear native vegetation has led many farmers to distrust anything with the ‘whiff of a green agenda’. However, regional bodies, and subregional bodies where they exist, will be advantaged compared with governments in reversing this distrust only to the extent that they do not become perceived as extensions of government or ‘under their thumb’. Overall, these findings suggest that community-based NRM at the scale of regions defined under the regional delivery model can be capable of motivating voluntary cooperation from farmers in adopting practices promoted to them under this model, but only to the extent that community-based bodies are able to establish trust from their farmer constituents and engage them effectively enough that they come to

xiv
follow reciprocity strategies in their dealings with these bodies. It seems that subregional bodies have an advantage over regional bodies in eliciting such behaviour from farmers because the former are better positioned to engage them effectively. This indicates the value of a nested multi-level approach to community-based NRM within regions, at least where capacities below the regional level are sufficient to justify devolution of significant responsibilities to subregional or other levels. However, it needs to be appreciated that these findings were based on patterns observed over a sample comprising three of the 56 NRM regions defined under the regional delivery model. Further research on a broader sample of regions is warranted to determine the degree to which findings from this study can validly be generalised across the full population of regions. The qualitative and quantitative findings complemented one another in highlighting the challenges of successfully pursuing a community-based approach under the regional delivery model, and in identifying guidelines for how such challenges might fruitfully be addressed. A final set of eight guidelines were identified as listed and elaborated below.
Guidelines for community-based governance under the regional delivery model
for natural resource management
Guideline Elaboration
Establish vertical trust
Fulfil responsibilities at any level in ways that establish trust from units at other levels. Various attributes of ‘good governance’ are relevant here, including: transparency, accountability (upward and downward), inclusiveness, fairness, and deliberativeness. Procedures for establishing such attributes should be decided deliberatively between the relevant levels, not imposed from the top down.
Subsidiarity Each governance responsibility should be undertaken at the lowest level of a multi-level system with capacity to conduct it effectively. This guideline should not be interpreted solely from the top-down, but rather through deliberation between the relevant levels.
Representation The capacity at a given level to conduct a responsibility effectively depends partly on whether all parties substantively affected by the responsibility are represented at that level.
Competence The capacity at a given level to conduct a responsibility effectively depends also on whether there is sufficient access at that level to the requisite physical, financial, human and social capacities.
Build and maintain lower-level capacities
The capacity at a given level to discharge a responsibility effectively can often be enhanced by strengthening access to the requisite capacities. Subsidiarity obliges decision-makers at one level to exhaust all reasonable opportunities before ruling out decentralising a responsibility to a lower level. Meanwhile, it urges due caution in ensuring decisions do not weaken lower-level capacities (e.g., over-stretching or under-utilising capacities, encouraging dependency, triggering conflict, causing demoralisation, etc.).
Secure lower-level rights
Efforts to build capacity at lower levels are unlikely to succeed unless the target population has secure rights to benefit from the capacities developed.
Respect lower-level autonomy
Units assigned responsibilities in accordance with the subsidiarity principle should be allowed substantive autonomy in how they decide to pursue those responsibilities.
Counter resistance Higher-level units often resist application of the subsidiarity principle as decided deliberatively between the relevant levels. Such resistance can often be countered through leadership (including by individuals at higher levels), patient strategic moves, demonstrating good performance, preparing for ‘windows of opportunity’, and establishing horizontal and vertical alliances.
Implications for stakeholders The research findings suggest that community-based approaches are capable of succeeding under the regional delivery model in motivating greater voluntary cooperation from farmers than would be possible without such approaches. However, they also highlight that success of this kind cannot be taken for granted. In particular, the findings highlight the importance of farmers coming to adopt reciprocity strategies in respect of their key relationships under the regional delivery model. It can be expected that these key relationships for farmers will be with their subregional body where one exists, or otherwise with
xv
their regional body. Nevertheless, for leading farmers to follow reciprocity strategies with higher levels of authority is no easy matter given that paternalistic governance of generations of farmers has tended in many settings to entrench free-riding or opposition strategies as an ongoing norm. Only when farmers come to trust that governance structures are prepared to reciprocate their cooperation – by valuing their input, rather than dismissing it, taking it for granted or using it against them – can they be expected to progress from free-riding and opposition to adoption of reciprocity strategies. The eight guidelines identified above for community-based NRM should be viewed as points of departure for a system-wide process of ‘institutional diagnosis’ seeking to identify and remedy the key issues in any setting that are limiting the effectiveness of such an approach in motivating the trust and reciprocity from farmers that is needed for them to cooperate more voluntarily in adopting the kinds of conservation practices promoted to them under the regional delivery model. A process of this kind has an important contribution to make towards the ‘good science’ which policymakers continue to emphasise as integral to the regional delivery model. Recommendations It is recommended that: 1. leaders at all levels of the regional delivery model (federal, state/territory, regional, subregional,
local, etc.) apply the eight guidelines listed above as points of departure for adaptive management towards community-based governance systems capable of establishing voluntary cooperation from farmers; and
2. the conclusions drawn from the three cases studied in the present research be further validated and refined through additional case-study research covering a broader sample of the regions defined under the regional delivery model.

1
1. Introduction Since the mid 1980s in rural Australia, a government-sponsored experiment in community-based governance of natural resources has evolved at a speed and trajectory that few would have anticipated. This experiment has centred on the delivery of federal and state/territory government funds to motivate landholders to adopt the kinds of conservation practices needed to address the nation’s mounting problems with degradation of natural resources including soil, water and biodiversity. During this time, the ‘community’ focused on has grown from local groups (typically involving 20-30 landholders) to populations of up to hundreds of thousands of people (urban and rural) residing within extensive government-delineated regions. This report documents the project ‘Nesting community-based natural resource management for regional accountability and grassroots cooperation’. This project was concerned with the challenge of succeeding with community-based approaches to natural resource management (NRM) given the large scales and stringent governance standards they now, under the ‘regional delivery model’, are expected to contend with. In section 1.1 of this chapter, an account of the origins and evolution of community-based NRM in Australia, culminating most recently in the regional delivery model, is presented. Section 1.2 then examines the challenge of making this model for NRM truly community-based, such that farmers and other regional constituents do actually become more motivated to cooperate voluntarily with the model by adopting the on-ground practices promoted by it. When the regional delivery model was introduced, considerable emphasis was placed by Commonwealth and state and territory1 governments on the model being established and implemented in accordance with ‘good science’. Section 1.3 examines progress to date in designing Australian community-based processes on a scientific basis, and finds that progress in this direction remains limited. It notes a key finding from international research that community-based governance systems demonstrated capacity to sustain large-scale natural resource systems often operate as ‘nested’ multi-level systems, and considers briefly the nature of such nested systems. Section 1.4 proceeds to provide a theoretical perspective on the potential advantages of nested community-based systems for sustainable NRM. The objectives of the study in exploring the relevance and value of the ‘nesting principle’ for current Australian pursuit of community-based NRM are stated in section 1.5. Finally, the structure of the remainder of the report is outlined in section 1.6. 1.1 Community-based natural resource management in Australia 1.1.1 Early influences 1.1.1.1 International agreements and scholarship Australian reasons for trying community-based conservation share much in common with many other countries. In most nations until the late 1970s, people concerned about degradation of natural resources called for their centralised governments to intervene. Meanwhile, the unprecedented affluence of Western countries since the 1960s led their citizens to turn their attention to the stresses on the natural environment accompanying the economic growth that had yielded this affluence, and consequently lost trust in their governments as reliable custodians of nature. Citizens consequently strengthened their demands to participate more directly in decisions affecting the environment. The World Conservation Strategy launched in 1980 reflected the success of the ‘environmental movement’ in highlighting the urgency of addressing economic and environmental concerns in an integrated way, and of enabling community participation as a way of restoring the public’s trust in environmental governance by enhancing its downward accountability. The emphasis of this strategy on community participation was reflected in the National Conservation Strategy for Australia prepared in 1983. Curtis (1998) observed how 1 For the sake of brevity, the term ‘state’ will henceforth be used to refer generally to a state or a territory recognised under Australia’s federal system of government.

2
the Australian emphasis on local participation in environmental decision-making and action arose from a vanguard of soil conservationists, extension agents and farmers adapting emerging theories of rural development (e.g., Chambers 1983) to a developed economy. These theories identified the advantages of local self-help, supported by change agents, for addressing challenges faced in rural areas. Despite the international success of the rural development discipline in placing community participation on the environmental policy agenda, confidence among academics and policy-makers in the effectiveness of participation widened only slowly beyond that discipline until the 1990s. Until that time, Hardin’s (1968) highly-influential ‘tragedy of the commons’ article and neoclassical economic reasoning (Gordon 1954; Olson 1965; Scott 1955) fuelled doubts in wider academic and policy circles that community participation in environmental management could ever lead to anything but a ‘tragedy’ – of community members failing to participate effectively as a result of seeking to ‘free ride’ on the participation of others. By the mid-1980s, however, extensive research by scholars of common property and political ecology had demonstrated the limitations of earlier reasoning, and identified numerous instances around the world where local communities had established enduring institutional arrangements enabling their members to participate effectively in managing common-pool natural resources upon which they relied. Elinor Ostrom’s (1990) Governing the Commons brought this work to the attention of academics and policy-makers world-wide. The ground was laid for a broadening of acceptance among academics and policy-makers that the role of community deserves as much consideration when designing governance regimes as do the roles of state and market (Lemos and Agrawal 2006). Policy-makers embraced the newly-legitimated option of decentralising responsibilities to community-based arrangements with sufficient enthusiasm that by the end of the 1990s Manor (1999 p.1) observed how ‘decentralization has quietly become a fashion of our time’. 1.1.1.2 The Progressive Conservation Movement Aside from these international influences, Australian interest in community-based approaches to NRM has been motivated particularly by the challenge of achieving on-ground action in this area given that much of the action needs to occur on agricultural and grazing land that is owned privately. Farmers’ absolutist views of their private property rights, together with their continuing political influence as a sector, mean that attempts to coercively regulate their on-ground actions face political, enforcement and other transaction costs of a magnitude that few Australian governments have found agreeable. The difficulty of changing Australian farmers’ behaviour by regulating them is exacerbated by persistence of features of a frontier society including ‘condoned lawlessness, particularly when that lawlessness is directed toward distant and unpopular authority’ (Reeve et al. 2002 p.8). The social dynamics of small rural communities has also discouraged regulation of farmers, since ‘it is difficult for government employees in regional areas to be enforcement agents when they have ongoing social relationships with many members of the community’ (ibid.). Given these difficulties of the regulatory route, Australian governments have for the most part sought to promote voluntary cooperation by landholders in adopting the kinds of practices needed to conserve natural resources influenced by their activities. Key to this voluntary approach was state and territory governments taking lead roles in the research and development of conservation practices that landholders could adopt on-farm, and in running extension programs encouraging landholders to adopt them. This approach followed the lead of the Progressive Conservation Movement which exercised strong influence with the USA from the early 20th century. This movement was progressive in so far as it responded to the wasteful excesses of the frontier era with management techniques drawn from administrative science that were revolutionising American business management at the time. The resulting Progressive approach to conserving natural resources, which became known as ‘administrative rationalism’ (Reeve et al. 2002), held that ‘politics’ could and should be separated from ‘administration’. It held that politics should be confined as far as possible to deciding high-order policy directions, while administration should focus on pursuing these high-order directions though the application of science. It assumed facts and values can be separated, and required that decision-making be kept

3
‘objective’ by considering only the facts and ignoring values and subjective perceptions. Hence, priorities for research, development and extension of on-farm conservation practices were decided primarily with facts considered objective by scientists, extension officers and their supervisors, and influenced little by the ‘subjective’ values, goals and knowledge of landholders. An early problem with this approach was the reluctance of landholders to adopt conservation practices that were inconsistent with their goals. Hence, it became increasingly common for financial incentives, including subsidies and income tax concessions, to be offered to landholders when the practices being promoted were unprofitable for them (Reeve 1997). Often these inducements did not motivate adoption to the extent required, because the available funds had to be spread over too many landholders. Despite the failure of the administrative rationalist approach to research and extension of on-farm conservation practices, it retained support from Australian governments and the public until about the mid-1970s (Syme 1995). 1.1.2 Landcare This was the background against which arguments for community-based approaches to managing natural resources gained a receptive audience in the early 1980s from those preparing Australia’s National Conservation Strategy and its National Soil Conservation Program (also launched in 1983), as well as from state governments looking for ways to stretch their available funds further in achieving integrated changes in management of natural resources across agricultural landscapes. The Victorian Government, for instance, initiated what became known as the Landcare program during the 1980s to address problems of irrigation and dryland salinity across the state. Some 400 Local Action and Advisory Groups were formed under this program, each involving around a dozen neighbouring landholders. A number of such groups provided input to an overarching Community Working Group. By integrating this input, each of these overarching groups developed a local plan of action reflecting the views of most affected landholders (Wilkinson and Barr 1993). Inspired by Landcare and similar programs in other states, the National Farmers’ Federation and the Australian Conservation Foundation made a joint submission to the Commonwealth Government which led it to establish the National Landcare Program (NLP) in 1989. The $340 million it allocated to the program over a decade was a quantum leap in government funding for natural resource management in rural areas. The Commonwealth’s original emphasis in the NLP was on ‘kick-starting’ local activity by supporting the formation and facilitation of Landcare groups, education and awareness-raising activities, demonstration sites, and so on (Curtis 1998; Woodhill 1997). Local people were expected within a decade to become sufficiently empowered by their engagement with the program that they could take over responsibility for Landcare-type activities in order that ongoing government support would become unnecessary. 1.1.3 Integrated catchment management From the early 1980s also, state and territory governments began focussing on the concept of ‘integrated catchment management’ (ICM) in recognition of the interdependence of natural resource management issues (e.g., soil conservation and water quality) within a catchment, and the consequent need to ensure that agencies assigned issues cooperated in order to address these issues as an integrated whole. Momentum in operationalising this concept grew particularly once it was advocated in the National Soil Conservation Program. The catchments delineated for ICM programs were normally much larger than the local landscapes around which landcare groups formed. Community representatives were in the majority on the catchment management bodies charged with developing catchment-level strategies for on-ground conservation efforts. Given fears that ‘a regulatory approach to ICM could focus farmers’ energies on resisting interference by bureaucrats rather than on improved land management’ (Hollick 1992 p.51), these bodies were expected to achieve voluntary cooperation from those they depended on for implementation of their strategies. The NLP envisaged landcare groups as playing a key role in facilitating this voluntary cooperation in the case of landholders. The focus of the NLP on fostering local self-help made state and territory governments particularly interested in landcare groups as vehicles for running ICM programs with modest additional
4
budget outlays. For instance, Cunningham (1988 p.43), then the Chief of Services for the NSW Soil Conservation Service, argued that ‘[i]n today’s economic climate where governments are faced with escalating non-discretionary expenditure, it is essential that notions of self-help be promoted to achieve catchment management. No longer can the Government foot the bill for catchment protection ...’. As well as being counted on for on-ground implementation of catchment management strategies, landcare groups were also relied on heavily in early ICM programs as vehicles for connecting catchment management bodies with their constituencies (Curtis and DeLacy 1998a). Nevertheless, it proved difficult to accommodate Landcare groups under ICM programs in ways that did not distance them from their ‘grass roots’. These programs were designed typically by governments from the ‘top down’, and thus viewed suspiciously by many rural people (Martin et al. 1992). Moreover, a weakness identified in all states was the lack of attention paid to developing relationships between these programs and landcare groups (AACM and the Centre for Water Policy Research 1995). 1.1.4 The Natural Heritage Trust 1.1.4.1 Origins In 1997, with about two years of the NLP left to run, the Commonwealth Government established the Natural Heritage Trust (NHT) with a contribution of $1.25 billion over five years. The establishment of the NHT was attributed in part to criticism from farmers that insufficient NLP funds had been directed towards on-ground conservation activity (AACM and the Centre for Water Policy Research 1995). Consequently, the focus of the NHT was clearly oriented towards on-ground implementation (Curtis and Lockwood 1998b). The Commonwealth sought through the NHT to strengthen upward accountability within funding processes by means of Partnership Agreements. These agreements viewed the states and territories as partners with the Commonwealth (Howard Partners 1999). It formalised the roles of Regional Assessment Panels (RAPs) and State Assessment Panels (SAPs) in evaluating and providing advice regarding NHT funding applications. A specific requirement was that RAPs assess funding applications according to integrated regional strategies. The RAPs and SAPs were required to have majority community membership and be chaired by a community representative. In response to these requirements, state and territory governments generally supplemented their existing ICM structures (Gardner 1999). 1.1.4.2 Influences from New Public Management The Howard Government termed the approach to cooperative federalism pursued through the NHT as ‘effective federalism’, the performance criteria for which were efficiency of delivery, effectiveness of outcomes, and enhancement of intergovernmental relations (Crowley 2001). Effective federalism was influenced strongly by ideas from New Public Management, which by that time had become the dominant paradigm for public sector management in Australia. New Public Management is an approach to government: (i) whose advocates contend that private sector management models and techniques can be applied in the public sector; (ii) that involves commitment to provision of public services by a mixture of firms, non-profit organisations and government actors, with the precise mixture of each in any case depending on their competitiveness in terms of cost and quality; (iii) that corresponds with a revised role for government in providing public services, characterised as ‘steering not rowing’; (iv) that presumes strong roles for markets and quasi-market mechanisms in coordinating supply and demand for public services; and (v) seeks separation between political decision-making and the management of public services. Central to the second aspect of this approach has been ‘contracting out’, involving ‘purchaser-provider partnerships’ in which government retains overall responsibility for provision of public services but not for their delivery (Carroll and Steane 2002). When the New Public Management was conceived in the early 1990s, it represented more a point of view than a fully-established concept (Barzelay 2002). This viewpoint shared much in common with neo-liberalism, which advocates the roll-back of government and the welfare state, and the roll-out of new forms of governance seeking to promote the autonomy and self-reliance of citizens (Stratford et al. 2007).
5
Intellectual legitimacy for the viewpoint of New Public Management came largely from mainstream economics, which in the mid-20th century had stepped in with scientific justification for a modified form of Progressive governance after Simon (1946) exposed deep flaws in the original justification drawn from administrative science. With the Progressive aspiration of achieving all public goals through direct administration discredited as unworkable, economists proposed that this aspiration be revised to one of achieving public goals wherever possible by government intervening in the market on the basis of economic advice. The new approach to Progressive governance thus came to involve political definition of objectives leading into realisation of those objectives via centralised expert-guided government manipulation of the ‘market mechanism’ (Marshall 2005; Nelson 1987). Ideas from New Public Management thus became interpreted largely through the lens of mainstream economics when shaping them into concrete proposals for public policy (Barzelay 2002). The economic theory of agency was particularly influential. Agency theory holds that it is feasible for any ‘principal’ (e.g., government) to design centrally an incentive system that aligns to its own interests the interests of all ‘agents’ (e.g., landholders) on which it depends (Miller 1992). Accordingly, it has offered central governments and their advisers intellectual grounds for confidence that successful institutional arrangements for purchaser-provider partnerships could be designed wholly from the ‘top down’; that is, by central governments as purchasers without requiring substantive ‘bottom-up’ input from their provider-partners. Such confidence has been evident in how effective federalism has been pursued in Australia, including in how the NHT and subsequent national NRM-funding programs have been conceived and designed. 1.1.4.3 Pressures to reform the NHT Only a year after the NHT was established, pressures were emerging at the Commonwealth level to modify the NHT in ways more likely to satisfy the performance criteria set for effective federalism. One reason was the emergence of dryland salinity as a major national NRM issue, as highlighted by the Prime Minister’s Science, Engineering and Innovation Council (PMSEIC) (1998). The Council argued that investigations and actions concerning dryland salinity needed to match the geographical scale of the problem, and observed that this ‘appropriate scale … is typically regional or catchment-wide in the eastern states’ (ibid. p.8). PMSEIC argued that existing community-based arrangements – referred to as ‘local action (Landcare) groups driving on-ground responses under regional planning and coordination of resources by catchment committees’ – were fundamental to successfully addressing the salinity problem at the regional scale (ibid. p.15). In 1999, Managing Natural Resources in Rural Australia for a Sustainable Future: A Discussion Paper for Developing a National Policy was circulated for public comment by Agriculture, Fisheries and Forestry – Australia (AFFA) (1999). The paper discussed ‘a possible overarching policy framework for natural resource management in rural Australia, particularly as it relates to the agricultural and pastoral sectors …’ (ibid. p.iii). While PMSEIC (1998) argued only that the regional scale was most appropriate for addressing eastern-state dryland salinity problems due to the dispersed biophysical scale of these problems, the new paper proposed more broadly that ‘[r]egional approaches provide a means of considering environmental, social and economic problems facing rural areas in an integrated way’ (AFFA 1999 p.14). The Discussion Paper went further by proposing a ‘regional block funding’ investment strategy. Provided that regional NRM organisations developed strategies reflecting priorities established by the Commonwealth and the relevant state, they would be devolved authority to manage the funds required to implement the strategies. These organisations would be held accountable to investors and also stakeholders in the regional community for the use of funds and for reporting on progress towards agreed outcomes. The need to strengthen accountability of regional and local NRM organisations entrusted with authority to spend public funds had earlier been emphasised in the Industry Commission’s (1998) report on its inquiry into ecologically sustainable land management in Australia. The Commission acknowledged the strengths of the ‘bottom up’ approach to NRM exemplified by Landcare activities, but also identified weaknesses in terms of ‘the commonality of local interests may not reflect wider priorities of national significance and the

6
risk of funding being captured for private gain at the expense of net public benefit’ (ibid. p.367). It proposed that accountability under the NHT be enhanced by establishing goals and performance indicators for each decision-making level (Commonwealth, state, regional and local) against which performance levels could be measured. Organisations at each level would be subject to reporting and audit requirements in order to ensure transparency in the funding process. Howard Partners (1999 p.212) revealed that ‘one interpretation of project monitoring that was put during the [NHT mid-term] review was that the NHT can go no further than receive an assurance that the funds have been expended on the stated and identified purposes’. They expressed dissatisfaction with this interpretation and concluded that project monitoring presents a major challenge for NHT administration. A year later, the House of Representatives Standing Committee on Environment and Heritage (2000 p.56) remarked similarly that, although NHT funding usually depends on the recipient entering an agreement to achieve specified goals, ‘these agreements are not always sufficiently rigorous, strictly enforced or closely monitored. … The Committee believes that because of this a large proportion of NHT funding has not been used to best effect’. 1.1.5 The ‘regional delivery model’ 1.1.5.1 National Action Plan for Salinity and Water Quality In October 2000, the then Prime Minister John Howard (2000) called a press conference to announce that the Commonwealth would be proposing to the states, at the Council of Australian Governments (COAG) meeting in early November, a ‘major action plan to address the longstanding problem of salinity and water quality in Australia’. The plan would be funded by the Commonwealth to the tune of $700 million over seven years, provided the states matched this funding. The Prime Minister explained that the proposed action plan had been devised by Commonwealth officials with assistance from outside experts. When asked why the Commonwealth had not consulted with the states prior to announcing the action plan, the Prime Minister replied that the salinity and water quality problem:
... had been the subject of multiple submissions and in the end I got tired of trying to assimilate all the material and I suggested that we get four or five people who really understood the issue to draw up an action plan and we’d send it to the States. My experience of Commonwealth State negotiations is that you’ve got to … press the button to get the time running otherwise nothing ever happens (Howard 2000).
The proposed national plan – the National Action Plan for Salinity and Water Quality (commonly abbreviated to the National Action Plan or NAP) – was endorsed by the Commonwealth and state governments at the COAG meeting. A document Our Vital Resources endorsed by COAG (2000) provided further details of the plan, which were consistent with the directions anticipated in the Commonwealth-level policy deliberations reviewed in section 1.1.4.3. Catchments, or regions where salinity was not associated with river systems, were identified as the most effective level for engaging the community in addressing dryland salinity and water quality problems. The NAP would address the catchments or regions most affected by these problems and with potential for cost-effective preventative action. The original selection of catchments and regions was identified by the Commonwealth based on data from the National Land and Water Resources Audit. For accountability reasons, the communities of these priority regions would be organised into appropriate bodies, each block-funded on the basis of an integrated NRM plan accredited jointly by the Commonwealth and the relevant state or territory government. Together with the Commonwealth, all state and territory governments signed an Intergovernmental Agreement (IGA) on the NAP (Commonwealth of Australia c2001), the purpose of which was to establish implementation arrangements for the program. The IGA named 21 priority regions to which NAP block funding would be provided. It specified that catchment or regional bodies should, inter alia, demonstrate: transparency and equity in decision making, and effective mechanisms for participation by all relevant stakeholder groups; technical capacity for the development and accreditation of accredited catchment/regional plans or the ability to co-opt this capacity; and adequate arrangements for
7
administration, financial management and accountability for implementing the catchment/regional plan and delivering agreed outcomes. The catchment/regional bodies would develop specific targets for a range of NRM biophysical indicators that are consistent with national standards, and these targets would be ‘based on good science and economics’. The IGA specified that the Commonwealth and the relevant state would develop a Partnership Agreement with each catchment/regional body in respect of implementation of its accredited catchment or regional plan. Each Agreement would identify inter alia: agreed outcomes to be achieved; performance standards and milestones; accountability and reporting mechanisms; and compliance measures and penalties. Ongoing funding to each catchment/regional body would depend on the community it represents satisfying the specified milestones and performance standards detailed in the relevant Partnership Agreement. Progress against biophysical targets, performance standards and milestones would be independently audited (as would financial management by the catchment or regional body). Each Agreement would be developed in the context of a Bilateral Agreement negotiated between the Commonwealth and the relevant state government. Each Bilateral Agreement would specify inter alia: the process for accrediting catchment/regional plans within that jurisdiction; agreed policy reforms and milestones for each jurisdiction; and dispute resolution arrangements. 1.1.5.2 Extension of the Natural Heritage Trust In its 2001 budget, the Commonwealth extended the NHT for a further five years, from 2002-03 to 2006-07, by contributing an additional $1 billion. Although investment during the extension was to occur at three levels – national/state, regional and local – regional investment was to be the principal delivery mechanism. Regional investment under the NHT would follow the NAP model, including Bilateral Agreements, Partnership Agreements and investment against accredited plans (Environment Australia et al. 2002). The NHT during its extension (NHT2 hereafter, in contrast to NHT1 for the original program) would apply to all the NRM regions (now 56) distinguished across Australia. It addressed a broader range of NRM problems than the NAP, and consisted of four programs: Landcare, Bushcare, Rivercare and Coastcare. In the NAP priority regions, delivery of NHT and NAP funds were integrated subject to meeting separate auditing and evaluation requirements for the two programs (ibid.). The inter-linked institutional arrangements for the NAP and NHT2 became known as the ‘regional delivery model’. This moniker identified the model as essentially a New Public Management exercise in ‘contracting out’. Federal and state governments retained primary responsibility for provision of NRM outcomes with public-good characteristics, essentially through making funds available for investing in on-ground actions. Responsibilities for delivering these outcomes were assigned to government-designated regional bodies which were conferred rights to allocate these funds between investment options, albeit subject to contract-like Partnership Agreements. Progressive ideas and agency theory were reflected in how the model was conceived from the top down, and in governmental presumptions that they could and should design from the top down the key elements of the model. Progressive ideas were reflected too in the emphasis on scientific and economic evidence as a lynchpin of keeping regional bodies accountable for the outcomes they had been ‘contracted’ to deliver. 1.1.5.3 Extension of the regional delivery model Towards the end of the period for which government funding of the regional delivery model had been committed, the Commonwealth commissioned a number of reviews to inform its deliberations of whether to fund the model for a further period. Reviews by WalterTurnbull (2005) and Keogh et al. (2006) recommended that the model be continued. The first of these, commissioned by the Commonwealth Departments of Environment and Heritage, and of Agriculture Fisheries and Forestry, found ‘there was widespread community acceptance, understanding and ownership of the regional delivery model as the basis for the delivery of NRM programs. Any change to the delivery framework could result in considerable disengagement of the community, and have a significant impact on the level of commitment from the community to provide resources to delivery of NRM outcomes under a different delivery model’ (WalterTurnbull 2005 p.4). The second review was by a

8
Ministerial Reference Group commissioned by the Ministerial Board for the NHT, and found similarly ‘there was overwhelming support for the regional delivery of NRM across Australia. … [T]here should be some refinement, but any change should be based on the principle of ‘evolution rather than evolution’’ (Keogh et al. 2006 p.6). Consistent with these findings, the Commonwealth Government announced in May 2007 that its funding of the regional delivery model would continue for at least the five years 2008-09 to 2012-2013. The model would continue over this period as Phase Three of the Natural Heritage Trust (NHT3). The NAP would be merged with the NHT to ‘reduce red tape and allow more integrated investment’ (Australian Government 2007). The almost $400 million of Commonwealth funds committed per year would maintain ‘the average combined funding under the NAP and NHT2 over the past seven years’ (ibid. p.1). 1.2 Challenges in making the regional delivery model community-based The foregoing brief account of the evolution of community-based programs of delivering public funding for conserving natural resources in Australian rural areas since the early 1980s highlights how malleable the concept of ‘community-based’ has been through the eyes of the governments sponsoring these programs. Even so, the original vision in pursuing a community-based approach – namely, that such an approach would enhance voluntary cooperation of conservation measures – persists in recent policy documents concerning the regional delivery model. The Framework for Future NRM Programmes endorsed by the Natural Resource Management Ministerial Council (2006 p.5), which heralded the continuation of the regional delivery model, claimed for instance that ‘strategic landscape-scale change is most effectively achieved where communities have a sense of ownership over planning and investment decisions, and will therefore make the investments of time, resources and better practices that are needed to achieve better NRM outcomes’. In this section, we discuss two key aspects of how policy-makers’ perceptions of community-based NRM have evolved since the 1980s, and how the resulting changed expectations present challenges to delivering on the vision that continues to motivate adoption of this approach. The aspect discussed first concerns the increasing size and diversity of the populations that policy-makers have assumed could be meaningfully engaged with a community-based approach. The aspect discussed second concerns the challenges presented to ‘grassroots’ engagement with a community-based approach by an increasing emphasis on upward accountability of decisions made under this approach. 1.2.1 Widening the scale of community-based processes The community-based groups focused on by the National Landcare Program launched in 1989 typically comprised between 10-30 landholders located in the same district or subcatchment. These groups tended to operate with minimal formality. ICM programs established from the mid-1980s were also referred to as community-based, although the community-based structures focused on in these programs represented the populations of entire river catchments. Governments prescribed formal rules under which these structures were to operate (e.g., regarding appointment of community representatives), and expected these catchment structures to coordinate landcare and other relevant community-based groups focused more locally. With the introduction of NHT1 in 1997, these catchment structures (or at least the Regional Assessment Panels, or RAPs, created largely from their members) were expected to operate at yet a higher level of formality and professionalism. In some cases, state and territory governments responded to these expectations of greater professionalism and accountability by rationalising the number of catchment structures they needed to administer and otherwise support. The launching of the regional delivery model in 2000 was the latest leap in how governments have come to conceptualise ‘community-based’ in the context of delivering funds for on-ground implementation of NRM decisions. In some states, the regions defined under this model tended to be appreciably larger than the catchments for which RAPs had been appointed under NHT1.

9
Under NHT1, for instance, the RAP responsible for recommending on funding of on-ground project proposals within the Blackwood River catchment (known as the ‘Blackwood Basin’) was associated with the Blackwood Basin Group (BBG). This catchment comprised 22,570 km2 and 37,000 people. Under the regional delivery model, in comparison, decisions regarding funding of on-ground actions in the Blackwood Basin were made the responsibility of the South West Catchments Council (SWCC). Aside from assuming this responsibility for funding decisions in respect of this particular catchment, SWCC was also made responsible for funding decisions in five neighbouring catchments which had accessed NHT1 funding through their own pre-existing structures. At 51,657 km2, the area of the (South West Catchments) region under SWCC’s responsibility is 2.3 times greater than that over which the BBG had earlier been expected to operate as a community-based organisation. The attempted up-scaling of community-based NRM was even more ambitious population-wise, given that the region’s population of 193,000 is 5.2 times greater than the population of the Blackwood Basin. Whether the result of the rationalisation of ICM structures that occurred under NHT1 or the regional delivery model, the set of 56 regional bodies across Australia expected to make the regional delivery model community-based is appreciably smaller than the set of catchment management structures that were originally established across the same area to make ICM programs community-based. In 1998, for instance, the ICM program in New South Wales (NSW, known there as ‘Total Catchment Management’) alone consisted of 48 catchment management structures (45 catchment management committees and three catchment management trusts) (Farrier et al. 1999). The effect in introducing NHT1 and the regional delivery model of reducing the number of organisations across the nation expected to make NRM community-based was that the remaining organisations were left, on average compared with their predecessors, with larger and more diverse populations to work with in establishing the ‘community ownership’, ‘community engagement’ and so on that policy documents presumed would lead their constituents (‘grassroots’) to cooperate more voluntarily in implementing their decisions. COAG’s (2000) statement in launching the regional delivery model, that the regions defined for this model constitute the most effective level for engaging the community in addressing NRM issues, was based primarily on evidence from biophysical scientists that key NRM problems like dryland salinity and biodiversity decline occur and interact at the geographic scale of fairly extensive regions – as well as on their arguments that integrated management of these problems required broadening the social scale of decision-making to match this geographic scale. No evidence from social scientists has since been cited by policy-makers regarding the degree to which constituents might effectively be engaged at this level, and whether this degree of engagement would generate ‘community ownership’ and other social dynamics (e.g., peer pressure, trust, legitimacy) strongly enough to realise the professed aim of strengthening constituents’ voluntary cooperation in implementing region-level decisions. Nevertheless, the Framework for Future NRM Programmes (Natural Resource Management Ministerial Council 2006 p.5) stated that ‘the community ownership principle … reinforces the biophysical importance of the region as a basic unit for NRM programme delivery’. Policy-makers’ continuing confidence that community-based NRM could succeed at the level of extensive and populous regions, by delivering greater grassroots cooperation than would decentralisation of corresponding governmental functions to the same level, would appear to derive from two main sources. The first main source was accumulating evidence from international research since the mid-1980s demonstrating that members of local communities could, under suitable conditions, cooperate successfully to establish, monitor and enforce institutional arrangements capable of sustaining natural resources on which they jointly depended. This evidence readily became interpreted through the neo-liberal lens as justifying widespread devolution of environmental management functions from governments to community-based structures. The attraction from this perspective was not only in rolling back the state, but also in reducing the costs of these functions by (a) creating competition between the multiple structures to which they had been devolved, and (b) capitalising on the superior ability of community-managed organisations to motivate voluntary contributions of resources from their members. The second main source of policy-makers’ confidence would seem to come from the economic theory of agency, which, as discussed in section 1.1.4.2, holds that it is feasible for any principal (e.g., government)

10
to design centrally an incentive system that aligns to its own interests the interests of all agents (e.g., landholders) on which it depends. This theory offered policy-makers confidence that design of the regional delivery model could be imposed from the top down as with any other New Public Management exercise in purchasing delivery of public services from private providers. It suggested that governments could set the key parameters of the regional development model (e.g., scale of regions) in accordance with their own imperatives, without compromising their ability to devise incentive systems (e.g., through partnership agreements) capable of motivating the populations of each region to engage with the model and cooperate voluntarily with decisions made under its auspices. The first source of confidence for policy-makers is questionable given that the research underpinning it demonstrated only that local communities can, under suitable conditions, successfully govern themselves to sustain the natural resources on which they depend. The largest of the communities found by Ostrom (1990) to have successfully sustained their natural resources through self-governance comprised 15,000 persons, which clearly is much more localised than the populations of hundreds of thousands found in some of the regions defined for the regional delivery model. Even for local communities, however, successful environmental self-governance is heavily contingent on whether a range of internal and external factors are conducive to success. Ostrom (ibid.) distilled these factors into eight design principles, by which she meant essential conditions helping to explain the success of community-based regimes in sustaining the natural resources within their jurisdictions and gaining continued compliance with the rules they have set. From a subsequent review of research in this field, Agrawal (2002) concluded that the total number of conditions important for sustainable local governance of natural resources lies between 30 and 40. The second source of confidence for policy-makers is also questionable, especially because regional NRM bodies differ from ‘conventional’ private providers of public services (e.g., firms) which have substantial powers to direct the behaviour of the people they depend on (e.g., staff) for delivering the services they have undertaken to provide. Regional NRM bodies are unable to direct the behaviour of most of the people they depend on (e.g., landholders) to deliver the NRM outputs and outcomes they are ‘contracted’ to provide in return for public funding. Instead, they must rely on gaining voluntary cooperation from these people. Even to the extent that this voluntary cooperation is ‘bought’ by regional bodies offering financial inducements (e.g., on a cost-sharing basis), the degree of voluntary cooperation motivated through such measures is normally difficult for regional bodies to predict at the time of negotiating what they will provide for a given level of public funding. The amount of cooperation actually bought will depend on a range of factors, including the degree to which the desired behaviour changes are already perceived by landholders (or other relevant regional constituents) as helping or obstructing pursuit of their goals – and unbiased feedback on such perceptions is normally not easy to obtain. If such prediction is difficult for regional bodies, it is appreciably more so for distant governments. This indicates again that governmental confidence that community-based NRM could succeed at the scale of the regional delivery model’s 56 regions, by motivating greater voluntary on-ground NRM action than would otherwise occur, may have been misplaced. 1.2.2 Increasing accountability demands on community-based processes Aside from the challenges of realising benefits from a community-based approach through the regional delivery model given the large populous regions through which it operates, further challenges were presented by the model’s emphasis on upward accountability of regional bodies to governments. As discussed in section 1.1.4.3, administration of NHT1 was criticised for failing to adequately monitor and enforce the agreements under which funds were allocated to landcare, catchment and other groups. Under the regional delivery model, much of the responsibility for this monitoring and enforcement activity was shifted to the 56 regional bodies. Another aspect of accountability that governments sought to strengthen through the regional delivery model was concerned with ensuring that the public funds distributed to regional bodies are allocated by them to on-ground investments which contribute cost-effectively to conserving the key natural assets of their regions. As discussed in section 1.1.2, early government support for community-based NRM through the NLP took the form of ‘kick-start’ funding. Consequently, the available funds were spread thinly across numerous small groups and their activities. The administrative complexities associated with allocating

11
public funds according to anticipated public benefits, as well as ensuring accountability, were largely avoided by restricting funding of activities on private land to those with a very clear public benefit. However, this emphasis led to criticisms that funds were being spent too much on planning, education and awareness-raising activities and not enough on directly financing on-ground NRM activity, and subsequently to the NHT targeting on-ground implementation. Woodhill (1997 p.2) observed that the Commonwealth’s shift to an implementation model of funding opened ‘a can of worms’. With such a model, funding requests would need to be prioritised, and these priorities would require justification. The process of setting priorities would in turn need to be accepted widely as legitimate in order to avoid generating conflict and thus high transaction costs. The NHT1 arrangements sought to establish this legitimacy by formalising the roles of RAPs and SAPs in priority setting. However, the easiest way for these bodies to avoid provoking conflict when setting funding priorities was to emphasise equity over efficiency and, consequently in most cases, to continue spreading funds thinly over numerous small projects. Frustration with this state of affairs was reflected in the regional delivery model’s emphasis on regional bodies demonstrating to the governments funding them that their investment decisions were based on good science and economics. The clear expectation was that this would result in regional bodies focusing their funds on fewer, more targeted, on-ground investments. Regional bodies were expected accordingly to start making the tough decisions that RAPs and SAPs had been expected to make, but largely avoided, during NHT1. They would need to resolve conflicts arising in their decision-making, and guard against suspicions and allegations along the lines of ‘playing politics’, favouritism, parochialism and lack of equity. Early in the development of the regional delivery model, Marshall (2002 p.102) observed that the effect of governments imposing these accountability demands on regional bodies was:
… to transfer the political problem of sanctioning individuals’ compliance with their community’s commitments from government – where mostly it has remained in the ‘too-hard basket’ – to the community itself. Even where this sanctioning is based on inducements rather than penalties, the community’s task of deciding on eligibility rules for those inducements will inevitably result in some individuals benefiting more than others and thus some degree of disquiet or conflict. It seems that it was for this reason that Booth (in Booth and Hooper (1996 p.28)), one of the architects of the New South Wales Government’s Catchment Management Act 1989, argued that granting ICM organisations regulatory powers would ‘kill’ their prospects of gaining voluntary cooperation from their constituents – who, he believed, would soon come to trust them as little as politicians and bureaucrats more generally.
Aside from the risk that devolving responsibilities for maintaining accountability to community-based organisations might undermine their capacity to gain trust from their constituents, there are other potential costs that appear not to have been considered in policy deliberations surrounding the regional delivery model. One cost of this kind relates to the negative effects that the ‘red tape’ demands of satisfying accountability conditions can have on motivations to undertake on-ground investments dependent on public funding. In the report of its inquiry into ecologically sustainable land management, for instance, the Industry Commission (1998 p.360) noted receipt of a submission from the Queensland Grain Growers Association expressing concern that ‘over-insistence [in NHT1] on short-term accountability by community groups has reached the point where it is demotivating some groups …’. A related cost can arise to the extent that the paperwork associated with satisfying accountability conditions skews the allocation of funding towards groups that are more proficient in administration than at conceiving, designing and implementing worthwhile projects. Strengthening accountability measures can impose further costs through discouraging innovation in project design and implementation. As observed by Carr (2002 p.150), this effect arises from the conventional ‘preoccupation with things numeric’ in accountability arrangements, such as ‘length of fence lines established or number of trees planted’. Factors that are difficult to measure but important for successful NRM tend to get sidelined as a result.

12
Marshall (2002 p.102) observed that government policy documents had ‘glossed over’ the possible threat to ‘the original vision of ICM as a vehicle for promoting voluntary cooperation of conservation measures’ posed by demands for increased upward accountability of these processes. Nevertheless, based on lessons drawn from his research into community-based NRM at the scale of four adjoining irrigation districts in Australia’s Murray-Darling Basin, he concluded that:
… current proposals to institutionalise ICM investment arrangements more formally – by making ICM organisations accountable for cost-sharing commitments made to governments by the communities they represent – are not necessarily inconsistent with the original hope that these organisations would increase voluntary cooperation by landholders in implementing on-ground solutions to natural-resources degradation. Nevertheless, [the research] suggests also that the ability of ICM-type organisations to reconcile both sets of expectations depends critically on their capacity and commitment to providing their constituents with authentic opportunities to participate in deciding the shape of the cost-sharing obligations and the institutional arrangements for their enforcement. … Authentic opportunities for community participation in collaborative processes do not arise by accident. Creating them is itself a complex project that usually requires substantial investments of leadership, hope, time, skill and money. The benefit stream from these investments arises if and when communities come to comply more voluntarily with their cost-sharing commitments as a result, so that transaction (including political) costs of enforcing these commitments are avoided in some degree (ibid. p.110).
1.3 Towards ‘good science’ for community-based processes under the regional delivery model The bold steps taken in Australia’s regional delivery model towards up-scaling community-based NRM programs to the level of extensive regions, while also strengthening upward accountability of these programs, were driven largely by scientific arguments regarding the optimal biophysical scale for integrated management of natural resources and the frustrations of policymakers with the NLP and NHT1 models of community-based NRM. They have been guided little by knowledge of the social dynamics by which community-based initiatives operate and sometimes succeed. Focused on the Australian situation, Dovers (1999 p.100) remarked accordingly that ‘... the very rapid growth in community-based [environmental governance] programs follows no apparent coherent design or intent ...’, and Mobbs and Dovers (1999 p.4) contended that many such programs ‘are in place before any sound proposition of how they might work has been formulated’. Lack of regard for social-scientific knowledge in this field is not limited to Australia. From a review of ICM-like initiatives around the world (often referred to elsewhere as ‘watershed management’), Rhoades (2000 p.333) found that the social knowledge underpinning the design of community-based programs of watershed management was ‘almost entirely anecdotal’. This may seem ironic given that, as observed in section 1.1.1.1, the original impetus for adoption of community-based approaches to environmental management came from social-scientific findings from scholars of common property and political ecology demonstrating that participation by community members in managing their common natural resources could sometimes, under suitable conditions, successfully sustain those resources rather than – as previously assumed – consign them to ‘tragedies of the commons’. As discussed in section 1.2.1, however, these nuanced findings became interpreted simplistically by governments and international organisations that had come under the influence of neo-liberal ideology and embraced the findings (with caveats removed) as justifying new avenues for ‘rolling back the state’ and solving fiscal crises by devolving responsibilities for natural resources governance to communities. Nevertheless, the Framework for Future NRM Programmes, (Natural Resource Management Ministerial Council 2006 p.1) which heralded continuation of the regional delivery model beyond 2008, was ‘based on the common understanding of jurisdictions that … an adaptive management approach based on continuous learning should continue to underpin the delivery of NRM services’. Proponents of adaptive management regard policy interventions in social-ecological systems as hypotheses to be tested and learned from

13
(Bellamy and Johnson 2000). Theory from which hypotheses can be deduced is essential if adaptation according to this paradigm is to be more efficient than random trial and error (Marshall 2003; 2005). Effective adaptive management of the community-based governance under the regional delivery model will therefore not be possible without policy-makers moving beyond anecdotal evidence to re-engage with relevant theoretical advances from the social sciences since the 1990s, when adoption of community-based approaches became driven by ideology and fashion rather than judicious interpretation of knowledge available from the social sciences. Of course, such a move is required also if the regional delivery model is to operate on the basis of ‘good science’ as prescribed when the model was introduced. The research discussed in this report was undertaken with the aim of helping policy-makers make this move. It was motivated particularly by theoretical developments concerning the possibility of extending community-based approaches to environmental management beyond the scale of small local communities at which early research found these approaches could sometimes succeed. More specifically, it was spurred by the eighth of the design principles for sustainable community (‘common property’) governance of natural resources that Ostrom (1990) distilled from 14 cases where shared natural resources had been managed over multiple generations by a long-enduring regime of common property. This eighth design principle states that for long-enduring regimes of common-property management of larger, more complex, natural resource systems, ‘appropriation, provision, monitoring, enforcement, conflict resolution, and governance activities are organized in multiple layers of nested enterprises’ (ibid. p.90). She illustrated the concept of nested enterprises with a number of examples including the one following:
There are two distinct levels in the Philippine federation of irrigation systems. The problems facing irrigators at the level of a tertiary canal are different from the problems facing a larger group sharing a secondary canal. Those, in turn, are different from the problems involved in the management of the main diversion works that affect the entire system. Establishing rules at one level, without rules at the other levels, will produce an incomplete system that may not endure over the long run (ibid. p.102).
Although this principle was not intended as a prescription for institutional design, it has served as a point of departure for researchers concerned with how community-based approached to environmental management might succeed in settings larger and more complex than small groups and localised communities. This has been the case for a number of researchers (Bellamy et al. 2002; Marshall 2001; McKean 2002; Musgrave 2002; Reeve 2003; Reeve et al. 2002) seeking a scientific basis for adaptive management of community-based governance under Australian ICM programs. The relevance of the ‘nesting principle’ to the vision behind the community-based approach to regional NRM delivery in Australia is clear from McKean’s (2002 p.8) finding that ‘nesting small groups inside of larger ones encourages a lot of the work to occur in smaller groups than otherwise, promotes the solidarity of subunits and this elicits more cooperation and higher contributions of effort, and reduces transaction and enforcement costs’. Nevertheless, McKean’s finding was not based on research specific to the circumstances of Australia’s regional delivery model. The largest of the cases from which Ostrom (1990) distilled the nesting principle comprised 15,000 persons. It seems only Marshall (2001; 2002) has analysed empirically the contribution that nesting of community-based NRM can make in Australia by increasing voluntary cooperation with decisions reached under this approach. Although he found that nesting did make such a contribution in the case studied, this case (focused on managing and adapting to rising watertables within four neighbouring irrigation districts) was appreciably smaller in scale and less complex in focus than the regional cases found under the regional delivery model. The research presented in this report thus seeks to make an original and useful contribution by providing empirical evidence of the relevance of the nesting principle to community-based processes under the regional delivery model and of how nesting of such processes can help them succeed in eliciting higher levels of voluntary cooperation from constituents than would otherwise be possible. On the basis of this limited contribution, it is hoped policy-makers will be better able to pursue adaptive management of these community-based processes consistently with the regional delivery model’s professed allegiance to ‘good science’.

14
Prior to discussing the empirical research in subsequent chapters, we turn in the next section to reviewing key elements of the theory developed by scholars of common property to explain the contribution that nesting of community-based processes can make to voluntary cooperation by individuals and other parties in implementing the decisions made in those processes. This stream of multi-disciplinary scholarship has widened enormously since its 1980s origins, and remains at the forefront of scientific efforts to understand how community-, market- and government-based approaches work and interact in specific circumstances (van Laerhoven and Ostrom 2007). 1.4 Theory for nested governance of complex social-ecological systems The potential advantages of nested governance for large-scale and otherwise complex problems of environmental management are evident from various theoretical perspectives of common property scholarship, including the related ‘collective action’ and ‘complexity’ perspectives (van Laerhoven and Ostrom 2007). These complementary perspectives are discussed in turn below. 1.4.1 The collective-action perspective The collective action perspective begins with Olson’s (1965) recognition, as distilled in his foreword to Sandler (1992 p.xiii), that ‘there is an externality2 inherent in all collective good situations, in that each individual’s provision of any amount of a collective good would confer some benefit to others’. He recognised also, as follows, that this externality problem tends to become more serious with increasing group size:
... the larger the group, the smaller the fraction of the total group benefit any person acting in the group interest receives, and the less adequate the reward for any group oriented action, and the farther the group falls short of getting an optimal supply of the collective good, even if it should get some (ibid. p.48).
In other words, the chance of a group being ‘small’ or ‘privileged’ – such that ‘each of its members, or at least some of them, has an incentive to see that the collective good is provided, even if he has to bear the full burden of providing it himself’ – would decline as group size increased (ibid. p.49). Based on this reasoning, the expression ‘free riding’ was coined to describe a situation where group members stint in their own provision efforts in the hope that other members with a greater interest exist and will make up the shortfall (Sandler 1992). Olson found that free-riding would rule in what he called ‘large’ groups, which would therefore be unable to provide themselves with collective goods. He defined a group as large when it reaches the size that ‘each member … is so small in relation to the total that his action will not matter much one way or the other’ (ibid. p.62), thus making it irrational for group members to incur the costs of punishing each other’s free-riding. This ‘free-rider problem’ became translated by game theoreticians into an assurance (trust) problem, where obstacles to collective action derive from the difficulties group members face in assuring one another they will reciprocate each other’s cooperation, rather than free-ride on it. Key insights into how such obstacles are sometimes surmounted came from computer-based tournaments run by Axelrod (1984 p.12) to test his hypothesis that:
What makes it possible for cooperation to emerge is the fact that the players might meet again. This possibility means that the choice made today not only determines the outcome of this move, but can also influence the later choices of the players. The future can therefore cast a shadow back upon the present and thereby affect the current strategic situation.
2 An externality arises when the actions of one independent agent hold uncompensated implications for another (Bromley 1989).

15
The strength of this ‘shadow of the future’, Axelrod recognised, is inversely related to how much individuals discount the importance of possible future interactions relative to certain interactions in the present. It is the opportunity cost to an individual of missing out on future rewards from the cooperation of others as a consequence of free-riding in the present. The cost to each individual depends on a range of factors including her expected rewards from continued cooperation, perceived risk of free-riding being detected, expected level of punishment associated with detection, and discount rate. Axelrod’s hypothesis was supported by his tournaments, which demonstrated that players following strategies of reciprocity (i.e., who reciprocate what other players do, whether it be cooperating or free-riding) can, if the shadow of the future is strong enough, compete successfully with strategies of unconditional free-riding. Moreover, the tournaments demonstrated that:
... cooperation can get started by even a small cluster of individuals who are prepared to reciprocate cooperation, even in a world where no one else will reciprocate. The analysis also shows that the two key requisites for cooperation to thrive are that cooperation be based on reciprocity, and that the shadow of the future be important enough to make this reciprocity stable (ibid. p.173).
The conclusions of Axelrod and Olson were consistent in so far as the shadow of the future cast on large groups, as defined above, is invariably too weak to motivate cooperation given the zero threat of free-riding being monitored and punished in such groups. Nevertheless, Olson recognised that large groups do sometimes manage to provide themselves with collective goods, and explained this as the result of these groups reorganising themselves into federated systems; i.e., as small groups of small groups, where ‘small’ signifies few enough members that it they are motivated to monitor and reciprocate each other’s actions. The logic of this explanation was incomplete, however, since no explanation was offered for how members of the large group might surmount their collective action problem of reorganising as a multi-level system of groups. The problem remained, therefore, of explaining how members of large groups sometimes establish the mutual trust in each other’s reciprocity they need to solve the assurance problems they face in providing themselves with multi-level organisation or any other kind of collective good. Ostrom (1998) completed the explanation when she concluded from a review of empirical evidence that adoption of reciprocity strategies, on the one hand, and mutual trust in others practising reciprocity, on the other, are mutually reinforcing. Adoption of reciprocity strategies requires trust that it will be reciprocated, rather than exploited, by others. Trust in others practising reciprocity grows when increased adoption of this strategy is observed. This increase in trust raises the expected reward from practising reciprocity, thus widening adoption of this strategy. Conversely, an observed decline in reciprocity (e.g., associated with increased adoption of unconditional free-riding) weakens trust in others practising reciprocity and thereby further undermines the adoption of reciprocity. Betts (1998 p.2) found accordingly that ‘a group can become engaged in a virtuous circle of reciprocal exchanges where trust and collaboration beget more trust and collaboration, or a vicious circle where defection and betrayal lead to more of the same’. It follows that if reciprocity-driven cooperation can gain a foothold in small groups encompassed by a large group, it might under supportive conditions advance through a virtuous circle to the scale of the large group. Ostrom (1990 pp.189, 190) found accordingly that ‘the marginal cost of building on [an] organisational base is substantially less than the cost of starting with no base. … Success in starting small-scale initial institutions enables a group of individuals to build on the social capital3 thus created to solve larger problems with larger and more complex institutional arrangements’. Multi-level governance of large groups can therefore be explained as ‘the eventual result of larger, more inclusive organizational units emerging from, and then ‘nesting’ … smaller, more exclusive units that manage to self-organize sooner.
3 Putnam (1993) defined social capital as features of social organisations, like trust, norms and interpersonal networks, which improve their efficiency by facilitating coordinated actions. Included among such norms are norms of reciprocity.

16
Smaller organizations thus become part of a more inclusive system without giving up their essential autonomy’ (Marshall 2005 p.47). The value of nesting lower-level units, rather than absorbing or sidelining them, follows in this collective-action perspective from the ‘vertical’ assurance problems that arise as governance becomes multi-levelled. Introducing a higher level assists lower-level actors with their ‘horizontal’ assurance problems (i.e., in establishing mutual trust between themselves) only to the extent that they trust the higher level not to fail them (Marshall 2004a; 2004b; Putnam 1993). The more that this ‘vertical trust’ is lacking, the greater will be the need for the higher level to incur the formidable transaction costs of coercing or ‘buying’ cooperation (e.g., by offering financial inducements), and the less consequently will the large group benefit from establishing the higher level. Retaining units that agents have self-organised, and minimising restrictions on their autonomy, helps with vertical assurance problems since agents can be expected to place greater trust in units they create for themselves and in which they maintain property rights to participate in collective decision-making. Minimising restrictions on the autonomy of existing units when introducing higher-level units is important for vertical trust in so far as existing units can serve to mediate between the necessarily different perspectives of the higher-level units and those of their own members, and thus reduces the risks that these differences will cause misunderstandings, suspicions and confusion with potential to substantially undermine vertical trust. 1.4.1.1 Nested governance as a multi-level system of ‘mediating structures’ Marshall (2002) observed how this finding corresponds with the recommendation of Berger and Neuhaus (1977 p.3) that policy-makers should become more cognisant of the vital contribution that the ‘mediating structures’ of civil society make to individuals feeling ‘more ‘at home’ in society, and the political order … more ‘meaningful’’ (ibid. p. 3). The value of this contribution, they argued, is the result of modernisation having created a political crisis by increasing the distance between the public and private spheres of life. Structures capable of mediating between the two spheres, by retaining capacity to present distinct ‘private’ (or ‘downward’) and ‘public’ (or ‘upward’) faces, had thus become increasingly valuable to both spheres. They protected individuals from the alienation of modern life, and strengthened the legitimacy of governments and other large organisations by helping them to connect with individuals’ perceptions, values and norms. A more detailed account of the relevance of this recommendation was provided by Marshall (2005 p.50) as follows:
In terms of Ostrom’s (1990) suggestion that we organise large-group collective action for managing natural resources in multiple layers of nested enterprises, the enterprises at each level can usefully be thought of as mediating structures – making it more possible to grow vertical trust in the part of the organisational system where the enterprises are situated by breaking into more achievable steps what otherwise may be an alienating cultural distance. Organisational nesting of this kind provides increased scope for making formal institutional interventions consonant with the informal institutions, including social norms, already at work in particular settings such that ‘informal processes of social control largely subsume the cost of monitoring and enforcement’ (Nee 1998 p.88).
The particular relevance of the mediating structures concept to Australia’s regional delivery model has been highlighted previously. Marshall (2002 p.104) observed that ‘[t]he concept of mediating structure fits neatly with the original charter of regional ICM organisations, viz. to foster voluntary cooperation between communities and governments in implementing solutions to natural-resources problems’. The original aim was for ICM organisations to be established and operated such that they would be perceived by farmers and other constituents as organisations that would account for local values and knowledge in making decisions, and which consequently could establish greater trust and voluntary cooperation from their constituents that governments could hope to attain. Governments meanwhile, because they had helped form the ICM organisations and set their rules of operation, could better trust that the decisions made by these organisations would accord with their priorities than would be the case with purely bottom-up decisions. As

17
mediating structures with a ‘private face’ as well as a ‘public face’, therefore, ICM organisations could offer valuable new opportunities for mediating vertical trust between governments and individuals. Reeve et al. (2002 pp.20-21, 30, 31) found similarly that:
… the connection of local-level self-governance with the institutions of cooperative federalism at the Commonwealth and State levels will remain a critical area for effective natural resource management. The prospects for a future resource governance framework very much turn upon the evolution of effective institutions at the regional level that provide a mediative connection between local self-governance and State government. … [Regional NRM organisations] have the extremely difficult task of translating their contractual obligations with State agencies into cultural appropriate and locally credible targets to guide the activities of local self-governing groups … A major effort in supporting the building of mediating capacity in these organisations will be needed.
Nevertheless, translating the mediating structures concept into actual programs has not been straightforward. Berger and Neuhaus (1996) identified the problem as one of protecting mediating structures from the ‘fatal embrace of government’ and concluded that:
Unless that problem is solved, when such institutions are first ‘discovered’ and then funded by government, the very vitality that originally distinguished the institutions from government agencies is destroyed. Indeed they become government agencies under another name. … [W]e underestimated the degree of corruption that comes with government funding – … the … insidious corruption in which these institutions reshape themselves to continue as beneficiaries of government largesse. … The deformation of mediating structures by this creeping process of ‘governmentalization’ must be at the center of any rethinking of social policy (ibid. pp.150-1, original emphasis).
Of particular relevance for the regional delivery model, Marshall (2002 p.104) noted how the mediating structures concept helps to understand the risks of governments devolving responsibilities for maintaining accountability of use of public funds to regional NRM organisations, because ‘such devolution risks these organisations being transformed in the minds of community members from neutral ground into extensions of government’. The consequent difficulties faced by regional NRM organisations in succeeding as mediators between governments and their own constituents were highlighted colourfully by Carr (2002 p.97) as follows: ‘Somewhere between top-down and bottom-up approaches to environmental management is a place called Regional Australia, also known as the middle ground or the great unknown and it is fast gaining political credibility as a cross between a black hole and a hot potato’. For mediating structures to be protected from government’s ‘fatal embrace’, a strong focus needs to be maintained on ensuring that organisations intended to function as mediating structures can continue to mediate effectively the values of governments and citizens and thereby help to build and maintain mutual trust between them. For Carr (2002 p.219, original emphasis), successful execution of this focus lies in the adoption of deliberative approaches to policy discourse wherein ‘dialogue and exchange [occurs] on an equal footing between top-down and bottom-up approaches to environmental sustainability’. The problem with deliberative discourse as a solution is that it depends on those advantaged by the status quo, including government agencies, refraining from exercising their advantage when they enter deliberation. Yet this problem is sometimes overcome through committed leadership within the ranks of government agencies, as documented by Koontz et al. (2004) in the case of community-based watershed management by the Animas River Stakeholder Group (Colorado, USA), and by Marshall (2002, 2004b, 2005) in the case of community-based management of irrigation salinity in Australia’s Murray-Darling Basin. The successful rural development programs reviewed by Uphoff et al. (1998) give further cause for optimism. They found in a number of the programs that the ‘fatal embrace of government’ had been avoided by conditions for government support not being ‘determined unilaterally, but rather in consultation with representatives of those groups whose participation and advancement are sought’ (ibid. p.36). Devised in this deliberative manner, such conditions can ‘encourage and even enforce among recipients a level of

18
discipline and an assumption of responsibility that puts them in a better position to be self-managing and self-sustaining’ (ibid. p.36). 1.4.2 The complexity perspective The complexity perspective reflects the emerging consensus that the social-ecological systems (SESs) normally addressed in environmental management are complex adaptive systems for which optimal management decisions cannot be identified precisely at the outset (Anderies et al. 2004; Berkes et al. 2006; E. Ostrom 1999). A system is called complex not because it comprises a large number of elements but because its patterns of behaviour are ‘emergent’ in the sense that they cannot be understood by focusing only on its elements. It consists of multiple autonomous elements in ongoing interaction with one another and the system itself (Camazine et al. 2001). The elements of such systems ‘adapt to the world – the aggregate pattern – they co-create. … As the elements react, the aggregate changes; as the aggregate changes, elements react anew’ (Arthur 1999 p.107). The positive-feedback dynamics driving this co-evolutionary process reinforce small random events (e.g., chance meetings or price fluctuations) met anywhere in the system. Small events can thus be amplified quickly and flip a system into one of many possible paths. The timing of such a flip and its effect on the subsequent path taken are rarely predictable (Berkes 2002). The risks of social-ecological systems flipping into ‘domains of attraction’ that are undesirable, or even unsustainable, have recently prompted common property scholars to explore how governance choices for social-ecological systems affect their ‘robustness’ (van Laerhoven et al. 2007). Robustness has been defined in this tradition as follows: ‘[An SES] is robust if it prevents the ecological systems upon which it relies from moving into a new domain of attraction that cannot support a human population, or that will induce a transition that causes long-term human suffering’ (Anderies et al. 2004 p.7). There is value, therefore, in crafting community-based governance systems that contribute towards the robustness of the social-ecological systems they seek to manage4. In some circumstances but not all, nested governance may contribute towards the robustness of social-ecological systems involving larger-scale natural resource systems (Lebel et al. 2006). These potential contributions arise in part from the increased scope, compared with monocentric multi-level arrangements (where coordination is expected to occur through a single integrated command structure), that nesting allows for decentralised decision making. Ostrom (1999) explained accordingly how decentralised decision making: (i) enhances access to local knowledge; (ii) increases the likelihood that informal institutional arrangements can be harnessed to exclude untrustworthy individuals; (iii) enables feedback on the performance of rules to be captured in a disaggregated way; (iv) allows rules to be devised that are better adapted to each local natural resource system than any general set of rules; (v) lowers enforcement costs by strengthening local perceptions of the legitimacy of rules, and also by making it easier to fashion rules that can affordably be monitored; (vi) creates situations where ‘multiple units are experimenting with rules simultaneously, thereby reducing the probability of failure for an entire region’ (E. Ostrom 1999 p.526). The potential advantages of nested governance for robustness can arise also from how they complement a relatively decentralised system with higher governance levels capable of dealing with problems which exceed the current capacities of at least some lower-level units to solve by themselves (e.g., intractable problems of biophysical spillovers, discrimination, and inter-group conflict). The overlapping and redundancy of management units in nested arrangements may itself contribute to robustness. It enables information about rules that have worked for one unit to be conveyed more easily to other units. Also, it means that ‘when small systems fail, there are larger systems to call upon – and vice versa’ (E. Ostrom 1999 p.528).
4 Although robustness defined in this way is akin to ‘ecological resilience’, common property scholars have tended to use the former term to distinguish their focus, which is on how humanly-designed elements within SESs control responses to perturbations, from the focus of ecologists, which is on human activities as perturbations of ecological systems (Janssen and Anderies 2007).

19
This last advantage accords with the finding of Walker and Scott (2006) that ‘modularity’ is likely to enhance robustness, given the modular structure of nested governance. A modular structure consists of ‘systems with subgroups of components that are strongly linked internally, but only loosely connected to each other’. Highly connected systems, through which disturbances typically are transmitted rapidly, can be low in robustness. Conversely, ‘a degree of modularity in the system allows individual modules to keep functioning when loosely linked modules fail, and the system as a whole has a chance to self-organize and therefore a greater capacity to absorb shocks’ (ibid. p.121). While the consequences of institutional choices for the robustness of social-ecological systems will often be important, trade-offs typically exist in striving for robustness against different kinds of disturbances (Anderies et al. 2004; Janssen and Anderies 2007; Lebel et al. 2006). The advantages of decentralisation for capturing local feedback on rules, for instance, might strengthen the robustness of a social-ecological system against localised disturbances at the same time as weakening its robustness to larger-scale disturbances (e.g., if decentralisation results in feedback from larger-scale disturbances arriving less promptly and accurately to the governance levels capable of responding satisfactorily to such disturbances). Trade-offs typically arise also between the benefits and costs of striving for further robustness against a particular type of disturbance. Increasing the number of local units experimenting with rules, or of governance levels to fall back on, will not always enhance robustness of a particular kind sufficiently to justify the opportunity costs. When weighing up such trade-offs, however, it is important to employ a method capable of accounting for how institutional alternatives differentially affect robustness. Examined through mechanistic models, for instance, nested systems tend to become dismissed over-readily as ‘too many governments and not enough government’ (V. Ostrom et al. 1999[1961] p.31). 1.5 Objectives of the study The present study was concerned with: (i) examining empirically the contribution, if any, of nested multi-level systems for community-based NRM to farmers’ voluntary cooperation in adopting conservation practices promoted under the regional delivery model; and (ii) understanding the key attributes of community-based NRM linked with any such contribution. The practical outcome sought was enhanced capacity of the Australian NRM policy community, at all levels, to establish successful community-based arrangements under the regional delivery model. The study was informed by the author’s related research on: the institutional economics of integrated catchment management (Marshall et al. 1996); irrigator’s adoption of conservation practices under a community-based program of watertable management in the southern Murray-Darling Basin (Marshall 2002; 2004a; 2004b); and on the economics of collaborative environmental management (Marshall 2005). The primary objective of this project was to identify a set of guidelines that policymakers at all levels of the regional delivery model might apply in designing nested systems of community-based NRM capable of motivating voluntary cooperation by farmers under the regional delivery model – particularly by adopting conservation practices promoted to them under that model. Although the original objective referred to ‘design principles’, the term ‘guidelines’ is used in this report since, as discussed in section 6.1, the former term has a narrower meaning than was considered relevant for this project. Anticipated outputs of the project involved: (i) a manual for applying the guidelines identified; (ii) recommendations on how governmental and community-based processes under the regional delivery model might be better integrated; (iii) guidelines for building the capacities of regional bodies to fulfil accountability requirements imposed by governments under the regional delivery model; and (iv) recommendations on how barriers to success with community-based NRM might be bridged, particularly through communication. Output (i) was ultimately not pursued, for reasons given in section 6.4.

20
1.6 Structure of the report The methodology applied in conducting the research is outlined in Chapter 2. This methodology involved complementary use of qualitative and quantitative techniques. The main quantitative technique was multiple regression analysis. Findings from the qualitative research informed specification of the models tested in the multiple regression analysis. Findings from the qualitative research are presented in Chapter 3. Detailed specification of the multiple regression models is presented in Chapter 4. Findings from the quantitative analysis are presented and discussed in Chapter 5. Guidelines for nested community-based NRM under the regional delivery model, as distilled from the qualitative and quantitative analyses, a literature review process, and feedback from project participants, are presented in Chapter 6. Since outputs (iii) and (iv) anticipated from the project, as specified above, are encompassed by these guidelines, no specific further recommendations were warranted. Finally, in Chapter 7 an overview of the research is presented, conclusions are drawn, policy implications of these conclusions are considered, and two main recommendations are made.
21
2. Methodology The over-arching methodology employed in the present research was the case-study method. This method is discussed in section 2.1. Its application in the present research involved complementary use of qualitative and quantitative research methods. Background to the three cases studied in this project is provided in section 2.2. Details of the fieldwork undertaken in each case as part of the qualitative research are provided in section 2.3. Various aspects of the quantitative method applied in the project – including questionnaire development, sampling, survey administration and testing for non-response bias – are detailed in section 2.4. Concluding remarks are presented in section 2.5. 2.1 Case-study method of this study The case study method treats cases as experiments from which insights can be generalised ‘to theoretical propositions and not to populations or universes’ (Yin 1984 p.21). It is consistent with the call by Mobbs and Dovers (1999 p.131) for institutional research into Australian natural resource management to ‘isolate elements, strategies or mechanisms within particular experiences with potential for generic application’. A common concern with case studies is the external validity of patterns identified in particular cases; i.e., how validly can such patterns be generalised to other cases? External validity of propositions arising from a case study is assessed by whether they are corroborated by other case studies. This is referred to as data triangulation. Corroboration can come from a single project involving multiple case studies. This was the strategy pursued in the present project. Three case studies were undertaken, each focusing on a different region defined under the regional delivery model. Aside from establishing external validity of case-study findings, there is the challenge of ensuring construct validity; i.e., ensuring correct measures are used for the concepts of interest in the study. A common response to this challenge is methodological triangulation, involving complementary application of quantitative and qualitative methods of data collection. Quantitative methods seek to be objective, by measuring phenomena numerically. They emphasise standardised collection of data, such as use of a questionnaire, to facilitate replication. Qualitative methods are more subjective and less structured, allowing exploration of issues and explanations that were not originally anticipated. However, the unstructured source of qualitative data means they cannot be replicated. Hence, construct validity in case-study research can be strengthened through research designs in which the two approaches complement one another. Of particular relevance for this study, data generated from qualitative research can be valuable for constructing a questionnaire intended to collect data for quantitative research. Qualitative data in the form of interview transcripts expose researchers to how the target population verbalises and thinks about the constructs (e.g., trust in the regional delivery model) of interest for quantitative study. Qualitative data for the present study was collected from workshops and in-depth interviews with key informants (both with individuals and small groups). Discussions in each type of setting were semi-structured around topics tailored to the interests and experiences of each subject or group of subjects. Nevertheless, the topics were linked by a common set of research questions. These questions were concerned with subjects’ perceptions of the regional delivery model as an exercise in community-based NRM, their assessments of its strengths and weaknesses in this respect, and their views on how the weaknesses might be ameliorated. Analysis of the qualitative data in this study involved transcription of audio-recordings of the workshops and interviews, followed by a systematic process of coding passages of text in all transcripts according to common themes, and then allocating passages to their assigned themes. The process of developing a coding scheme for the qualitative analysis began with aspects of the theory reviewed in section 1.4, as given context by the account in sections 1.1 to 1.3 of community-based NRM in Australia. The original coding system evolved as qualitative data collection proceeded and new understandings emerged.

22
Quantitative data for the present study was collected through surveys in each of the three cases. Each survey involved a mail-out of structured questionnaires to a sample of farmers. The survey data was analysed through the technique of estimating ‘multiple regression models’. Estimation of such models permits simultaneous testing of the predictive power of multiple ‘explanatory variables’ in respect of a single dependent variable (concerned in this study with farmers’ plans to adopt particular conservation practices). The technique permits identification of which of multiple possible predictors are actually the best predictors (Cooksey 1997). Having presented in this section a broad overview of the case-study method employed in the present research, the next section discusses the selection of the three case studies and provides background to each. 2.2 The cases The three regions used as cases were the South West Catchments Region in Western Australia, the Fitzroy Basin Region in Queensland, and the Mallee Region in Victoria. Each of these regions was a priority region under the National Action Plan for Salinity and Water Quality (NAP). While regional bodies in Western Australia and Queensland are constituted on a non-statutory basis, in Victoria they are statutory authorities. Given the research interest in nested community-based governance, the focus in two of the case-study regions was on parts of those regions where key elements of the regional delivery model had been devolved closer to a subregional level where farmers might be expected to feel a more tangible sense of community. The first of these regions was the South West Catchments Region, where the subregional focus was on the Blackwood Basin for which the South West Catchments Council had devolved various NRM governance responsibilities to the Blackwood Basin Group. The second of these regions was the Fitzroy Basin Region, where the subregional focus was on the Central Highlands for which the Fitzroy Basin Association has devolved various NRM governance responsibilities to the Central Highlands Regional Resources Use Planning Cooperative. The third case-study region, Victoria’s Mallee NRM Region, offered an additional contrast to the other two (i.e., aside from the status of its regional body, the Mallee Catchment Management Authority, as a statutory authority) since it had decided against establishing subregional arrangements with similar stature as in the other two cases. To maintain reasonable comparability across the three cases, our focus in the Mallee Region was on dryland farming districts of that region, since agricultural activity in the other two subregions is predominantly dryland-based. Further details of these cases are presented in the ensuing three subsections. 2.2.1 The Blackwood Basin case 2.2.1.1 The South-West Catchments Council and its region The South-West Catchments Council (SWCC) was formed in 1999, as a federation of NRM groups that had already formed at the catchment scale: • Blackwood Basin Group (BBG); • Cape to Cape Catchments Group; • Geographe Catchment Council (GeoCatch); • Leschenault Catchment Council; • Peel-Harvey Catchment Council; and • Warren Catchments NRM Group. The South West Regional Strategy for Natural Resource Management was accredited by governments in 2004. It states that ‘the Strategy seeks to increase the proportion of people, businesses and organisations in the south west that are active in landcare and sustainable resource management and use more generally’. It emphasises there must be an environment in which community engagement can occur. The first investment plan approved under the Strategy was for the 2005-06 financial year, and represented a total investment of $15.4 million. The most recent investment plan covers 2006-07 and 2007-08 and represents an average investment of $20.1 million per year.
23
The South West Region is one of six NRM regions in Western Australia. The Region encompasses an area of 51,657 km2 and a population of about 193,000 people. Approximately 13 per cent of employment in the Region is in agriculture, fisheries and forestry. There are about 5,000 farm businesses operating in the region, and more than 15,000 small land holdings. The Region includes 33 local government areas. 2.2.1.2 The Blackwood Basin Group and its subregion The origins of the Blackwood Basin Group (BBG) can be traced to 1989 when environmental groups and the Bridgetown-Greenbushes Shire recognised that a coordinated effort was needed to reverse degradation of the Blackwood River. The Blackwood Catchment Coordinating Group (BCCG) was established in 1992. The BCCG comprised 12 members representing 18 shires, Land Conservation District Committees (LCDCs), conservationists, farmers and the community, plus government agency representatives. The Group was incorporated in 1993, becoming formally recognised by government agencies and coming under the responsibility of the WA Minister for the Environment. The BCCG obtained a $20,000 grant from the WA Government in 1993, and in 1994 it employed a coordinator to manage its activities. The Group obtained a $50,000 grant from the Land and Water Resources Research and Development Corporation in 1994. In 1995, the Group received $2.5 million from the National Landcare Program to undertake a program of eight projects from 1995 to 1999. In 1997, the Group distributed $205,000 to 48 on-ground landcare projects that addressed the causes of salinity and waterlogging. In 1998, the Group renamed itself as the Blackwood Basin Group. The BBG adopted a ‘zone action planning (ZAP) strategy’ in 1998 to ensure efficient distribution of Landcare funding. This strategy was the basis for a regional initiative funded over 1999-2003 with $5.3 million from NHT1. The advantages of the ZAP concept were outlined by Ecker and Chadwick (2000) as follows:
Zone Action Planning is a community initiative, and a community group [i.e., the Blackwood Basin Group] provides the framework, funding requirements and support for another funding group [i.e. the zone committee]. Unlike other examples where the initiative is part of a government program, this comes from inside the neighbourhood. … This example of a local community group working closely with a regional community group, provides opportunities for greater trust building and the resultant, innovative thinking and commitment to carry through.
Of further relevance to the present study, they continued:
We’re seeing also that this situation runs the risk of conflict developing when the host group, the Blackwood Basin Group, puts its accountability first before perceived needs of the sub-group, as must happen in the interest of maintaining credibility. Minor issues, like a disagreement between an adequate process for distributing funds can leave the sub-group feeling disempowered and like the community group sponsor is no different from other bodies that they perceive have restricted their control. … The achievement of a balance between providing adequate guidance and allowing full (local) community ownership is proving a fine art requiring skilled management by the members and staff of the Blackwood Basin Group.
The Blackwood River begins near Dumbleyung in the low rainfall area of the WA wheatbelt and flows 280 kilometres through mostly agricultural land before reaching the coast at Augusta. The Blackwood Basin covers an area of about 23,500 km2 and a population of around 37,000 people. Currently, 78 per cent of the area of the Basin is used for agriculture. Almost 80 per cent of the Basin is privately owned. Of the Basin’s land resources, 10-12 per cent are estimated to be in poor to very poor condition due to clearing, salinity and other land degradation issues. The major threat to land resources is dryland salinity. Other threats to land resources are soil acidification and acid sulphate soils, soil erosion and loss, nutrient loss, and waterlogging.
24
The BBG was awarded the International Thiess Riverprize in 2001. It is currently implementing a number of large projects under the 2006-08 Investment Plan for the South West Catchments Region with a combined value of $6 million. 2.2.2 The Central Highlands case 2.2.2.1 The Fitzroy Basin Association and its region The Fitzroy Basin Association (FBA) evolved from the Fitzroy Catchment Coordinating Group, which was established in 1994. The Coordinating Group was renamed the Fitzroy Basin Association, as well as restructured, in 1997. It became a not-for-profit organisation incorporated under the (Queensland) Associations Incorporation Act 1981. The Fitzroy Basin NRM region was identified as a priority region for the NAP. This was attributable to levels of sediment and nutrients in its waterways, which discharge into the Great Barrier Reef lagoon and affect the condition of inshore reefs. As a result, a community-based organisation was required to coordinate the involvement of the Fitzroy Basin Region in the NAP. After an independent review, the FBA was nominated as this organisation. The FBA’s role was formalised in 2002 when it signed a Partnership Agreement with the Queensland Government and the Commonwealth Government. Development of a regional NRM strategy for the region, entitled The Central Queensland Strategy for Sustainability: 2004 and Beyond – was led by the FBA, and accredited by the Queensland and Commonwealth Governments in 2004. The FBA sought to develop the Strategy ‘from the ground up’. Sub-regional groups were integrally involved in the process. It was agreed also that adoption and implementation of the Strategy would ‘be achieved through stakeholders making a voluntary commitment to an agreed course of action. It is not to be enforced through regulation’. The NRM region for which the FBA is responsible surrounds the Tropic of Capricorn, and includes not only the catchment of the Fitzroy River system (the Fitzroy Basin) but also the catchments of the Boyne and Calliope Rivers (which drain the southern part of the region and enter the ocean at Gladstone) and of smaller streams draining the region’s coast. The Fitzroy Basin comprises the catchments of the Nogoa, Comet, Mackenzie, Isaac, Dawson, and Fitzroy Rivers. All combined, the 156,000 km2 bounded by the Region covers one-tenth of Queensland’s land area. All catchments in the Region drain into the Great Barrier Reef lagoon. The region encompasses 19 local government areas either wholly or in part. Rockhampton is the regional capital. The Region has a population of around 200,000 people. It consists of five subregions: • Boyne-Calliope subregion (without a subregional body, but serviced by FBA field officers in
collaboration with local government and community groups); • Three Rivers: Isaac/Connors and Mackenzie subregion (without a subregional body, but serviced
by FBA field officers); • Fitzroy River and Coastal Catchments subregion (with Fitzroy River and Coastal Catchments Inc.
as the subregional body); • Dawson Catchment subregion (with Dawson Catchment Coordinating Association as the
subregional body); and • Central Highlands subregion (with Central Highland Regional Resources Use Planning
Cooperative (CHRRUP) as the subregional body). 2.2.2.2 CHRRUP and its subregion CHRRUP was established in 1997 as a 3-year resource use planning project led by CSIRO Sustainable Ecosystems, the Queensland Department of Natural Resource and Mines, and the Queensland Department of Primary Industries. It was intended to support regional (now referred to as ‘subregional’) stakeholder groups or ‘sectors’ in planning their response to the pressures they were facing in sustainably managing the region’s natural resources. It represents 13 sectors within the subregion: landcare; local government;

25
Queensland Government; indigenous; pastoral; grains; catchment groups; environment; human services; tertiary/education; economic development; mining; and food and fibre. The project was based on three principles: (i) building the planning and management capacity of individual sectors; (ii) facilitating understanding of social, economic and biophysical processes; and (iii) developing strong institutional arrangements to facilitate negotiation among the sectors. A Regional Coordination Committee was established to facilitate sharing of information, act as a forum for reaching agreement across the different interests of the region, and act as a conduit for effective communication with the rest of the Central Highlands community. CHRRUP survived beyond the duration of the project and became an Incorporated Co-operative in September 2001. The Central Highlands subregion is approximately 270 km inland from Rockhampton. It includes five shires, 4.5 million ha, and a population of about 20,000 people. The major population centre is Emerald. The majority of this subregion comprises the catchments of the Comet and Nogoa Rivers which lie within the Fitzroy Basin NRM Region. Mining makes the greatest contribution to the subregional economy. However, the largest land use in these catchments is agriculture, primarily grazing. The threats to land use and management include hillslope erosion, low amounts of soil surface cover, inappropriate land clearing, high inputs to agricultural systems, drought followed by high-intensity storms, and pest plants and animals. Threats to biodiversity include broadscale tree clearing, inappropriate grazing management, habitat fragmentation, environmental weeds, pest animals, and inappropriate management of all land uses (Central Highland Regional Resources Use Planning Cooperative Limited 2003). According to the FBA’s Annual Report for 2005-06, the FBA and CHRRUP committed NRM funding of $0.6 million during this period to projects on properties within the Nogoa and Comet catchments. The equivalent report for 2006-07 stated that CHRRUP committed NRM funding of $0.8 million during this period to projects across 67 properties. Funding for these projects is in accordance with the Investment Plan for the Fitzroy Basin Region. 2.2.3 The Mallee Region dryland case 2.2.3.1 The Mallee Catchment Management Authority (CMA) and its region The first Mallee Regional Catchment Strategy (RCS) was released by the then Mallee Catchment and Land Protection (CaLP) Board in June 1997. The CaLP had been established in December 1994, following the enactment of the CaLP Act that year. The Mallee CMA assumed the responsibilities of the CaLP when it was established in 1997. The CMA acts as a statutory body under the CaLP Act. It also plays a more direct role in the management of waterways and in advising on developments within floodplains, under the Water Act 1989. The CMA has a Board with ten members who are appointed by the Minister for Environment. Selection of these members is based on their collective skills and experience in land protection, water resource management, primary production, environmental conservation, local government and industry. Representatives from the (Victorian) Department of Primary Industries (DPI) and the (Victorian) Department of Sustainability and Environment also attend Board meetings. The Board is supported by two Implementation Committees (ICs), established originally in July 1998, that are ‘the vehicles by which the Authority can ensure community awareness and ownership of the strategies and projects. This will be achieved through the ICs appropriately participating, informing and consulting with the wider community’. The Board appoints community members to the ICs following a call for expressions of interest. IC members are selected on the basis of skills and knowledge representing the range of issues relevant to the geographic area for which the IC has been established. The Mallee Lands Committee takes a leadership role in dryland issues. The Mallee Irrigation and Environment Implementation Committee carries leadership responsibility in issues relevant to irrigation. Unlike the BBG in the first case discussed above, or CHRRUP in the second, the ICs are limited to advisory roles in respect of decisions regarding funding and implementation of on-ground projects. Other key differences are that the ICs are not autonomous in selecting their members, they do not employ or supervise their own field
26
officers, they share the offices of the regional body (i.e., the CMA), and they maintain a low public profile. Hence, they are not ‘grass roots’ subregional bodies in the same way that the BBG and CHRRUP can be regarded. The CaLP Act requires each of Victoria’s CMAs to prepare a Regional Catchment Strategy (RCS) for its region and coordinate and monitor its implementation. The second Mallee RCS, for 2003-08, was prepared not only in accordance with Victorian guidelines but also in line with frameworks established in relation to the NAP and NHT2. The new RCS was accredited by the Commonwealth and Victorian Governments in 2003. In developing the second RCS, nine major processes were identified as threatening natural resources and productive activities in the Region: loss of ecological processes; pest plants and animals; altered flooding regimes; land and water salinisation; water pollution; wind erosion; changing land use; recreational pressures; and altered fire regimes. The region covered by the CMA (henceforth ‘Mallee NRM Region’) encompasses approximately 3.9 million hectares – almost one-fifth of Victoria – and 65,000 people. Of this area, 2.3 million hectares represents privately-owned agricultural land. Irrigated land makes up 1.4 per cent of the area of agricultural land in the region, but 36 per cent of its total value. Hence, dryland agriculture, on which the case study in this region focuses, accounts for 98.6 per cent of the agricultural land in the region. About three per cent of freehold land in the region is covered by native vegetation. There are 27 landcare groups in the Mallee CMA region, mostly in the dryland areas of the region. The CMA leads a regional landcare network (employing seven Landcare coordinators), with help from the Victorian Department of Primary Industries (employing two Landcare coordinators). A key priority in the RCS was for the CMA to establish a systematic capacity-building program ‘with at least the same rigor and emphasis as is in place for on-ground works’. Given that private land occupies 62 per cent of the area of the Region, it was acknowledged that successful implementation of the RCS would depend on cooperation from private, usually agricultural, landholders. However, the RCS document cautioned there are constraints on the engagement that that could be expected from agricultural landholders, and argued that the success of landcare groups in supporting landholders in this direction would depend on ongoing support to such groups from coordinators. There is no formal relationship between the ICs and the system of landcare groups in the region, other than that they are each administered and supported by the CMA.
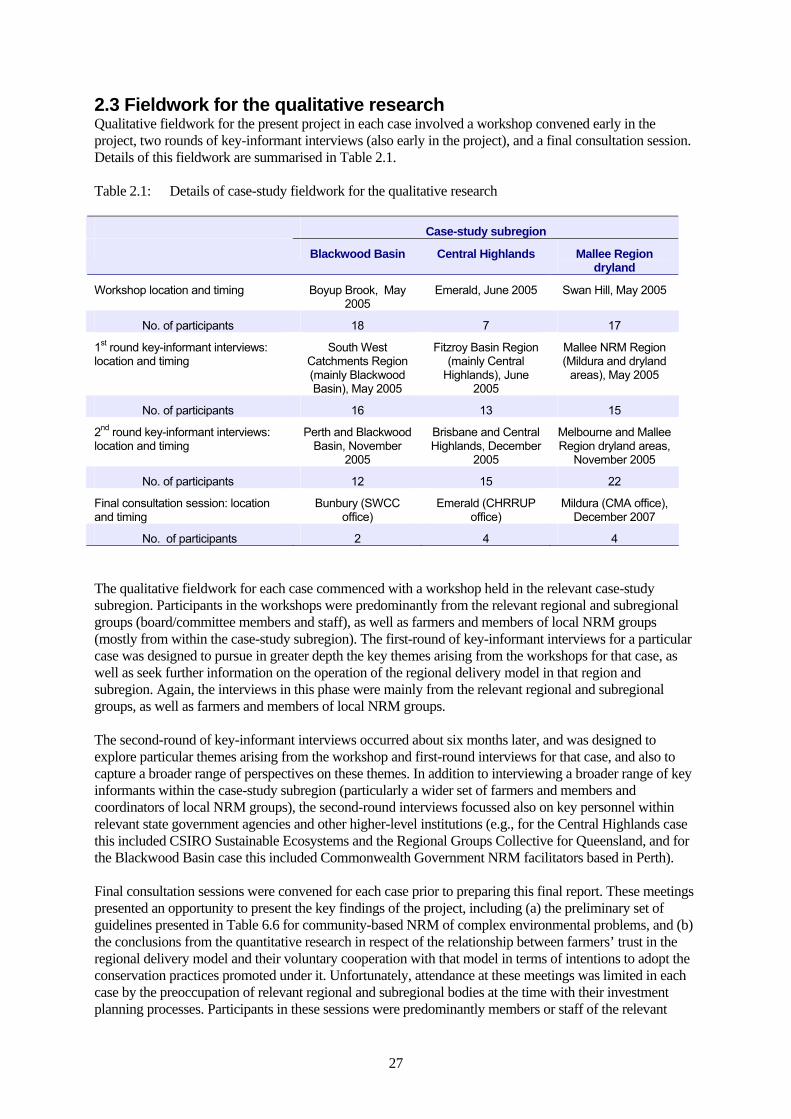
27
2.3 Fieldwork for the qualitative research Qualitative fieldwork for the present project in each case involved a workshop convened early in the project, two rounds of key-informant interviews (also early in the project), and a final consultation session. Details of this fieldwork are summarised in Table 2.1. Table 2.1: Details of case-study fieldwork for the qualitative research Case-study subregion
Blackwood Basin Central Highlands Mallee Region dryland
Workshop location and timing Boyup Brook, May 2005
Emerald, June 2005 Swan Hill, May 2005
No. of participants 18 7 17
1st round key-informant interviews: location and timing
South West Catchments Region (mainly Blackwood Basin), May 2005
Fitzroy Basin Region (mainly Central
Highlands), June 2005
Mallee NRM Region (Mildura and dryland
areas), May 2005
No. of participants 16 13 15
2nd round key-informant interviews: location and timing
Perth and Blackwood Basin, November
2005
Brisbane and Central Highlands, December
2005
Melbourne and Mallee Region dryland areas,
November 2005
No. of participants 12 15 22
Final consultation session: location and timing
Bunbury (SWCC office)
Emerald (CHRRUP office)
Mildura (CMA office), December 2007
No. of participants 2 4 4 The qualitative fieldwork for each case commenced with a workshop held in the relevant case-study subregion. Participants in the workshops were predominantly from the relevant regional and subregional groups (board/committee members and staff), as well as farmers and members of local NRM groups (mostly from within the case-study subregion). The first-round of key-informant interviews for a particular case was designed to pursue in greater depth the key themes arising from the workshops for that case, as well as seek further information on the operation of the regional delivery model in that region and subregion. Again, the interviews in this phase were mainly from the relevant regional and subregional groups, as well as farmers and members of local NRM groups. The second-round of key-informant interviews occurred about six months later, and was designed to explore particular themes arising from the workshop and first-round interviews for that case, and also to capture a broader range of perspectives on these themes. In addition to interviewing a broader range of key informants within the case-study subregion (particularly a wider set of farmers and members and coordinators of local NRM groups), the second-round interviews focussed also on key personnel within relevant state government agencies and other higher-level institutions (e.g., for the Central Highlands case this included CSIRO Sustainable Ecosystems and the Regional Groups Collective for Queensland, and for the Blackwood Basin case this included Commonwealth Government NRM facilitators based in Perth). Final consultation sessions were convened for each case prior to preparing this final report. These meetings presented an opportunity to present the key findings of the project, including (a) the preliminary set of guidelines presented in Table 6.6 for community-based NRM of complex environmental problems, and (b) the conclusions from the quantitative research in respect of the relationship between farmers’ trust in the regional delivery model and their voluntary cooperation with that model in terms of intentions to adopt the conservation practices promoted under it. Unfortunately, attendance at these meetings was limited in each case by the preoccupation of relevant regional and subregional bodies at the time with their investment planning processes. Participants in these sessions were predominantly members or staff of the relevant

28
regional and subregional bodies. Nevertheless, discussions in each meeting were valuable for refining the guidelines and suggesting different perspectives on the quantitative findings. In addition to the final sessions convened for each case, a similar session was convened in Canberra around the same time to elicit perspectives from Commonwealth Government officers involved at that level in policy development and implementation in respect of the regional delivery model. This session was attended by eight such officers. 2.4 Details of the quantitative method Various steps in designing, implementing and analysing the mail-out farmer surveys by which quantitative data for this project were obtained are discussed in this section. Design of the questionnaires is discussed in section 2.4.1, after which administration of the survey is discussed briefly in section 2.4.2. Sampling frames and response rates for the three cases are detailed in section 2.4.3. Finally, section 2.4.4 consider the results of tests of how representative the three samples of respondents are of the respective farmer populations from which they were drawn. 2.4.1 Questionnaire content A separate questionnaire was developed for each case-study subregion. Minor modifications were required, for instance, to account for variation in the applicable state governments and regional and subregional NRM bodies, and for differences in the conservation practices being promoted to farmers. To enable comparability, however, the questionnaires were as uniform as possible across the three cases. A pilot version of the questionnaire for each case was, in July 2006, posted to 40 farm businesses selected randomly from the sampling frames developed for each of the three case-study regions (see section 2.4.3). Responses to the pilot surveys indicated that farmers had no difficulties understanding the questionnaire items and instructions. However, the response rates were lower than the 30 per cent rate which had been regarded as achievable. The pilot-survey response rates for the Blackwood Basin, Central Highlands and Mallee dryland cases were 20 per cent, 22.5 per cent and 17.5 per cent, respectively. Seeking to achieve higher response rates for the main survey, items in the questionnaire were reordered to make it more engaging from the outset. 2.4.2 Survey administration Once the sample for a case had been defined, the finalised questionnaire was posted to each farm business in the sample. This stage occurred in September 2006 for the three cases. Businesses not responding within about six weeks were sent a reminder letter together with a replacement copy of the full questionnaire. Those not responding to the reminder after a further six weeks were posted a one-page follow-up questionnaire. This follow-up survey contained a selection of questions from the full questionnaire. This selection included questions about farm characteristics to provide a means of testing for non-response bias and correcting for this if it were identified. Survey responses were received and processed until February 2007. 2.4.3 Sampling frames 2.4.3.1 Blackwood Basin case The sampling frame used for this survey of farm businesses in the Blackwood Basin was drawn from a database of landholders provided by the Blackwood Basin Group. The database included only landholders recorded with at least 50 ha of land. After editing the database to remove duplicate entries (i.e., sharing the same address) and non-farming entries, the resulting sampling frame comprised 1,950 farm businesses. With a population of this size, it was calculated that a sample size of 321 would provide an estimate of proportions for that population with a confidence level of ± 5 per cent at the 95 per cent confidence level. After allowing for the anticipated response rate, it was estimated that the desired final sample of 321 farm businesses would be achieved by posting the questionnaire to 1,340 of the farm businesses in the sampling frame.

29
2.4.3.2 Central Highlands case Despite various efforts, it was not possible for the main survey of farm businesses in the Central Highlands subregion of the Fitzroy Basin NRM Region to develop a satisfactory sampling frame of such businesses. The Central Highlands Regional Resources Use Planning Cooperative (CHRRUP) had compiled a number of databases of farm businesses operating within the Central Highlands subregion, from which it drew the random sample of 40 farm businesses for the pilot survey. However, the heavy demands at the time on its limited staff resources meant that CHRRUP was unable to update, edit and combine these databases into a form adequate for use as a sampling frame for the main survey. The best strategy under the circumstances was to post questionnaires for the main survey to all farmers within the Central Highlands subregion through the ‘Unaddressed Delivery Service’ administered by the Emerald office of Australia Post. Hence, each envelope sent to farmers carried the label ‘To the Farmer or Grazier’ rather than the actual name and address of the farmer. CHRRUP advised that the following districts covered by that service were located within its subregion: Capella, Comet, Emerald, Gindie, Rolleston, Springsure and Yamala. Australia Post in Emerald advised that 890 farm businesses were covered by that service in those districts, and confirmed that this number comprised virtually all farm businesses in those districts. With a population of 890 farm businesses, it was calculated that a sample size of 269 would provide an estimate of proportions for that population with a confidence level of ± 5 per cent at the 95 per cent confidence level. Given that questionnaires for the main were to be sent to all 890 farm businesses, a response rate of 30 per cent would be needed to achieve a sample size of 269. Nevertheless, it was recognised that the impersonal nature of the unaddressed delivery of questionnaires would lower the response rate substantially. To minimise this handicap, the label affixed to each envelope carried a CHRRUP logo (since farmers might be expected to pay more attention to unaddressed mail sent from a known local organisation) as well as the wording below designed to appeal to farmers’ goodwill towards their community: ‘This survey collects important information which may help government $ to be invested in the Central Highlands. Your time filling it out is appreciated’. All 890 farm businesses were posted in late September 2006 a copy of the full questionnaire via the unaddressed delivery service. 2.4.3.3 Mallee dryland case The sampling frame used for this survey of farm businesses in dryland zone of the Mallee NRM Region was drawn from a database held by the Victorian Farmers Federation (VFF) of its members. The Mallee Catchment Management Authority advised which VFF local branches were located predominantly within this zone. The number of VFF members in these branches was 862. For reasons of privacy, the VFF was prepared only to make the resulting database for these 862 farmers available only to its mail-house. Hence, procedures for sampling and survey administration were carried out by the mail-house in accordance with instructions provided by the project. With a population of 862 farm businesses, it was calculated that a sample size of 266 would provide an estimate of proportions for that population with a confidence level of ± 5 per cent at the 95 per cent confidence level. After allowing for the anticipated response rate and questionnaires returned to sender, it was estimated that the desired final sample of 266 farm businesses would be achieved by posting the questionnaire to all 862 farm businesses in the sampling frame. All these farm businesses not included in the pilot survey were posted a copy of the full questionnaire during September 2006.

30
2.4.4 Response rates 2.4.4.1 Blackwood Basin case Response rates for Blackwood Basin case, in respect of both the full questionnaire and the one-page follow-up questionnaire, are shown in Table 2.2. The overall response rate of 29.2 per cent for the full questionnaire in this region was almost 50 per cent higher than achieved from the pilot survey. Table 2.2 Sample size and response rates for the Blackwood Basin case a. Full questionnaires mailed out (including for pilot survey) 1,340
b. Full questionnaires returned to sender 94
c. Full questionnaires returned 'not applicable' 108
d. Full questionnaires completed 333
e. Full questionnaire response rate ( = d / (a - b -c)) 29.3%
f. Follow-ups completed 84
g. Follow-ups returned to sender 1
h. Follow-ups returned 'not applicable' 25
i. % of non-responders completing follow-up [ = f / (a - b - c -d - g - h)] 10.8%
2.4.4.2 Central Highlands case Response rates for the Central Highlands case, in respect of both the full questionnaire and the one-page follow-up questionnaire, are shown in Table 2.3. The response rate in this case of 19.6 per cent for the full questionnaire was less than the 22.5 per cent achieved from the pilot survey alone. Nevertheless, this outcome was better than expected since the pilot survey had been addressed personally to farmers whereas the main survey was delivered unaddressed. Table 2.3: Sample size and response rates for the Central Highlands case a. Full questionnaires mailed out (including for pilot survey) 890
b. Full questionnaires returned to sender 2
c. Full questionnaires returned 'not applicable' 22
d. Full questionnaires completed 170
e. Full questionnaire response rate ( = d / (a - b -c)) 19.6%
f. Follow-ups completed 96
g. Follow-ups returned to sender 0
h. Follow-ups returned 'not applicable' 18
i. % of non-responders completing follow-up [ = f / (a - b - c -d - g - h)] 14.2%
2.4.4.3 Mallee dryland case Response rates for the Mallee dryland case, in respect of both the full questionnaire and the one-page follow-up questionnaire, are shown in Table 2.4. The response rate in this case of 40.2 per cent for the full questionnaire was more than twice that achieved from the pilot survey alone. Table 2.4 Sample size and response rates for the Mallee dryland case
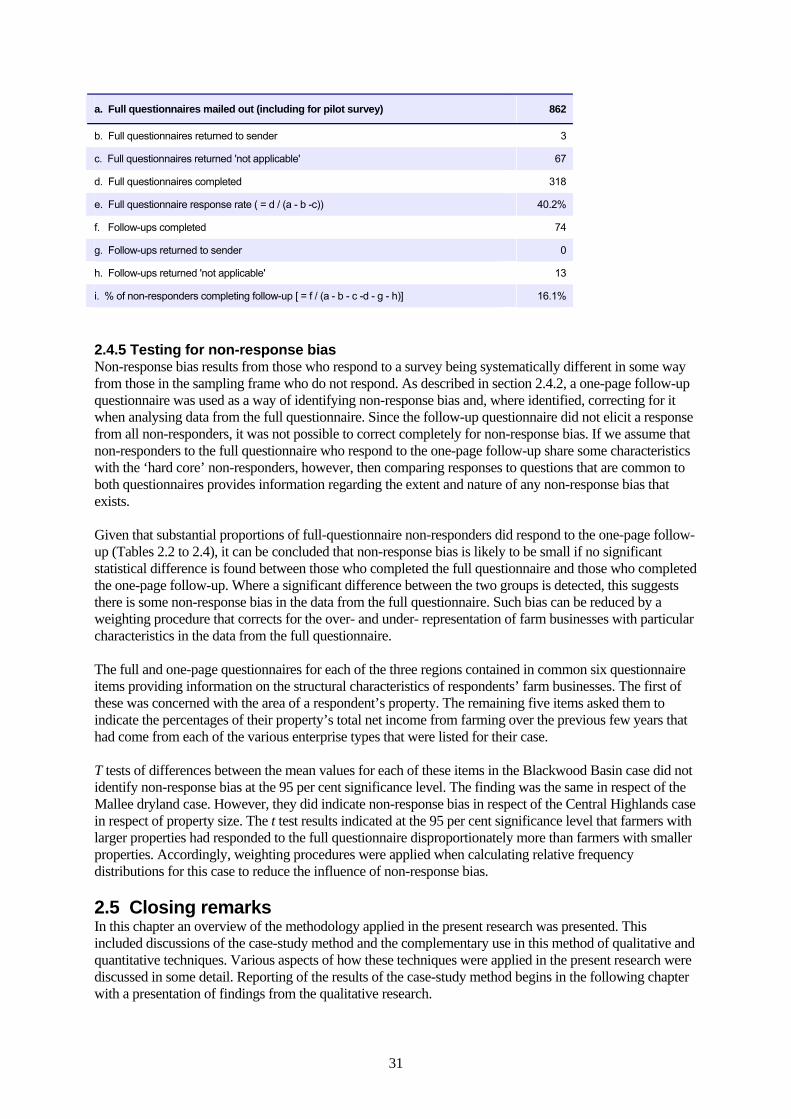
31
a. Full questionnaires mailed out (including for pilot survey) 862
b. Full questionnaires returned to sender 3
c. Full questionnaires returned 'not applicable' 67
d. Full questionnaires completed 318
e. Full questionnaire response rate ( = d / (a - b -c)) 40.2%
f. Follow-ups completed 74
g. Follow-ups returned to sender 0
h. Follow-ups returned 'not applicable' 13
i. % of non-responders completing follow-up [ = f / (a - b - c -d - g - h)] 16.1%
2.4.5 Testing for non-response bias Non-response bias results from those who respond to a survey being systematically different in some way from those in the sampling frame who do not respond. As described in section 2.4.2, a one-page follow-up questionnaire was used as a way of identifying non-response bias and, where identified, correcting for it when analysing data from the full questionnaire. Since the follow-up questionnaire did not elicit a response from all non-responders, it was not possible to correct completely for non-response bias. If we assume that non-responders to the full questionnaire who respond to the one-page follow-up share some characteristics with the ‘hard core’ non-responders, however, then comparing responses to questions that are common to both questionnaires provides information regarding the extent and nature of any non-response bias that exists. Given that substantial proportions of full-questionnaire non-responders did respond to the one-page follow-up (Tables 2.2 to 2.4), it can be concluded that non-response bias is likely to be small if no significant statistical difference is found between those who completed the full questionnaire and those who completed the one-page follow-up. Where a significant difference between the two groups is detected, this suggests there is some non-response bias in the data from the full questionnaire. Such bias can be reduced by a weighting procedure that corrects for the over- and under- representation of farm businesses with particular characteristics in the data from the full questionnaire. The full and one-page questionnaires for each of the three regions contained in common six questionnaire items providing information on the structural characteristics of respondents’ farm businesses. The first of these was concerned with the area of a respondent’s property. The remaining five items asked them to indicate the percentages of their property’s total net income from farming over the previous few years that had come from each of the various enterprise types that were listed for their case. T tests of differences between the mean values for each of these items in the Blackwood Basin case did not identify non-response bias at the 95 per cent significance level. The finding was the same in respect of the Mallee dryland case. However, they did indicate non-response bias in respect of the Central Highlands case in respect of property size. The t test results indicated at the 95 per cent significance level that farmers with larger properties had responded to the full questionnaire disproportionately more than farmers with smaller properties. Accordingly, weighting procedures were applied when calculating relative frequency distributions for this case to reduce the influence of non-response bias. 2.5 Closing remarks In this chapter an overview of the methodology applied in the present research was presented. This included discussions of the case-study method and the complementary use in this method of qualitative and quantitative techniques. Various aspects of how these techniques were applied in the present research were discussed in some detail. Reporting of the results of the case-study method begins in the following chapter with a presentation of findings from the qualitative research.

32
3. Results: Qualitative Research Key findings from analysis of the qualitative data collected from the cases studies are discussed in this chapter. The findings are presented as four central themes that emerged from the analysis. These four themes are covered in turn in sections 3.1 to 3.4. A brief summary of the themes, together with concluding comments, is presented in section 3.5. 3.1 Theme 1: Don’t do for a lower-level group what it can do for itself This common theme was normally expressed by participants along the lines of the ‘community empowerment’ concept from rural development theory which was central to advocacy of community-based approaches to NRM in Australia during the 1980s. From this perspective, the value of community-based processes lay in their ability to help local rural communities develop the kinds of capacities they needed to self-reliantly address the challenges they faced. The theme was articulated most forcefully in an interview with a Board member of the Fitzroy Basin Association (FBA), who observed how the FBA’s motto – ‘Empowered communities for a sustainable Central Queensland’ – continued to reflect a core value of the organisation. This Board member justified this continuing emphasis as follows:
If you look at the last 20-25 years, for a million reasons we’re slowly sort of taking away the rights of people. People have been very happy to give a lot of them away, if it means somebody can look after them. It exists in the bush too … The only way you are going to bring about major change is to put back the responsibility onto people. If you can empower them to make their own decisions about how they manage their properties, it becomes part of the everyday way they do things, and we’ll see those long-term changes we need to have. … If we’re not careful in these regional groups, people will just change their expectations and blaming from Government into the regional groups. We’ve got to be careful that we don’t allow that to happen, that we keep forcing decisions back down all the time, saying ‘Listen, if you don’t like this organisation, you do something about it because it’s yours’.
In another interview, a person with experience on the boards of the FBA and the Central Highlands Regional Resources Use Planning Cooperative (CHRRUP, the subregional group in the same case upon which the present research focused) highlighted the importance of authentic commitment to community empowerment as follows: It’s like being an authoritarian parent. Often you can get a very good result by coming in and being very
directive and just doing things yourself, but you don’t end up maintaining the involvement of the sectors. Various government participants in the research also made comments aligned with this theme. For instance, an officer of the Western Australian Government, involved at a senior level in administering the regional delivery model in that state, observed:
… you’ll get better quality decisions by engaging with the breadth of stakeholders out there. That will give you a more accurate view of what the community wants than something done by the government agencies. Agencies have tended in the past to be quite paternalistic. We’d say, ‘We know what’s good for the environment out there. Don’t you worry about it. Just let us do it. We’ll run these programs for you, and everything will be OK’. But in many cases I don’t think the agencies were getting it right.
This theme corresponds closely with the ‘principle of subsidiarity’, which was adopted by the nations of Europe as one of the central constitutional principles for the European Union. Although various definitions of this principle exist, they generally share in common the implication that any particular function should be decentralised to the lowest level of governance with capacity to perform it effectively. This principle was formulated in the Papal Encyclical Quadragesimo Anno (1931) as follows:

33
It is an injustice and at the same time a great evil and disturbance of right order to assign to a great and higher association what lesser and subordinate organisations can do. For every social activity ought of its very nature to furnish help to the members of the body social and never destroy and absorb them.
3.2 Theme 2: Appraise lower-level capacities carefully, and recruit with respect Alongside the perceptions of research participants that governments remained too often out of step with the first theme, as a result of lingering paternalistic attitudes, were accompanying concerns that devolution of functions to regional and other community-based levels was based too rarely on careful appraisal of actual capacities to discharge these functions effectively – or of how alternative devolution strategies might affect those capacities. These concerns were articulated clearly by research participants from the project’s South West Catchments Region case, especially concerning the introduction and early years of the regional delivery model in their region. They were concerned that the model appeared to have been introduced in their region with little thought for how community capacities for NRM developed under the NLP and NHT1 would be maintained and utilised under the new model. There was a feeling that these hard-won capacities had been taken for granted by the policy-makers when formulating and introducing the new model. Discussions at the workshop convened for this case in 2005 highlighted how this taking-for-granted of community capacities threatened their continued existence in two diametrically opposed ways. First and most obviously, it can lead to insufficient emphasis being given to planning policy changes in ways that avoid these capacities being over-taxed and ‘burnt out’. As one example, it was reported how community-based NRM groups had found themselves expected to proceed with planning activities before government has delivered the guidelines promised for these activities. To the extent that the progress achieved was inconsistent with the guidelines when they did appear, some of the limited capacities available for community-based NRM (e.g., goodwill) had been squandered. This problem is exacerbated when the guidelines continue to be modified over time (‘they keep shifting the goalposts’). The lesson here is not that policies and guidelines concerning community-based processes should never be changed, but rather that they should be substantively in place before planning commences, and not changed without first considering the ongoing implications for community capacities. Although community-based NRM groups may adapt themselves to ‘shifting goalposts’, the following remark at the workshop highlighted the costs of this adaptation: ‘We’ve become experts at managing change and playing the game, not experts at NRM’. As another example, regional bodies including the South West Catchments Council were expected to rapidly scale-up and adapt community-based processes inherited from previous programs at the same time as governments were reluctant, apparently for reasons of not wanting funds diverted from resourcing on-ground activities, to continue funding operation of the local and sub-regional groups upon which the trust needed for those processes was largely based. An officer of SWCC remarked accordingly at the workshop:
We’ve had two goes now to get funding and recognition for our subregions, and both times it’s been knocked on the head by them saying ‘No, we’re not funding subregions any more, we’re funding the regions’.
Secondly, taking capacities of community-based groups for granted can lead policy-makers to presume such capacities will endure even if sidelined for years while the focus of policy development and resourcing shifts elsewhere. Landcare and other local NRM groups in the South West Catchments Region, and indeed across much of the nation, experienced this second possibility over a period of 2-3 years between when NHT1 funding ceased and funding from the regional delivery model began to flow. This ‘funding drought’ for local groups meant that their activity levels fell away and many of their members lost their motivation, redirecting their energies to other pressing pursuits. It was observed at the workshop that the Blackwood Basin Group took 7 or 8 years to really gain the trust of its community by demonstrating it

34
could deliver better outcomes, and that the momentum and trust lost in the process of restructuring towards a regional model would take 4 or 5 years to recover. Aside from the effects of the ‘funding drought’, workshop comments indicated that local NRM groups had been demotivated by the way the shift to the regional delivery model had been justified. It was evident that the local groups represented at the workshop regarded the period from the launch of the NLP to the end of the NHT1 as one of success, during which they mobilised a large slice of the rural population and achieved considerable on-ground work. Hence, they were dismayed to find in policy discussions justifying the shift to the regional delivery model that these earlier programs were disparaged for spreading available funds too thinly (‘vegemiting’). This left some local groups reluctant to support the regional NRM process, particularly when they felt that their contributions in building the community capacities to be relied upon in implementing the regional NRM strategy and investment plan appeared to have been taken for granted. A member of the South West Catchments Council present at the workshop commented:
Some government people think volunteers are cheap. Volunteers are the most valuable part of NRM, and they need to be treated with trust and respect. Otherwise, they’ll pick up their marbles and go home.
Related to this theme also was a range of comments across the three cases concerning the constraints on building and maintaining capacities for NRM in rural communities. Feedback from the workshops and interviews confirmed that capacities of landholders to participate in NRM activities is declining and should not be taken for granted. One reason for this declining capacity includes population losses in agricultural communities, with one dryland farmer in the Mallee Region commenting ‘The big issue is actually having the labour to be able to do what they want us to do. … There’s a lot of jobs to do on a farm. The farms are getting very large. To have a major tree-planting program or something like that becomes a major concern’. Another reason is the increasing average age of the population that remains. As one government officer interviewed for the Mallee case remarked, ‘When the average age of farmers was in their thirties, you had times of the year when you weren’t cropping or sowing or harvesting or shearing, and you had able-bodied people out there who could do work on [NRM activities]. The age structure now means that people aren’t as keen or as able to do physical work’. Aside from reducing volunteer farm labour to undertake on-ground NRM activities, remarks across the cases confirmed also that depopulation and ageing in agricultural communities is diminishing the pool of landholders willing and able to participate in the organisational side of community-based NRM (e.g., serving on the committee of a landcare group, or as a community representative on the relevant regional or subregional body). However, the remarks often highlighted also how these demographic effects on local civic capacities for NRM had been compounded by withdrawal of government and other services from rural localities, such that the available civic capacities have become stretched over an increasing number of services that local communities must provide for themselves. A secretary of a landcare group in the Mallee Region remarked, ‘If you’re on one committee, you’re on five. You’re meetinged out just running your own town without extending into the wider sphere’. A landcare coordinator from this region observed similarly:
There might not be many people in a community … and a lot of them wear four or five hats. … It’s the same people in the CFA, Landcare, P & Cs, or sporting groups. … A lot of their time is spent going to meetings and making things happen.
Consistent with such observations on the capacity of landholders to get involved with the organisational side of community-based NRM, there was consensus across the cases that efforts to engage landholders with the regional delivery model should be directed as far as possible through the structures with which landholders are already involved, rather than by creating a new raft of structures that would stretch this capacity even further. An officer of the Fitzroy Basin Association (FBA) commented accordingly: ‘Even though the geographic size of the Fitzroy catchment isn’t huge, it’s still the largest one on the eastern coast of Australia. There’s about 6,000 serious landholders’. The FBA took the view that it would be impractical to establish

35
relationships with all these landholders itself, and wasteful given that relationships with many of these landholders had already been forged by smaller-scale groups like the Central Highlands Regional Resources Use Planning Cooperative (CHRRUP) that had developed formidable capacities for community-based NRM under NHT1. The FBA chose consequently to work through existing smaller-scale structures wherever possible. The officer recognised that depending on other structures to help achieve its objectives involved significant risks, but argued as follows that these risks were justified:
In the manner we devolve stuff, things can go belly-up. But if you hold everything so tightly that nothing can go belly-up, then you probably haven’t devolved anywhere near enough responsibility.
Within the region for which the FBA has NRM responsibility, it has delineated five subregions. These correspond with the catchments of the Boyne-Calliope, Dawson, Mackenzie, Isaac-Connors, Nogoa-Comet, and Fitzroy (and adjoining coastal) river systems. Of these river systems, the Nogoa-Comet system falls within the responsibility of CHRRUP. In looking to work through existing smaller-scale structures, the FBA recognised considerable diversity in the capacities of community-based structures in the subregions to effectively discharge the kinds of responsibilities the FBA was looking to devolve. The FBA’s strategy in dealing with this diversity was outlined by the officer as follows:
Things should run the way that people in those areas decide. From the perspective of having contracts and so on, it’d be really nice if we had five CHRRUPs across the area. But as far as effectiveness goes, it probably wouldn’t work. Because the Dawson doesn’t run like that. It’s unlikely that in the Isaac-Connors that there is capacity to develop this kind of model in the short term. And neither is there any will to do that in the Boyne-Calliope area. If we were to run the same model in all five subregions, it would be an imposition and wouldn’t work.
Nevertheless, it was evident from feedback across the three cases that the task of developing individual relationships with all landholders in a subregion is beyond the capacity of even subregional bodies like CHRRUP and the BBG which have earned reputations for their emphasis on community engagement. CHRRUP has worked at the level of ‘neighbourhood catchments’ in developing working relationships with farmers. Rather than engage with farmers in each of these catchments through new ‘purpose-built’ groups, CHRRUP’s field officers have engaged with them through whatever relevant structures are available and willing to be engaged. A CHRRUP field officer commented at the workshop convened for the Fitzroy Basin case in 2005:
It’s not just CHRRUP and FBA and the landholders. It’s Agforce [an association representing the interests of Queensland farmers and graziers], it’s the local council, it’s the sustainable farming systems groups. It’s every group out there that’s all having their bit of community involvement.
Advantages from working with existing groups can arise also because such groups are more likely to persist beyond the availability of financial inducements for on-ground action than are groups formed specifically to access those inducements. An officer of CHRRUP remarked:
We want this stuff to be self-sustaining. We don’t want to just come and say, ‘Here’s the money’, and then rack off, so that they just fall to pieces and don’t do anything else. So we try to value-add to existing structures as much as possible.
3.3 Theme 3: Invest in lower-level capacities Despite feedback across the three cases that the capacities of many rural communities to engage with the regional delivery model are limited, and often were undermined by how governments introduced the model, discussion across the cases evinced optimism that these capacities could be extended through targeted investments. Research participants across the cases referred to possibilities for ‘leveraging’ existing community capacities with appropriately skilled personnel. One frequently mentioned role for such personnel stemmed from the regional-scale strategic process under the regional delivery model having escalated considerably

36
the complexity of the issues that community volunteers are expected to grapple with in engaging with that process and developing projects consistent with the resulting investment priorities. This task is hard enough for community representatives on regional and subregional bodies, with some exposure to the process, let alone for the ‘grass roots’ with experience mostly of their own local problems. For instance, a farmer on the board of the Mallee Catchment Management Authority (CMA) discussed as follows the problem that members of the CMA’s Lands Implementation Committee (IC) have faced in providing feedback from dryland farming communities to the CMA.
At the moment, if you want to inform IC members about something, you give them a pile of reports this thick and say, ‘Well, there you go’. … Buried in there are some critical bits of information that they need to have an opinion about, and they can make a contribution to. But to be able to find it is a skill that most of them haven’t got. You need someone with the skill to be able to take all that information, identify the critical bits, and put those into a format that people can understand and make some use of. Once you’ve got the information into that format, it’s pretty easy to disseminate it to the people interested in it. And they’ll learn from it, and react to it.
The CMA’s solution to this problem included establishing a Community Capacity Program, the responsibilities of which include streamlining information flows to the ICs and translating the information that does flow in that direction into forms that can readily be dealt with and relayed where appropriate to their respective communities. This CMA board member continued as follows in respect of the need to develop community capacities to contribute effectively to investment planning processes in the Mallee Region:
We’re not getting the appropriate mix of on-ground actions coming up and being proposed. We’re not equipping people with the information they need to make those sorts of calls. You pluck somebody off their farm, and you put them in a meeting … and you talk about these strategic issues. But they’ve got no idea, even if they can cope with this foreign language that’s spoken … They’re not given the opportunity to gain an appreciation of the whole region. We say we’ve had community consultation, but it’s not community consultation, really, because we haven’t equipped them to make a contribution.
Feedback from the South West Catchments Region revealed the importance placed by communities in that region on Natural Resource Management Officers (NRMOs) for their ability to engage with regional investment planning processes. The role of these officers in this region is largely to develop and maintain effective communication channels between the subregional bodies and the local groups and grass roots communities they cover. Where consistency exists between regional priorities and local interests, but the language used in regional documents makes this difficult to grasp, NRMOs can ease this difficulty. In other cases, local priorities expressed during consultation rounds may have become diluted or reinterpreted in the process of aggregation up to regional priorities − to the point that no amount of back-translation could enable landholders to build a case for regional funding. Staff can help here by ensuring that relevant local priorities are captured more accurately in subsequent consultation rounds. In yet other cases, local priorities may fit reasonably well with regional ones except that the individual activities envisaged by landholders may be too limited in scale to attract funding given the regional delivery model’s emphasis on larger integrated projects. Staff can play a crucial role here by working with local groups to integrate their proposed activities into larger projects more likely to be funded. Support from staff was seen also as a key part of solving the problem of limited community capacities to engage with the organisational side of the regional delivery model (as identified under the previous theme). This role for staff was emphasised most strongly in the South West Catchments case, where community representatives tend to serve at two or more levels of the regional system. An officer of SWCC observed that this confers a substantial advantage for maintaining communication and trust between the different levels. However, the associated problem was highlighted as follows by a NRMO:
You end up with the farmer who’s on the landcare group, who’s on the LCDC, who’s on the sub-regional group, and now ends up on SWCC as well. That’s a recipe for burn-out.

37
The response from a member of the SWCC board to this problem was that the regional community-based system ‘is only as good as its staff’. By this he meant that the more that community-based groups at different levels trust their staff, and staff across the different levels trust one another, the greater is the share of the burden of maintaining communication and trust across levels that can be carried by staff – and the more sustainable becomes the burden that community representatives need to shoulder. There was widespread frustration across the cases that the importance of staff for success of community-based processes under the regional delivery model was not reflected in government funding. The frustration was not only with the overall annual funding but also with the fact that government commitments to fund staff were short-term – made on a yearly basis in the first few years of the model and on a three-year-rolling basis thereafter. A member of the BBG committee expressed this frustration as follows:
It’s usually the persons not the positions that make headway into the community, and it’s hard with short-term funding to keep persons in positions.
An officer of the Western Australian Government, involved at a senior level in administering the regional delivery model in that state, sympathised with such frustrations when interviewed in 2005 as follows:
My fundamental belief is that we are going to get a far better return on the dollars invested if we spend it on building the capacities of communities out there to manage their own problems in the longer term, to put it into developing people and processes. However, politics being what it is, and with the wider community looking in, there’s an expectation that the money goes to works on ground. And that’s what the politicians are being hammered about by the critics of this model. At the Commonwealth ministerial level it’s ‘don’t talk to me about capacity building’. Anything that comes in that’s got capacity building in it, they’ll put a red line through.… So it’s political sensitivity, and all it takes is one or two people in a hundred to make a noise and politicians react to it, … [while] the silent majority sit back and think ‘Well, that noisy person over there may be referring to some bureaucrats out there, and we’d support them on that, but don’t you dare touch our local NRM facilitator’. … They don’t see them as bureaucrats but as an absolutely essential part of what they’re doing.
Aside from recognition of the value of investing in personnel as a way of alleviating limits on community capacities to engage effectively with the organisational side of the regional delivery model, the value of supplementing farmers’ increasingly-limited capacities to undertake on-ground actions with teams of workers was also highlighted across the cases. For instance, a landcare coordinator remarked at the workshop convened for the Mallee case in 2005:
We’re now looking at things like teams of workers to come out and actually help farmers on-ground to fence some of these blocks of trees. There’s other groups, like Green Corp groups, that come out and help farmers plant the trees. The farmers prepare the ground, and then the team comes out. … If you had a team of experienced workers coming out, it would probably be better.
Employing workers to help landholders undertake on-ground actions may be at odds with the original ethos of voluntarism originally associated with Australian community-based NRM programs, but remarks across the cases highlighted that farmers have appreciably more to volunteer to NRM efforts than their labour. Indeed, there was broad recognition that the most valuable contribution of farmers to NRM processes tends to come through the local knowledge they are willing to share, and accordingly (as discussed above) that funds available under the regional delivery model should not only be invested in motivating landholders to undertake desired on-ground actions, but also in staff with the skills and longevity required to establish the trust from farmers needed for them to volunteer their knowledge within decision-making processes.

38
3.4 Theme 4: Establish and maintain vertical trust The importance of building trust vertically across different levels of the regional delivery model, from landholders through regional bodies to governments, and in reverse, was the most pervasive theme emerging from discussions across the three cases. Without such trust, it was widely acknowledged, the hoped-for stimulus to farmers’ voluntary cooperation arising from the model’s community-based approach would simply not eventuate. The following remark from an officer of the South West Catchments Council reflects well the thrust of discussions around this theme, and also frustrations frequently expressed to the effect that governments had introduced the model with too little attention to how this vertical trust might be established and maintained:
Although you can have a strategy for investment, at the end of the day – unless you have regulation – landholders have to agree to implement it. And we simply don’t have enough money to correct the market failings that have happened. And that has often been totally left out of the analysis.
It became apparent that the theme of developing vertical trust covers a diverse range of issues. Hence, discussion of this theme proceeds in the seven sub-sections following. 3.4.1 A legacy of mistrust in government In most instances these frustrations derived particularly from perceptions that the vertical trust of many landholders in the regional delivery model remained weak. Discussions highlighted various reasons for this state of affairs. It seems that certain government decisions preceding the regional model had reduced farmers’ trust in state governments considerably, and that this loss of trust had often carried over to the regional bodies. To some extent this trust problem was inherited from prior histories of government paternalism, and consequent resentment at governments having intervened in farmers’ affairs without due regard for their local knowledge. This trust problem may have been ameliorated by governments appointing extension and other officers to develop working relationships with farmers, but returned when these positions disappeared with rationalisation of the public service from the 1980s onwards. More recently, with state governments adopting regulatory approaches to water policy reform and restricting farmers’ rights to clear native vegetation on their properties, these trust problems became more acute. A consultant interviewed for the Fitzroy Basin case encapsulated these developments as follows:
Trust in [the Queensland] Government started to decline before the vegetation issues arose, simply because of Government policies towards their own employees. And a lot of them left, and the level of agency interaction with farmers started to go as people left the system. Then it took a massive dive when the water reform and vegetation reform processes took over. Farmers saw the methods used by Government for those processes as very confrontational. Even if everything started to balance out now, it would take a whole generation for Government to regain the trust it has lost.
This loss of trust in government poses difficulties for regional bodies in so far as farmers remain to be convinced that these bodies are not part of government or under its thumb. This consultant observed accordingly in respect of the Fitzroy Basin case:
There’s still an element of distrust. FBA [Fitzroy Basin Association] is working very hard on it. CHRRUP [Central Highlands Regional Resources Use Planning Cooperative] is working very hard to disassociate themselves from government processes. Everybody understands there’s linkages there. … There’s a lot of distrust of government, and that covers a wide range of vehicles when you’re talking to growers.
The legacy of such mistrust for efforts by regional NRM bodies to engage farmers in biodiversity conservation activities (concerned with conserving or regenerating native vegetation) was highlighted by the following comment from a farmer member of the Mallee Lands Implementation Committee:
The native clearance regulations have fought very much against biodiversity interests in farmers, because they’ve been told they can’t do this and they can’t do that.
39
3.4.2 Scepticism of government motives for introducing the regional delivery model ‘Bottom-up trust’ in the regional delivery model from the bottom up was also identified as lacking by some research participants because of perceptions that government characterisations of the model as community-based had been misleading. An officer of SWCC remarked:
Government sets up the regional groups and says ‘We’ve got community-based groups’, and then they put all the bureaucracy on us. It’s just a lovely political trick. … Many of us had our own pictures of what a region might be in WA [Western Australia]. But before we knew it, six regions had been announced in WA, with zero consultation with any of community groups from the existing regions. This imposition of regional groups has given efficiencies at the Commonwealth and state levels. The Commonwealth now has to deal with only 56 groups. Before it had thousands of groups to deal with. … From the state viewpoint it’s similar. They can say ‘No, the legitimate group is this group. We’ll only talk to this group on NRM matters’. So governments are clearly gaining efficiencies. At a regional level, I think we’ve lost efficiency. … We already had four levels, and now we’ve got five. … The burden has been shifted.
A landcare coordinator from the Mallee Region voiced as follows scepticism that real decision-making power had been devolved to the regions: ‘The feds and the states are running their own agendas in terms of perceptions of priorities within their jurisdictions’. Consistent with this scepticism, a consultant interviewed for the Fitzroy Basin case observed as follows that a significant proportion of farmers in the Central Highlands were wary that governments may have the introduced the model as a way of enticing them into voluntary actions that could later be made mandatory: ‘Farmers very, very much distrust the creeping movement of the goalposts. They’re very aware of that’. A particular challenge for regional bodies in gaining trust from their constituents was identified across the three cases as the fact that under the regional delivery model the responsibility for making tough, and potentially divisive, funding decisions had been devolved from government to these bodies. Accusations of lack of equity or favouritism can make the task of establishing and maintaining trust across a constituency all the more difficult. An officer of the Western Australian Government commented as follows on the time needed for regional bodies to learn:
… to play the politics needed. What governments, state and federal, have effectively done is transferred the politics of decision making from government out into the community. Government no longer has to say ‘Well, we’ve only got $80 million for this year, and these are going to be our strategic priorities’. They’ve shifted that responsibility to the community, and we’ve now got situations developing where there are some quite passionate lobby groups. … They feel they’re not getting their fair share of this funding, so they then set about attacking the credibility of the groups, and attacking the process. That will continue to occur. If [a group] thinks they can influence their share of the funding by lobbying hard and complaining politically, then they might do it. You can see the political situation that is emerging and will continue to develop at the regional level. These groups will be subject to enormous pressures, just like government is, to ‘Give the funds to us’, to abandon a strategic approach and instead appease their local constituents. That won’t be easy, and I’m not sure what the answer to that is, except over time hope that their maturity develops enough to cope with those sorts of issues.
An officer of SWCC remarked similarly on the consequences for bottom-up trust in regional bodies of governments devolving to them:
… not just the responsibility for the bureaucracy but also the responsibility for making hard decisions. Governments – excuse me – didn’t have the testicles to make those hard decisions. … So who’s going to get the bollocking? It’s going to be SWCC and its staff. The hard decisions are being left to us to perform. And the bureaucracy was up there but now it’s us, so we’re an easy target.

40
3.4.3 Nesting as a way of engaging individuals and local groups with the regional model Feedback across the three cases was generally optimistic that early deficits of grass roots trust in the regional delivery model could be made up by more systematic attention to the challenge of establishing this trust. The most consistent message in this respect was that the regions as defined are too large for meaningful community engagement, and that the level of engagement needed for establishing farmers’ trust in the model would normally only be possible where engagement occurs primarily through groups closer to the scale of farmers. For instance, an officer of the Fitzroy Basin Association commented at the workshop convened for this region: ‘Those landholders in the Central Highlands are dealing with someone in Emerald. … It’s someone within their own community, and they don’t have to deal with the shiny bums in Rocky [Rockhampton]’. A member of the Association’s board chimed in saying: ‘Because those local people know the issues, know what’s been happening, know what needs doing. And even if they haven’t got the landholder onboard immediately, down the track the ones that aren’t onboard will come onboard, saying, ‘Everyone else is doing it. Why am I being left out?’. The nesting concept, as discussed in the workshops and interviews convened in each case-study region during 2005, generally struck a chord with participants as a way of addressing the deficits of vertical trust perceived to be undermining the model’s capacity to deliver the advantages of a truly community-based system. For instance, an officer of the Mallee CMA remarked when discussing the Mallee Lands Implementation Committee’s role of linking the CMA with its constituents that ‘there’s probably not the link between the nest above it and the nest below it’. A Mallee dryland farmer commented that ‘Communication is absolutely vital. But it must go down to people on the ground. And the people on the ground need to have some contact with those a bit further up the nest’. A member of the board of the Fitzroy Basin Association interpreted the nesting concept as ‘building from the bottom – from neighbourhood catchments to sub-regions, to regions, and then up into the bigger picture’. The concept was discussed most vigorously by participants from the South West Catchments case, where various attempts to establish multi-level systems of community-based governance consist with the concept had occurred prior to introduction of the regional delivery model. For instance, the Blackwood Basin Group had initiated a Zone Action Planning process to promote landholders’ participation as a way of empowering them and establishing their trust. The process involved nine zones, a committee of landholders in each zone responsible for planning and implementing projects on the basis of technical support provided through the BBG, and the BBG overseeing the process to ensure consistency of activity in each zone with Basin priorities. As another example, the South West Catchments Council was established originally as a federation of existing community-based structures for integrated catchment management. This step was initiated by these structures rather than government-imposed. The federation was envisaged as a nested system in so far as the pre-existing structures were to be left with as much autonomy as possible. Participants from this case expressed frustration that their efforts to establish a nested community-based system from the bottom up had been disrupted by the restrictions governments had placed on how SWCC would operate under the regional delivery model. A member of the BBG committee remarked: ‘We had a perfect nested system, but it was taken away. There were different layers of nests up to the highest levels’. An NRMO from the Peel-Harvey subregion commented similarly:
The nesting model was really close about two years ago. And the regional delivery model has taken us further away from that. The Commonwealth is saying ‘what we want is this, and we want the community to do it’. They want us to do exactly what they want. It’s all very well to say it’s community based, but then the state and federal governments insist on a process that takes it away from what the community wants.
Various characteristics of a successful nested system of community-based governance were identified by participants from this case. A member of SWCC from the Geographe Bay subregion observed:
It’s how you build your nest. That’s the key factor. You need to start by designing a nest that your own community is comfortable with. So there’s going to be huge variety in the types of nests we build across
41
the community. [SWCC] can’t send out a plan saying this is the kind of nest you’re going to build. As you go higher up the order, the nests may possibly look more similar to those of other regions. But, as a start, you design your own community’s nest, the things that you’re comfortable with. Don’t think that the other guys have got it right.
The role of nesting in helping regional bodies like SWCC to bridge the large social distance between governments and individuals was highlighted by a SWCC member from the Peel-Harvey subregions as follows: ‘If your steps get too high it means you lose your connection between the base and the top’. A senior officer with the WA Government observed along similar lines:
You’ve got to have a three-tiered model, with the size of the regions we’ve created here, to implement actions on the ground. You need a second tier, or subregional level, and then you need grass-roots-type groups at the front line to actually do the actions. If we disenfranchise either of those two tiers below the regional level, it’s simply going to break down.
Another member of SWCC from the Peel-Harvey subregion commented:
Cooperation between the subregions is important for building a nested system. That means we can put more projects on the ground across more subregions. And it looks a lot better when there’s two or three subregions doing the same compared with one subregion doing its own little project.
3.4.4 Building vertical trust across levels of a nested community-based system Aside from these general observations regarding the characteristics of a successful nested system of community-based NRM under the regional delivery model, participants in the workshops and interviews identified various challenges requiring attention for success in this direction to be realised. One key challenge lies in establishing trust and cooperation between the different structures looking to work together within a nested system. The following remark from a CSIRO officer regarding the Fitzroy Basin case illustrates how introduction of the regional delivery model presented challenges to such trust and cooperation:
Pre-NAP, the FBA entered into a regional handshake agreement, basically, with two or three existing subregional players. That was more of a cooperative arrangement, where differentiation of roles and responsibilities was basically related to scale. So the Dawson Catchment Coordinating Association (DCCA) and the FBA saw themselves as partners, not like as a hierarchy. When NAP came along, that forced a renegotiation of that on the basis that the regional body would become the conduit for that funding. Initially there was a fair bit of tension generated by that. CHRRUP and the DCCA were pretty well established and functional entities in their own right, and could exist without the FBA, but they found themselves having to go cap in hand a bit. There was a power issue there that needed to be worked through.
Attempts to integrate landcare groups as a grass roots level of community-based NRM under the Mallee CMA provide another example of such challenges. When the CMA was established, its links with landcare groups in its region were fairly weak. A consultant at the workshop convened for the Mallee case in 2005 discussed explained how subsequently:
The CMA virtually carried in the landcare movement from a whole range of disparate starting points. … The groups were initially fairly self-supporting, with coordinators and facilitators employed in a whole hotch-potch of administrative arrangements. … Extension work in the Mallee had become reliant on short-term landcare funds. … That eventually came to a jarring halt not so long ago, and the CMA put a lot of time and effort into improving that landcare structure. They tried very hard to secure permanent funding and a proper sort of career path for landcare facilitators, and get them properly resourced …
The CMA’s support for landcare groups is provided through a system of six landcare networks structured in accordance with a Landcare Support Strategy developed in consultation with the groups. Each network is overseen by a steering committee comprising office-holders of the constituent groups. A landcare
42
coordinator is assigned to each of the networks. At the time of the workshop there were nine landcare coordinators within the region covering 25 landcare groups. Around half of the funds devoted by the CMA at the time to employing and supporting landcare coordinators came from funds obtained under the regional delivery model to implement the biodiversity program of the region’s NRM strategy. Despite the CMA’s support of landcare arrangements in its region, it was evident in 2005 that it had some way to go in forging the trust and ownership from landcare groups needed for them to accept greater responsibility for helping the CMA implement its biodiversity program. An officer of the CMA described the situation as follows:
Landcare groups have traditionally seen ripping the rabbits and more immediate issues as being the higher priority for them [compared with biodiversity projects]. But it was either lose their landcare facilitators, or accept splitting their role between [traditional] landcare and helping us implement the biodiversity action plans. … There was a genuine attempt to consult with the community groups on this. But there was probably a lack of clarity about what the groups were signing on for. For some groups it was like ‘Well, we want to keep our facilitator, so yeah, we’ll sign the agreement to do this work’, without really thinking about the implications. … [Tensions then arose] because we had the landcare people wanting to do traditional landcare stuff, and the biodiversity people providing the dollars saying ‘We’ve got to deliver on planting these trees, fencing this area of vegetation …’.
Asked about the potential of landcare coordinators to mediate trust between landholders and the CMA, this officer replied:
Landholders might be putting trust into the landcare movement, but I’m not sure the landcare movement’s bringing it back into the CMA. … Landcare has a very strong branding and a very strong sort of community ownership. … And that’s a challenge for us, because some landcare people still see it as out there doing its own thing, with the CMA just paying the bills.
For the CMA it was a case of ‘money can’t buy me love’. Realising the need to act more strategically to establish trust and cooperation from landcare groups and their members, the CMA brought the landcare networks and the Mallee Lands Implementation Committee under the common umbrella of its Community Capacity program – targeting enhanced communication as a way of developing the cooperation that had been lacking. Quality of communication was indeed highlighted across the cases as pivotal to developing vertical trust within the regional delivery model. While these discussions identified organisational structures as important for this communication, they also made it clear that good structures will not promote trust-building communication unless the emotional aspects of communication are also addressed. An officer with the FBA observed: ‘The thing that makes it all happen effectively is trust and respect. Respect is incredibly important for an ongoing relationship’. 3.4.5 Maintaining accountability without alienating the community A second key challenge in developing nested community-based processes for NRM that was identified across the cases is the challenge of maintaining accountability up and down the system without making the system so bureaucratic that it evokes from landholders and local groups the same frustrations and mistrust that they often feel towards government processes. A member of the BBG committee observed accordingly: ‘Landholders are feeling disenfranchised by the system because of the bureaucracy’. Nevertheless, there was general acceptance across the three cases of the need for ‘upward accountability’ measures to hold regional and other community-based groups responsible for the public funds channeled to them through the regional delivery model. There was wide recognition too of the need for ‘downward accountability’ measures to maintain trust in these groups from lower-level groups and individuals. An officer in the WA Government involved at a senior level of administering the regional delivery model in that state explained the difficulty of this challenge as follows:

43
One of the downsides of dealing with public money is that community concern about public moneys is extremely high. … If the critics of this model see the money going on new cars or on what they perceive as building up a local bureaucracy rather than works on ground, they get upset and vocal about it. So the level of accountability when you deal with public funds is infinitely greater than when dealing with private funds. Not only must justice be done, it must be seen to be done. That brings with it a lot of red tape and paperwork that people at the ground will see as unnecessary, but in reality is probably needed to overcome community concerns. … The challenge is to keep the red tape to a minimum so things don’t grind to a halt.
An officer in SWCC pointed as follows to other pressures leading regional bodies to become more bureaucratic:
Much of the resources that we currently and will have at the regional office level will be devoted to dealing with the new bureaucracy – the contracts, the audits, the reports, etcetera. Certainly many of us involved in the NRM movement are starting to get an idea of why our state governments are so bureaucratic. It’s not because their managers want to be bureaucratic but because they’ve got multiple 500-page Acts they have to conform to – occupational health and safety, equal opportunity, and so on – outside the Act that actually tells them what their job is.
Despite these pressures, feedback across the cases was reasonably optimistic that the threat to community-based processes from ‘bureaucratic creep’ was manageable. There was recognition that satisfying governmental accountability demands need not be onerous once streamlined reporting systems were developed (together with frustration that governments had been slow to facilitate this development). There was recognition too that that regional bodies could shield lower-level groups from much of this ‘red tape’, provided at least that these groups continued to justify this trust. The SWCC officer remarked accordingly:
At the regional level we don’t want to be running a system that looks over your shoulder every day at what you’re doing and questioning why you’re doing it. At the end of the day it’s saying we can trust you to achieve what you said you can achieve with the taxpayers’ money we’re giving you. Only if things go off the rails in a big way will we come in and say ‘Well, we trusted you, what went on here?’.
A common remark was that most local groups and individuals would accept accountability requirements they could see a valid reason for. A frequent cause for complaint in this respect, as articulated by members of the Serpentine-Jarrahdale LCDC (in the Peel-Harvey subregion of the South West Catchments Region), was that ‘the dollars and the accountability demands are out of kilter’. The concern in this particular case was that groups applying for small amounts of funding had been expected to complete as much paperwork as groups seeking much greater funding, and a one-size fits-all approach had been applied despite marked differences in the financial risks involved. 3.4.6 Allowing lower-level groups substantive autonomy A third challenge identified across the cases in developing nested systems of community-based NRM was the challenge of providing regional and lower-level bodies with the substantive autonomy they need to demonstrate through their decisions that they are indeed community-based rather than extensions of the arm of government. The importance of this autonomy for landholders’ cooperation with the regional delivery model is highlighted by the following comment from a Blackwood Basin landholder: ‘If we’re going to become an arm of government, then we’re not interested. We’ll go home. We are interested in this community’. A frequently-expressed frustration in this respect related to government reluctance to deliver on policy announcements, when the regional model was introduced, that regional bodies would be ‘block funded’ to implement their regional NRM strategies once those strategies had been accredited by government. Funding in this way would have given regional bodies considerably greater autonomy to practice adaptive management in pursuing their strategies than they came to be given, at least during the first phase of the model. Nevertheless, there was a reasonable degree of acceptance across the cases that governments needed to establish trust in the competence of the regional bodies before moving to block funding. Asked

44
how such trust from government could be established, an officer of the Mallee CMA answered: ‘Just maturing the structure and the model maturing. … It’s a young industry we’re in’. Nevertheless, the earlier-quoted remark from an FBA officer – that ‘if you hold everything so tightly that nothing can go belly-up, then you probably haven’t devolved anywhere near enough responsibility’ – is relevant here. It reminds us that although a ‘chicken and egg problem’ often exists in devolving responsibilities to lower levels, since capacity to discharge responsibilities cannot be proven until devolution actually occurs (Ribot 2002 p.15), prudent risk-taking from the top down is normally essential for community capacities to be allowed to develop. An officer of the Victorian Government, involved at a senior level in administration of the regional delivery model in that state, suggested as follows that the Commonwealth was over-cautious in devolving autonomy to regional bodies, especially in Victoria but also nation-wide:
Victoria … could have hit the ground running. But because it’s a national program, and the rules of the program had to be established by the Australian Government nationally, because they were accountable to the Audit Office and their Ministers, there were a heap of rules imposed on Victoria that we may not have had if we just managed their funds on behalf of a strong national focus. I think the Australian Government under-estimated the capability of the rest of the nation to do this work.
Feedback from the workshops and interviews indicated that an important aspect of providing lower-level groups with substantive autonomy lies in defining the rights, as well as responsibilities, of these groups as clearly as possible. The same FBA officer observed along these lines that:
As the regional group, we have to be very clear in what we provide as guidance to those to whom we devolve, … so that when they do their work, they know what can happen and what can’t. … If they went out there to landholders and started saying ‘We can fix all your weed problems’, and came back to us saying ‘We’ve got $78 million worth of weeds projects lined up’, we’d have to say, ‘Well, we’ve only got $200,000’. You can call it expectations management. It’s so landholders don’t get frustrated, staff of sub-regional groups don’t get frustrated, and we get the government intent behind these programs actually onto the ground. … The FBA needs to devolve enough power and authority to a subregion that they can get on and do that work, without either having to constantly check all the time, like ‘I’m not sure whether we can do that. I will have to check’.
This is not to imply that defining and demarcating responsibilities is always a simple matter, that it will always be possible to avoid ‘grey areas’. The FBA officer reflected that while some grey areas will normally remain, ‘We need at least to be able to say, ‘This is a grey area’’. The importance of higher levels respecting the autonomy of lower-level units in exercising the decision-making rights devolved to them is highlighted by the remark following from a senior officer in the WA Government, which despite its focus on relationships between government and regional bodies is applicable to all relationships where involving devolution of responsibilities to lower levels:
Government’s got a responsibility to strongly support the regional NRM groups and back their decisions, and not go to water when a lobby group comes to them and say they’re not getting their fair share of funding, and asks for the govt to intervene. Governments have got to be careful not to destroy the credibility of the process, and undermine the authority of the regional groups, by interfering with or overruling their decisions.
3.4.7 Bridging barriers to vertical trust Although efforts to build vertical trust under the regional delivery model faced some formidable barriers, as illustrated above, it was evident also from workshop and interview discussions that few, if any, of these barriers are insurmountable. One reason identified for optimism in this respect is that top-down scepticism of the community-based approach, from governments and even regional bodies, can often be turned around when sympathetic individuals are appointed to positions of influence in these institutions. An officer in the Mallee CMA observed accordingly that governmental scepticism of the advantages of an authentic

45
community-based approach is ‘going to change with the ebb and flow of the individual senior bureaucrats at the federal and state levels that are able to influence policy and practices at the time’. This observation accords with the key finding of Koontz et al. (2004) from research in the USA that hope for success in community-based collaborative approaches lies in the latitude available within governments for sympathetic officials to take steps to narrow the power differentials that block authentic collaboration. A further reason for optimism is that some regional and subregional bodies, because of their histories and leadership capacities, have been able to win concessions from higher-level institutions allowing them to act more effectively as community-based organisations. An officer from the FBA recalled how:
… the FBA has put a lot of time and effort into government, since some of the stuff that they’ve wanted us to do has just been ridiculous. We’ve said, ‘No. It’s not going to happen. This is how we’re going to do it. Any problems with that?’ And most of the time they say, ‘No’. Similarly, the sub-regional groups have said it to us from time to time: ‘This stuff that you want us to do here is silly. We can’t do that, or we’re not going to do that, we don’t feel like doing it, or …’.
This officer explained as follows why the FBA was probably more successful than most other regional bodies in Queensland in challenging government decisions:
For 12 years, the FBA has learned to deal with all the conflict between different levels of government, different groups within the community, and so on. We’ve had a lot of conflicts, and we’ll have more, but we’ve got a bit of history in dealing with it. … Many of the Queensland regional groups are in their first couple of years, and they’re still feeling their first knocks of pressure … and don’t have the strength within the organisation and their boards to cope with those knocks. That will come.
Success in meeting higher-level expectations was identified across the three cases as one of the surest ways to gain governmental support for a genuine community-based process. A senior officer with the Victorian Government commented: ‘The challenge for CMAs is to show measurable impacts on some of the things we’re setting out to change, rather than just do a lot of things that make people feel good’. The ability of regional groups in Queensland to achieve such success seems to have been enhanced significantly by the Regional Groups Collective which was established in that state with government support. An officer of the Collective explained that ‘it was formed to provide a form for all the regional groups [in Queensland] to share information, to allow government agencies and industry groups to come and interface with them in the one setting’. An officer with the Queensland Government, involved in administering the regional delivery model in that state, commented on:
… a few groups, smaller ones, that have had some corporate governance issues recently. And other regional bodies through the Collective have supported them. … That’s a really significant change, that the Collective is mature enough to have the capacity to provide that support.
The same FBA officer observed, during the closing consultation for that case convened in late 2007, that the second phase of the regional delivery model in Queensland would be block funded, and that this substantial step towards greater regional autonomy could be traced to the Collective’s success in strengthening the performance of the weaker groups. Hence:
These are things which have been put in place because of the success of the successful. And, I think, because some of the groups which had found the going a bit tougher have made really good headway in the last twelve months, and made government more comfortable with the process. Had we all been in the league of the least successful, we wouldn’t be enjoying these sorts of things.
The Regional Groups Collective has also been an important vehicle for helping regional groups in Queensland to forge solidarity in challenging government policies detrimental to developing vertical trust and cooperation under the regional delivery model. The Collective’s officer remarked: ‘The government has the power because it’s distributing the funds. That’s a good example of the role of the Collective, in

46
responding to that on behalf of the regional groups, saying ‘We don’t want to do that’’. The officer from the Queensland Government recognised this role for the Collective as follows:
The Collective will, I guess, over time become more and more political, and try to influence government and its ministers. That’s the opportunity they have as they grow and mature. I don’t generally see that as a major problem.
Indeed, workshop and interview discussions highlighted the potential that devolution of NRM responsibilities has, over the longer term at least, to strengthen the power of lower-level units to influence decision-making under the regional delivery model. For instance, the FBA officer remarked:
Relationships with individual landholders are mainly now managed through sub-regional groups. They’re the pivotal relationship builder. If the sub-regional groups pull out and say, ‘No, go pack your own swag. I’m not doing this anymore’, then we’ve ultimately lost our contact with individuals. So that’s power for the sub-regional groups.
Similarly, an officer with CSIRO and the Queensland Government observed as follows how devolution of responsibilities in Queensland to regional bodies had served to strengthen downward accountability of that state’s government in discharging its own NRM responsibilities:
The regional bodies are saying, ‘Hey, this is your responsibility. We’re not supposed to be monitoring natural resource condition. You’re supposed to do that. You’re supposed to tell us whether or not investments are effective.
3.5 Summary and closing remarks Four main themes were identified from the qualitative analysis carried out as part of the case studies. These themes were: 1. Don’t do for a lower-level group what it can do for itself 2. Appraise lower-level capacities carefully, and recruit with respect 3. Invest in lower-level capacities 4. Establish and maintain vertical trust The last of these themes was the most multi-faceted. Discussions around this theme were concerned with:
a. farmers continuing to mistrust government; b. scepticism of government motives for introducing the regional delivery model; c. nested community-based processes as a means of countering this mistrust and scepticism; d. challenges of building vertical trust (between governments and community-based groups, and between community-based groups situated at different levels); e. difficulties for regional bodies in maintaining upward accountability to governments without alienating their constituents; f. the value of allowing lower-level groups substantive autonomy; and g. possibilities for bridging barriers to vertical trust.
In addition to the themes identified in this chapter, the qualitative research also identified a range of key issues associated with farmers’ trust in the regional delivery model, at least in the three cases studied. These issues were an important foundation for developing questionnaire items for measuring such trust so that it could be analysed quantitatively. Accordingly, they are presented more appropriately in the next chapter (in Table 4.44) which focuses on the design of the quantitative analysis.

47
4. Quantitative Research Design The quantitative research undertaken in this project was concerned primarily with identifying how farmers’ trust in the regional delivery model – including in their relevant regional and subregional NRM bodies – helps predict their adoption of conservation practices. In seeking to examine this relationship it was important to distinguish the effects of this trust from the effects of other ‘explanatory variables’ that might also predict this adoption. As explained in section 2.1, the method of multiple regression was applied in this study to control for the effects of other explanatory variables when establishing whether and how farmers’ trust in the regional delivery model predicts their adoption plans for conservation practices promoted to them under that model. An account of the variables included in the multiple regression analyses is presented in this chapter. For each multiple regression model, a single dependent variable was specified. Details of this specification are presented in section 4.1. The problem of ‘censoring’ associated with the data available on the dependent variables is discussed. A particular variant of multiple regression analysis that is appropriate for such data, called censored normal regression, was consequently applied. Section 4.2 specifies each explanatory variable included in the models, and explains and justifies the particular hypothesis tested in respect of each explanatory variable. Details of how data for each of these variables was derived from the data collected from the farmer surveys are also provided. Section 4.3 presents some closing remarks. 4.1 Dependent variables 4.1.1 Definition The explanatory variables, and associated hypotheses, are defined and discussed in section 4.2. The dependent variables for models measured survey respondents’ expected change in adoption of a particular conservation practice over the subsequent ten years. Each respondent’s expected adoption change for a given practice was calculated by subtracting their response regarding current adoption of that practice from their response regarding the level of adoption they expected after ten years (both measured in hectares). Accordingly, each model sought to account for variability among respondents in their expected adoption change for a particular conservation practice. Each of the individual models differed only in terms of the particular conservation practice focused upon. Models were estimated for all but one of the 23 on-farm conservation practices for which data were collected through the mail-out surveys5. Accordingly, 22 models were estimated. The model for any given practice was estimated with data for all ‘applicable respondents’; i.e., excluding respondents who indicated the practice was ‘not applicable’ to their property. Table 4.1 presents frequency distributions for the expected adoption changes of applicable Blackwood Basin respondents in respect of each conservation practice relevant to that case.
5 The exception was the practice irrigation water-use efficiency measures included in the questionnaire for the Central Highlands case, since the number of respondents indicating the practice was applicable to their properties was too few to allow the models to be estimated.

48
Table 4.1: Frequency distributions for expected adoption changes for relevant practices by applicable Blackwood Basin respondents
Practice Proportion (%) of applicable respondents expecting to change their use of
practice by: n
<= -500 ha
-500 to -100 ha
-99 to -1 ha
0 ha 1 to 99 ha
100 to 499 ha
>= 500 ha
Surface water management 2.7 2.3 3.1 53.1 15.4 16.9 6.5 260
Groundwater management 0.0 0.5 2.6 63.3 17.3 11.7 4.6 196
Establish perennial vegetation 0.0 1.2 2.7 57.3 29.4 7.5 2.0 255
Establish perennial pastures 0.7 0.0 2.2 51.5 25.0 17.5 3.0 268
Revegetation & protective fencing 0.0 1.5 3.8 56.4 28.6 8.3 1.5 266
Soil remediation 0.4 1.1 1.1 79.6 5.7 5.7 6.4 265
Zero or minimum tillage cropping 1.4 2.7 0.9 70.0 10.0 11.4 3.6 220
Pest and weed control 1.4 1.7 1.7 83.6 4.2 4.5 2.8 287
Table 4.2 presents frequency distributions for the expected adoption changes of applicable Central Highlands respondents in respect of each conservation practice relevant to that case. Table 4.2: Frequency distributions for expected adoption changes for relevant practices by Central
Highlands respondents
Practice Proportion (%) of applicable respondents expecting to change their use of practice by:
n
<= -500 ha
-500 to -100 ha
-99 to -1 ha
0 ha 1 to 99 ha
100 to 499 ha
>= 500 ha
Maintain groundcover on grazing land 0.5 0.0 0.0 76.8 2.9 5.3 14.6 134
Fencing to land type for grazing 0.5 0.0 0.0 66.1 0.0 4.0 29.4 125
Minimum or zero tillage cropping 2.7 1.8 2.4 79.6 0.0 7.8 5.6 97
Soil conservation measures 1.7 1.5 1.0 70.1 3.9 9.7 12.2 120
Irrigation water-use efficiency measures
0.0 0.0 5.1 73.1 5.1 6.7 9.9 26
Property management planning 0.0 0.0 1.1 81.1 0.0 2.6 15.3 106
Fencing riparian areas and installing watering points
1.5 1.0 0.5 64.9 5.2 5.9 20.9 118
Environmental weeds control 1.8 0.9 1.6 75.7 1.9 4.3 13.8 142
Table 4.3 presents frequency distributions for the expected adoption changes of applicable Mallee dryland respondents in respect of each conservation practice relevant to that case.
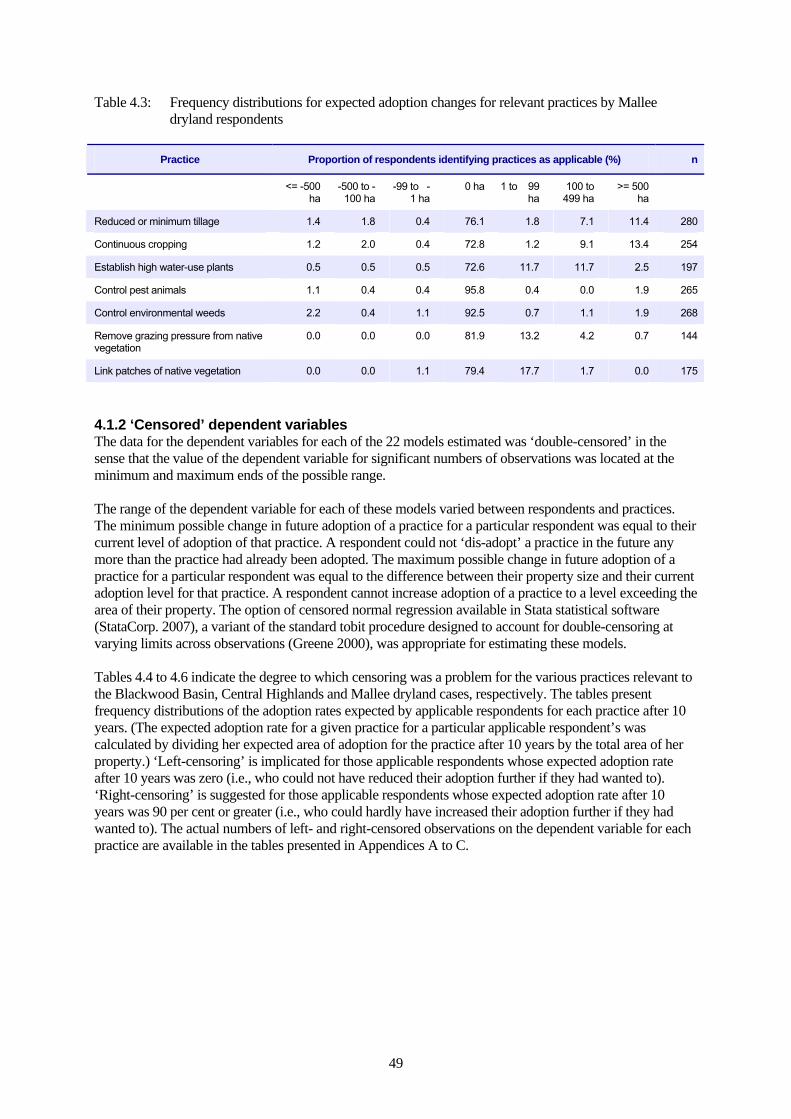
49
Table 4.3: Frequency distributions for expected adoption changes for relevant practices by Mallee dryland respondents
Practice Proportion of respondents identifying practices as applicable (%) n
<= -500 ha
-500 to -100 ha
-99 to -1 ha
0 ha 1 to 99 ha
100 to 499 ha
>= 500 ha
Reduced or minimum tillage 1.4 1.8 0.4 76.1 1.8 7.1 11.4 280
Continuous cropping 1.2 2.0 0.4 72.8 1.2 9.1 13.4 254
Establish high water-use plants 0.5 0.5 0.5 72.6 11.7 11.7 2.5 197
Control pest animals 1.1 0.4 0.4 95.8 0.4 0.0 1.9 265
Control environmental weeds 2.2 0.4 1.1 92.5 0.7 1.1 1.9 268
Remove grazing pressure from native vegetation
0.0 0.0 0.0 81.9 13.2 4.2 0.7 144
Link patches of native vegetation 0.0 0.0 1.1 79.4 17.7 1.7 0.0 175
4.1.2 ‘Censored’ dependent variables The data for the dependent variables for each of the 22 models estimated was ‘double-censored’ in the sense that the value of the dependent variable for significant numbers of observations was located at the minimum and maximum ends of the possible range. The range of the dependent variable for each of these models varied between respondents and practices. The minimum possible change in future adoption of a practice for a particular respondent was equal to their current level of adoption of that practice. A respondent could not ‘dis-adopt’ a practice in the future any more than the practice had already been adopted. The maximum possible change in future adoption of a practice for a particular respondent was equal to the difference between their property size and their current adoption level for that practice. A respondent cannot increase adoption of a practice to a level exceeding the area of their property. The option of censored normal regression available in Stata statistical software (StataCorp. 2007), a variant of the standard tobit procedure designed to account for double-censoring at varying limits across observations (Greene 2000), was appropriate for estimating these models. Tables 4.4 to 4.6 indicate the degree to which censoring was a problem for the various practices relevant to the Blackwood Basin, Central Highlands and Mallee dryland cases, respectively. The tables present frequency distributions of the adoption rates expected by applicable respondents for each practice after 10 years. (The expected adoption rate for a given practice for a particular applicable respondent’s was calculated by dividing her expected area of adoption for the practice after 10 years by the total area of her property.) ‘Left-censoring’ is implicated for those applicable respondents whose expected adoption rate after 10 years was zero (i.e., who could not have reduced their adoption further if they had wanted to). ‘Right-censoring’ is suggested for those applicable respondents whose expected adoption rate after 10 years was 90 per cent or greater (i.e., who could hardly have increased their adoption further if they had wanted to). The actual numbers of left- and right-censored observations on the dependent variable for each practice are available in the tables presented in Appendices A to C.
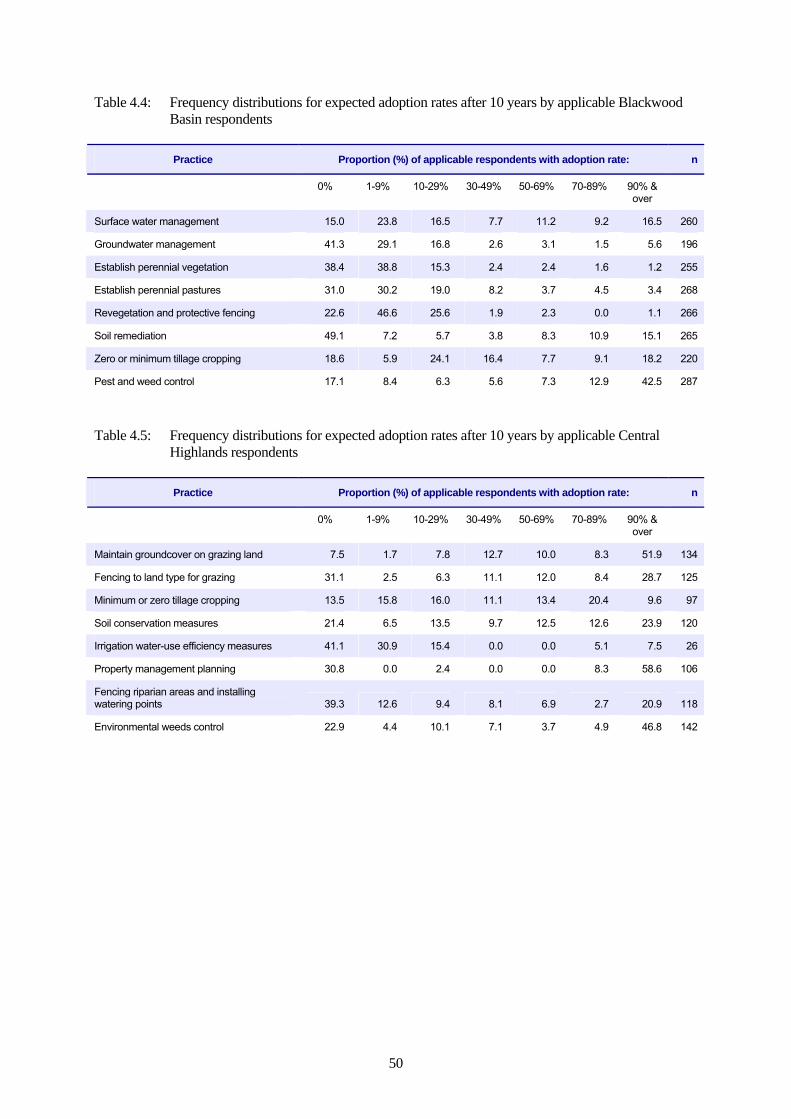
50
Table 4.4: Frequency distributions for expected adoption rates after 10 years by applicable Blackwood Basin respondents
Practice Proportion (%) of applicable respondents with adoption rate: n
0% 1-9% 10-29% 30-49% 50-69% 70-89% 90% & over
Surface water management 15.0 23.8 16.5 7.7 11.2 9.2 16.5 260
Groundwater management 41.3 29.1 16.8 2.6 3.1 1.5 5.6 196
Establish perennial vegetation 38.4 38.8 15.3 2.4 2.4 1.6 1.2 255
Establish perennial pastures 31.0 30.2 19.0 8.2 3.7 4.5 3.4 268
Revegetation and protective fencing 22.6 46.6 25.6 1.9 2.3 0.0 1.1 266
Soil remediation 49.1 7.2 5.7 3.8 8.3 10.9 15.1 265
Zero or minimum tillage cropping 18.6 5.9 24.1 16.4 7.7 9.1 18.2 220
Pest and weed control 17.1 8.4 6.3 5.6 7.3 12.9 42.5 287
Table 4.5: Frequency distributions for expected adoption rates after 10 years by applicable Central
Highlands respondents
Practice Proportion (%) of applicable respondents with adoption rate: n
0% 1-9% 10-29% 30-49% 50-69% 70-89% 90% & over
Maintain groundcover on grazing land 7.5 1.7 7.8 12.7 10.0 8.3 51.9 134
Fencing to land type for grazing 31.1 2.5 6.3 11.1 12.0 8.4 28.7 125
Minimum or zero tillage cropping 13.5 15.8 16.0 11.1 13.4 20.4 9.6 97
Soil conservation measures 21.4 6.5 13.5 9.7 12.5 12.6 23.9 120
Irrigation water-use efficiency measures 41.1 30.9 15.4 0.0 0.0 5.1 7.5 26
Property management planning 30.8 0.0 2.4 0.0 0.0 8.3 58.6 106
Fencing riparian areas and installing watering points 39.3 12.6 9.4 8.1 6.9 2.7 20.9 118
Environmental weeds control 22.9 4.4 10.1 7.1 3.7 4.9 46.8 142
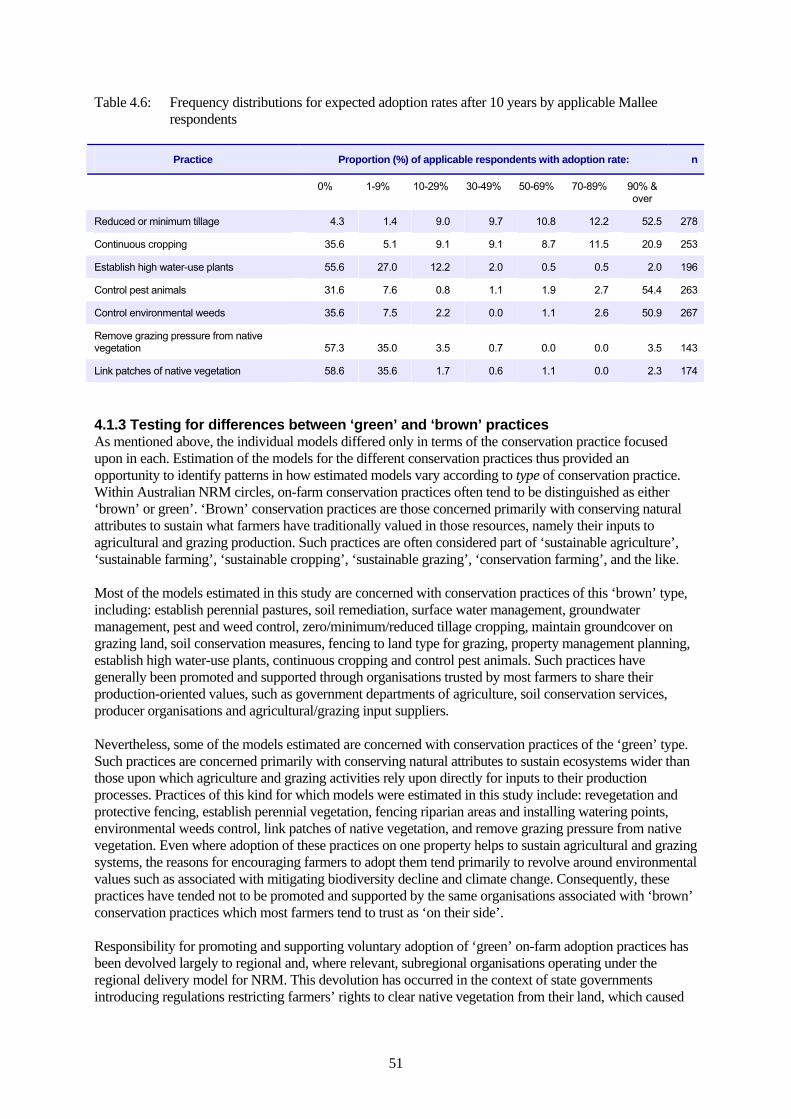
51
Table 4.6: Frequency distributions for expected adoption rates after 10 years by applicable Mallee respondents
Practice Proportion (%) of applicable respondents with adoption rate: n
0% 1-9% 10-29% 30-49% 50-69% 70-89% 90% & over
Reduced or minimum tillage 4.3 1.4 9.0 9.7 10.8 12.2 52.5 278
Continuous cropping 35.6 5.1 9.1 9.1 8.7 11.5 20.9 253
Establish high water-use plants 55.6 27.0 12.2 2.0 0.5 0.5 2.0 196
Control pest animals 31.6 7.6 0.8 1.1 1.9 2.7 54.4 263
Control environmental weeds 35.6 7.5 2.2 0.0 1.1 2.6 50.9 267
Remove grazing pressure from native vegetation 57.3 35.0 3.5 0.7 0.0 0.0 3.5 143
Link patches of native vegetation 58.6 35.6 1.7 0.6 1.1 0.0 2.3 174
4.1.3 Testing for differences between ‘green’ and ‘brown’ practices As mentioned above, the individual models differed only in terms of the conservation practice focused upon in each. Estimation of the models for the different conservation practices thus provided an opportunity to identify patterns in how estimated models vary according to type of conservation practice. Within Australian NRM circles, on-farm conservation practices often tend to be distinguished as either ‘brown’ or green’. ‘Brown’ conservation practices are those concerned primarily with conserving natural attributes to sustain what farmers have traditionally valued in those resources, namely their inputs to agricultural and grazing production. Such practices are often considered part of ‘sustainable agriculture’, ‘sustainable farming’, ‘sustainable cropping’, ‘sustainable grazing’, ‘conservation farming’, and the like. Most of the models estimated in this study are concerned with conservation practices of this ‘brown’ type, including: establish perennial pastures, soil remediation, surface water management, groundwater management, pest and weed control, zero/minimum/reduced tillage cropping, maintain groundcover on grazing land, soil conservation measures, fencing to land type for grazing, property management planning, establish high water-use plants, continuous cropping and control pest animals. Such practices have generally been promoted and supported through organisations trusted by most farmers to share their production-oriented values, such as government departments of agriculture, soil conservation services, producer organisations and agricultural/grazing input suppliers. Nevertheless, some of the models estimated are concerned with conservation practices of the ‘green’ type. Such practices are concerned primarily with conserving natural attributes to sustain ecosystems wider than those upon which agriculture and grazing activities rely upon directly for inputs to their production processes. Practices of this kind for which models were estimated in this study include: revegetation and protective fencing, establish perennial vegetation, fencing riparian areas and installing watering points, environmental weeds control, link patches of native vegetation, and remove grazing pressure from native vegetation. Even where adoption of these practices on one property helps to sustain agricultural and grazing systems, the reasons for encouraging farmers to adopt them tend primarily to revolve around environmental values such as associated with mitigating biodiversity decline and climate change. Consequently, these practices have tended not to be promoted and supported by the same organisations associated with ‘brown’ conservation practices which most farmers tend to trust as ‘on their side’. Responsibility for promoting and supporting voluntary adoption of ‘green’ on-farm adoption practices has been devolved largely to regional and, where relevant, subregional organisations operating under the regional delivery model for NRM. This devolution has occurred in the context of state governments introducing regulations restricting farmers’ rights to clear native vegetation from their land, which caused

52
widespread anger and mistrust among farmers towards the government agencies responsible for enforcing these regulations. This mistrust has extended for many farmers also to scepticism of the motives behind programs seeking to promote (including with payment of cost-sharing contributions) voluntary uptake of ‘green’ conservation practices, including those administered by regional and subregional NRM bodies. Part of this scepticism stem from fears, as noted in Table 5.1, that greater voluntary adoption now may make it easier later for governments to make it mandatory. It is reasonable to hypothesise, therefore, that trust in the regional delivery model – and particularly trust earned by regional and subregional bodies from farmers – will have greater traction on farmers’ decisions to adopt ‘green’ conservation practices than on their decisions to adopt ‘brown’ conservation practices. Comparison of the models estimated for ‘brown’ and ‘green’ conservation practices – within each case and also across the three cases – will provide a test of this hypothesis. 4.2 Explanatory variables and corresponding hypotheses Previous research in Australia and elsewhere has identified a range of variables as predictors of farmers’ adoption of conservation practices in particular contexts (Pannell et al. 2006). As far as possible given the constraints on collecting data through mail-out surveys (particularly farmers’ time and patience), the regression models estimated in this study included explanatory variables identified in previous research as key predictors of farmers’ adoption of conservation practices. The regression models estimated for the Blackwood Basin and Central Highlands cases each comprised 18 explanatory variables plus an intercept term. These explanatory variables are listed in Table 4.7. The models estimated for the Mallee Region case comprised a corresponding set of explanatory variables, with the exception that the variable trust in subregional body was not included since no relevant subregional body exists in that Region. The hypothesised direction, or directions, of relationship between each explanatory variable and the relevant dependent variable is also noted in Table 4.7. The symbol ‘+’ for local group involvement, for instance, indicates that the coefficient for this explanatory variable in all estimated models was expected to be positive. The symbol ‘+ / -’ for property area, on the other hand, indicates that the coefficient for this variable in all estimated models was expected only to differ from zero (i.e., either to be positive or negative). Also included in Table 4.7 are the questionnaire items from which observations for each explanatory variable were derived and, where relevant, explanations of how values for each variable were derived from the corresponding item scores.

53
Table 4.7: Explanatory variables and associated hypotheses and questionnaire items Explanatory variable Expect-
ed sign Questionnaire items Measurement
Property area + / - What is the total area of land owned or managed by you or your immediate family in the (relevant subregion)?
Hectares
% net income from grazing + / - In approximate terms, please indicate the percentage of your property’s total net income from farming over the last few years that came from grazing?
%
Years experience farming + / - As an adult, how many years practical experience do you have in owning, managing or working on a agricultural or grazing property?
Years
Local group involvement + We are interested in local groups concerned with sustainable farming/grazing/irrigation issues, or natural resource or environmental issues, on or near your property. (For the one such group) that your property has been most involved with over the last few years, please indicate your property’s level of involvement with this local group over the last few years.
0 = no involvement
1 = occasional
2 = fairly active
3 = active involvement
Formal education + / - What is the highest level of formal education you completed?
1 = primary school
2 = part secondary
3 = all secondary
4 = trade/technical certificate
5 = diploma/associate diploma
6 = degree
Place attachment + / - How strongly do you agree or disagree with each of the following statements?
I feel a bond with our property
I feel a bond with our district
1 = strongly disagree
2= disagree
3 = agree
4 = strongly agree
Scale scores calculated as means of the 2 item scores.
Cronbach’s Alpha values:
Blackwood Basin = 0.69
Central Highlands = 0.72
Mallee = 0.81
Profitability + / - How profitable has your property been over the last few years?
1 = very unprofitable
2 = unprofitable
3 = breaking even
4 = profitable
5 = very profitable
Equity ratio + / - Approximately, what is the current level of equity in your property?
1 = less than 50%
2 = 50-69%
3 = 70-89%
4 = 90% and over
% income from farm business + / - In the last few years, about what proportion of your household’s total net income came from farming activities on your property?
1 = less than 20%
2 = 20-49%
3 = 50-69%
4 = 70-89%
5 = 90% and over

54
Table 4.7 (continued) Explanatory variable Expect-
ed sign Questionnaire items Measurement
Contribution to goals + How strongly does (relevant practice) help or hurt your property’s chances of achieving its main goals?
1 = hurt greatly
2 = hurt moderately
3 = hurt slightly
4 = help slightly
5 = help moderately
6 = help greatly
Perceived commons problem + / - Sometimes, if a practice is going to work properly on one place, it needs also to be used by other landholders in the same district. In your view, how much does the effectiveness on your property of (relevant practice) depend on what others in your district are doing?
(If you marked ‘possibly/certainly depends on others’), how likely is it that other landholders in your district will use the practice sufficiently for it to work properly on your place?
0 = doesn’t depend on others
1 = possibly depends
2 = certainly depends on others
1 = highly likely
2 = likely
3 = neither likely or unlikely
4 = unlikely
5 = highly unlikely
Variable score for a respondent was zero if answer to first item was ‘doesn’t depend on others’. Otherwise it was calculated as the product of the two item scores.
Expected future district adoption
+ / - How widely do you expect (the relevant practice) will eventually be used in your district?
1 = zero or minimal use
2 = limited use
3 = moderate use
4 = wide use
Trust in subregional body
Since no relevant subregional body exists in the Mallee Region, this variable was excluded from models estimated for this Region’s farmers.
+ / - The (relevant subregional body) understands the issues faced in our district.
The (relevant subregional body) is serious about helping our community to solve our own NRM problems.
Community members on the (relevant subregional body) can be trusted to argue forcefully for the interests of the (relevant subregion).
Staff of the (relevant subregional body) care about our community.
The (relevant subregional body) is less bureaucratic than government generally.
1 = strongly disagree
2 = disagree
3 = agree
4 = strongly agree
Scale scores calculated as means of the 5 item scores.
Cronbach’s Alpha values:
Blackwood Basin = 0.90
Central Highlands = 0.91
Trust in regional body + / - The (relevant regional body) understands the issues faced in our district.
The (relevant regional body) is serious about helping our community to solve our own NRM problems.
Community members on the (relevant regional body) can be trusted to argue forcefully for the interests of the (relevant region).
Staff of the (relevant regional body) care about our community.
The (relevant regional body) is less bureaucratic than government generally.
1 = strongly disagree
2 = disagree
3 = agree
4 = strongly agree
Scale scores calculated as means of the 5 item scores.
Cronbach’s Alpha values:
Blackwood Basin = 0.87
Central Highlands = 0.90
Mallee = 0.87

55
Table 4.7 (continued) Explanatory variable Expect-
ed sign Questionnaire items Measurement
Trust in gov't commitment to community empowerment
+ / - The Federal Government is serious about empowering our community to solve our own NRM problems.
The (relevant state government) is serious about empowering our community to solve our own NRM problems.
1 = strongly disagree
2 = disagree
3 = agree
4 = strongly agree
Scale scores calculated as means of the 2 item scores.
Cronbach’s Alpha values:
Blackwood Basin = 0.74
Central Highlands = 0.73
Mallee = 0.76
Trust in government integrity + / - The regional approach is a way for governments to ‘pass the buck’ on difficult issues.
The regional approach is part of a strategy to increase government regulation of rural land-use.
The regional approach is a way to transfer NRM costs onto volunteers.
1 = strongly agree
2 = agree
3 = disagree
4 = strongly disagree
Scale scores calculated as means of the 3 item scores.
Cronbach’s Alpha values:
Blackwood Basin = 0.65
Central Highlands = 0.58
Mallee = 0.63
Trust in regional/subregional autonomy
+ / - The (relevant regional body) is just a ‘rubber stamp’ for decisions made by the Federal Government.
The (relevant regional body) is just a ‘rubber stamp’ for decisions made by the (relevant state government).
The (relevant subregional body) is just a ‘rubber stamp’ for decisions made by the Federal Government.
The (relevant subregional body) is just a ‘rubber stamp’ for decisions made by the (relevant state government).
The (relevant subregional body) is just a ‘rubber stamp’ for decisions made by the (relevant regional body).
Note: Since no relevant subregional body exists in the Mallee Region, data on the last 3 of these items were not collected from this Region’s respondents.
1 = strongly agree
2 = agree
3 = disagree
4 = strongly disagree
Scale scores for Blackwood Basin and Central Highlands respondents were calculated as means of all 5 item scores. Scale scores for Mallee Region respondents were calculated as the mean of the first 2 items only.
Cronbach’s Alpha values:
Blackwood Basin = 0.86
Central Highlands = 0.91
Mallee = 0.86

56
4.2.1 Property characteristics The first two explanatory variables in each model were included to explore how the structural characteristics of respondents’ properties relate to their adoption of conservation practices. Property size (hectares) was included following the lead of a number of previous Australian studies of farmer adoption of conservation practices. Feder et al. (1985) remarked that a frequent reason given for expecting greater adoption of innovations on larger farms follows from the logic that the fixed costs of adoption are a lesser obstacle to uptake on larger farms where they can be defrayed over a greater area of adoption. Nevertheless, they observed that some studies have found tendencies for adoption of innovations to be greater on smaller farms. The possible reasons they identified for such findings included smaller farmers seeking to farm their land more intensively, and the opportunity costs of family labour on small farms being lower. Due to this ambiguity, it was hypothesised only that the coefficient of property size in each model differs from zero. Data on property size was collected from the questionnaire item ‘What is the total area of land owned or managed by you or your immediate family in the (relevant subregion)?’. Mean values for property size in the Blackwood Basin, Central Highlands and Mallee dryland cases were 1,117 hectares, 8,782 hectares, and 2,296 hectares, respectively. Frequency distributions for this variable for the three cases are presented in Tables 4.8 to 4.10. Table 4.8: Frequency distribution for property size of Blackwood Basin respondents
Proportion of respondents (%) n
< 100 ha 100 - 999 ha 1,000 - 1,999 ha 2,000 - 4,999 ha > 5,000 ha
9.0 47.2 25.9 16.9 1.0 413
Table 4.9: Frequency distribution for property size of Central Highlands respondents
Proportion of respondents (%) n
< 100 ha 100 - 999 ha 1,000 - 1,999 ha 2,000 - 4,999 ha > 5,000 ha
1.8 10.4 11.8 38.3 37.3 259
Table 4.10: Frequency distribution for property size of Mallee dryland respondents
Proportion of respondents (%) n
< 100 ha 100 - 999 ha 1,000 - 1,999 ha 2,000 - 4,999 ha > 5,000 ha
1.3 17.0 36.1 37.9 7.7 388
The other variable included in models to account for property structural characteristics was % net income from grazing. For nearly all respondents, the vast majority of their net income from farming over the previous few years came from grazing or broadacre cropping. Hence, this variable provides a measure of respondents’ current financial dependence on grazing enterprises relative to broadacre cropping enterprises. A number of the conservation practices covered in this study are clearly more relevant to grazing enterprises than cropping enterprises (e.g., revegetation and protective fencing, establish perennial pastures, and maintain groundcover on grazing land), and vice versa (continuous cropping and reduced or minimum tillage). However, a clear one-way relationship should not be expected between greater dependence on one of these enterprise classes (say, grazing) and the adoption of a conservation practice particularly relevant to that enterprise class (e.g., establish perennial pastures). The direction of such a

57
relationship can be expected to be positive if farmers tend to perceive the practice as benefiting that class of enterprises, and negative if they perceive it as handicapping those enterprises. Consequently, it was hypothesised only that the coefficient of % net income from grazing in each model differs from zero. Data on % net income from grazing was collected from the questionnaire item ‘Please indicate the percentages of your property’s total net income from farming over the last few years that came from each of the enterprise types below …’. Frequency distributions for this variable for the three cases are available from Tables 4.11 to 4.13 (i.e., from the ‘grazing’ row in each table). Table 4.11: Percentage of net farm income derived from various enterprise types: frequency distributions
for the Blackwood Basin Proportion of respondents (%) n
0% of net income
1 - 9% of net income
10 - 24% of net income
25 - 49% of net income
50 - 74% of net income
> 75% of net income
Broadacre cropping 39.6 2.0 13.2 17.8 22.2 5.1 409
Grazing 8.6 2.4 3.4 19.6 24.4 41.6 409
Dairy 96.6 0.0 0.0 0.2 0.7 2.4 409
Horticulture / viticulture 93.6 1.0 1.2 0.2 2.4 1.5 409
Other farming enterprises 85.1 2.0 4.2 1.2 2.4 5.1 409
Table 4.12: Percentage of net farm income derived from various enterprise types: frequency distributions
for the Central Highlands Proportion of respondents (%) n
0% of net income
1 - 9% of net income
10 - 24% of net income
25 - 49% of net income
50 - 74% of net income
> 75% of net income
Broadacre cropping - dryland 48.0 4.2 9.2 6.1 9.9 22.6 256
Broadacre cropping - irrigated 92.5 1.4 0.6 2.0 0.8 2.7 256
Grazing 10.2 5.4 10.5 7.9 8.5 57.5 256
Dairy 100.0 0.0 0.0 0.0 0.0 0.0 256
Horticulture / viticulture 99.5 0.0 0.0 0.0 0.0 0.5 256
Other farming enterprises 96.7 1.5 0.4 0.5 0.9 0.0 256

58
Table 4.13: Percentage of net farm income derived from various enterprise types: frequency distributions for Mallee dryland respondents
Proportion of respondents (%) n
0% of net income
1 - 9% of net income
10 - 24% of net income
25 - 49% of net income
50 - 74% of net income
> 75% of net income
Broadacre cropping 1.3 0.0 1.0 5.8 33.5 58.4 382
Grazing 15.7 5.5 34.6 33.5 9.7 1.0 382
Horticulture / viticulture 98.4 0.0 1.0 0.0 0.0 0.5 382
Other farming enterprises 92.9 2.6 1.6 0.8 1.6 0.5 382
4.2.2 Farmers’ human capital The next three explanatory variables in each model were included to examine how various elements of farmers’ human capital relate to their adoption of conservation practices. Years experience farming was included following the observation of Abadi Ghadim and Pannell (1999) that greater experience of this kind can have various influences on adoption. The direction of influence may depend on whether previous experiences with related innovations were positive or negative. It may depend also on the degree to which the skills accumulated through this experience are useful for successful adoption of a conservation practice. The more skills a farmer has accumulated in respect of existing practices, and therefore the greater his or her efficiency with those practices, the higher will be his or her opportunity costs of switching to alternative (e.g., conservation) practices less reliant on those skills. Given this ambiguity, coefficients of years experience farming were hypothesised only to differ from zero. Data on years experience farming was collected from the questionnaire item ‘As an adult (since turning 18), how many years practical experience do you have in owning, managing or working on an agricultural or grazing property?’. Frequency distributions for this variable for the three cases are presented in Tables 4.14 to 4.16. Table 4.14: Frequency distribution for years experience farming of Blackwood Basin respondents
Proportion of respondents (%) n
< 5 yrs 5 - 9 yrs 10 - 19 yrs 20 - 29 yrs 30 - 39 yrs > 40 yrs
0.6 3.1 10.7 18.9 31.1 35.5 318
Table 4.15: Frequency distribution for years experience farming of Central Highlands respondents
Proportion of respondents (%) n
< 5 yrs 5 - 9 yrs 10 - 19 yrs 20 - 29 yrs 30 - 39 yrs > 40 yrs
1.3 3.2 8.9 27.8 25.3 33.5 159

59
Table 4.16: Frequency distribution for years experience farming of Mallee dryland respondents
Proportion of respondents (%) n
< 5 yrs 5 - 9 yrs 10 - 19 yrs 20 - 29 yrs 30 - 39 yrs > 40 yrs
0.3 1.7 8.9 21.2 30.8 37.1 302
Another variable included to account for human capital considerations was local group involvement. Since the 1990s in Australia, extension services to farmers have increasingly been delivered through local groups, and this has included extension for natural resource management and associated conservation practices. Local groups involved in conservation extension have included landcare groups, catchment groups, sustainable farming groups, and the like. Cary and Webb (2000), for instance, observed how landcare groups have facilitated dissemination of information to farmers. They concluded also that landcare groups had helped shift farmers’ social norms more in favour of adopting conservation practices. Various studies have found adoption of some conservation practices to be related positively with membership of catchment and landcare groups (e.g., Cary et al. 2002; Curtis 1997; Curtis and DeLacy 1996; Kington and Pannell 2003; Mues et al. 1998), although the direction of the cause-effect relationship remains unclear. Given this evidence, local group involvement was hypothesised to relate positively with adoption of each conservation practice. Data on local group involvement were obtained from the questionnaire item: ‘We are interested in local groups concerned with sustainable farming / grazing / irrigation issues, or natural resource or environmental issues, on or near your property. Please list any such groups that your property has been involved with over the last few years’. Responses were coded according to whether at least one such group had been listed. Frequency distributions for these coded responses for the three cases are presented in Tables 4.17 to 4.19. Table 4.17: Frequency distribution for local group involvement of Blackwood Basin respondents
Proportion of respondents (%) n
At least one local group nominated No local group nominated
41.9 58.1 332
Table 4.18: Frequency distribution for local group involvement of Central Highlands respondents
Proportion of respondents (%) n
At least one local group nominated No local group nominated
35.0 65.0 168
Table 4.19: Frequency distribution for local group involvement of Mallee dryland respondents
Proportion of respondents (%) n
At least one local group nominated No local group nominated
58.8 41.3 320

60
The last of the three variables accounting for farmers’ human capital was formal education. Various studies have found a tendency for beneficial innovations to be adopted more quickly with higher levels of formal education (e.g., Feder et al. 1985; Goodwin and Schroeder 1994; Kilpatrick 2000). Not all innovations benefit all farmers, however, and Pannell et al. (2006) observed how farmers with greater formal education may be better at identifying innovations detrimental to their interests and may thus be less likely to adopt these innovations. Accordingly, coefficients for formal education were hypothesised only to differ from zero. Data on formal education were obtained from responses to the questionnaire item ‘What is the highest level of formal education you completed?’. Frequency distributions for this variable for the three cases are presented in Tables 4.20 to 4.22. Table 4.20: Frequency distribution for formal education of Blackwood Basin respondents
Proportion of respondents (%) n
Degree Diploma / Associate Diploma
Trade / Technical certificate
All secondary school
Part secondary school
Primary school Other
12.0 12.6 12.3 27.6 28.8 3.1 3.7 326
Table 4.21: Frequency distribution for formal education of Central Highlands respondents
Proportion of respondents (%) n
Degree Diploma / Associate Diploma
Trade / Technical certificate
All secondary school
Part secondary school
Primary school Other
8.0 35.3 24.7 11.3 11.4 6.0 3.2 161
Table 4.22: Frequency distribution for formal education of Mallee dryland respondents
Proportion of respondents (%) n
Degree Diploma / Associate Diploma
Trade / Technical certificate
All secondary school
Part secondary school
Primary school Other
4.6 48.7 19.9 13.9 6.0 5.3 1.7 302
4.2.3 Attachment to place In a category of its own was included the explanatory variable place attachment. Terms like ‘place attachment’ and ‘sense of place’ have found increasing use to refer to the phenomenon of places becoming imbued with meanings that enhance people’s emotional ties to a natural resource (Brunckhorst and Reeve 2006; Cheng et al. 2003; Vaske and Kobrin 2001). It seems part of the implicit rationale for the regional delivery model was that devolution of NRM governance to more local scales of place would more effectively mobilise individuals’ feelings of place attachment as a way of motivating their adoption of conservation practices. The variable place attachment was included in models to explore whether farmers’ emotional ties to their own locality (their property and district) are indeed associated with their adoption of conservation practices. Vaske and Kobrin (2001) found that place identity (the emotional aspect of place attachment that yields feelings of belonging and purpose) was more strongly associated with environmentally responsible behaviour than was place dependence (the functional aspect of place attachment that reflects the importance of a resource in providing inputs to desired activities).

61
The two questionnaire items used in this study to measure place attachment are listed in Table 4.7, and were adapted from items demonstrated by Williams and Vaske (2003) to provide a measure of the place identity aspect that is generalisable across multiple places. The internal consistency reliability of the scales derived from these two items for each of the three cases is acceptable, since the Cronbach’s Alpha values shown in Table 4.7 for each case exceed the generally-accepted lower bound of 0.6. In framing a hypothesis for the relationship between farmers’ place attachment and their adoption of conservation practices, we need to recognise that farmers’ localities differ, and also that farmers differ in how they feel affinity with their local landscape. For farmers whose place attachment derives largely from features of the local landscape maintained through existing farming practices, we might expect their place attachment to relate negatively with their adoption of conservation practices which threaten these features (e.g., replacement of pastures with perennial vegetation). For other farmers whose place attachment derives largely from natural features of the local landscape, in contrast, we might expect their place attachment to relate positively with their adoption of conservation practices that return agricultural landscapes closer to their natural state (e.g., linking patches of native vegetation). Accordingly, coefficients for place attachment were hypothesised only to differ from zero. Frequency distributions for the four questionnaire items concerned with attachment to place, including the two items from which place attachment was measured, are presented for the three cases in Tables 4.23 to 4.25. Table 4.23: Frequency distributions of Blackwood Basin responses to statements concerning attachment
to place Proportion of respondents (%) n
Strongly agree
Agree Disagree Strongly disagree
I feel a bond with our property 60.9 37.5 1.2 0.3 325
I feel a bond with our district 39.1 55.0 5.3 0.6 322
I feel a bond with the Blackwood Basin 7.5 47.4 36.9 8.2 306
I feel a bond with the South West Catchments Region
4.9 30.2 48.9 16.1 305
Table 4.24: Frequency distributions of Central Highlands responses to statements concerning attachment
to place Proportion of respondents (%) n
Strongly agree
Agree Disagree Strongly disagree
I feel a bond with our property 62.5 35.2 2.3 0.0 163
I feel a bond with our district 43.9 49.6 6.5 0.0 162
I feel a bond with the Central Highlands 37.3 55.3 7.4 0.0 160
I feel a bond with the Fitzroy Basin Region 6.2 50.7 39.8 3.2 153 Table 4.25: Frequency distributions of Mallee dryland responses to statements concerning attachment to
place Proportion of respondents (%) n
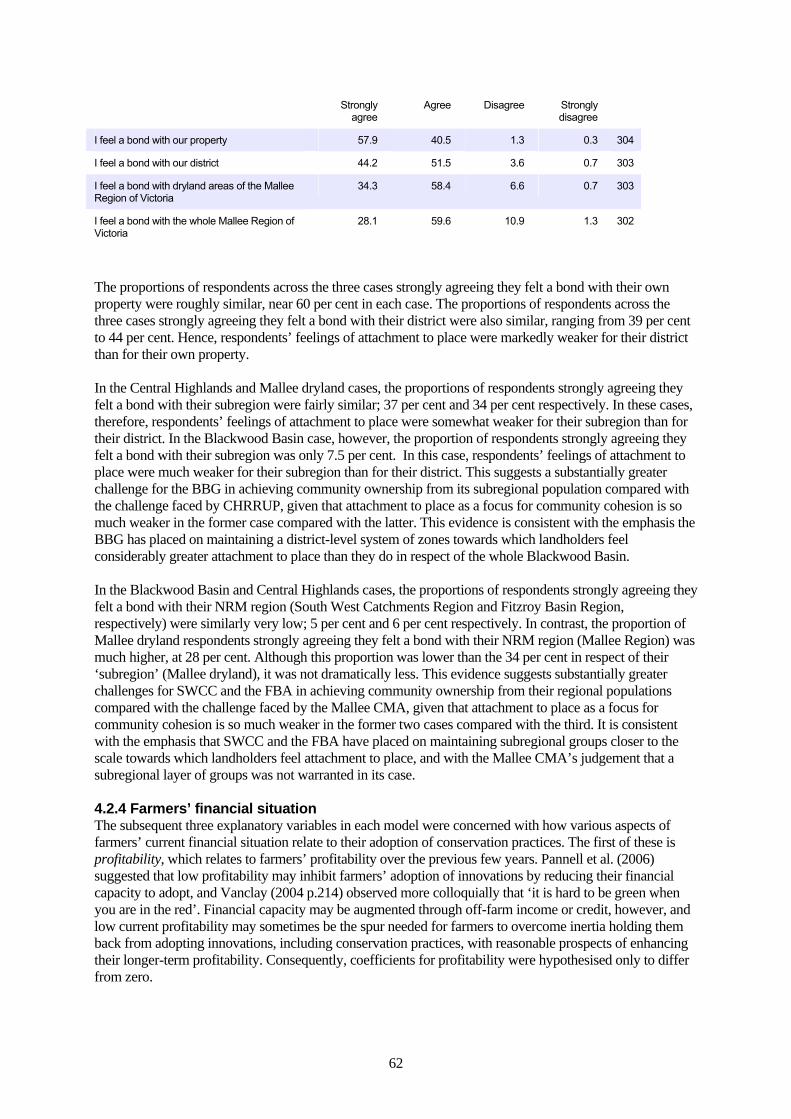
62
Strongly agree
Agree Disagree Strongly disagree
I feel a bond with our property 57.9 40.5 1.3 0.3 304
I feel a bond with our district 44.2 51.5 3.6 0.7 303
I feel a bond with dryland areas of the Mallee Region of Victoria
34.3 58.4 6.6 0.7 303
I feel a bond with the whole Mallee Region of Victoria
28.1 59.6 10.9 1.3 302
The proportions of respondents across the three cases strongly agreeing they felt a bond with their own property were roughly similar, near 60 per cent in each case. The proportions of respondents across the three cases strongly agreeing they felt a bond with their district were also similar, ranging from 39 per cent to 44 per cent. Hence, respondents’ feelings of attachment to place were markedly weaker for their district than for their own property. In the Central Highlands and Mallee dryland cases, the proportions of respondents strongly agreeing they felt a bond with their subregion were fairly similar; 37 per cent and 34 per cent respectively. In these cases, therefore, respondents’ feelings of attachment to place were somewhat weaker for their subregion than for their district. In the Blackwood Basin case, however, the proportion of respondents strongly agreeing they felt a bond with their subregion was only 7.5 per cent. In this case, respondents’ feelings of attachment to place were much weaker for their subregion than for their district. This suggests a substantially greater challenge for the BBG in achieving community ownership from its subregional population compared with the challenge faced by CHRRUP, given that attachment to place as a focus for community cohesion is so much weaker in the former case compared with the latter. This evidence is consistent with the emphasis the BBG has placed on maintaining a district-level system of zones towards which landholders feel considerably greater attachment to place than they do in respect of the whole Blackwood Basin. In the Blackwood Basin and Central Highlands cases, the proportions of respondents strongly agreeing they felt a bond with their NRM region (South West Catchments Region and Fitzroy Basin Region, respectively) were similarly very low; 5 per cent and 6 per cent respectively. In contrast, the proportion of Mallee dryland respondents strongly agreeing they felt a bond with their NRM region (Mallee Region) was much higher, at 28 per cent. Although this proportion was lower than the 34 per cent in respect of their ‘subregion’ (Mallee dryland), it was not dramatically less. This evidence suggests substantially greater challenges for SWCC and the FBA in achieving community ownership from their regional populations compared with the challenge faced by the Mallee CMA, given that attachment to place as a focus for community cohesion is so much weaker in the former two cases compared with the third. It is consistent with the emphasis that SWCC and the FBA have placed on maintaining subregional groups closer to the scale towards which landholders feel attachment to place, and with the Mallee CMA’s judgement that a subregional layer of groups was not warranted in its case. 4.2.4 Farmers’ financial situation The subsequent three explanatory variables in each model were concerned with how various aspects of farmers’ current financial situation relate to their adoption of conservation practices. The first of these is profitability, which relates to farmers’ profitability over the previous few years. Pannell et al. (2006) suggested that low profitability may inhibit farmers’ adoption of innovations by reducing their financial capacity to adopt, and Vanclay (2004 p.214) observed more colloquially that ‘it is hard to be green when you are in the red’. Financial capacity may be augmented through off-farm income or credit, however, and low current profitability may sometimes be the spur needed for farmers to overcome inertia holding them back from adopting innovations, including conservation practices, with reasonable prospects of enhancing their longer-term profitability. Consequently, coefficients for profitability were hypothesised only to differ from zero.

63
Data on profitability were obtained from responses to the questionnaire item ‘How profitable has your property been over the last few years?’. Frequency distributions for this variable for the three cases are presented in Tables 4.26 to 4.28. Table 4.26: Frequency distribution for profitability of Blackwood Basin respondents
Proportion of respondents (%) n
Very profitable Profitable Breaking even Unprofitable Very unprofitable
5.6 44.3 38.7 8.7 2.8 323
Table 4.27: Frequency distribution for profitability of Central Highlands respondents
Proportion of respondents (%) n
Very profitable Profitable Breaking even Unprofitable Very unprofitable
4.7 34.9 39.0 18.4 3.0 158
Table 4.28: Frequency distribution for profitability of Mallee dryland respondents
Proportion of respondents (%) n
Very profitable Profitable Breaking even Unprofitable Very unprofitable
3.3 34.6 45.2 13.0 4.0 301
The second variable included to account for farmers’ current financial state was equity ratio. Abadi Ghadim and Pannell (1999) suggested that farmers with higher equity are more likely to trial innovations since this makes them more able to bear the risks of the trials ending unsuccessfully. Another possible reason for expecting a positive relationship between equity ratio and adoption of conservation practices follows from observing that pay-offs from adoption of conservation practices are often relatively long-term, making such practices less attractive to farmers in financial difficulty (i.e., with low equity ratios) who tend to have higher discount rates (Quiggin 2001). Following these arguments, a positive relationship between equity ratio and farmer conservation of conservation practices was hypothesised. Data on equity ratio were obtained from the questionnaire item ‘Approximately, what is your current level of equity in your property?’. Frequency distributions for this variable for the three cases are presented in Tables 4.29 to 4.31.
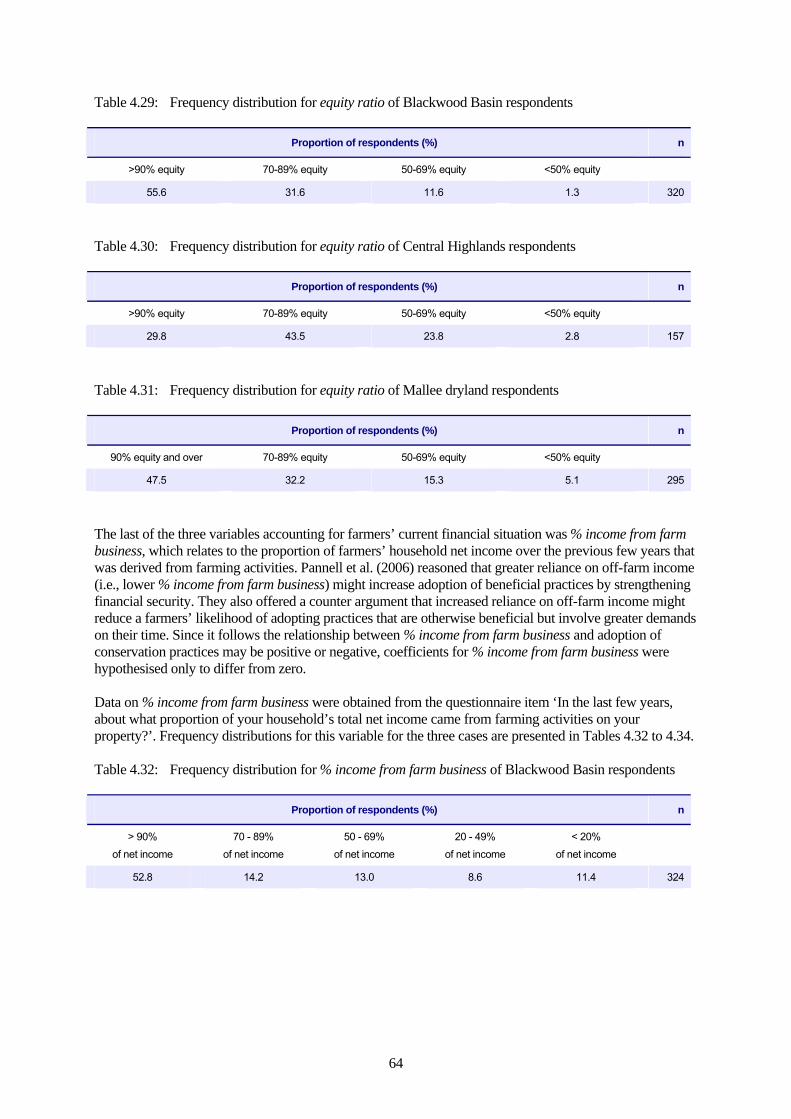
64
Table 4.29: Frequency distribution for equity ratio of Blackwood Basin respondents
Proportion of respondents (%) n
>90% equity 70-89% equity 50-69% equity <50% equity
55.6 31.6 11.6 1.3 320
Table 4.30: Frequency distribution for equity ratio of Central Highlands respondents
Proportion of respondents (%) n
>90% equity 70-89% equity 50-69% equity <50% equity
29.8 43.5 23.8 2.8 157
Table 4.31: Frequency distribution for equity ratio of Mallee dryland respondents
Proportion of respondents (%) n
90% equity and over 70-89% equity 50-69% equity <50% equity
47.5 32.2 15.3 5.1 295
The last of the three variables accounting for farmers’ current financial situation was % income from farm business, which relates to the proportion of farmers’ household net income over the previous few years that was derived from farming activities. Pannell et al. (2006) reasoned that greater reliance on off-farm income (i.e., lower % income from farm business) might increase adoption of beneficial practices by strengthening financial security. They also offered a counter argument that increased reliance on off-farm income might reduce a farmers’ likelihood of adopting practices that are otherwise beneficial but involve greater demands on their time. Since it follows the relationship between % income from farm business and adoption of conservation practices may be positive or negative, coefficients for % income from farm business were hypothesised only to differ from zero. Data on % income from farm business were obtained from the questionnaire item ‘In the last few years, about what proportion of your household’s total net income came from farming activities on your property?’. Frequency distributions for this variable for the three cases are presented in Tables 4.32 to 4.34. Table 4.32: Frequency distribution for % income from farm business of Blackwood Basin respondents
Proportion of respondents (%) n
> 90% of net income
70 - 89% of net income
50 - 69% of net income
20 - 49% of net income
< 20% of net income
52.8 14.2 13.0 8.6 11.4 324
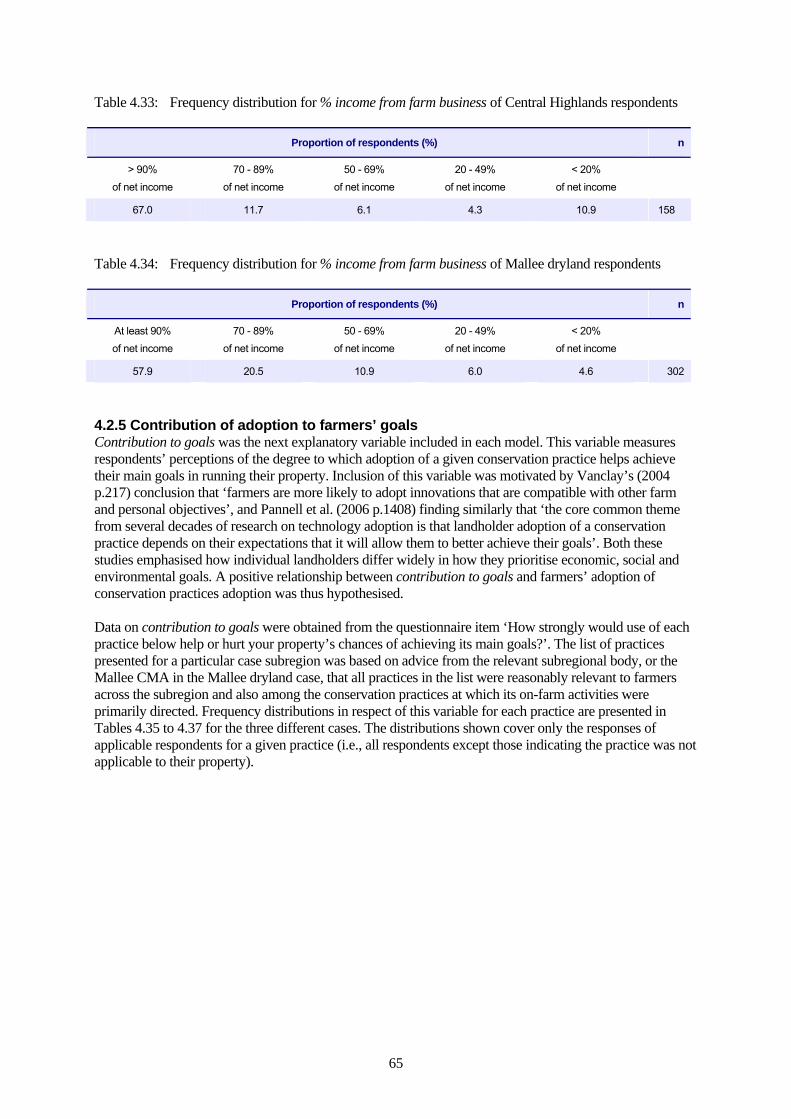
65
Table 4.33: Frequency distribution for % income from farm business of Central Highlands respondents
Proportion of respondents (%) n
> 90% of net income
70 - 89% of net income
50 - 69% of net income
20 - 49% of net income
< 20% of net income
67.0 11.7 6.1 4.3 10.9 158
Table 4.34: Frequency distribution for % income from farm business of Mallee dryland respondents
Proportion of respondents (%) n
At least 90% of net income
70 - 89% of net income
50 - 69% of net income
20 - 49% of net income
< 20% of net income
57.9 20.5 10.9 6.0 4.6 302
4.2.5 Contribution of adoption to farmers’ goals Contribution to goals was the next explanatory variable included in each model. This variable measures respondents’ perceptions of the degree to which adoption of a given conservation practice helps achieve their main goals in running their property. Inclusion of this variable was motivated by Vanclay’s (2004 p.217) conclusion that ‘farmers are more likely to adopt innovations that are compatible with other farm and personal objectives’, and Pannell et al. (2006 p.1408) finding similarly that ‘the core common theme from several decades of research on technology adoption is that landholder adoption of a conservation practice depends on their expectations that it will allow them to better achieve their goals’. Both these studies emphasised how individual landholders differ widely in how they prioritise economic, social and environmental goals. A positive relationship between contribution to goals and farmers’ adoption of conservation practices adoption was thus hypothesised. Data on contribution to goals were obtained from the questionnaire item ‘How strongly would use of each practice below help or hurt your property’s chances of achieving its main goals?’. The list of practices presented for a particular case subregion was based on advice from the relevant subregional body, or the Mallee CMA in the Mallee dryland case, that all practices in the list were reasonably relevant to farmers across the subregion and also among the conservation practices at which its on-farm activities were primarily directed. Frequency distributions in respect of this variable for each practice are presented in Tables 4.35 to 4.37 for the three different cases. The distributions shown cover only the responses of applicable respondents for a given practice (i.e., all respondents except those indicating the practice was not applicable to their property).
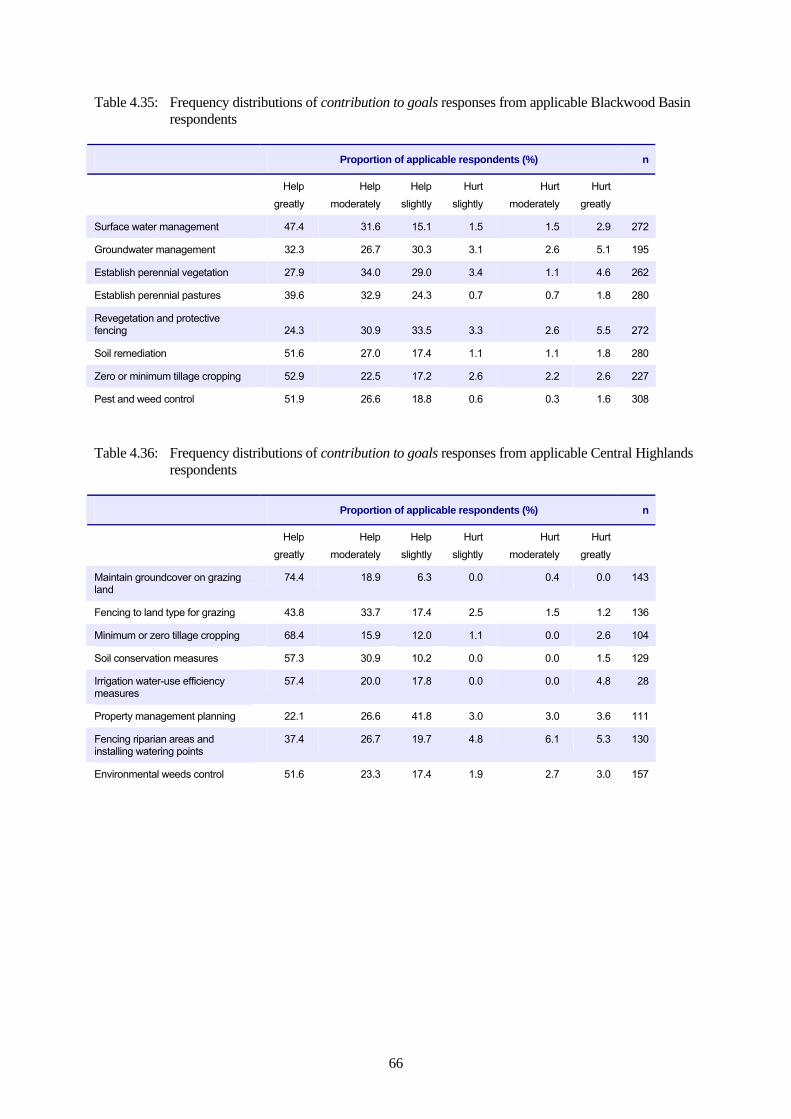
66
Table 4.35: Frequency distributions of contribution to goals responses from applicable Blackwood Basin respondents
Proportion of applicable respondents (%) n
Help greatly
Help moderately
Help slightly
Hurt slightly
Hurt moderately
Hurt greatly
Surface water management 47.4 31.6 15.1 1.5 1.5 2.9 272
Groundwater management 32.3 26.7 30.3 3.1 2.6 5.1 195
Establish perennial vegetation 27.9 34.0 29.0 3.4 1.1 4.6 262
Establish perennial pastures 39.6 32.9 24.3 0.7 0.7 1.8 280
Revegetation and protective fencing 24.3 30.9 33.5 3.3 2.6 5.5 272
Soil remediation 51.6 27.0 17.4 1.1 1.1 1.8 280
Zero or minimum tillage cropping 52.9 22.5 17.2 2.6 2.2 2.6 227
Pest and weed control 51.9 26.6 18.8 0.6 0.3 1.6 308
Table 4.36: Frequency distributions of contribution to goals responses from applicable Central Highlands
respondents Proportion of applicable respondents (%) n
Help greatly
Help moderately
Help slightly
Hurt slightly
Hurt moderately
Hurt greatly
Maintain groundcover on grazing land
74.4 18.9 6.3 0.0 0.4 0.0 143
Fencing to land type for grazing 43.8 33.7 17.4 2.5 1.5 1.2 136
Minimum or zero tillage cropping 68.4 15.9 12.0 1.1 0.0 2.6 104
Soil conservation measures 57.3 30.9 10.2 0.0 0.0 1.5 129
Irrigation water-use efficiency measures
57.4 20.0 17.8 0.0 0.0 4.8 28
Property management planning 22.1 26.6 41.8 3.0 3.0 3.6 111
Fencing riparian areas and installing watering points
37.4 26.7 19.7 4.8 6.1 5.3 130
Environmental weeds control 51.6 23.3 17.4 1.9 2.7 3.0 157
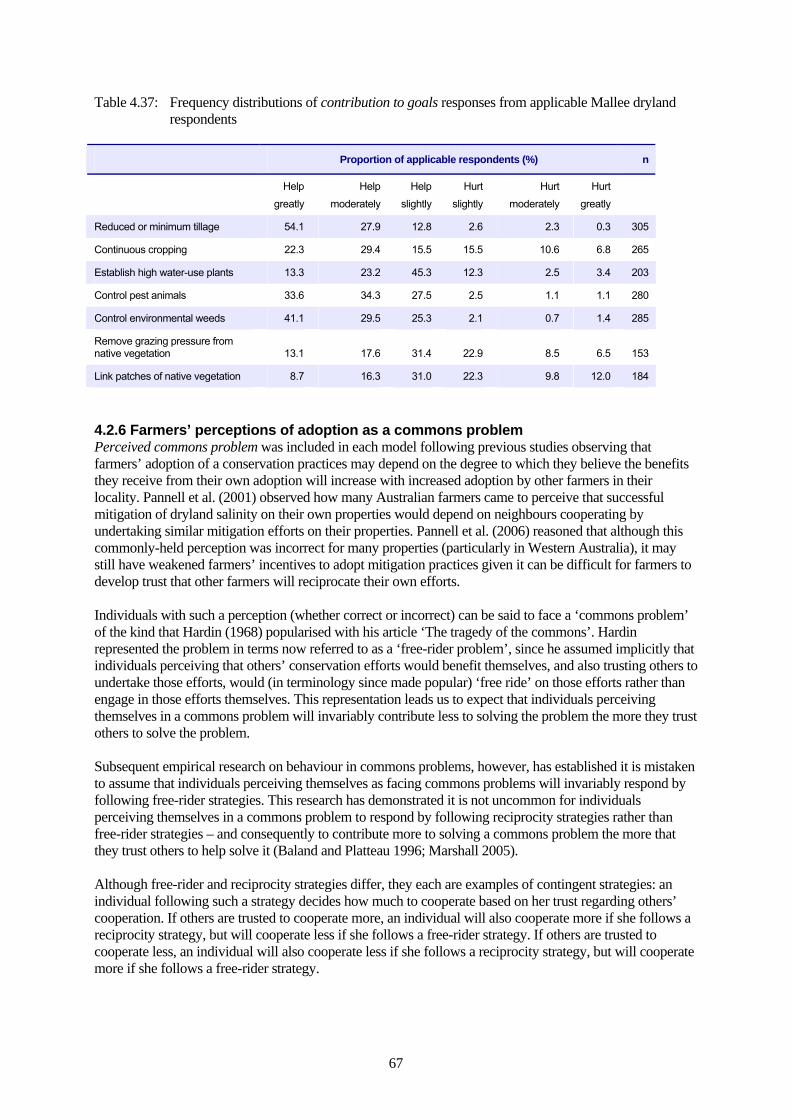
67
Table 4.37: Frequency distributions of contribution to goals responses from applicable Mallee dryland respondents
Proportion of applicable respondents (%) n
Help greatly
Help moderately
Help slightly
Hurt slightly
Hurt moderately
Hurt greatly
Reduced or minimum tillage 54.1 27.9 12.8 2.6 2.3 0.3 305
Continuous cropping 22.3 29.4 15.5 15.5 10.6 6.8 265
Establish high water-use plants 13.3 23.2 45.3 12.3 2.5 3.4 203
Control pest animals 33.6 34.3 27.5 2.5 1.1 1.1 280
Control environmental weeds 41.1 29.5 25.3 2.1 0.7 1.4 285
Remove grazing pressure from native vegetation 13.1 17.6 31.4 22.9 8.5 6.5 153
Link patches of native vegetation 8.7 16.3 31.0 22.3 9.8 12.0 184
4.2.6 Farmers’ perceptions of adoption as a commons problem Perceived commons problem was included in each model following previous studies observing that farmers’ adoption of a conservation practices may depend on the degree to which they believe the benefits they receive from their own adoption will increase with increased adoption by other farmers in their locality. Pannell et al. (2001) observed how many Australian farmers came to perceive that successful mitigation of dryland salinity on their own properties would depend on neighbours cooperating by undertaking similar mitigation efforts on their properties. Pannell et al. (2006) reasoned that although this commonly-held perception was incorrect for many properties (particularly in Western Australia), it may still have weakened farmers’ incentives to adopt mitigation practices given it can be difficult for farmers to develop trust that other farmers will reciprocate their own efforts. Individuals with such a perception (whether correct or incorrect) can be said to face a ‘commons problem’ of the kind that Hardin (1968) popularised with his article ‘The tragedy of the commons’. Hardin represented the problem in terms now referred to as a ‘free-rider problem’, since he assumed implicitly that individuals perceiving that others’ conservation efforts would benefit themselves, and also trusting others to undertake those efforts, would (in terminology since made popular) ‘free ride’ on those efforts rather than engage in those efforts themselves. This representation leads us to expect that individuals perceiving themselves in a commons problem will invariably contribute less to solving the problem the more they trust others to solve the problem. Subsequent empirical research on behaviour in commons problems, however, has established it is mistaken to assume that individuals perceiving themselves as facing commons problems will invariably respond by following free-rider strategies. This research has demonstrated it is not uncommon for individuals perceiving themselves in a commons problem to respond by following reciprocity strategies rather than free-rider strategies – and consequently to contribute more to solving a commons problem the more that they trust others to help solve it (Baland and Platteau 1996; Marshall 2005). Although free-rider and reciprocity strategies differ, they each are examples of contingent strategies: an individual following such a strategy decides how much to cooperate based on her trust regarding others’ cooperation. If others are trusted to cooperate more, an individual will also cooperate more if she follows a reciprocity strategy, but will cooperate less if she follows a free-rider strategy. If others are trusted to cooperate less, an individual will also cooperate less if she follows a reciprocity strategy, but will cooperate more if she follows a free-rider strategy.

68
Individuals can also follow non-contingent strategies – including unconditional cooperation or unconditional non-cooperation – where the choice of how much to cooperate is unrelated to trust in others’ cooperation. The behaviour of such individuals in commons problems may be dominated by various factors, including ideological convictions (e.g., supporting individualism and opposing collective action) or judgements from experience that unconditional cooperation/non-cooperation tends to best serve their own interests. The foregoing discussion indicates that perception of a problem as a commons problem may either increase or decrease the motivation of individuals to undertake actions to solve that problem, or else it may have no effect on that motivation. Respondents’ perceptions of a commons problem in adopting a particular conservation practice were measured as explained in Table 4.7 for the variable perceived commons problem. Data for this variable in respect of a particular practice was collected only from respondents for whom that practice was applicable. An applicable respondent’s score for this variable was calculated from two questionnaire items. The first of these was: ‘Sometimes, if a practice is going to work properly on one place, it needs also to be used by other landholders in the same district. In your view, how much does the effectiveness on your property of (relevant practice) depend on what others in your district are doing?’. ‘Doesn’t depend on others’ responses were scored as zero, ‘possibly depends’ as one, and ‘certainly depends on others’ as two. The second of the two questionnaire items was asked only of respondents who had answered ‘possibly depends’ or ‘certainly depends on others’. The item was ‘How likely is it that other landholders in your district will use the practice sufficiently for it to work properly on your place?’. Responses were scored on a range of one for ‘highly likely’ to five for ‘highly unlikely’. Perceived commons problem was scored as zero if a respondent answered ‘doesn’t depend on others’ to the first of these items. Hence, a score of zero identifies respondents without a perceived commons problem in adopting a particular conservation practice. Otherwise, this variable was scored as the product of the scores of the two items. Accordingly, a score of 10 identifies respondents whose answers indicated they faced the greatest degree of commons problem in respect of a particular practice; i.e., where effectiveness of adopting the practice on their property ‘certainly depends’ on adoption by others in their district, and also where others in their district were perceived as ‘highly unlikely’ to adopt the practice sufficiently to make it work properly on their own place. Frequency distributions for this variable for the three cases are presented in Tables 4.38 to 4.40. In compiling these tables, scores of zero for this variable were classified as ‘no commons problem’, scores from 1-3 were classified as ‘minor commons problem’, scores from 4-6 as ‘moderate commons problem’, and scores from 7-10 as ‘major commons problem’.
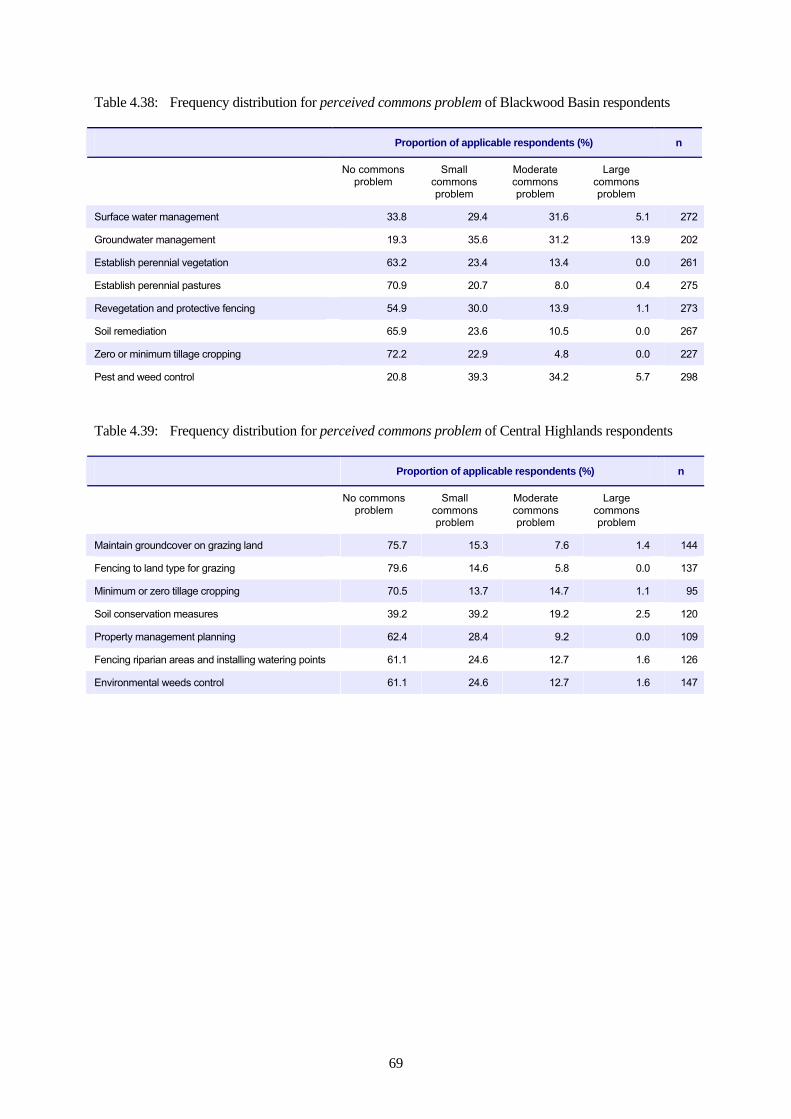
69
Table 4.38: Frequency distribution for perceived commons problem of Blackwood Basin respondents Proportion of applicable respondents (%) n
No commons problem
Small commons problem
Moderate commons problem
Large commons problem
Surface water management 33.8 29.4 31.6 5.1 272
Groundwater management 19.3 35.6 31.2 13.9 202
Establish perennial vegetation 63.2 23.4 13.4 0.0 261
Establish perennial pastures 70.9 20.7 8.0 0.4 275
Revegetation and protective fencing 54.9 30.0 13.9 1.1 273
Soil remediation 65.9 23.6 10.5 0.0 267
Zero or minimum tillage cropping 72.2 22.9 4.8 0.0 227
Pest and weed control 20.8 39.3 34.2 5.7 298
Table 4.39: Frequency distribution for perceived commons problem of Central Highlands respondents Proportion of applicable respondents (%) n
No commons problem
Small commons problem
Moderate commons problem
Large commons problem
Maintain groundcover on grazing land 75.7 15.3 7.6 1.4 144
Fencing to land type for grazing 79.6 14.6 5.8 0.0 137
Minimum or zero tillage cropping 70.5 13.7 14.7 1.1 95
Soil conservation measures 39.2 39.2 19.2 2.5 120
Property management planning 62.4 28.4 9.2 0.0 109
Fencing riparian areas and installing watering points 61.1 24.6 12.7 1.6 126
Environmental weeds control 61.1 24.6 12.7 1.6 147

70
Table 4.40: Frequency distribution for perceived commons problem of Mallee dryland respondents Proportion of applicable respondents (%) n
No commons problem
Small commons problem
Moderate commons problem
Large commons problem
Reduced or minimum tillage 69.1 24.2 6.4 0.3 298
Continuous cropping 68.8 22.9 7.5 0.8 266
Establish high water-use plants 72.8 20.3 6.4 0.5 202
Control pest animals 21.0 35.1 37.0 6.9 276
Control environmental weeds 22.1 32.4 38.8 6.8 281
Remove grazing pressure from native vegetation 59.9 23.1 15.0 2.0 147
Link patches of native vegetation 39.9 25.8 28.7 5.6 178
‘No commons problem’ accounted for the majority of applicable respondents for all but seven of the 22 practices across the three cases. The exceptions were surface water management, groundwater management and pest and weed control from the Blackwood Basin case, soil conservation measures from the Central Highlands case, and control pest animals, control environmental weeds and link patches of native vegetation from the Mallee dryland case. For only one practice across the cases – groundwater management from the Blackwood Basin case – was ‘large commons problem’ perceived by more than 10 per cent of applicable respondents. However, there were six practices for which ‘moderate commons problem’ or ‘large commons problem’ was perceived by more than one-third of applicable respondents. These practices were surface water management, groundwater management and pest and weed control from the Blackwood Basin case, and control pest animals, control environmental weeds and link native vegetation from the Mallee dryland case. Higher scores for perceived commons problem would be expected to be associated with greater adoption of a practice if farmers were predominantly following free-rider strategies for that practice – the less they perceive an opportunity to free-ride on others’ adoption of a practice, the more likely they are to adopt it themselves. In contrast, higher scores for this variable would be expected to be associated with lesser adoption of a practice if farmers instead were predominantly following reciprocity strategies for that practice – the less they perceive others adopting the practice, the lower will their own adoption of that practice be. Finally, we would expect higher scores for perceived commons problem to be unrelated with adoption of a practice under two possible scenarios: (i) where farmers were predominantly following non-contingent strategies for that practice, or (ii) where most farmers were following contingent strategies (i.e., either reciprocity or free-riding) but the proportions following reciprocity and free-riding were sufficiently similar that their influences on adoption of a practice ‘cancelled each other out’ so that no overall relationship could be identified. To the extent that farmers were following non-contingent strategies in this context, we would expect unconditional non-cooperation to be more common than unconditional cooperation. Empirical research (e.g., Axelrod 1984) has demonstrated that unconditional cooperation is easily exploited by free riders or unconditional non-cooperators and is therefore rarely sustainable. Coefficients for perceived commons problem were hypothesised to differ from zero. Support of this hypothesis would indicate landholders were predominantly following contingent strategies – either of reciprocity or free-riding. A positive coefficient sign would indicate the predominant strategy was free-riding. A negative coefficient sign would indicate that reciprocity was dominant. Rejection of the hypothesis would indicate either that landholders were predominantly following strategies of unconditional non-cooperation, or that there was no clear majority following reciprocity or free-riding strategies and thus

71
the opposing effects of these strategies on adoption were effectively cancelled out. The research design did not permit identification of which of these two possibilities reflected the actual situation. 4.2.7 Farmers’ expectations of future adoption across their district Perceived future district adoption was included in the model for each practice to account for variability across respondents in how widely they perceived this practice would eventually be adopted by other farmers in their respective districts. Inclusion of this variable in these models was motivated by Vanclay (2004) and Pannell et al. (2006) highlighting adoption of conservation practices as a social process. Vanclay found that farmers conform to a notion of ‘good farm management’ which arises from social interaction with other farmers, extension officers, and through exposure to farming literature and other mass media, but also that farmers differ in what they regard as good farm management. Pannell et al. (2006) observed how farmers’ adoption of innovative practices can be affected by their perceptions of how adoption may affect their social standing. Sometimes the effect on social standing, and thus on likelihood of adoption, may be negative, such as when strong local norms of good farming practice exist which reward conservatism and sanction innovation. Coughenour and Chamala (2000) reported, for instance, how adoption of zero-tillage methods was delayed by the social stigma of being perceived as running an ‘untidy’ farm (i.e., without straight furrows). Where social dynamics of this kind are dominant for a particular practice, we might expect to find that farmers who expect to increase their adoption of this practice the most tend to be those whose perceived future district adoption of that practice is lower (i.e., who perceive their adoption would challenge local conservatism least). In other settings the effect of adopting an innovation on social standing, and thus on the likelihood of adoption, may be positive. Abadi Ghadim and Pannell (1999) observed how some proportion of farmers is driven by the status generally afforded in sections of their communities to those seen as innovative. In some farming communities for some areas of farming practice, moreover, local norms of good farming practice may predominantly focus on rewarding innovation rather than discouraging it. Where this social dynamic is dominant for a particular practice, we might expect to find that the farmers with higher expectations of increasing their adoption of this practice tend to be those that regard their adoption as having been more innovative (i.e., whose perceived future district adoption of that practice is lower). Given these opposing considerations, coefficients for perceived future district adoption were hypothesised only to differ from zero. Data on expected future district adoption were obtained form the questionnaire item ‘How widely do you expect (the relevant practice) will eventually be used in your district?’. Only applicable respondents for a practice were asked to complete this item. Frequency distributions for this variable across the three cases are presented in Tables 4.41 to 4.43.

72
Table 4.41: Frequency distributions for expected future district adoption responses from applicable Blackwood Basin respondents
Practice Proportion of applicable respondents (%) n
Wide use Moderate use
Limited use Zero / minimal use
Surface water management 34.2 49.2 14.6 1.9 260
Groundwater management 20.8 49.7 22.8 6.6 197
Establish perennial vegetation 11.9 50.8 33.7 3.6 252
Establish perennial pastures 22.0 46.6 29.1 2.2 268
Revegetation & protective fencing 20.5 47.0 29.9 2.6 268
Soil remediation 26.4 47.6 21.3 4.7 254
Zero or minimum tillage cropping 70.0 26.0 2.7 1.3 223
Pest and weed control 52.6 35.5 10.8 1.0 287
Table 4.42: Frequency distributions for expected future district adoption responses from applicable
Central Highlands respondents
Practice Proportion of applicable respondents (%) n
Wide use Moderate use
Limited use Zero / minimal use
Maintain groundcover on grazing land 51.9 39.0 7.5 1.7 138
Fencing to land type for grazing 37.0 46.0 12.8 4.1 131
Minimum or zero tillage cropping 77.9 15.3 5.1 1.8 101
Soil conservation measures 66.4 29.2 2.5 1.9 123
Irrigation water-use efficiency measures
59.1 26.1 14.9 0.0 25
Property management planning 35.0 42.1 21.8 1.1 106
Fencing riparian areas and installing watering points
30.5 39.8 27.2 2.6 122
Environmental weeds control 47.8 42.1 7.7 2.4 148
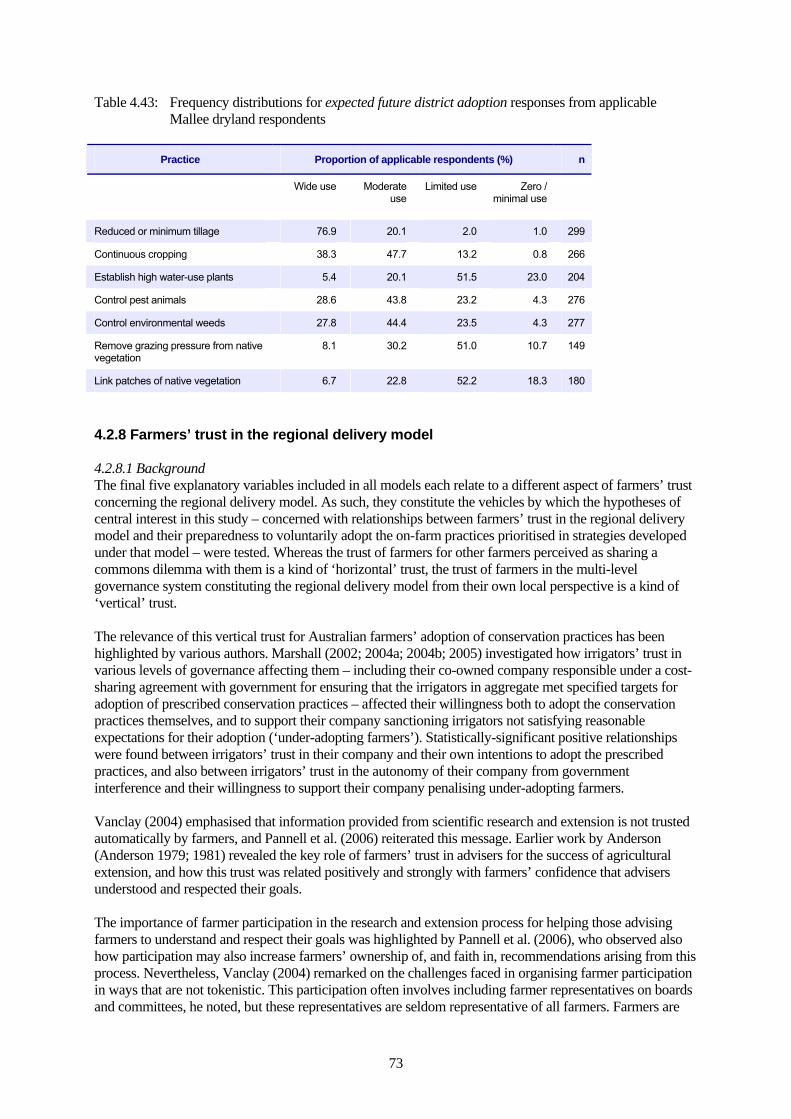
73
Table 4.43: Frequency distributions for expected future district adoption responses from applicable Mallee dryland respondents
Practice Proportion of applicable respondents (%) n
Wide use Moderate use
Limited use Zero / minimal use
Reduced or minimum tillage 76.9 20.1 2.0 1.0 299
Continuous cropping 38.3 47.7 13.2 0.8 266
Establish high water-use plants 5.4 20.1 51.5 23.0 204
Control pest animals 28.6 43.8 23.2 4.3 276
Control environmental weeds 27.8 44.4 23.5 4.3 277
Remove grazing pressure from native vegetation
8.1 30.2 51.0 10.7 149
Link patches of native vegetation 6.7 22.8 52.2 18.3 180
4.2.8 Farmers’ trust in the regional delivery model 4.2.8.1 Background The final five explanatory variables included in all models each relate to a different aspect of farmers’ trust concerning the regional delivery model. As such, they constitute the vehicles by which the hypotheses of central interest in this study – concerned with relationships between farmers’ trust in the regional delivery model and their preparedness to voluntarily adopt the on-farm practices prioritised in strategies developed under that model – were tested. Whereas the trust of farmers for other farmers perceived as sharing a commons dilemma with them is a kind of ‘horizontal’ trust, the trust of farmers in the multi-level governance system constituting the regional delivery model from their own local perspective is a kind of ‘vertical’ trust. The relevance of this vertical trust for Australian farmers’ adoption of conservation practices has been highlighted by various authors. Marshall (2002; 2004a; 2004b; 2005) investigated how irrigators’ trust in various levels of governance affecting them – including their co-owned company responsible under a cost-sharing agreement with government for ensuring that the irrigators in aggregate met specified targets for adoption of prescribed conservation practices – affected their willingness both to adopt the conservation practices themselves, and to support their company sanctioning irrigators not satisfying reasonable expectations for their adoption (‘under-adopting farmers’). Statistically-significant positive relationships were found between irrigators’ trust in their company and their own intentions to adopt the prescribed practices, and also between irrigators’ trust in the autonomy of their company from government interference and their willingness to support their company penalising under-adopting farmers. Vanclay (2004) emphasised that information provided from scientific research and extension is not trusted automatically by farmers, and Pannell et al. (2006) reiterated this message. Earlier work by Anderson (Anderson 1979; 1981) revealed the key role of farmers’ trust in advisers for the success of agricultural extension, and how this trust was related positively and strongly with farmers’ confidence that advisers understood and respected their goals. The importance of farmer participation in the research and extension process for helping those advising farmers to understand and respect their goals was highlighted by Pannell et al. (2006), who observed also how participation may also increase farmers’ ownership of, and faith in, recommendations arising from this process. Nevertheless, Vanclay (2004) remarked on the challenges faced in organising farmer participation in ways that are not tokenistic. This participation often involves including farmer representatives on boards and committees, he noted, but these representatives are seldom representative of all farmers. Farmers are
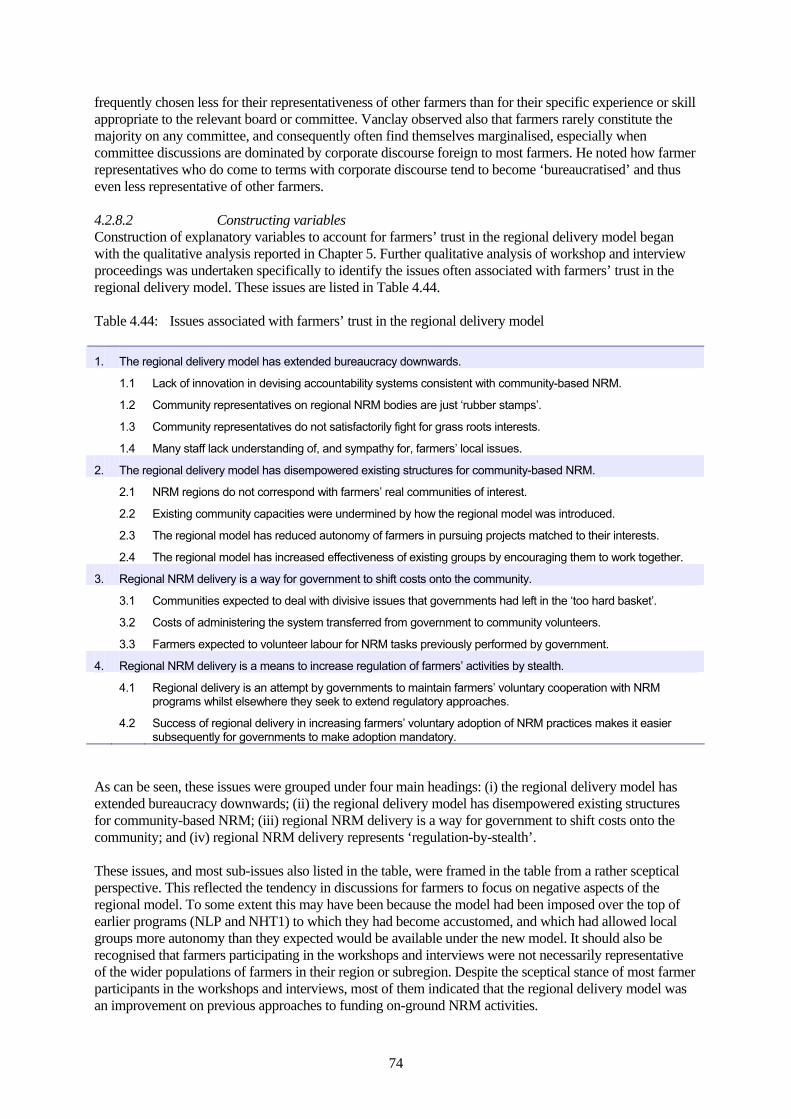
74
frequently chosen less for their representativeness of other farmers than for their specific experience or skill appropriate to the relevant board or committee. Vanclay observed also that farmers rarely constitute the majority on any committee, and consequently often find themselves marginalised, especially when committee discussions are dominated by corporate discourse foreign to most farmers. He noted how farmer representatives who do come to terms with corporate discourse tend to become ‘bureaucratised’ and thus even less representative of other farmers. 4.2.8.2 Constructing variables Construction of explanatory variables to account for farmers’ trust in the regional delivery model began with the qualitative analysis reported in Chapter 5. Further qualitative analysis of workshop and interview proceedings was undertaken specifically to identify the issues often associated with farmers’ trust in the regional delivery model. These issues are listed in Table 4.44. Table 4.44: Issues associated with farmers’ trust in the regional delivery model 1. The regional delivery model has extended bureaucracy downwards.
1.1 Lack of innovation in devising accountability systems consistent with community-based NRM.
1.2 Community representatives on regional NRM bodies are just ‘rubber stamps’.
1.3 Community representatives do not satisfactorily fight for grass roots interests.
1.4 Many staff lack understanding of, and sympathy for, farmers’ local issues.
2. The regional delivery model has disempowered existing structures for community-based NRM.
2.1 NRM regions do not correspond with farmers’ real communities of interest.
2.2 Existing community capacities were undermined by how the regional model was introduced.
2.3 The regional model has reduced autonomy of farmers in pursuing projects matched to their interests.
2.4 The regional model has increased effectiveness of existing groups by encouraging them to work together.
3. Regional NRM delivery is a way for government to shift costs onto the community.
3.1 Communities expected to deal with divisive issues that governments had left in the ‘too hard basket’.
3.2 Costs of administering the system transferred from government to community volunteers.
3.3 Farmers expected to volunteer labour for NRM tasks previously performed by government.
4. Regional NRM delivery is a means to increase regulation of farmers’ activities by stealth.
4.1 Regional delivery is an attempt by governments to maintain farmers’ voluntary cooperation with NRM programs whilst elsewhere they seek to extend regulatory approaches.
4.2 Success of regional delivery in increasing farmers’ voluntary adoption of NRM practices makes it easier subsequently for governments to make adoption mandatory.
As can be seen, these issues were grouped under four main headings: (i) the regional delivery model has extended bureaucracy downwards; (ii) the regional delivery model has disempowered existing structures for community-based NRM; (iii) regional NRM delivery is a way for government to shift costs onto the community; and (iv) regional NRM delivery represents ‘regulation-by-stealth’. These issues, and most sub-issues also listed in the table, were framed in the table from a rather sceptical perspective. This reflected the tendency in discussions for farmers to focus on negative aspects of the regional model. To some extent this may have been because the model had been imposed over the top of earlier programs (NLP and NHT1) to which they had become accustomed, and which had allowed local groups more autonomy than they expected would be available under the new model. It should also be recognised that farmers participating in the workshops and interviews were not necessarily representative of the wider populations of farmers in their region or subregion. Despite the sceptical stance of most farmer participants in the workshops and interviews, most of them indicated that the regional delivery model was an improvement on previous approaches to funding on-ground NRM activities.

75
The issues identified in Table 4.44 served as the primary basis for specifying the items included in questions 15-17 of the questionnaire for the Blackwood Basin, questions 16-18 of the questionnaire for the Central Highlands, and questions 15 and 16 of the questionnaire for the Mallee Region, to obtain data for use in quantitatively testing the relationship between farmers’ trust in the regional delivery model and their intentions to change their adoption of on-farm practices promoted under that model6. For each of the three cases, farmers’ responses to each of the questionnaire items measuring their trust in the regional delivery model subjected to principal components analysis. This statistical procedure summarises the interrelationships among a set of variables using a smaller number of uncorrelated ‘components’ which account for the maximum amount of variability in the scores of the original variables7. This procedure was employed in this study since the relevant questions for the Blackwood Basin and Central Highlands cases comprised 24 different items, and the relevant questions for the Mallee case comprised 15 different items. Aside from the need to constrain the number of explanatory variables in the multiple regression models to a manageable level, inclusion of all items as separate variables would have caused problems multicollinearity due to high levels of correlation between some of the items. When principal component analysis was applied to the 24 relevant items for each of the Blackwood Basin and Central Highlands cases, the solution for both cases comprised five components with eigenvalues exceeding one. The proportion of total variance explained by these components in each case was 66 per cent and 67 per cent, respectively. When this procedure was applied to the 15 relevant items for the Mallee case, the solution comprised four components with eigenvalues greater than one. The proportion of total variance for this case explained by these four components was 64 per cent. The striking feature of the solutions after varimax rotation was the similarity across cases in the items loading at least moderately (loadings exceeding 0.5) onto different components. This consistent pattern of loadings provided an unambiguous basis for the assignment shown in Table 4.7 of items for measuring each of the explanatory variables (five for the Blackwood Basin and Central Highlands cases, and four for the Mallee case) accounting for farmers’ vertical trust in the regional delivery model. Cronbach’s Alpha values for each of these variables for each of the cases are shown in Table 4.7 as a measure of their internal consistency reliability. The values for each variable are strikingly uniform across the cases, and well above the acceptable level of 0.6 for each of the variables except one (trust in government integrity). Cronbach’s Alpha is less than 0.6 for this variable only for the Central Highlands case, and only marginally so in this instance. Four variables were constructed corresponding to the same four components identified across the three cases with eigenvalues exceeding one. The names chosen for these variables, and also for the fifth variable discussed below, were intended to reflect the common thread of the issues covered by the items allocated to
6 Question 17 of the Blackwood Basin questionnaire, and question 18 of the Central Highlands questionnaire, were concerned with farmer perceptions of the relevant subregional body. A question equivalent to these questions was not relevant to the Mallee Region where a subregional body with similar responsibilities does not exist. 7 Principal components analysis uses all available information on correlations among a set of variables to condense them into a smaller, more manageable and more reliable set of variables. ‘Eigenvalues’ are calculated as measures of the proportion of variability in the original variables that is explained by each component in the solution. Typically only components with eigenvalues exceeding one are considered in defining the smaller set of variables. Correlations between components and each of the original variables are shown in a ‘component loading matrix’. The ‘loading’ for a variable on a particular component measures the degree to which the variable correlates with the component. The solution of principal component analysis is commonly ‘rotated’ to emphasise differences in loadings and ease interpretation by making unambiguous the variables that correlate with a factor. ‘Varimax’ rotation is used most frequently for this purpose. The internal consistency reliability of each summary variable created following principal component analysis is confirmed conventionally by means of Cronbach’s Alpha (Tabachnick and Fidell 1989).
76
those variables. The names assigned to these four variables were: (i) trust in regional body; (ii) trust in government commitment to community empowerment; (iii) trust in government integrity; and (iv) trust in regional/subregional autonomy. A fifth variable was constructed corresponding to a fifth component that was identified in both the Blackwood Basin and Central Highlands cases and which had an eigenvalue exceeding one in each case. This variable was named trust in subregional body. This fifth component was not identified in the Mallee dryland case since questionnaire items concerned with a subregional body were not relevant to that case. The five variables constructed to account for farmers’ trust in the regional delivery model are now discussed, beginning with the two variables trust in subregional body and trust in regional body. 4.2.8.3 Trust in subregional body and in regional body As is evident from the two similar sets of five items from which each of these variables were derived (as shown in Table 4.7), the variables trust in subregional body and trust in regional body account for farmers’ trust that the relevant subregional body (i.e., Blackwood Basin Group or the Central Highlands Regional Resources Planning Cooperative) and relevant regional body (i.e., South West Catchment Council, Fitzroy Basin Association or the Mallee Catchment Management Authority): i understands the issues faced in their district; ii is serious about helping their community to help itself; iii has community representatives willing to fight for the interests of their subregion or region; iv has staff that care about their community; and v is less bureaucratic than is the case when dealing with government generally. The earlier discussion of the importance of farmers feeling that their goals are understood and respected is relevant to the first of these elements of trust. The second element relates to concerns raised in workshops and interviews that subregional and regional bodies might lose sight of their role of empowering their communities and instead centralise responsibilities increasingly in their own hands. The third element relates to the challenges of including farmer representatives on boards and committees as a means of providing farmer participation in decision processes that successfully engenders their trust in decisions reached in those processes. Comments in workshops and interviews revealed scepticism among some farmers that community representatives at regional and subregional levels of the regional delivery model always placed the interests of their community before their narrower private interests. Among the comments were some suggestions that the relevant private interests of community representatives may include: achieving status within their community; gaining satisfaction from moving in professional circles; accessing information and developing networks helping them to benefit more from funding programs than they might otherwise; and using the role of community representative as a stepping stone to yet higher levels of leadership. In the Mallee case, there was also concern from some farmers that the Victoria-wide system of Ministerial appointment of community representatives to regional NRM bodies increases the likelihood of ‘tame’ representatives being appointed who are unlikely to fight with real determination for the interests of their community when these are at odds with government policy. The fourth element relates to findings from workshops and interviews that staff at subregional and regional levels of the regional delivery model are critical to farmer trust in the model. While community representatives tend to be involved predominantly in strategic decision-making under this model, most farmers seem to understand clearly the prominent role that staff play in decision processes at all levels. Given the limited time of community representatives to interact directly with community members, moreover, much of the responsibility for this face-to-face interaction tends to fall onto staff. Once again relevant are the earlier remarks regarding the importance those dealing with farmers understanding and

77
respecting their goals if they want to be trusted by them. From comments received in workshops and interviews, two obstacles to farmers developing trust in staff may include: (i) rapid turnover such that staff move on before achieving real understanding of, and respect for, farmers’ goals and knowledge; and (ii) perceptions that some staff use subregional and regional NRM bodies as stepping stones to careers in government or consulting, and thus tend to care less about earning trust from local farmers than developing technical skills likely to impress future employers. Finally, the fifth element of trust associated with trust in subregional body and trust in regional body relates to comments during workshops and interviews suggesting a tendency for farmers’ trust in these bodies as representing their interests to be associated with perceptions that these bodies were more focused than government would be on ‘getting the job done’ with minimum paperwork and delay. A few farmers commented on how opportunities and enthusiasm to engage in conservation activities are often short-lived, requiring subregional and regional bodies to act promptly when approached by farmers if these opportunities are not to be missed. Frequency distributions for responses to the five items (attitude statements) associated with trust in subregional body are presented in Tables 4.45 and 4.46 for the Blackwood Basin and Central Highlands cases, respectively. Table 4.45: Frequency distributions of Blackwood Basin responses to items associated with trust in
subregional body Proportion of respondents (%) n
Strongly agree
Agree Disagree Strongly disagree
The BBG understands the issues faced in our district 13.8 68.9 12.4 4.9 225
The BBG is serious about helping our community to solve our own NRM problems
13.8 69.5 12.3 4.4 203
Community members on the BBG can be trusted to argue forcefully for the best interests of the South West Catchments Region
16.5 62.4 15.1 6.0 218
Staff of the BBG care about our community 15.5 74.8 7.3 2.4 206
The BBG is less bureaucratic than government generally 9.2 73.4 13.3 4.1 218
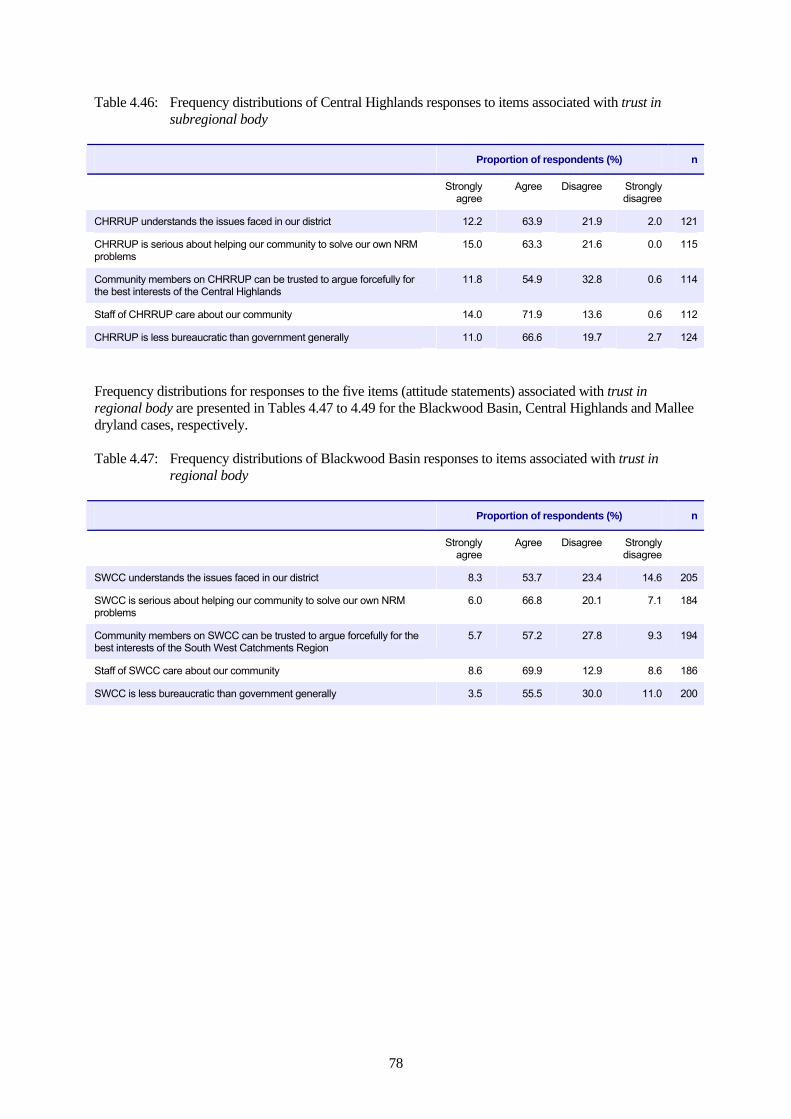
78
Table 4.46: Frequency distributions of Central Highlands responses to items associated with trust in subregional body
Proportion of respondents (%) n
Strongly agree
Agree Disagree Strongly disagree
CHRRUP understands the issues faced in our district 12.2 63.9 21.9 2.0 121
CHRRUP is serious about helping our community to solve our own NRM problems
15.0 63.3 21.6 0.0 115
Community members on CHRRUP can be trusted to argue forcefully for the best interests of the Central Highlands
11.8 54.9 32.8 0.6 114
Staff of CHRRUP care about our community 14.0 71.9 13.6 0.6 112
CHRRUP is less bureaucratic than government generally 11.0 66.6 19.7 2.7 124
Frequency distributions for responses to the five items (attitude statements) associated with trust in regional body are presented in Tables 4.47 to 4.49 for the Blackwood Basin, Central Highlands and Mallee dryland cases, respectively. Table 4.47: Frequency distributions of Blackwood Basin responses to items associated with trust in
regional body Proportion of respondents (%) n
Strongly agree
Agree Disagree Strongly disagree
SWCC understands the issues faced in our district 8.3 53.7 23.4 14.6 205
SWCC is serious about helping our community to solve our own NRM problems
6.0 66.8 20.1 7.1 184
Community members on SWCC can be trusted to argue forcefully for the best interests of the South West Catchments Region
5.7 57.2 27.8 9.3 194
Staff of SWCC care about our community 8.6 69.9 12.9 8.6 186
SWCC is less bureaucratic than government generally 3.5 55.5 30.0 11.0 200

79
Table 4.48: Frequency distributions of Central Highlands responses to items associated with trust in regional body
Proportion of respondents (%) n
Strongly agree
Agree Disagree Strongly disagree
The FBA understands the issues faced in our district 6.5 63.4 27.0 3.0 112
The FBA is serious about helping our community to solve our own NRM problems
8.0 68.1 21.4 2.4 108
Community members on the FBA can be trusted to argue forcefully for the best interests of the Fitzroy Basin Region
7.6 57.2 29.9 5.3 114
Staff of the FBA care about our community 6.9 69.9 22.0 1.2 109
The FBA is less bureaucratic than government generally 4.6 68.2 23.5 3.6 110
Table 4.49: Frequency distributions of Mallee dryland responses to items associated with trust in regional
body Proportion of respondents (%) n
Strongly agree
Agree Disagree Strongly disagree
Mallee CMA understands the issues faced in our district 8.6 68.1 16.8 6.5 232
The Mallee CMA is serious about helping our community to solve our own NRM problems
8.2 75.8 12.3 3.7 219
Community members on the Mallee CMA can be trusted to argue forcefully for the best interests of the Mallee Region
10.4 67.4 17.6 4.5 221
Staff of the Mallee CMA care about our community 9.9 76.6 10.4 3.2 222
Mallee CMA is less bureaucratic than government generally 5.1 67.3 20.3 7.4 217
Notice that the proportion of respondents strongly agreeing was invariably greater for a statement in respect of the subregional body for a case (where one exists) than for the equivalent statement in respect of the regional body for the same case. For instance, the proportion of Blackwood Basin respondents strongly agreeing with ‘the BBG understands the issues faced in our district’ was 13.8 per cent (Table 4.44). In comparison, the proportion of Blackwood Basin respondents strongly agreeing with ‘SWCC understands the issues faced in our district’ was markedly less at 8.3 per cent (Table 4.46). This indicates a general tendency across the two cases with a subregional body for respondents’ trust in this body to exceed their trust in their regional body. It is evident also that the proportion of Blackwood Basin and Central Highlands respondents strongly agreeing with a statement in respect of their subregional body was invariably higher than the proportion of Mallee dryland respondents strongly agreeing with the equivalent statement in respect of the Mallee CMA. For instance, the proportions of Blackwood Basin and Central Highlands respondents strongly agreeing with ‘the (relevant subregional body) understands the issues faced in our district’ were 13.8 per cent and 12.2 per cent, respectively (Tables 4.44 and 4.45). In comparison, the proportion of Mallee dryland respondents strongly agreeing with ‘Mallee CMA understands the issues faced in our district’ was markedly less at 8.6 per cent (Table 4.48). This is consistent with, but does not prove (given the limited number of cases available for comparison), the proposition that subregional bodies acting as ‘frontline’ organisations (i.e., the organisational level dealing with landholders most directly) tend to be advantaged in establishing trust from landholders compared with regional bodies like the Mallee CMA – at least to the extent that the scale at which subregional bodies operate is closer to the scale of landholder concerns, and,

80
also, subregional bodies are ‘shielded’ by regional bodies from bureaucratic and other requirements that would otherwise make it more difficult for them demonstrate they are not only distinct from government but also haven’t become ‘governmentalised’. 4.2.8.4 Trust in government commitment to community empowerment The next variable focussing on aspects of farmers’ trust in the regional delivery model was trust in government commitment to community empowerment. This variable accounts particularly for farmers’ trust that both the Federal Government and the relevant state government are genuinely committed through the regional delivery model to empowering their communities to take a lead role in addressing their own NRM problems. Inclusion of this variable was consistent with suspicions expressed by some farmers and others in workshops and interviews that governments remain less interested in communities taking a lead in NRM governance than in mobilising them merely as a more cost-effective way of achieving on-ground NRM implementation. Frequency distributions for responses to the two attitude-statement items associated with trust in government commitment to community empowerment are presented in Tables 4.50 to 4.52 for the Blackwood Basin, Central Highlands and Mallee dryland cases, respectively. Table 4.50: Frequency distributions of Blackwood Basin responses to items associated with trust in
government commitment to community empowerment Proportion of respondents (%) n
Strongly agree
Agree Disagree Strongly disagree
Federal Government is serious about empowering our community to solve our own NRM problems
5.0 45.4 37.9 11.7 240
The Western Australian (WA) Government is serious about empowering our community to solve our own NRM problems
4.9 33.6 42.2 19.3 244
Table 4.51: Frequency distributions of Central Highlands responses to items associated with trust in
government commitment to community empowerment Proportion of respondents (%) n
Strongly agree
Agree Disagree Strongly disagree
Federal Government is serious about empowering our community to solve our own NRM problems
3.2 46.8 41.3 8.7 138
The Queensland Government is serious about empowering our community to solve our own NRM problems
4.9 29.7 39.3 26.1 141
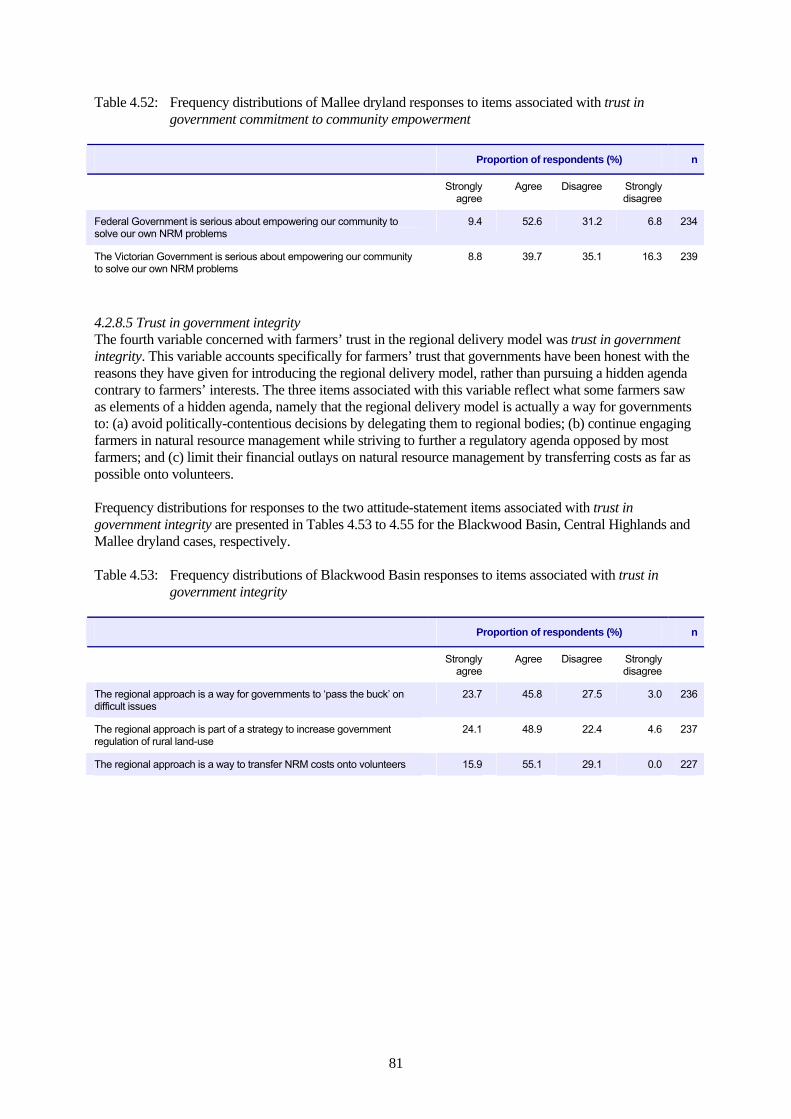
81
Table 4.52: Frequency distributions of Mallee dryland responses to items associated with trust in government commitment to community empowerment
Proportion of respondents (%) n
Strongly agree
Agree Disagree Strongly disagree
Federal Government is serious about empowering our community to solve our own NRM problems
9.4 52.6 31.2 6.8 234
The Victorian Government is serious about empowering our community to solve our own NRM problems
8.8 39.7 35.1 16.3 239
4.2.8.5 Trust in government integrity The fourth variable concerned with farmers’ trust in the regional delivery model was trust in government integrity. This variable accounts specifically for farmers’ trust that governments have been honest with the reasons they have given for introducing the regional delivery model, rather than pursuing a hidden agenda contrary to farmers’ interests. The three items associated with this variable reflect what some farmers saw as elements of a hidden agenda, namely that the regional delivery model is actually a way for governments to: (a) avoid politically-contentious decisions by delegating them to regional bodies; (b) continue engaging farmers in natural resource management while striving to further a regulatory agenda opposed by most farmers; and (c) limit their financial outlays on natural resource management by transferring costs as far as possible onto volunteers. Frequency distributions for responses to the two attitude-statement items associated with trust in government integrity are presented in Tables 4.53 to 4.55 for the Blackwood Basin, Central Highlands and Mallee dryland cases, respectively. Table 4.53: Frequency distributions of Blackwood Basin responses to items associated with trust in
government integrity Proportion of respondents (%) n
Strongly agree
Agree Disagree Strongly disagree
The regional approach is a way for governments to ‘pass the buck’ on difficult issues
23.7 45.8 27.5 3.0 236
The regional approach is part of a strategy to increase government regulation of rural land-use
24.1 48.9 22.4 4.6 237
The regional approach is a way to transfer NRM costs onto volunteers 15.9 55.1 29.1 0.0 227
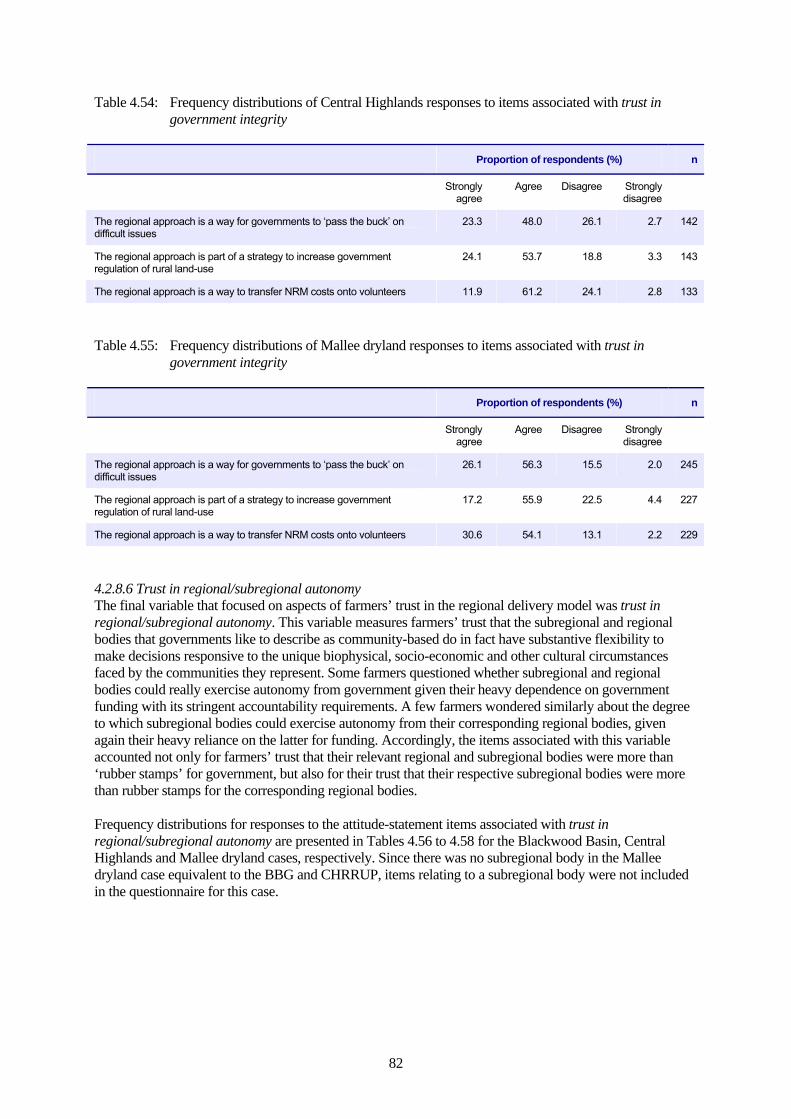
82
Table 4.54: Frequency distributions of Central Highlands responses to items associated with trust in government integrity
Proportion of respondents (%) n
Strongly agree
Agree Disagree Strongly disagree
The regional approach is a way for governments to ‘pass the buck’ on difficult issues
23.3 48.0 26.1 2.7 142
The regional approach is part of a strategy to increase government regulation of rural land-use
24.1 53.7 18.8 3.3 143
The regional approach is a way to transfer NRM costs onto volunteers 11.9 61.2 24.1 2.8 133
Table 4.55: Frequency distributions of Mallee dryland responses to items associated with trust in
government integrity Proportion of respondents (%) n
Strongly agree
Agree Disagree Strongly disagree
The regional approach is a way for governments to ‘pass the buck’ on difficult issues
26.1 56.3 15.5 2.0 245
The regional approach is part of a strategy to increase government regulation of rural land-use
17.2 55.9 22.5 4.4 227
The regional approach is a way to transfer NRM costs onto volunteers 30.6 54.1 13.1 2.2 229
4.2.8.6 Trust in regional/subregional autonomy The final variable that focused on aspects of farmers’ trust in the regional delivery model was trust in regional/subregional autonomy. This variable measures farmers’ trust that the subregional and regional bodies that governments like to describe as community-based do in fact have substantive flexibility to make decisions responsive to the unique biophysical, socio-economic and other cultural circumstances faced by the communities they represent. Some farmers questioned whether subregional and regional bodies could really exercise autonomy from government given their heavy dependence on government funding with its stringent accountability requirements. A few farmers wondered similarly about the degree to which subregional bodies could exercise autonomy from their corresponding regional bodies, given again their heavy reliance on the latter for funding. Accordingly, the items associated with this variable accounted not only for farmers’ trust that their relevant regional and subregional bodies were more than ‘rubber stamps’ for government, but also for their trust that their respective subregional bodies were more than rubber stamps for the corresponding regional bodies. Frequency distributions for responses to the attitude-statement items associated with trust in regional/subregional autonomy are presented in Tables 4.56 to 4.58 for the Blackwood Basin, Central Highlands and Mallee dryland cases, respectively. Since there was no subregional body in the Mallee dryland case equivalent to the BBG and CHRRUP, items relating to a subregional body were not included in the questionnaire for this case.

83
Table 4.56: Frequency distributions of Blackwood Basin responses to items associated with trust in regional/subregional autonomy
Proportion of respondents (%) n
Strongly agree
Agree Disagree Strongly disagree
SWCC is just a ‘rubber stamp’ for decisions made by the Federal Government
9.7 39.2 48.4 2.7 186
SWCC is just a ‘rubber stamp’ for decisions made by the WA Government
12.2 41.8 43.9 2.1 189
The BBG is just a ‘rubber stamp’ for decisions made by the Federal Government
6.0 25.5 62.0 6.5 200
The BBG is just a ‘rubber stamp’ for decisions made by the WA Government
7.0 26.9 58.7 7.5 201
The BBG is just a ‘rubber stamp’ for decisions made by SWCC 6.5 32.8 55.4 5.4 186
Table 4.57: Frequency distributions of Central Highlands responses to items associated with trust in
regional/subregional autonomy Proportion of respondents (%) n
Strongly agree
Agree Disagree Strongly disagree
The FBA is just a ‘rubber stamp’ for decisions made by the Federal Government
7.8 33.2 57.3 1.7 110
The FBA is just a ‘rubber stamp’ for decisions made by the Queensland Government
9.8 39.2 49.3 1.7 111
CHRRUP is just a ‘rubber stamp’ for decisions made by the Federal Government
5.4 35.5 57.0 2.1 114
CHRRUP is just a ‘rubber stamp’ for decisions made by the Queensland Government
9.3 35.4 52.1 3.1 113
CHRRUP is just a ‘rubber stamp’ for decisions made by the FBA 6.8 40.2 51.4 1.7 108
Table 4.58: Frequency distributions of Mallee dryland responses to items associated with trust in
regional/subregional autonomy Proportion of respondents (%) n
Strongly agree
Agree Disagree Strongly disagree
Mallee CMA is just a ‘rubber stamp’ for decisions made by the Federal Government
8.1 38.9 49.8 3.3 211
Mallee CMA is just a ‘rubber stamp’ for decisions made by the Victorian Government
13.1 43.7 39.9 3.3 213
After detailing the variables included in regression models to examine how farmers’ trust in the regional delivery model relates to their adoption of conservation practices, we now consider our hypotheses regarding the direction of this relationship. The earlier reasoning in relation to a hypothesis for perceived commons problem is relevant here. We saw that for farmers perceiving themselves in a commons problem and thus benefiting from the cooperation of others, increased trust that others will cooperate will increase their own cooperation if are following a reciprocity strategy, but reduce their own cooperation if they are

84
following a strategy of free riding. However, the possibility of farmers following non-contingent strategies, where decisions regarding cooperation levels are unaffected by trust in others, was also highlighted. Similar logic applies if farmers perceive possible benefits from the cooperation of organisations at higher governance levels, which under the regional delivery model include subregional and regional bodies as well as state and federal governments. If farmers’ trust that higher-level bodies will cooperate with them in solving the NRM problems important to them is increased, they will tend to cooperate more themselves (e.g., by adopting conservation practices) if they are following a reciprocity strategy, but cooperate less if they are following a free-rider strategy. Such conditionality in how farmers respond to trust in higher governance levels was recognised by Marshall (2004a). In the particular irrigation case he studied, he found farmers’ adoption of conservation practices to be associated positively with their trust in their co-owned irrigation company responsible for ensuring adoption targets were met, and accordingly that farmers predominantly were following reciprocity strategies in their interactions with that company. However, the following remarks from a board member of the Fitzroy Basin Association (the regional body for the Central Highlands case) highlighted how paternalistic governance, presuming farmers are incapable of solving their own problems, can a culture of dependency or ‘welfarism’ where farmers tend predominantly to free-ride on assistance from higher levels:
Over the last 20 or 25 years, we’ve slowly been taking away the rights of people. And people have been very happy to give a lot of that away if it means somebody can look after them. We’ve developed this mentality of: ‘It’s government’s fault’ or ‘government should do something for us’ or ‘government should give us this to do this’ … [I]t exists in the bush too. … ‘If government’s going to do this, well, we’re not going to do anything’.
Ameliorating the perverse effects of welfarism by promoting an alternative ethic of reciprocity (or ‘mutual obligation’) has been a key element of the neo-liberal agenda (Stratford et al. 2007) which, as discussed in section 1.1.4.2, has had substantial influence on how community-based governance has come to be understood under the regional delivery model. Aside from the possibilities that farmers have been following contingent strategies (either reciprocity or free-riding) in their interactions with higher levels of the regional delivery model, the possibility also exists that significant numbers of farmers have been following strategies of unconditional non-cooperation or, more simply, opposition. Being treated paternalistically may itself provoke farmers into following such strategies. Marshall (2001) observed from the aforementioned case study how the relationship between the irrigator community and the NSW Government had long been soured by antagonism which had led irrigators to adopt an oppositional stance in their dealings with that government. A consultant facilitating community-based processes within this case observed accordingly how:
… the old Department of Water Resources people used to rule with an iron fist. They had been like that for years. There was a culture of ‘them and us’. ‘Them’ was the Government and it laid the law down. And ‘us’ were the people who paid the water bills and did what they were told (ibid. p.261).
The considerable antagonism still felt by many farmers as a result of state governments imposing regulations restricting their rights to clear native vegetation and utilise water resources was discussed in section 3.4.1, as was the risk of this antagonism being transferred to regional NRM bodies to the extent they are perceived as extensions of government or effectively under its control. Antagonism of this kind can heighten appreciably the risk of farmers adopting strategies of unconditional non-cooperation, or opposition, in their dealings with governments and other organisations seen to be in league with them. Nee (1998 p. 88) observed as follows how ‘opposition norms’ can arise within groups when formal rules are imposed on them which are at odds with their informal norms and interests: ‘Informal norms evolve into ‘opposition norms’ if institutions and organizational sanctions are weak relative to contradicting group interests. Opposition norms encourage individuals to directly resist formal rules’. Given lack of prior knowledge regarding whether farmers in each of the cases studied were following strategies of reciprocity, free-riding or unconditional non-cooperation in their dealings with higher levels of

85
the regional delivery model, coefficients for the five variables accounting for farmers’ trust in the regional delivery model were hypothesised only to differ from zero. Support of this hypothesis would indicate landholders were predominantly following contingent strategies – either of reciprocity or free-riding – in these dealings. A positive coefficient sign for a variable would indicate the predominant strategy was reciprocity. A negative coefficient sign would indicate free-riding was dominant. Rejection of the hypothesis would indicate either that (a) landholders were predominantly following strategies of opposition (unconditional non-cooperation) in their dealings with higher-level organisations, or (b) there was no clear majority following reciprocity or free-riding strategies in these dealings, so that the conflicting effects of these strategies on adoption were cancelled out sufficiently that no overall relationship could be detected. The research design did not permit identification of which of these two possibilities reflected the actual situation. With the Australian history of paternalistic natural resources governance in respect of farmers, and the considerable antagonism this has sometimes caused, it seems reasonable to assume that few farmers were following reciprocity strategies in their dealings with government before the mid-1980s. This pattern may have begun to shift around this time as a consequence of the introduction of Landcare, integrated catchment management, and other community-based NRM programs. With such programs, Australian governments turned towards supporting the self-reliance of farmers and their communities in addressing natural resource issues, while expecting farmers and their communities to reciprocate this support by voluntarily contributing some resources towards resolving these issues (e.g., investing in adoption of recommended on-farm conservation practices). Nevertheless, the focus of such programs until introduction of the regional delivery model was on community levels no higher, relative to the scale of regions delineated under this model, than what is now called ‘subregional’. To the extent that such programs have effected a transition in farmers’ dealings with higher-level NRM bodies towards strategies of reciprocity, therefore, we would expect this transition to be more evident in their dealings with subregional groups than in their dealings with regional groups. Accordingly, it was hypothesised that farmers remain more likely to follow reciprocity strategies in their dealings with subregional bodies than in their dealings with regional bodies. This hypothesis was tested in this study with reference to the signs of the coefficients for trust in subregional body and trust in regional body variables in those particular models (i.e., concerned with adoption of a specific conservation practice) where regression analysis had found those variables to be statistically significant. Support of the hypothesis would be indicated if (a) the relative frequency with which the coefficient sign for trust in subregional body is positive when this variable is statistically significant is found to be markedly greater than (b) the relative frequency with which the coefficient sign for trust in regional body is positive when this variable is statistically significant. We might also expect to find in those subregions where subregional groups have continued as ‘frontline’ agents for the regional group, that the transition towards farmers dealing with regional groups on the basis of reciprocity has been particularly slow. The reasoning here is that reliance on such intermediaries makes it harder for regional groups to demonstrate through their deeds, not just their words (e.g., brochures and public statements), that they are trustworthy for a relationship of mutual reciprocity. Accordingly, it was hypothesised that farmers would be more likely to follow reciprocity strategies in their dealings with regional bodies in those subregions where a subregional body was not acting as a frontline agency for the regional body. 4.3 Closing remarks In this chapter the multiple regression models involved in the quantitative analysis of farmers’ adoption plans for conservation practices promoted to them under the regional delivery model were defined. Justification for applying the particular regression technique of censored normal regression, a variation of the tobit procedure, was provided. Dependent variables were defined, as was each of the explanatory variables. The hypothesis associated with each explanatory variable was defined, and the reasoning and evidence justifying this hypothesis was reviewed. The results of the quantitative analysis are presented in the following chapter.

86
5. Results: Quantitative research 5.1 Introduction The quantitative research design followed in this study for investigating how farmers’ trust in the regional delivery model, together with other factors, relates to their adoption of conservation practices was explained in the previous chapter. In this chapter, the results of applying that research design are presented, interpreted and discussed. The statistical terminology used in this section is explained in section 5.2. The results of the multiple regression analyses for each of the three cases are presented and discussed in section 5.3. The discussion considers in particular the statistical significance of associations between farmers’ trust in the regional delivery model and their plans to adopt conservation practices promoted to them under that model. The substantive significance of farmers’ trust in their subregional body (in the two cases where this was applicable) for their adoption plans in respect of conservation practices is examined in section 5.4. The question of whether farmers’ trust in their subregional and regional bodies is more likely to be associated with their adoption plans for green conservation practices, compared with brown conservation practices, is addressed in section 5.5. A summary of findings from the quantitative research is presented in section 5.5. 5.2 Terminology Prior to presenting the results, it may help some readers to explain some of the statistical terminology used in the remainder of the chapter. The estimated coefficient for a particular explanatory variable in the models presented below indicates the predicted rate of change in the relevant dependent variable (i.e., expected future change in adoption of a particular practice) as the value of that explanatory variable changes. In the estimated model for revegetation and protective fencing presented below in Table 5.1, for instance, the coefficient of 0.01 for the explanatory variable property area shows the model predicting that farmers’ expected future change in adoption of revegetation and protective fencing will increase by 0.01 hectares for each one hectare increase in property area. In the discussion that follows, the hypothesis associated with any explanatory variable (as specified in section 4.2) is deemed to be supported when model estimation indicates we can be at least 90 per cent confident in reaching this conclusion. In the tables presented in this chapter, a coefficient is presented in bold font when we can be at least this confident in accepting the associated hypothesis. The model chi-squared statistics presented in the last rows of Tables 5.1 to 7.3 provide tests of whether each model predicts a statistically significant proportion of the variance in the dependent variable for that model8. Where this statistic for a particular model is presented in bold font, we are justified in concluding, with at least 90 per cent confidence, that the model does predict a significant proportion of the variance in its dependent variable. In this study, nevertheless, we are concerned less with the predictive significance of the overall models than with the tests these models provide of the hypotheses corresponding to each of the explanatory variables comprising the models. In the minority of the models presented below that were found to have insignificant predictive power, the hypothesis tests concerned with individual explanatory variables in those models remain valid. In addition to the information provided in the summary tables presented in this chapter, the more detailed tables presented in Appendices A to C for each conservation practice provide data on:
8 Although the Stata software used to estimate the double-censored regression models provides pseudo-R2 values as rough goodness-of-fit indicators, Sribney (2007 p.1) cautioned that these values have no real meaning in the case of tobit models (of which censored normal regression models are a variant), so ‘it is better to report the model chi-squared and its p-value – not the pseudo-R2’.

87
i the significance of the predictive power of each estimated model (measured by prob > chi2). A prob > chi2 value less than 0.10 for a model justifies greater than 90 per cent confidence that the predictive power of the model exceeds zero;
ii the log likelihood ratio for each model (log likelihood); iii the total number of observations (i.e., respondents) for which data were available to estimate each
model (total no. obs); iv the number of observations for which the value of the relevant dependent variable is ‘left-
censored’ in the sense that it equals the minimum possible value (no. left-censored obs); v the number of observations for which the value of the relevant dependent variable is ‘right-
censored’ in the sense that it equals the maximum possible value (no. right-censored obs); vi the significance with which the value of each variable coefficient differs from zero (p > | t |). A p > | t | value less than 0.10 for a coefficient justifies greater than 90 per cent confidence that the
population value of the coefficient differs from zero. A p > | t | value less than 0.05 for a coefficient justifies greater than 95 per cent confidence of this kind, while a p > | t | value less than 0.01 for a coefficient justifies greater than 99 per cent confidence of this kind;
vii the level of significance with which the hypothesis concerning each coefficient is supported (sig.).
Support for the hypothesis at the 90 per cent significance (or confidence) level is indicated by the symbol *, support at the 95 per cent level by **, and support at the 99 per cent level by ***. For a coefficient hypothesised to differ from zero (i.e., a ‘two-tailed’ hypothesis denoted by a + / - symbol in the exp. sign column), the significance level at which this hypothesis is supported was determined directly from the corresponding p > | t | value. For a coefficient hypothesised to exceed zero (i.e., a ‘one-tailed’ hypothesis denoted by a + symbol in the exp. sign column), however, the p > | t | value needed to be halved before determining the significance level (if any) at which this hypothesis is supported; and
viii the predicted percentage change in the dependent variable for a one per cent change in the relevant
explanatory variable, when all explanatory variables (including the relevant variable) are at their mean values (elasticity). These elasticity values were calculated using the ey/ex option of the mfx function available in Stata statistical software version 10 (StataCorp. 2007), and only presented for an explanatory variable if the corresponding hypothesis was supported at the 90 per cent significance level or better. As distinct from significance levels, which indicate the confidence with which we might accept hypotheses associated with particular explanatory variables, these elasticity values measure the relative substantive importance within a particular model of each explanatory variable accepted as ‘statistically significant’. Such substantive measures are useful since the statistical significance of explanatory variables is not necessarily associated positively with their substantive relevance to variability in the dependent variable. Two explanatory variables can have identical statistical levels of significance yet differ considerably in how strongly equi-proportionate changes in their respective values affect the dependent variable’s predicted value.
Multicollinearity can be a problem in estimating multiple regression models, where some explanatory variables are so highly correlated with each other that the reliability of estimates for individual variable coefficients becomes compromised. Analysis of correlations between explanatory variables indicated no evidence of substantive multicollinearity problems in any of the estimated models presented below.
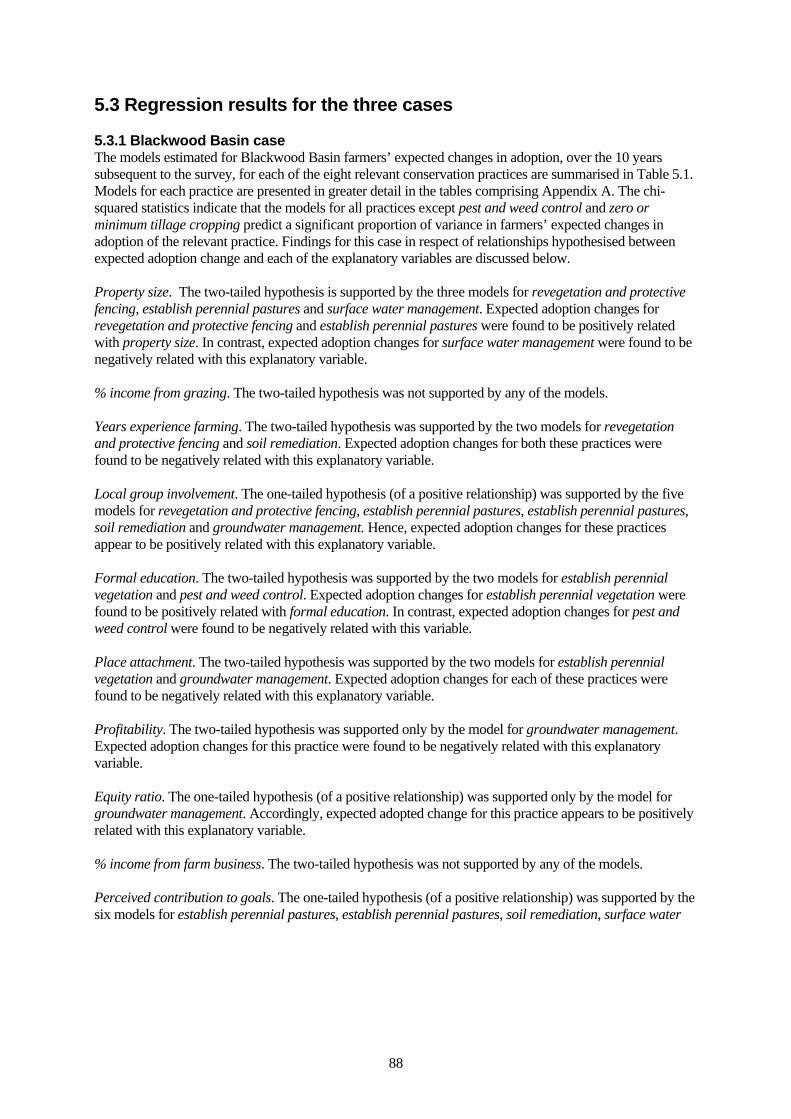
88
5.3 Regression results for the three cases 5.3.1 Blackwood Basin case The models estimated for Blackwood Basin farmers’ expected changes in adoption, over the 10 years subsequent to the survey, for each of the eight relevant conservation practices are summarised in Table 5.1. Models for each practice are presented in greater detail in the tables comprising Appendix A. The chi-squared statistics indicate that the models for all practices except pest and weed control and zero or minimum tillage cropping predict a significant proportion of variance in farmers’ expected changes in adoption of the relevant practice. Findings for this case in respect of relationships hypothesised between expected adoption change and each of the explanatory variables are discussed below. Property size. The two-tailed hypothesis is supported by the three models for revegetation and protective fencing, establish perennial pastures and surface water management. Expected adoption changes for revegetation and protective fencing and establish perennial pastures were found to be positively related with property size. In contrast, expected adoption changes for surface water management were found to be negatively related with this explanatory variable. % income from grazing. The two-tailed hypothesis was not supported by any of the models. Years experience farming. The two-tailed hypothesis was supported by the two models for revegetation and protective fencing and soil remediation. Expected adoption changes for both these practices were found to be negatively related with this explanatory variable. Local group involvement. The one-tailed hypothesis (of a positive relationship) was supported by the five models for revegetation and protective fencing, establish perennial pastures, establish perennial pastures, soil remediation and groundwater management. Hence, expected adoption changes for these practices appear to be positively related with this explanatory variable. Formal education. The two-tailed hypothesis was supported by the two models for establish perennial vegetation and pest and weed control. Expected adoption changes for establish perennial vegetation were found to be positively related with formal education. In contrast, expected adoption changes for pest and weed control were found to be negatively related with this variable. Place attachment. The two-tailed hypothesis was supported by the two models for establish perennial vegetation and groundwater management. Expected adoption changes for each of these practices were found to be negatively related with this explanatory variable. Profitability. The two-tailed hypothesis was supported only by the model for groundwater management. Expected adoption changes for this practice were found to be negatively related with this explanatory variable. Equity ratio. The one-tailed hypothesis (of a positive relationship) was supported only by the model for groundwater management. Accordingly, expected adopted change for this practice appears to be positively related with this explanatory variable. % income from farm business. The two-tailed hypothesis was not supported by any of the models. Perceived contribution to goals. The one-tailed hypothesis (of a positive relationship) was supported by the six models for establish perennial pastures, establish perennial pastures, soil remediation, surface water

89
Table 5.1: Summary of regression results for the Blackwood Basin case Explanatory variable Expected
sign Estimated model coefficients for conservation practice:
Revegetation & protective
fencing
Establish perennial vegetation
Establish perennial pastures
Soil remediation
Surface water management
Groundwater management
Pest & weed control
Zero / minimum
tillage cropping
Property area (ha) + / - 0.01 0.00 0.03 0.01 -0.09 -0.02 0.02 0.01
% net income from grazing + / - -0.3 -0.2 0.2 0.0 -0.9 -0.9 1.0 0.8
Years experience farming + / - -1.3 -1.0 -1.1 -7.0 0.7 -1.8 -1.0 -1.5
Local group involvement + 14.2 19.7 25.2 54.6 12.1 46.2 12.0 -5.7
Formal education + / - 4.8 19.1 13.1 37.4 -7.9 -14.4 -40.4 1.1
Place attachment + / - -15.7 -59.5 -31.5 -90.7 -5.7 -87.3 -38.0 -50.8
Profitability + / - 2.2 -5.9 -4.2 13.1 -40.6 -66.7 -48.2 -38.3
Equity ratio + 2.8 -21.1 22.9 1.6 6.6 39.8 9.1 -2.8
% income from farm business + / - -0.3 10.0 1.5 30.2 10.7 -4.3 -8.1 31.8
Perceived contribution to goals + 2.6 24.0 74.1 52.5 137.2 47.5 19.9 33.4
Perceived commons problem + / - 6.2 5.7 -2.0 3.9 10.2 2.5 13.1 4.0
Expected future district adoption + / - 19.8 31.4 29.0 158.7 108.8 63.1 64.7 -8.1
Trust in subregional body + / - 24.3 68.8 71.8 38.2 87.4 48.7 -52.8 22.1
Trust in regional body + / - -16.3 -3.3 -10.0 -15.4 -117.1 8.0 5.7 26.5
Trust in gov't commitment to community empowerment + / - -1.4 -0.9 -22.3 11.5 45.3 -45.1 28.9 19.4
Trust in government integrity + / - 0.1 -23.7 19.3 49.0 91.7 13.3 -16.6 36.8
Trust in regional/subregional autonomy + / - 9.6 -5.3 -37.7 -31.0 -67.5 41.6 -15.8 -44.8
Constant + / - -78.6 -173.2 -576.8 -829.4 -858.4 -110.3 283.8 -116.5
Model chi-squared (chi2) + 44.5 59.1 53.0 51.1 55.3 48.7 14.2 13.2
Bold indicates that the associated hypothesis is supported at the 90% confidence level or higher. na ~ not applicable.

90
management, groundwater management and zero or minimum tillage cropping. Hence, expected adoption changes for these practices appear to be positively related with this explanatory variable. Perceived commons problem. The two-tailed hypothesis was not supported by any of the models. Expected future district adoption. The two-tailed hypothesis was supported by the five models for revegetation and protective fencing, establish perennial vegetation, establish perennial pastures, soil remediation, surface water management and groundwater management. Expected adoption changes for each of these practices were found to positively related with this explanatory variable. Trust in subregional body. The two-tailed hypothesis was supported by the four models for revegetation and protective fencing, establish perennial vegetation, establish perennial pastures and surface water management. Expected adoption changes for these practices were found to be positively related with this explanatory variable. Trust in regional body. The two-tailed hypothesis was supported only by the model for surface water management. Expected adoption changes for this practice were found to be negatively related with this explanatory variable. Trust in government commitment to community empowerment. The two-tailed hypothesis was supported only by the model for groundwater management. Expected adoption changes for this practice were found to be negatively related with this explanatory variable. Trust in government integrity. The two-tailed hypothesis was supported only by the model for surface water management. Expected adoption changes for this practice were found to be positively related with this explanatory variable. Trust in regional and subregional autonomy. The two-tailed hypothesis was not supported by any of the models. 5.3.2 Central Highlands case The models estimated for Central Highlands farmers’ expected changes in adoption, over the 10 years subsequent to the survey, for each of the seven relevant conservation practices are summarised in Table 5.2. Models for each practice are presented in greater detail in the separate tables comprising Appendix B. The chi-squared statistics indicate that the models for all practices except environmental weeds control and minimum or zero tillage cropping predict a significant proportion of variance in farmers’ expected changes in adoption of the relevant practice. Findings for this case in respect of relationships hypothesised between expected adoption change and each of the explanatory variables are discussed below. Property size. The two-tailed hypothesis was supported by the three models for fencing riparian areas and installing watering points, soil conservation measures and property management planning. Expected adoption changes for each of these practices were found to be positively related with this explanatory variable. % income from grazing. The two-tailed hypothesis was supported only by the model for maintain groundcover on grazing land. Expected adoption changes for this practice were found to be positively related with this explanatory variable. Years experience farming. The two-tailed hypothesis was supported by the two models for environmental weeds control and maintain groundcover on grazing land. Expected adoption changes for each of these practices are positively related with this explanatory variable.

91
Table 5.2: Summary of regression results for the Central Highlands case Explanatory variable Expected
sign Estimated model coefficients for conservation practice:
Fencing riparian areas and
installing watering points
Environmental weeds control
Maintain groundcover on
grazing land
Soil conservation
measures
Fencing to land type
for grazing
Property management
planning
Minimum or zero tillage
cropping
Property area (ha) + / - 0.06 0.00 -0.01 0.17 0.02 0.49 0.00
% net income from grazing + / - 21.7 24.5 35.6 7.9 19.7 39.6 1.7
Years experience farming + / - -73.8 113.6 34.7 -13.5 1.3 130.2 8.0
Local group involvement + -81.4 1,145.3 355.8 -557.4 566.7 1,111.2 -39.4
Formal education + / - 731.7 567.6 13.5 2,175.0 828.4 819.1 78.2
Place attachment + / - -2,499.4 -1,745.7 -371.8 4,671.2 -645.9 2,431.2 47.4
Profitability + / - 94.8 -1,254.7 -241.0 1,389.4 879.9 -3,221.7 246.4
Equity ratio + -365.6 311.2 44.6 -694.1 -468.9 2,168.7 5.9
% income from farm business + / - 185.9 -112.0 122.4 -136.8 -297.6 -1,095.4 -27.6
Perceived contribution to goals + 1,678.8 548.6 184.8 996.0 1,486.7 2,656.0 277.2
Perceived commons problem + / - 498.0 102.4 28.0 1,409.7 -858.5 -5.2 -9.6
Expected future district adoption + / - 994.5 811.0 82.7 732.4 379.1 86.1 163.7
Trust in subregional body + / - 2,697.5 2,773.1 1,844.4 5,451.9 4,056.9 913.7 64.3
Trust in regional body + / - -1,647.3 -4,676.7 -2,661.8 -1,942.2 -2,866.8 -4,263.2 82.8
Trust in gov't commitment to community empowerment + / - 699.4 100.3 279.6 819.9 290.4 -201.5 110.7
Trust in government integrity + / - -1,315.8 -1,381.8 -615.4 -1,712.7 -1,555.8 -1,731.6 132.4
Trust in regional/subregional autonomy + / - -474.1 1,363.2 367.8 -3,231.3 -275.8 2,721.2 59.5
Constant + / - -5,079.9 3,659.5 394.5 -35,030.8 -9,903.8 -13,396.4 -5,010.5
Model chi-squared (chi2) + 33.1 16.1 49.5 43.0 53.1 43.2 19.6
Bold indicates that the associated hypothesis is supported at the 90% confidence level or higher. na ~ not applicable.

92
Local group involvement. The one-tailed hypothesis (of a positive relationship) was supported by the three models for environmental weeds control, maintain groundcover on grazing land and property management planning. Hence, expected adoption changes for these practices appear to be positively related with this explanatory variable. Formal education. The two-tailed hypothesis was supported by the two models for soil conservation measures and fencing to land type for grazing. Expected adoption changes for each of these practices were found to be positively related with this explanatory variable. Place attachment. The two-tailed hypothesis was supported only by the model for soil conservation measures. Expected adoption changes for this practice were found to be positively related with this explanatory variable. Profitability. The two-tailed hypothesis was supported by the two models for property management planning and minimum or zero tillage cropping. Expected adoption changes for property management planning were found to be negatively related with this explanatory variable. In contrast, expected adoption changes for minimum or zero tillage cropping were found to be positively related with this variable. Equity ratio. The one-tailed hypothesis (of a positive relationship) was supported only by the model for property management planning. Hence, expected adoption change for this practice appears to be positively related with this explanatory variable. % income from farm business. The two-tailed hypothesis was not supported by any of the models. Perceived contribution to goals. The one-tailed hypothesis (of a positive relationship) was supported by the four models for fencing riparian areas and installing watering points, fencing to land type for grazing, property management planning and minimum or zero tillage cropping. Accordingly, expected adoption change for these practices appears to be related positively with this explanatory variable. Perceived commons problem. The two-tailed hypothesis was supported by the two models for soil conservation measures and fencing to land type for grazing. Expected adoption changes for soil conservation measures were found to be positively related with this explanatory variable. In contrast, expected adoption changes for fencing to land type for grazing were found to be negatively related with this variable. Expected future district adoption. The two-tailed hypothesis was not supported by any of the models. Trust in subregional body. The two-tailed hypothesis was supported by the five models for fencing riparian areas and installing watering points, environmental weeds control, maintain groundcover on grazing land, soil conservation measures, and fencing to land type for grazing. Expected adoption changes for each of these practices were found to be positively related with this explanatory variable. Trust in regional body. The two-tailed hypothesis was supported by the four models for environmental weeds control, maintain groundcover on grazing land, fencing to land type for grazing and property management planning. Expected adoption changes for each of these practices were found to be negatively related with this explanatory variable. Trust in government commitment to community empowerment. The two-tailed hypothesis was not supported by any of the models. Trust in government integrity. The two-tailed hypothesis was supported by the two models for maintain groundcover on grazing land and fencing to land type for grazing. Expected adoption changes for each of these practices were found to be negatively related with this explanatory variable.

93
Trust in regional and subregional autonomy. The two-tailed hypothesis was supported by the two models for soil conservation measures and property management planning. Expected adoption changes for soil conservation measures were found to be negatively related with this explanatory variable. In contrast, expected adoption changes for property management planning were found to be positively related with this explanatory variable. 5.3.3 Mallee dryland case The models estimated for Mallee Region dryland farmers’ expected changes in adoption, over the 10 years subsequent to the survey, for each of the seven relevant conservation practices are summarised in Table 5.3. Models for each practice are presented in greater detail in the separate tables comprising Appendix C. The chi-squared statistics indicate that the models for all practices except remove grazing pressure from native vegetation predict a significant proportion of variance in farmers’ expected changes in adoption of the relevant practice. Findings for this case in respect of relationships hypothesised between expected adoption change and each of the explanatory variables are discussed below. Property size. The two-tailed hypothesis was supported by the three models for link patches of native vegetation, continuous cropping and reduced or minimum tillage. Expected adoption changes for each of these practices were found to be positively related with this explanatory variable. % income from grazing. The two-tailed hypothesis was supported only by the model for link patches of native vegetation. Expected adoption changes for this practice were found to be positively related with this explanatory variable. Years experience farming. The two-tailed hypothesis was supported only by the model for continuous cropping. Expected adoption changes for this practice were found to be negatively related with this explanatory variable. Local group involvement. The one-tailed hypothesis (of a positive relationship) was supported by the two models for control environmental weeds and control pest animals. Hence, expected adoption changes for these practices appear to be positively related with this explanatory variable. Formal education. The two-tailed hypothesis was supported only by the model for reduced or minimum tillage. Expected adoption changes for this practice were found to be positively related with this explanatory variable. Place attachment. The two-tailed hypothesis was not supported by any of the models. Profitability. The two-tailed hypothesis was supported only by the model for control environmental weeds. Expected adoption changes for this practice were found to be positively related with this explanatory variable. Equity ratio. The one-tailed hypothesis (of a positive relationship) was not supported by any of the models. % income from farm business. The two-tailed hypothesis was supported only by the model for continuous cropping. Expected adoption changes for this practice were found to be is positively related with this explanatory variable. Perceived contribution to goals. The two-tailed hypothesis was supported by the four models for link patches of native vegetation, control environmental weeds, establish high water-use plants, and continuous cropping. Expected adoption changes for each of these practices were found to be positively related with this explanatory variable.

94
Table 5.3: Summary of regression results for the Mallee dryland case Explanatory variable Expected
sign Estimated model coefficients for conservation practice:
Link patches of native
vegetation
Remove grazing pressure from
native vegetation
Control environmental
weeds
Establish high water-use plants
Continuous cropping
Control pest
animals
Reduced or minimum
tillage
Property area (ha) + / - 0.004 0.029 -0.048 0.025 0.059 -0.016 0.050
% net income from grazing + / - 0.5 -1.9 -0.1 -1.0 -3.4 -2.9 -0.5
Years experience farming + / - -0.2 0.2 2.4 -2.5 -13.7 -0.2 4.5
Local group involvement + 0.8 -11.9 97.6 -15.4 -31.1 65.6 -38.3
Formal education + / - 0.6 36.6 11.6 -10.8 -41.8 12.6 142.0
Place attachment + / - -7.7 -92.8 62.9 19.4 -139.0 78.1 -22.0
Profitability + / - -7.9 62.8 150.0 -35.4 -136.2 16.4 25.0
Equity ratio + -1.4 -26.5 -148.4 -2.3 70.1 -38.4 -80.4
% income from farm business + / - 3.9 -53.8 -36.2 1.3 141.4 -9.9 60.1
Perceived contribution to goals + 7.7 32.8 103.9 51.9 124.8 4.7 71.1
Perceived commons problem + / - -1.2 1.3 58.2 -11.5 44.7 28.7 43.8
Expected future district adoption + / - 14.5 56.8 235.1 123.0 323.5 222.3 98.4
Trust in subregional body na
Trust in regional body + / - 12.4 16.8 18.1 -33.2 68.3 52.6 -0.6
Trust in gov't commitment to community empowerment + / - -0.4 -66.4 45.3 31.3 82.5 56.5 104.3
Trust in government integrity + / - 3.8 89.4 -72.1 28.5 -1.1 -13.2 86.8
Trust in regional/subregional autonomy + / - -9.5 -32.8 66.4 1.8 24.0 36.2 -2.9
Constant + / - -59.8 -139.4 -1,619.3 -526.6 -1,407.3 -1,182.7 -1,617.4
Model chi-squared (chi2) + 37.6 16.3 43.6 33.4 44.6 30.2 25.2
Bold indicates that the associated hypothesis is supported at the 90% confidence level or higher. na ~ not applicable.
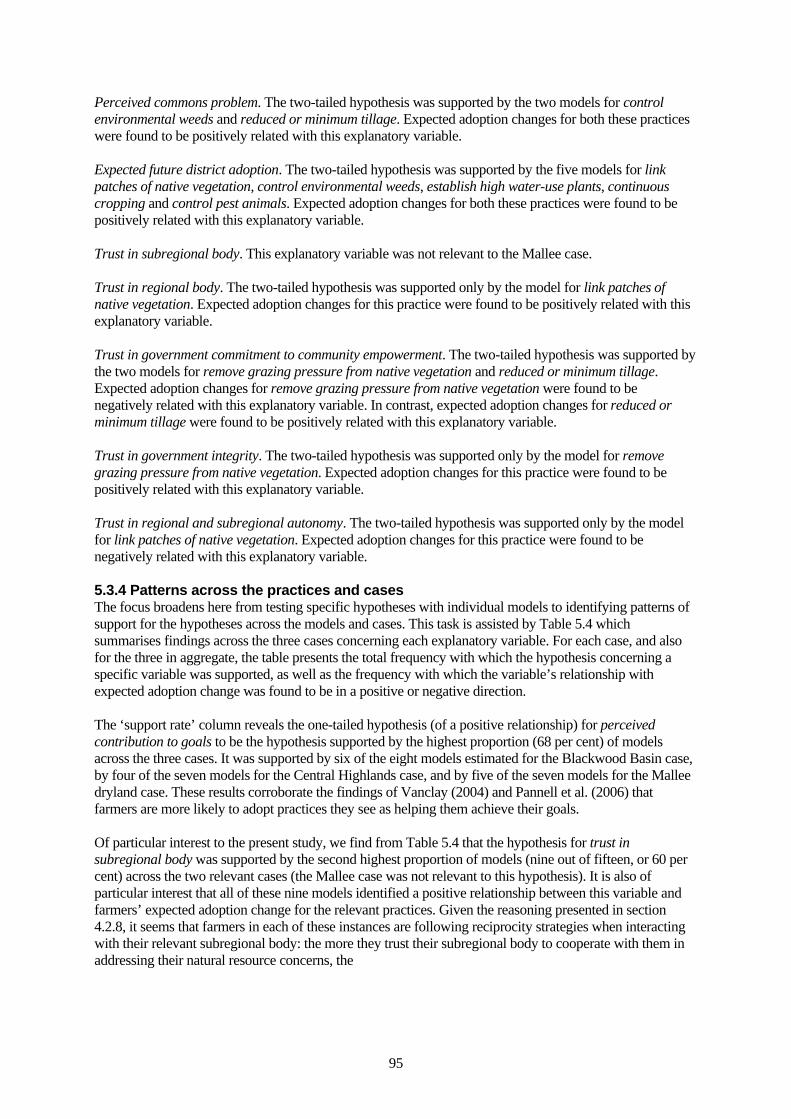
95
Perceived commons problem. The two-tailed hypothesis was supported by the two models for control environmental weeds and reduced or minimum tillage. Expected adoption changes for both these practices were found to be positively related with this explanatory variable. Expected future district adoption. The two-tailed hypothesis was supported by the five models for link patches of native vegetation, control environmental weeds, establish high water-use plants, continuous cropping and control pest animals. Expected adoption changes for both these practices were found to be positively related with this explanatory variable. Trust in subregional body. This explanatory variable was not relevant to the Mallee case. Trust in regional body. The two-tailed hypothesis was supported only by the model for link patches of native vegetation. Expected adoption changes for this practice were found to be positively related with this explanatory variable. Trust in government commitment to community empowerment. The two-tailed hypothesis was supported by the two models for remove grazing pressure from native vegetation and reduced or minimum tillage. Expected adoption changes for remove grazing pressure from native vegetation were found to be negatively related with this explanatory variable. In contrast, expected adoption changes for reduced or minimum tillage were found to be positively related with this explanatory variable. Trust in government integrity. The two-tailed hypothesis was supported only by the model for remove grazing pressure from native vegetation. Expected adoption changes for this practice were found to be positively related with this explanatory variable. Trust in regional and subregional autonomy. The two-tailed hypothesis was supported only by the model for link patches of native vegetation. Expected adoption changes for this practice were found to be negatively related with this explanatory variable. 5.3.4 Patterns across the practices and cases The focus broadens here from testing specific hypotheses with individual models to identifying patterns of support for the hypotheses across the models and cases. This task is assisted by Table 5.4 which summarises findings across the three cases concerning each explanatory variable. For each case, and also for the three in aggregate, the table presents the total frequency with which the hypothesis concerning a specific variable was supported, as well as the frequency with which the variable’s relationship with expected adoption change was found to be in a positive or negative direction. The ‘support rate’ column reveals the one-tailed hypothesis (of a positive relationship) for perceived contribution to goals to be the hypothesis supported by the highest proportion (68 per cent) of models across the three cases. It was supported by six of the eight models estimated for the Blackwood Basin case, by four of the seven models for the Central Highlands case, and by five of the seven models for the Mallee dryland case. These results corroborate the findings of Vanclay (2004) and Pannell et al. (2006) that farmers are more likely to adopt practices they see as helping them achieve their goals. Of particular interest to the present study, we find from Table 5.4 that the hypothesis for trust in subregional body was supported by the second highest proportion of models (nine out of fifteen, or 60 per cent) across the two relevant cases (the Mallee case was not relevant to this hypothesis). It is also of particular interest that all of these nine models identified a positive relationship between this variable and farmers’ expected adoption change for the relevant practices. Given the reasoning presented in section 4.2.8, it seems that farmers in each of these instances are following reciprocity strategies when interacting with their relevant subregional body: the more they trust their subregional body to cooperate with them in addressing their natural resource concerns, the
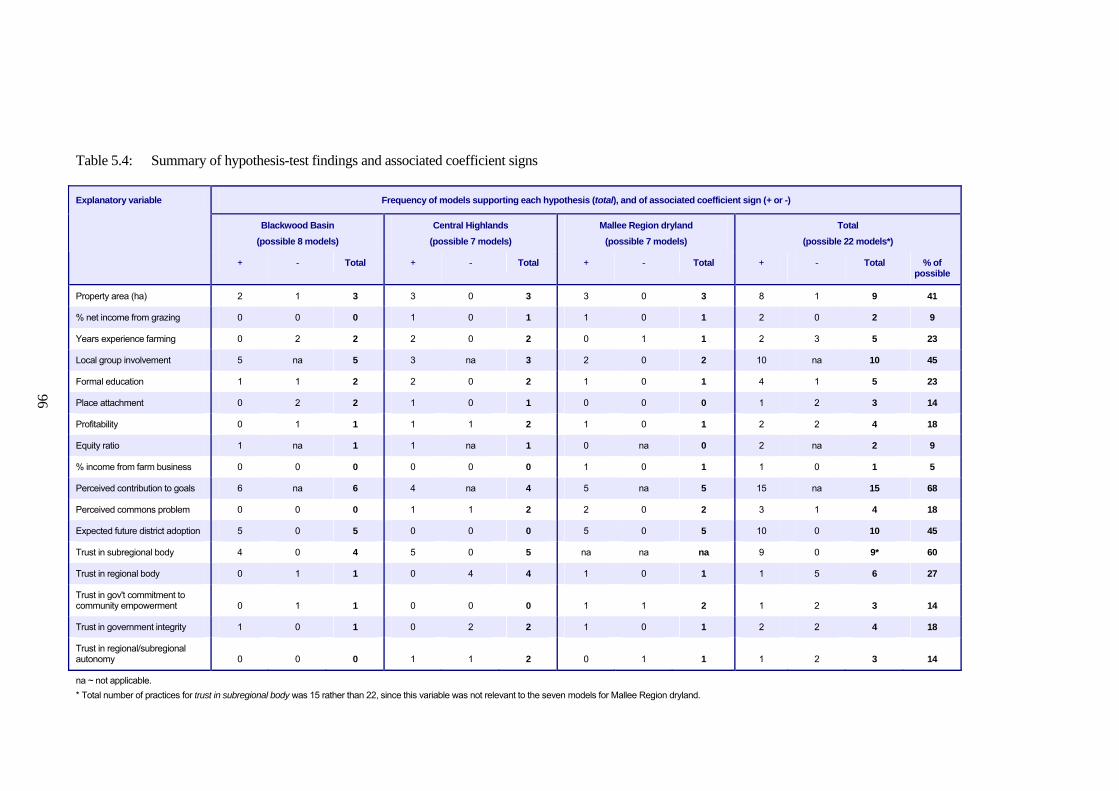
96
Table 5.4: Summary of hypothesis-test findings and associated coefficient signs
Frequency of models supporting each hypothesis (total), and of associated coefficient sign (+ or -)
Blackwood Basin (possible 8 models)
Central Highlands (possible 7 models)
Mallee Region dryland (possible 7 models)
Total (possible 22 models*)
Explanatory variable
+ - Total + - Total + - Total + - Total % of possible
Property area (ha) 2 1 3 3 0 3 3 0 3 8 1 9 41
% net income from grazing 0 0 0 1 0 1 1 0 1 2 0 2 9
Years experience farming 0 2 2 2 0 2 0 1 1 2 3 5 23
Local group involvement 5 na 5 3 na 3 2 0 2 10 na 10 45
Formal education 1 1 2 2 0 2 1 0 1 4 1 5 23
Place attachment 0 2 2 1 0 1 0 0 0 1 2 3 14
Profitability 0 1 1 1 1 2 1 0 1 2 2 4 18
Equity ratio 1 na 1 1 na 1 0 na 0 2 na 2 9
% income from farm business 0 0 0 0 0 0 1 0 1 1 0 1 5
Perceived contribution to goals 6 na 6 4 na 4 5 na 5 15 na 15 68
Perceived commons problem 0 0 0 1 1 2 2 0 2 3 1 4 18
Expected future district adoption 5 0 5 0 0 0 5 0 5 10 0 10 45
Trust in subregional body 4 0 4 5 0 5 na na na 9 0 9* 60
Trust in regional body 0 1 1 0 4 4 1 0 1 1 5 6 27
Trust in gov't commitment to community empowerment 0 1 1 0 0 0 1 1 2 1 2 3 14
Trust in government integrity 1 0 1 0 2 2 1 0 1 2 2 4 18
Trust in regional/subregional autonomy 0 0 0 1 1 2 0 1 1 1 2 3 14
na ~ not applicable. * Total number of practices for trust in subregional body was 15 rather than 22, since this variable was not relevant to the seven models for Mallee Region dryland.

97
more are they prepared to cooperate with their subregional body by adopting the on-farm practices it promotes to them. The hypotheses for local group involvement and perceived future district adoption were supported by the next highest proportion of models (45 per cent) across the three cases. The proportion of models supporting the one-tailed hypothesis (of a positive relationship) for local group involvement was highest in the Blackwood Basin case (five of the eight models), next highest for the Central Highlands case (three of seven models), and lowest for the Mallee case (two of seven models). The proportion of models supporting the two-tailed hypothesis for expected future district adoption was highest in the Mallee case (five of seven models), next highest in the Blackwood Basin case (five of eight), and lowest in the Central Highlands case (nil of seven). Each of the ten models supporting this hypothesis identified a positive relationship between perceived future district adoption and farmers’ expected adoption change for the relevant practices. Given the reasoning of section 4.2.7, it seems that the influence of expected future district adoption of a practice on their own future adoption plans is predominantly via local social dynamics encouraging them to innovate in conserving natural resources relative to what most other farmers were doing. The hypothesis for property area was supported by the next highest proportion of models (41 per cent) across the three cases. Of the nine models supporting this hypothesis, eight identified a positive relationship between this variable and farmers’ expected adoption change. It seems that where property size is influencing farmers’ expected adoption changes, this influence in most cases is through larger property sizes affording them increased scope for spreading the fixed costs of adoption (e.g., in learning and skill development) over a larger scale of adoption (see section 4.2.1). The hypothesis for trust in regional body was supported by the next (i.e., sixth) highest proportion of models (27 per cent) across the three cases. The proportion of models supporting the hypothesis for trust in regional body is less than half the proportion supporting the hypothesis for trust in subregional body. Support for this hypothesis was uneven over the three cases. The proportion of models for the Central Highlands case supporting the hypothesis for trust in regional body (four of seven models), was markedly higher than for the Blackwood Basin (one of eight) and Mallee (one of seven) cases. Aside from this one Mallee model, all other models supporting this hypothesis found trust in regional body to be negatively related with farmers’ expected adoption changes of relevant conservation practices. In the Blackwood Basin and Central Highlands cases, therefore, it seems (given the reasoning of section 4.2.8) that the evidence of links between farmers’ trust in their regional body and their expected change in adoption of particular practices also suggests that this trust is influencing farmers’ future adoption decisions predominantly through free-riding dynamics rather than reciprocity dynamics. The more in these instances they trust their regional body to cooperate with them in addressing their natural resource concerns, the less it seems they are prepared to cooperate with their regional body by adopting the on-farm practices it promotes to them. This contrasts with the above finding across the three cases that farmers’ trust in their subregional body is influencing their decisions on future adoption predominantly through reciprocity dynamics rather than free-rider dynamics. Notice from Tables 5.1 and 5.2 that four of the five models from the Blackwood Basin and Central Highlands cases that found trust in regional body to have a significant negative relationship with farmers’ expected adoption change (i.e., to influence farmers’ decisions via free-rider dynamics) also found trust in subregional body to have a significant positive relationship with farmers’ expected adoption change (i.e., to influence farmers decisions via reciprocity dynamics). The implication seems to be (given the reasoning of section 4.2.8) that the subregional bodies in these cases have managed to foster relationships of mutual responsibility (reciprocity) with most farmers, whereas the regional bodies in these cases have not been as successful in leading their relationships with farmers away from a culture of dependency or welfarism (i.e., free-riding) arising from generations of farmers being governed paternalistically. Indeed, lesser success of regional bodies in this respect was hypothesised as follows at the close of section 4.2.8: ‘Farmers remain more likely to follow reciprocity strategies in their dealings with subregional bodies than

98
in their dealings with regional bodies’. The foregoing evidence offers support for this hypothesis, at least in the context of the Blackwood Basin and Central Highlands cases. The one model for the Mallee case supporting the hypothesis for trust in regional body identified a positive relationship between this variable and farmers’ expected adoption change for the relevant practice (link patches of native vegetation). The implication is that the relevant regional body (Mallee CMA) has managed to foster relationships of mutual responsibility (reciprocity) with farmers in respect of future adoption of this particular practice. Recall the reasoning at the close of section 4.2.8 that we might expect to find, in those subregions where subregional groups have continued as ‘frontline’ agents for the regional group, that the transition towards farmers dealing with regional groups on the basis of reciprocity has been particularly slow. The reasoning was that reliance on such intermediaries makes it harder for regional groups to demonstrate through their deeds that they can be trusted as a partner in mutual reciprocity. Accordingly, it was hypothesised that farmers would be more likely to follow reciprocity strategies in their dealings with regional bodies in those subregions where a subregional body was not acting as a frontline agency for the regional body. This hypothesis may help to explain the Mallee CMA’s greater apparent success, compared with SWCC and the FBA, in fostering adoption of reciprocity strategies by farmers in its region. The absence of a subregional group as an intermediary in the Mallee dryland case may have led farmers in that case to deal more directly with the CMA than would otherwise have occurred, and thus allowed it greater opportunity to demonstrate to farmers through its behaviour that (at least in respect of the practice link patches of native vegetation) it seeks to foster their self-reliance rather than their dependency. Overall, however, future adoption of conservation practices by Mallee dryland farmers seems less affected by trust in the community-based subsystem of the regional delivery model as it applies to them (in their region involving only a regional level) than is the case for farmers in the Blackwood Basin and Central Highlands cases (where the community-based subsystems each involve a subregional level as well as a regional level). As mentioned previously, the hypothesis for trust in regional body was supported by only one of the seven models in the Mallee case, and the hypothesis for trust in subregional body was not relevant to this case. In contrast, the proportions of models supporting at least one of these two hypotheses regarding the community-based subsystem were four out of seven in the Blackwood Basin case, and six out of seven in the Central Highlands case. Hence, it seems that the trust of Mallee dryland farmers in their community-based subsystem of the regional delivery model has generally less ‘traction’ on their plans for future adoption of conservation practices than does the equivalent trust of Blackwood Basin and Central Highlands farmers. Does this suggest the lack of a subregional community-based level in the Mallee case is a handicap to farmers’ future adoption of conservation practices? A reason to think so is that the regional community-based level in this case seems to have been unable to establish reciprocity dynamics with farmers to the same degree that subregional bodies in the other two cases apparently have achieved. Nevertheless, we cannot be sure from the evidence presented here that introducing a subregional level to the Mallee case would establish such dynamics to the same degree that they appear to exist in the other two cases. The hypotheses for the remaining three variables accounting for farmers’ trust in the regional delivery model – trust in government commitment to community empowerment, trust in government integrity and trust in regional/subregional autonomy – were supported by lower proportions of models across the three cases (14 per cent, 18 per cent and 14 per cent, respectively) than was the hypothesis for trust in regional body. The hypothesis for trust in government commitment to community empowerment was supported most by the models for the Mallee case (by two of seven models). Of the three models supporting this hypothesis across the three cases, two found this variable to be negatively related with farmers’ expected adoption change, while one identified it as positively related with expected adoption change.

99
The hypothesis for trust in government integrity was supported most by models for the Central Highlands case (by two of seven models). Of the four models supporting this hypothesis across the three cases, two identified this variable as positively related with farmers’ expected adoption change, and two found it to be negatively related. The hypothesis for trust in regional/subregional autonomy was also supported most by models for the Central Highlands case (by two of seven models). Of the three models supporting this hypothesis across the three cases, two found this variable to be negatively related with farmers’ expected adoption change, while one identified it as positively related with expected adoption change. Overall, the models supporting these three hypotheses across the three cases identified six instances of the corresponding variables being negatively related with farmers’ expected adoption change (i.e., consistent with free-riding), and four instances of these variables being positively related with expected adoption change (i.e., consistent with reciprocity). With these three elements of farmers’ trust in the regional delivery model, therefore, it seems again that gaining these kinds of trust from farmers will not always be sufficient in itself to increase their willingness to adopt conservation practices. In perhaps the majority of instances, at least within the three cases studied here, it may be necessary also for actors within the regional model at all levels to take active steps to turn around farmer dependency inherited from prior paternalistic governance and foster in its place a culture of self-reliance. The last pattern to be considered here concerns the hypothesis for perceived commons problem, which was supported by 18 per cent of models across the three cases. Of the four models supporting this hypothesis, three found a positive relationship between this variable and farmers’ expected adoption change, and one (4.5 per cent = 1/22) identified a negative relationship. In most of these instances of support for this hypothesis, therefore, farmers perceiving adoption as a commons problem appear to have been responding as free-riders. The more that farmers perceived themselves as benefiting from others’ adoption, and the less they trusted others to actually adopt, the more they expected to increase their own adoption. This finding that perceived commons problem was negatively related with expected adoption change for less than five per cent of the practices modelled indicates that any problems of farmers over-perceiving adoption of conservation practices as a commons problem, and becoming less motivated to adopt as a result, might not be having the degree of negative influence on adoption feared by Pannell et al. (2006). 5.4 Substantive significance of farmers’ trust in their subregional body The preceding discussion highlighted how the hypothesis for trust in subregional body was supported statistically by a higher proportion of models for the Blackwood Basin and Central Highlands cases than any other hypothesis except the one for perceived contribution to goals. (The hypothesis for trust in subregional body was not relevant to the Mallee case.) As explained under point viii of section 5.2, however, it is possible for an explanatory variable to be statistically significant in predicting a dependent variable while having little substantive significance by way of the dependent variable’s predicted value changing markedly in response to variation in the value of the explanatory variable. In this section, therefore, we examine the substantive significance of trust in subregional body in predicting variation across farmers in the changes they expected to make in the subsequent 10 years to their adoption of conservation practices. This examination proceeds by comparing the elasticity value for trust in subregional body in each model where it was found to be statistically significant with the elasticity values for the other explanatory variables found to be statistically significant in the same model. As explained under point viii of section 5.2, the elasticity calculated in this study for an explanatory variable is a measure of the predicted percentage change in the dependent variable given a one per cent change in the explanatory variable, when all explanatory variables are set at their mean values. This examination is facilitated by Tables 5.5 and 5.6. The first of these tables focuses on the Blackwood Basin case, and compiles elasticities for all statistically-significant explanatory variables in each of the four models for this case where trust in subregional body was itself found to be statistically significant. Table
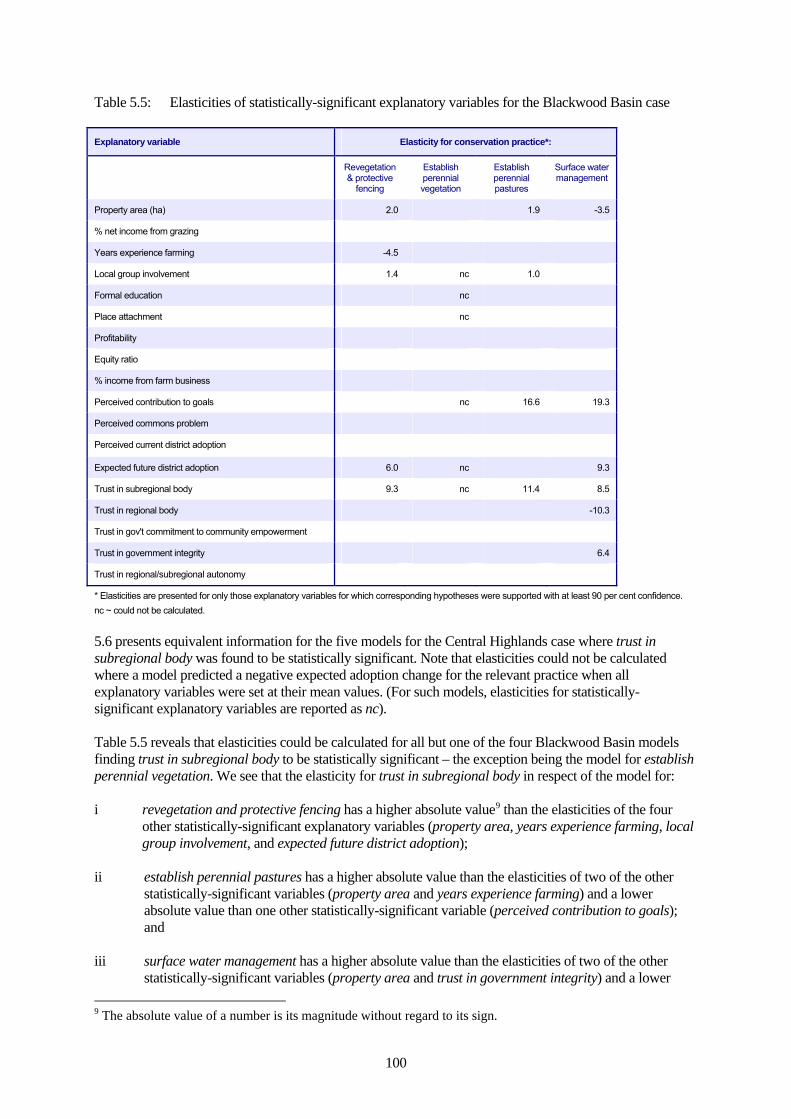
100
Table 5.5: Elasticities of statistically-significant explanatory variables for the Blackwood Basin case Explanatory variable Elasticity for conservation practice*:
Revegetation & protective
fencing
Establish perennial vegetation
Establish perennial pastures
Surface water management
Property area (ha) 2.0 1.9 -3.5
% net income from grazing
Years experience farming -4.5
Local group involvement 1.4 nc 1.0
Formal education nc
Place attachment nc
Profitability
Equity ratio
% income from farm business
Perceived contribution to goals nc 16.6 19.3
Perceived commons problem
Perceived current district adoption
Expected future district adoption 6.0 nc 9.3
Trust in subregional body 9.3 nc 11.4 8.5
Trust in regional body -10.3
Trust in gov't commitment to community empowerment
Trust in government integrity 6.4
Trust in regional/subregional autonomy
* Elasticities are presented for only those explanatory variables for which corresponding hypotheses were supported with at least 90 per cent confidence. nc ~ could not be calculated. 5.6 presents equivalent information for the five models for the Central Highlands case where trust in subregional body was found to be statistically significant. Note that elasticities could not be calculated where a model predicted a negative expected adoption change for the relevant practice when all explanatory variables were set at their mean values. (For such models, elasticities for statistically-significant explanatory variables are reported as nc). Table 5.5 reveals that elasticities could be calculated for all but one of the four Blackwood Basin models finding trust in subregional body to be statistically significant – the exception being the model for establish perennial vegetation. We see that the elasticity for trust in subregional body in respect of the model for: i revegetation and protective fencing has a higher absolute value9 than the elasticities of the four
other statistically-significant explanatory variables (property area, years experience farming, local group involvement, and expected future district adoption);
ii establish perennial pastures has a higher absolute value than the elasticities of two of the other
statistically-significant variables (property area and years experience farming) and a lower absolute value than one other statistically-significant variable (perceived contribution to goals); and
iii surface water management has a higher absolute value than the elasticities of two of the other
statistically-significant variables (property area and trust in government integrity) and a lower 9 The absolute value of a number is its magnitude without regard to its sign.
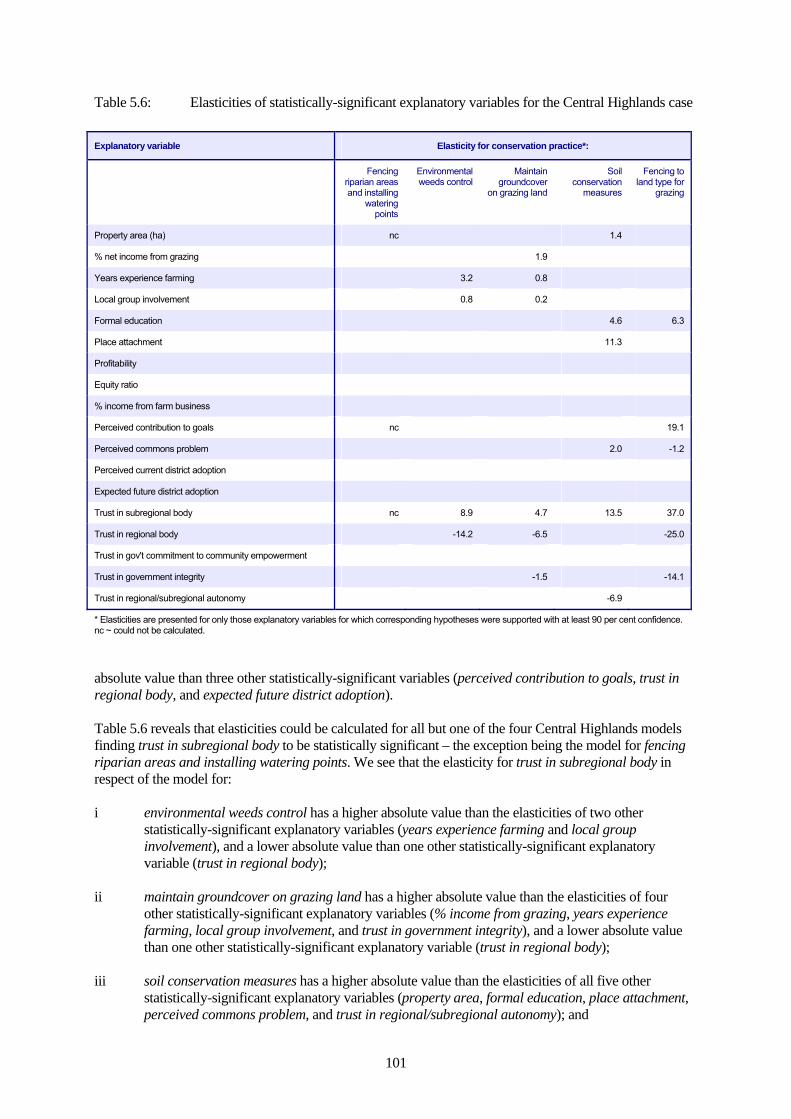
101
Table 5.6: Elasticities of statistically-significant explanatory variables for the Central Highlands case Explanatory variable Elasticity for conservation practice*:
Fencing riparian areas and installing
watering points
Environmental weeds control
Maintain groundcover
on grazing land
Soil conservation
measures
Fencing to land type for
grazing
Property area (ha) nc 1.4
% net income from grazing 1.9
Years experience farming 3.2 0.8
Local group involvement 0.8 0.2
Formal education 4.6 6.3
Place attachment 11.3
Profitability
Equity ratio
% income from farm business
Perceived contribution to goals nc 19.1
Perceived commons problem 2.0 -1.2
Perceived current district adoption
Expected future district adoption
Trust in subregional body nc 8.9 4.7 13.5 37.0
Trust in regional body -14.2 -6.5 -25.0
Trust in gov't commitment to community empowerment
Trust in government integrity -1.5 -14.1
Trust in regional/subregional autonomy -6.9
* Elasticities are presented for only those explanatory variables for which corresponding hypotheses were supported with at least 90 per cent confidence. nc ~ could not be calculated. absolute value than three other statistically-significant variables (perceived contribution to goals, trust in regional body, and expected future district adoption). Table 5.6 reveals that elasticities could be calculated for all but one of the four Central Highlands models finding trust in subregional body to be statistically significant – the exception being the model for fencing riparian areas and installing watering points. We see that the elasticity for trust in subregional body in respect of the model for: i environmental weeds control has a higher absolute value than the elasticities of two other
statistically-significant explanatory variables (years experience farming and local group involvement), and a lower absolute value than one other statistically-significant explanatory variable (trust in regional body);
ii maintain groundcover on grazing land has a higher absolute value than the elasticities of four
other statistically-significant explanatory variables (% income from grazing, years experience farming, local group involvement, and trust in government integrity), and a lower absolute value than one other statistically-significant explanatory variable (trust in regional body);
iii soil conservation measures has a higher absolute value than the elasticities of all five other
statistically-significant explanatory variables (property area, formal education, place attachment, perceived commons problem, and trust in regional/subregional autonomy); and
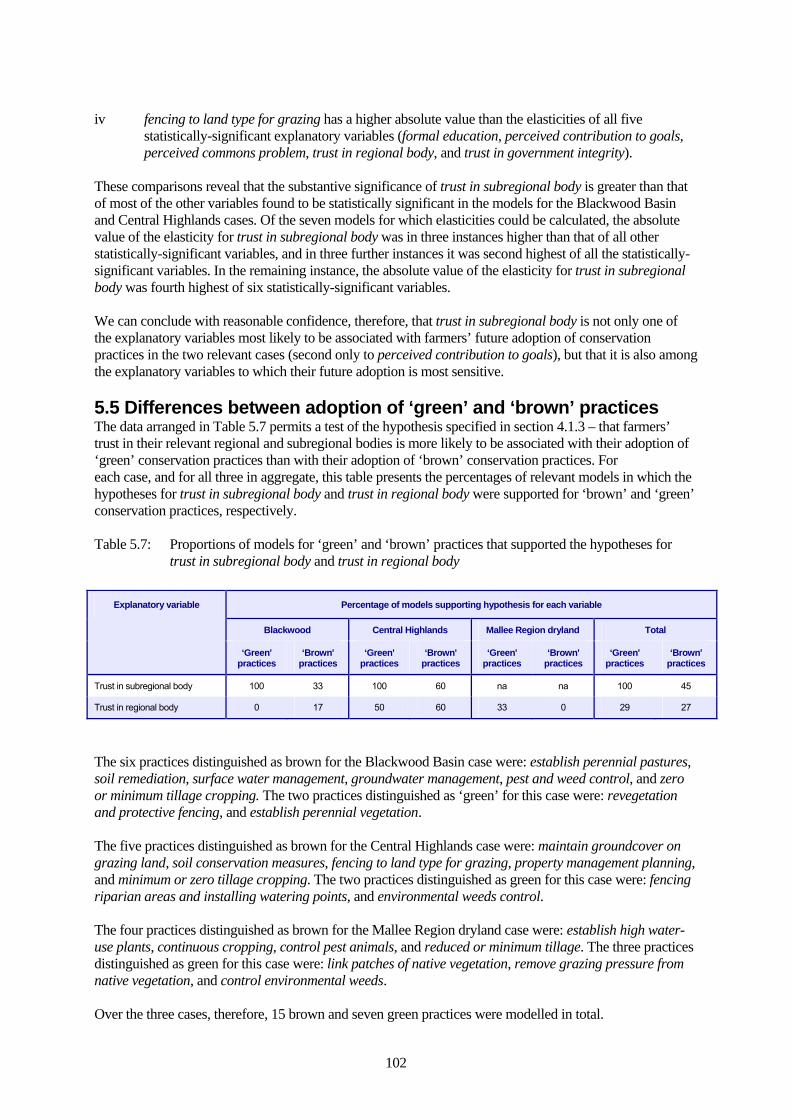
102
iv fencing to land type for grazing has a higher absolute value than the elasticities of all five
statistically-significant explanatory variables (formal education, perceived contribution to goals, perceived commons problem, trust in regional body, and trust in government integrity).
These comparisons reveal that the substantive significance of trust in subregional body is greater than that of most of the other variables found to be statistically significant in the models for the Blackwood Basin and Central Highlands cases. Of the seven models for which elasticities could be calculated, the absolute value of the elasticity for trust in subregional body was in three instances higher than that of all other statistically-significant variables, and in three further instances it was second highest of all the statistically-significant variables. In the remaining instance, the absolute value of the elasticity for trust in subregional body was fourth highest of six statistically-significant variables. We can conclude with reasonable confidence, therefore, that trust in subregional body is not only one of the explanatory variables most likely to be associated with farmers’ future adoption of conservation practices in the two relevant cases (second only to perceived contribution to goals), but that it is also among the explanatory variables to which their future adoption is most sensitive. 5.5 Differences between adoption of ‘green’ and ‘brown’ practices The data arranged in Table 5.7 permits a test of the hypothesis specified in section 4.1.3 – that farmers’ trust in their relevant regional and subregional bodies is more likely to be associated with their adoption of ‘green’ conservation practices than with their adoption of ‘brown’ conservation practices. For each case, and for all three in aggregate, this table presents the percentages of relevant models in which the hypotheses for trust in subregional body and trust in regional body were supported for ‘brown’ and ‘green’ conservation practices, respectively. Table 5.7: Proportions of models for ‘green’ and ‘brown’ practices that supported the hypotheses for
trust in subregional body and trust in regional body
Percentage of models supporting hypothesis for each variable
Blackwood Central Highlands Mallee Region dryland Total
Explanatory variable
‘Green' practices
‘Brown' practices
‘Green' practices
‘Brown' practices
‘Green' practices
‘Brown' practices
‘Green' practices
‘Brown' practices
Trust in subregional body 100 33 100 60 na na 100 45
Trust in regional body 0 17 50 60 33 0 29 27
The six practices distinguished as brown for the Blackwood Basin case were: establish perennial pastures, soil remediation, surface water management, groundwater management, pest and weed control, and zero or minimum tillage cropping. The two practices distinguished as ‘green’ for this case were: revegetation and protective fencing, and establish perennial vegetation. The five practices distinguished as brown for the Central Highlands case were: maintain groundcover on grazing land, soil conservation measures, fencing to land type for grazing, property management planning, and minimum or zero tillage cropping. The two practices distinguished as green for this case were: fencing riparian areas and installing watering points, and environmental weeds control. The four practices distinguished as brown for the Mallee Region dryland case were: establish high water-use plants, continuous cropping, control pest animals, and reduced or minimum tillage. The three practices distinguished as green for this case were: link patches of native vegetation, remove grazing pressure from native vegetation, and control environmental weeds. Over the three cases, therefore, 15 brown and seven green practices were modelled in total.

103
The hypothesis specified above in general terms can be tested as the following two ‘subsidiary hypotheses’: i. farmers’ trust in their subregional body is more likely to be associated with their adoption of
‘green’ conservation practices than with their adoption of ‘brown’ conservation practices; and ii farmers’ trust in their ‘frontline’ body under the regional delivery model (i.e., the body they deal
with most directly) is more likely to be associated with their adoption of ‘green’ conservation practices than with their adoption of ‘brown’ conservation practices. The frontline body is the subregional body where one exists (i.e., the BBG for the Blackwood Basin case, and CHRRUP for the Central Highlands case), or the regional body (i.e., the Mallee CMA for the Mallee dryland case) where there is no subregional body.
Subsidiary hypothesis (i), that farmers’ trust in their subregional body is more likely to be associated with their adoption of ‘green’ practices than of ‘brown’ practices, is examined first. We see from Table 5.7 that the hypothesis for trust in subregional body was supported in the Blackwood Basin case by each of the two models for green practices (100 per cent), and by two of the six models for brown practices (33 per cent). The hypothesis for trust in subregional body was supported in the Central Highlands case by each of the two models for green practices (100 per cent), and by three of the five (60 per cent) models for brown practices. (The hypothesis was not relevant to the Mallee case.) Aggregating the two relevant cases, we see that the hypothesis for trust in subregional body was supported by each of the four models for green practices across these cases (100 per cent), and by five of the 11 models for brown practices across these cases (45 per cent). The directions of these differences for the two cases and in aggregate are each consistent with the hypothesis that farmers’ trust in their relevant subregional body is more likely to be associated with their adoption of green practices than of brown practices. Moreover, the substantial magnitudes of the differences suggest we might be reasonably confident in accepting subsidiary hypothesis (i). Subsidiary hypothesis (ii), that farmers’ trust in their ‘frontline’ body under the regional delivery approach is more likely to be associated with their adoption of ‘green’ practices than of ‘brown’ practices is now examined. As explained above, the relevant frontline bodies are the BBG for the Blackwood Basin case, CHRRUP for the Central Highlands case, and the Mallee CMA for the Mallee dryland case. We saw in considering the first subsidiary hypothesis that the proportions of ‘green’ and ‘brown’ models supporting the hypothesis for trust in subregional body (a) for the Blackwood Basin case were 100 per cent and 33 per cent, respectively; and (b) for the Central Highlands case were 100 per cent and 60 per cent, respectively. In addition, Table 5.7 reveals that the hypothesis for trust in regional body was supported in the Mallee case by 33 per cent of the models for green practices (one of three models), and 0 per cent of the models for brown practices (none of four models). For each of the three cases, therefore, farmers’ trust in their frontline body was found more likely to be associated with their adoption of green practices than with their adoption of brown practices. The proportion of ‘green models’ supporting the hypothesis regarding relevant frontline bodies across the three cases was 71 per cent (supported by five of the seven such models). The corresponding proportion of ‘brown models’ was 33 per cent (supported by five of the 15 such models). In aggregate across the three cases, therefore, farmers’ trust in their frontline body was found more likely to be associated with their adoption of green practices than with their adoption of brown practices. The directions of the differences in proportions for each of the three cases, and also in aggregate across the cases, are consistent with subsidiary hypothesis (iii) – that farmers’ trust in their frontline NRM body is more likely to be associated with their adoption of green practices than of brown practices. Moreover, the substantial magnitudes of the differences indicate we might be reasonably confident in accepting this subsidiary hypothesis. 5.6 Summary of findings The following summary of findings from the regression analysis reported in this chapter is presented in response to four questions central to the analysis.

104
1. How important for farmers’ adoption of conservation practices promoted by the regional delivery
model is their trust in that model? The regression analyses found that farmers’ trust in the regional delivery model was associated with their future plans for adoption of a high proportion of the 22 practices across the three cases. Indeed, one of the elements of this trust, trust in subregional body, was found to relate to farmers’ expected adoption changes only less frequently than perceived contribution to goals. In those instances where a relationship with this element was found, moreover, it was usually found that predicted values of farmers’ expected adoption changes were more sensitive to one-percentage changes in this element than to one-percentage changes of most other factors found to be associated. Within the three cases, therefore, we are reasonably justified in concluding that the trust of farmers in the regional delivery model is relatively important, compared with other factors, as a predictor at least of their future adoption plans for conservation practices. Further research is of course required to assess how validly this finding might be generalised to other cases. 2. What elements of farmers’ trust in the regional delivery model were most frequently associated
with their adoption of conservation practices promoted under that model? The element of farmers’ trust in the regional delivery model found to be associated most frequently with their expected changes in their adoption of conservation practices was trust in subregional body. Of the 15 models for different practices across the Blackwood Basin and the Central Highlands (remembering the Mallee case lacks a relevant subregional body), 60 per cent found this element of trust to be associated with farmers’ future adoption plans. The element of farmers’ trust in the regional delivery related second most frequently to their future adoption plans for conservation practices was trust in regional body. (This element was relevant to all three cases.) 3. Through what dynamics is farmers’ trust in the regional delivery model associated with their
adoption of conservation practices? Are these dynamics uniform across different elements of farmers’ trust in the regional delivery model?
In each of the nine instances where trust in subregional body was found to be associated with farmers’ future adoption plans for conservation practices, they were positively associated. This suggests that the relationship between farmers’ trust in their relevant subregional body and their future adoption plans was in each of these instances the outcome of farmers’ following reciprocity strategies when dealing with this body (i.e., the more they trusted their subregional body, the more they intended to cooperate by adopting practices promoted by that body). In five of the six instances where trust in regional body was found to be associated with farmers’ future adoption plans for conservation practices, the association was in a negative direction. (The exception was the only instance in the Mallee case where an association was identified.) This suggests that the relationship between farmers’ trust in their relevant regional body and their future adoption plans was in each of these five instances the outcome of farmers’ following free-rider strategies when interacting with this body (i.e., the more they trusted their regional body, the less they intended to cooperate by adopting practices promoted by that body). In the Blackwood Basin and Central Highlands cases, therefore, it seems farmers are predominantly following reciprocity strategies in respect of their relevant subregional body, and free-rider strategies in respect of their relevant regional body. This phenomenon may stem from past paternalistic governance of farmers having bred a culture of dependency and free-riding – the more farmers trusted higher bodies to address their problems for them, the more they withdrew from helping to solve those problems. To the extent that the subregional bodies in the Blackwood Basin and Central Highlands cases have interacted more directly with farmers than the
105
respective regional bodies, and thus have been able to demonstrate more easily through their actions they are not paternalistic, this may explain why farmers in these cases seem mostly to be following reciprocity strategies with their relevant subregional body and free-rider strategies with their relevant regional body. This explanation is consistent also with the finding, in the single instance in the Mallee case of trust in regional body being related to farmers’ future adoption plans, that they were positively related in this instance. No relevant subregional body exists in the Mallee case, thus perhaps giving the relevant regional body more opportunities to interact directly with farmers and demonstrate a commitment to not follow paternalistic ways. Nevertheless, feedback in the final consultation round suggested that the lesser success of regional bodies in establishing relationships of reciprocity with farmers, relative to subregional bodies where they exist, may sometimes stem not only from the fewer opportunities they have to interact directly with farmers, but also from the fact that some regional bodies have found themselves representing farmers’ interests in the legislative arena, and thereby maintained farmers’ dependency in this respect. Concerning the finding that farmers in the Central Highlands subregion seem to be following reciprocity strategies in respect of the Fitzroy Basin Association, at least for four of the seven conservation practices analysed in that case, an officer from that organisation commented:
I think it’s largely about how farmers perceive the role of each of the groups [i.e., the FBA and CHRRUP]. Whenever there’s a stink about government legislation in NRM, they come to the FBA saying, ‘We don’t like what’s going on. Can you sort it?’. So when legislation looms, they think, ‘We are going to have to do all this stuff’. There’s two ways they can deal with it. They could say, ‘Let’s try to ameliorate the legislation’, or else they could say, ‘Let’s do the stuff’. They go to the FBA to have the legislation changed so they have to make fewer changes. They see FBA as a mechanism by which they won’t have to do as much. Whereas subregional groups don’t take on that role as much.
4. Is farmers’ trust in the regional delivery model more crucial for their adoption of ‘green’ practices
promoted under that model, compared with ‘brown’ practices promoted under that model? ‘Green’ conservation practices (e.g., revegetation and protective fencing) tend to be less familiar to most farmers than ‘brown’ conservation practices (e.g., soil conservation measures). In addition, this discomfort with green practices has been heightened by government regulatory interventions over the last decade regarded by many farmers as part of a ‘green agenda’ to erode their property rights. Hence, it would seem that the need for regional and subregional bodies to gain the trust of farmers before successfully promoting a conservation practice is greater for green practices than for brown practices. Accordingly, it was hypothesised that farmers’ trust in their relevant regional and subregional bodies would be more likely to be associated with their future adoption plans for green conservation practices than with their future adoption plans for brown conservation practices. This hypothesis was supported in respect of trust in subregional body. It was tested also in respect of their ‘frontline’ NRM body – that closest to their scale, and which they deal with most directly. This is their subregional body where such exists (i.e., in the Blackwood Basin and Central Highlands cases). Otherwise it is their regional body (i.e., in the Mallee dryland case). The hypothesis was supported in respect of farmers’ trust in their frontline NRM body. These results indicate that farmers’ trust in the regional delivery model may indeed be more crucial for their adoption of green practices, compared with brown practices, promoted under that model – at least within the three cases examined in this research. The degree to which this and the other findings above can be generalised validly to other cases can only be determined through research into a more extensive set of cases.

106
6. Guidelines for Community-based NRM under the Regional Delivery Model As explained in Chapter 1, the research reported in this document was initiated to contribute knowledge of use to the Australian NRM policy community in pursuing through adaptive management institutional arrangements conducive to community-based environmental governance at the scale of extensive regions (as defined presently for the regional delivery model). The focus of the research on ‘nesting’ as a strategy of scaling-up community-based NRM beyond the level of local community groups was motivated by E. Ostrom’s (1990) research identifying eight design principles characterising a range of community-based (common property) regimes that had proved robust in governing small-scale natural resource systems. These design principles were presented as essential conditions helping to explain the success of the community-based regimes in sustaining the natural resource systems within their jurisdictions and gaining continued compliance with the rules they had set. The present research was motivated particularly by the eighth of these design principles, which Ostrom found to be characterised by the regimes in her set that were concerned with natural resource systems which were themselves parts of larger systems. The eighth principle, of specific relevance to such regimes, was: ‘Appropriation, provision, enforcement, conflict resolution, and governance activities are organised in multiple layers of nested enterprises’ (ibid. p.90). The present research was especially concerned with exploring how this ‘nesting principle’ translates to the context of Australia’s regional delivery model, and whether it has practical value in formulating institutional arrangements under this model capable of realising the benefits sought from a community-based approach – viz. greater voluntary ‘grass roots’ cooperation in implementing solutions to environmental problems than could be obtained otherwise. Inspired by the earlier research, the plan for the present research was to ‘unpack’ the nesting principle into a ‘working set of design principles for nested community-based NRM’ that were relevant to the Australian context. This new set of principles was envisaged as complementary to the nesting principle itself, assisting institutional development in this domain by adding sufficient content to the original principle for policy makers to appreciate its practical relevance to their wider deliberations. Progress in the present research towards developing such a set of principles for nested community-based NRM is reported in this chapter. During the course of this research, however, other scholars in Australia and elsewhere have made contributions of key relevance to its focus. Indeed, a number of leading scholars in the common property tradition have cast doubt on the value of research seeking to identify design principles that policy makers might utilise as normative guides for institutional design. Section 6.1 reviews some critiques of this kind and discusses how they influenced the present research. Other scholars have proceeded with their own efforts to identify normative principles capable of guiding institutional design choices under the regional delivery model and other larger-scale programs of community-based environmental governance. Section 6.2 reviews a number of such contributions that are particularly relevant to the present research. Contributions from the present research to the knowledge base available to policy makers working in this domain are then discussed in section 6.3. Finally, closing remarks are presented in section 6.4. 6.1 The design principles approach: critiques and responses E. Ostrom (1990) was careful to emphasise that her set of design principles should not be used as a blueprint for policy makers to follow in reforming existing community-based regimes of environmental management or establishing new ones. Moreover, she was ‘… not yet willing to argue that these design principles are necessary conditions for achieving institutional robustness in CPR [common-pool resource] settings’ (ibid. p.90). Nevertheless, Ostrom was prepared to speculate that further research would result eventually in the identification of a set of necessary design principles. Young (2002 p.168) highlighted the policy, or ‘normative’, implications of this research agenda once completed as follows: ‘All those seeking to (re)form management regimes dealing with CPRs will know

107
that the arrangements they create cannot endure or produce sustainable outcomes unless they include provisions that address concerns identified in each of the design principles’. Nevertheless, Agrawal (2002) cast doubt on whether pursuit of this agenda to completion would be worthwhile. He compared the findings of Ostrom and a number of two other prominent books of common property scholarship (Baland and Platteau 1996; Wade 1988) in respect of conditions they identified as associated with the ability of local communities to self-manage natural resources sustainably. He found that they identified in aggregate 24 different conditions critical for successful community-based governance of common-pool resources. Once he added additional factors identified in the literature on community governance of common-pool resources as being important for sustainably managing such resources, he concluded:
… it is reasonable to suppose that the total number of factors that affect successful management of the commons is greater than 30, and may be closer to 40. … As soon as we concede the possibility that between 30 and 40 variables affect the management of common-pool resources, and that some of these variables may have important interactional effects, we confront severe additional analytical problems (Agrawal 2002 p.65).
Given the analytical problems of establishing that a set of variables as large as this is universally critical for successful governance of common-pool resources, he argued:
Lists of factors can only be the starting point in the search for a compelling theorization of how these factors are related to each other and to outcomes. Instead of focusing on lists of factors that apply to all commons institutions, it is likely more fruitful to focus on configurations of conditions that contribute to sustainability (ibid. p.53).
Young (2002) also drew attention to the limitations of the design principles approach stemming from its focus on identifying links that are unconditional. If a design principle represents a necessary condition, then non-compliance with that principle means institutional failure irrespective of the degree of compliance with all other design principles. He observed that this presumption is inconsistent with the experience of many practitioners ‘that there is more than one way to solve most problems involving human actions … ’ (ibid. p.169). Moreover, he observed that such an approach will be unappealing to policy makers who conclude ‘they are being asked to make an enormous effort to devise arrangements that fulfil a long list of necessary conditions but that still offer no assurance that the results will prove to be robust or sustainable’ (ibid. p.170). In addition, Young (ibid.) questioned the validity of assuming that design principles identified from one population of cases – which for Ostrom (1990) encompassed community-based regimes for small-scale common-pool resources – can be generalised beyond that population. He concluded as follows that generalisations of this kind are often not warranted given heterogeneity of cases:
One size does not fit all when it comes to the creation of effective environmental regimes; design principles derived from a study of some members of the larger universe of problems run the risk of failing to produce the desired outcomes or leading to highly inefficient results when applied to others (Young 2002 p.175).
Given these limitations of the design principles approach, Young proposed the ‘institutional diagnostics approach’ as an intermediate method that avoids not only excessive generalisation but also the limitations of treating each case as entirely unique. This approach seeks to:
… disaggregate environmental issues, identifying elements of individual problems that are significant from a problem-solving perspective and reaching conclusions about design features necessary to address each element. … [T]his procedure may lead to identification of … recurrent combinations of diagnostic conditions that require similar treatment. But in many cases, the particular combination of conditions will be uncommon or even specific to the problem. As long as elements of these combinations are recognizable conditions that have identifiable implications for the design of management regimes,

108
however, analysts and practitioners will be able to formulate recommendations for treatment of specific cases that are based on application of midrange generalizations (ibid. p.176).
Writing around 15 years after first publishing her design principles, E. Ostrom (2005) seemed to have taken onboard these critiques of the design principles approach. Admitting to be still often quizzed about the appropriate role of the design principles in informing institutional design efforts, she answered by first observing that institutional design involves design of a complex system and that humans are incapable of designing complex systems optimally at the outset. She then proceeded to note, following Simon (1981), that ‘where one begins a search to improve the quality of a complex system … makes a substantial difference in the quality and speed of the search process’ (E. Ostrom 2005 p.270). Application of her design principles as a ‘beginning point for conducting a broad search for appropriate means of solving problems’, she implied, is a good way of expediting the learning needed to improve institutional performance. Hence, she proposed that the design principles be translated into a series of initial questions to be asked when thinking about improving the sustainability of a common-pool resource system. For instance, she suggested that the ‘nesting principle’ be translated into the following question: ‘How do we create a multiple-layer, polycentric system that can be dynamic, adaptive, and effective over time?’ (ibid. p.271). This was the approach taken in the research reported in this document. Hence, the ‘nesting principle’ served as a point of departure for exploring how institutional arrangements for multi-level governance under the regional delivery model differ across regions and subregions, and how variation in such arrangements relates to their performance in realising the hoped-for advantages of a community-based approach – viz. increased voluntary cooperation in making the on-ground changes needed to address degradation of natural resources. Before proceeding to present the contributions of the present research in this direction, however, it will be useful to consider the findings of other recent research similarly focused. Indeed, the level of research effort concerned with multi-level environmental governance, community-based and otherwise, has accelerated markedly since commencement of the present research (e.g., Berkes 2008; Berkes et al. 2006; Cash et al. 2006). A review of some of this earlier research will help to highlight the ‘value added’ by the present research. 6.2 Recent contributions to normative guidelines for multi-level environmental governance Three recent studies will be reviewed briefly in this section. Two of these were based on an international range of case studies (Armitage 2008; Ribot 2004), and the third was based on case studies of regional bodies operating under Australia’s regional delivery model for natural resource management (Davidson et al. 2006; Lockwood et al. 2007). Armitage (2008 p.16) observed how a ‘hybridized’ literature had emerged at the interface between scholarship on common property and the commons on the one hand, and on complexity and resilience on the other. Noting how this literature emphasises an array of governance attributes important for dealing with the complexity of adaptively managing the commons in a multi-level world, he tabulated a selection of these attributes. This selection of attributes is presented in Table 6.1, along with abridged versions of his discussions on how each attribute tends to be understood in the literature.
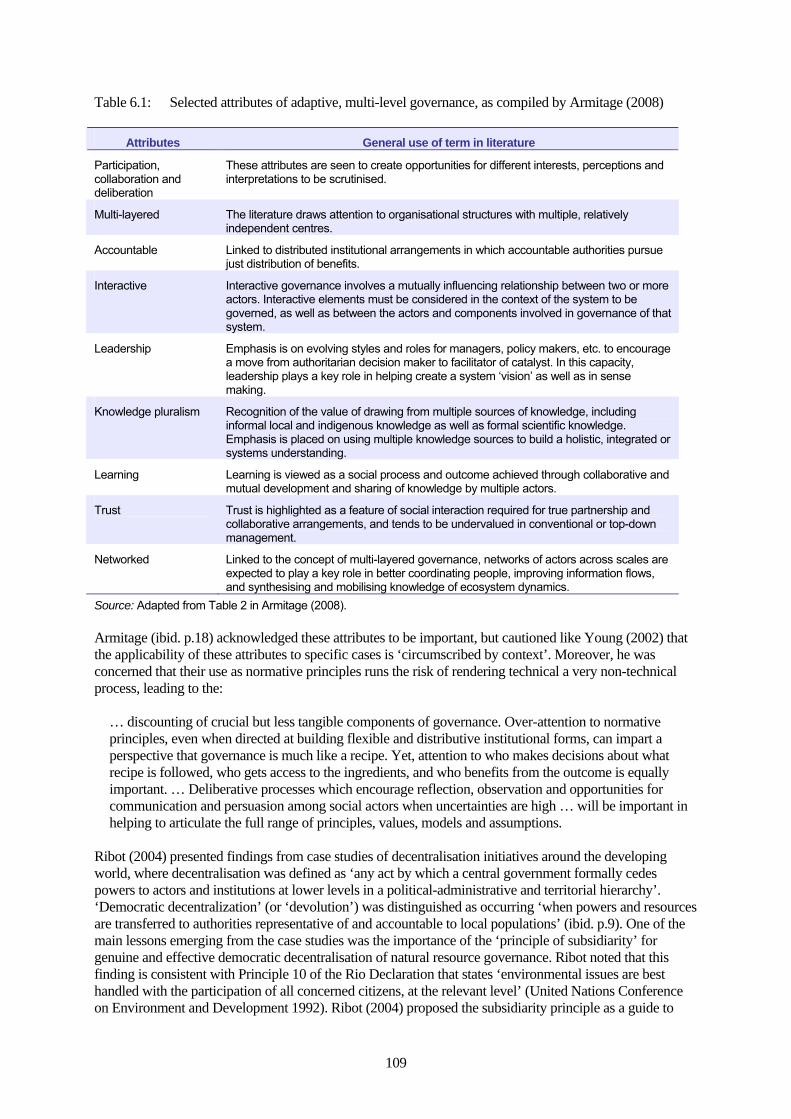
109
Table 6.1: Selected attributes of adaptive, multi-level governance, as compiled by Armitage (2008)
Attributes General use of term in literature
Participation, collaboration and deliberation
These attributes are seen to create opportunities for different interests, perceptions and interpretations to be scrutinised.
Multi-layered The literature draws attention to organisational structures with multiple, relatively independent centres.
Accountable Linked to distributed institutional arrangements in which accountable authorities pursue just distribution of benefits.
Interactive Interactive governance involves a mutually influencing relationship between two or more actors. Interactive elements must be considered in the context of the system to be governed, as well as between the actors and components involved in governance of that system.
Leadership Emphasis is on evolving styles and roles for managers, policy makers, etc. to encourage a move from authoritarian decision maker to facilitator of catalyst. In this capacity, leadership plays a key role in helping create a system ‘vision’ as well as in sense making.
Knowledge pluralism Recognition of the value of drawing from multiple sources of knowledge, including informal local and indigenous knowledge as well as formal scientific knowledge. Emphasis is placed on using multiple knowledge sources to build a holistic, integrated or systems understanding.
Learning Learning is viewed as a social process and outcome achieved through collaborative and mutual development and sharing of knowledge by multiple actors.
Trust Trust is highlighted as a feature of social interaction required for true partnership and collaborative arrangements, and tends to be undervalued in conventional or top-down management.
Networked Linked to the concept of multi-layered governance, networks of actors across scales are expected to play a key role in better coordinating people, improving information flows, and synthesising and mobilising knowledge of ecosystem dynamics.
Source: Adapted from Table 2 in Armitage (2008). Armitage (ibid. p.18) acknowledged these attributes to be important, but cautioned like Young (2002) that the applicability of these attributes to specific cases is ‘circumscribed by context’. Moreover, he was concerned that their use as normative principles runs the risk of rendering technical a very non-technical process, leading to the:
… discounting of crucial but less tangible components of governance. Over-attention to normative principles, even when directed at building flexible and distributive institutional forms, can impart a perspective that governance is much like a recipe. Yet, attention to who makes decisions about what recipe is followed, who gets access to the ingredients, and who benefits from the outcome is equally important. … Deliberative processes which encourage reflection, observation and opportunities for communication and persuasion among social actors when uncertainties are high … will be important in helping to articulate the full range of principles, values, models and assumptions.
Ribot (2004) presented findings from case studies of decentralisation initiatives around the developing world, where decentralisation was defined as ‘any act by which a central government formally cedes powers to actors and institutions at lower levels in a political-administrative and territorial hierarchy’. ‘Democratic decentralization’ (or ‘devolution’) was distinguished as occurring ‘when powers and resources are transferred to authorities representative of and accountable to local populations’ (ibid. p.9). One of the main lessons emerging from the case studies was the importance of the ‘principle of subsidiarity’ for genuine and effective democratic decentralisation of natural resource governance. Ribot noted that this finding is consistent with Principle 10 of the Rio Declaration that states ‘environmental issues are best handled with the participation of all concerned citizens, at the relevant level’ (United Nations Conference on Environment and Development 1992). Ribot (2004) proposed the subsidiarity principle as a guide to

110
deciding the ‘relevant level’ for any particular issue. He interpreted this principle as defining the relevant level is the ‘most-local-possible-level, provided that making the decision at this level does not cause negative effects at higher social or political-administrative scales’ (ibid. p.23). Accordingly, his first recommendation aimed at improving democratic decentralisation of natural resource governance was ‘to develop environmental subsidiarity principles … to guide the transfer of appropriate and sufficient powers to local authorities’ (ibid. p.82). Based on the case studies he had reviewed, he proposed as a starting point the list of environmental subsidiarity principles reproduced in Table 6.2. Table 6.2: Environmental subsidiarity principles as proposed by Ribot (2004)
Principle Elaboration
Create discretion Transfer discretionary powers to local authorities to give them some independence.
Provide significant powers
Such powers are meaningful to local people and, as a result, they reinforce the authority of those who hold them.
Fund mandates Provide sufficient fiscal resources and technical support to fulfil mandates.
Transfer funds and fund-raising powers
Earmark funds for local authorities and transfer revenue-raising rights to local authorities.
Transfer lucrative opportunities
Transfer commercially-valuable resource-use opportunities to local authorities.
Do not conflate technical with political decisions
Do not conflate technical decisions, such as which species to protect, with political decisions, such as who should have access to resources.
Maintain the public domain
Keep public resources within the public sector, rather than privatise them.
Ensure security Transfer powers to representative local authorities as secure rights and not as retractable privileges.
Separate powers Separate and balance executive, legislative, and judicial powers at each level of government.
Balance powers in government
Balance powers given to each level of government with those of other levels, so that each level has the ability to use its powers and to negotiate with other levels of authority.
Balance powers over commercial resources
Give local authorities the power to restrict the access of outside industries to local resources.
Match powers to scales Transfer powers to the most-local level and encourage those local jurisdictions to form federations to manage the resources they share. Creating federations to manage resources that span multiple local districts may be preferable to creating special districts or giving powers to higher levels of authority.
Source: Adapted from Box 19 in Ribot (2004) Some of these principles are more relevant to the context of Australia’s regional delivery model than others. The principle create discretion is clearly relevant. Ribot argued that ‘[u]nlike mandates, which require local authorities to act on behalf of the mandating agency, discretion enables representatives to act on behalf of their constituents. … Without discretionary powers, local government is merely an extension of central government’. The principle transfer lucrative opportunities may not be directly relevant to the regional delivery model at this stage, but its relevance becomes clearer when Ribot observes that ‘[t]he overriding principle that most governments see to be following is: keep everything of value centralized and transfer centrally defined obligations to lower-level authorities. This is a clear formula for central consolidation’ (ibid. p.51). Parallels between some other of these principles and the lessons drawn from the present research are highlighted in section 6.3. Ribot was concerned that interpretation of the subsidiarity principle not be dominated by those with vested interests in the existing order, and thus with reason to resist decentralisation of discretionary and significant powers. He found accordingly that:

111
Procedures for determining the optimal division of powers must involve multiple parties. Capacity arguments and technical arguments for retaining powers at the center should be weighed with great care. At the center there is much fear of losing power. There are also many false scientific-sounding arguments that can misguide those decisions (ibid. p.71).
Consistent with this concern, Ribot made two final recommendations focussed on overcoming obstacles to democratic decentralisation posed by resistance from those with perceived vested interests in the existing order. These recommendations and associated comments are brought together in Table 6.3. Table 6.3: Recommendations in Ribot (2004) on dealing with resistance to democratic decentralisation
Recommendation Comments
Counter resistance Resistance to effective decentralisation needs to be challenged by everyone with an interest in its success. Arguments against effective decentralisation need to be met with counterarguments that are well grounded in research. Civic education to inform people of their rights and responsibilities, and use of federated organisations and legislative representation to strengthen the voice of the less powerful, can also be important in countering resistance.
Seize opportunities Opportunities can arise when politicians talk of local democracy, leading people to expect and demand it. They can arise also when governments face crises forcing them to make reforms that open new doors for policy influence. Progressive politicians and bureaucrats can also become active, creating new channels of influence. However, supporters of effective decentralisation need to be prepared to act on opportunities when they arise. They need to know what they want and understand how to achieve it.
Source: Ribot (2004 pp.82-83) The third and final study to be reviewed here was reported by Davidson et al. (2006) and Lockwood et al. (2007). This study was of particular interest to the present research not only because its objectives included developing a set of principles for good regional NRM governance but also because the case studies for their research were drawn from Australia’s regional delivery model. The principles were developed as a foundation for establishing a monitoring and evaluation framework for regional NRM governance. The research data was obtained from qualitative interviews with research partners, as well as advice from an expert panel. The research partners were: representatives from nine of the 56 regions defined for that model; NRM staff from the New South Wales, Victorian, Tasmanian and Australian Governments; and an advisor operating at the national level. The research drew on three literatures – concerned respectively with wicked problems, complexity, and new governance – as a first step in identifying normative principles for good governance under the regional delivery model. The principles emerging from the literature review were refined after consultation with research partners and subsequent reconsideration by the research team. The normative principles identified finally by the research, as reported in Lockwood et al. (2007), are brought together in Table 6.4. Based on interview responses from their research partners, the authors of this study rated the performance of the regional delivery model in respect of the nine partner regions and related state jurisdictions, and of certain aspects of Australian Government involvement in the model. Ratings were made against each of their eight normative principles for good regional governance. The ratings, together with a summary of associated comments, are compiled in Table 6.5.

112
Table 6.4: Normative principles for good governance under Australia’s regional delivery model, from Lockwood et al. (2007)
Principle Refers to:
Legitimacy (i) the validity of an organisation’s authority to govern that may be (a) conferred by democratic statute; or (b) earned through the acceptance by stakeholders of an organisation’s authority to govern; and
(ii) the integrity and commitment with which this authority is exercised.
Transparency (i) the visibility of decision-making processes;
(ii) the clarity with which the reasoning behind decisions is communicated; and
(iii) the ready availability of relevant information about the governance and performance of an organisation.
Accountability (i) the allocation and acceptance of responsibility for decisions and actions; and
(ii) the demonstration of how those responsibilities have been met.
Inclusiveness … the opportunities available for stakeholders to participate in and influence decision-making processes.
Fairness (i) the respect and attention given to stakeholders’ views;
(ii) consistency and absence of personal bias in decision-making; and
(iii) the consideration given to distribution of costs and benefits of decisions.
Integration (i) the connection between, and coordination across, different levels of government;
(ii) the connection between, and coordination across, organisations at the same level of governance; and
(iii) the alignment of visions and strategic directions across governance organisations.
Capability … the systems, resources, skills, knowledge and experience that enables organisations, and the individuals who direct, manage and work for them, to deliver on their responsibilities.
Adaptability (i) the incorporation of new knowledge and learning into decision-making and implementation;
(ii) anticipation and management of threats, opportunities and associated risks; and
(iii) systematic self-reflection on organisational performance. Source: Lockwood et al. (2007 pp.1-2). Despite their finding that performance by the regional delivery model against three of their eight principles was either ‘weak to moderate’ or ‘moderate to weak’, the authors of this study concluded that ‘the overwhelming view of our interview participants, with which we are in accord, is that the structure of the regional delivery model is generally sound and the model should be allowed time to fulfil its potential. For this to occur, however, significant advances are required in several respects of system and regional level governance’. The present study was concerned with the challenge of pursuing a community-based approach to environmental governance under the regional delivery model. As previously discussed, this has been a substantial challenge especially because (i) the scale of regions defined under this model is much larger than the scale at which community-based processes were expected to operate under previous Australian NRM programs (NLP and NHT1); (ii) requirements for regional bodies to satisfy governmental expectations of upward accountability risk these bodies becoming viewed by their constituents as bureaucracies no more worthy of their voluntary cooperation than governments; and (iii) government pressure on regional bodies to make ‘tough’ strategic choices on how to invest their funds runs the risk of disenfranchising significant numbers of their constituents who may perceive those choices as unfair. As such, the research problem addressed in the present study was more focussed than that of the research by Lockwood et al. (2007), which was concerned with identifying principles for good governance through
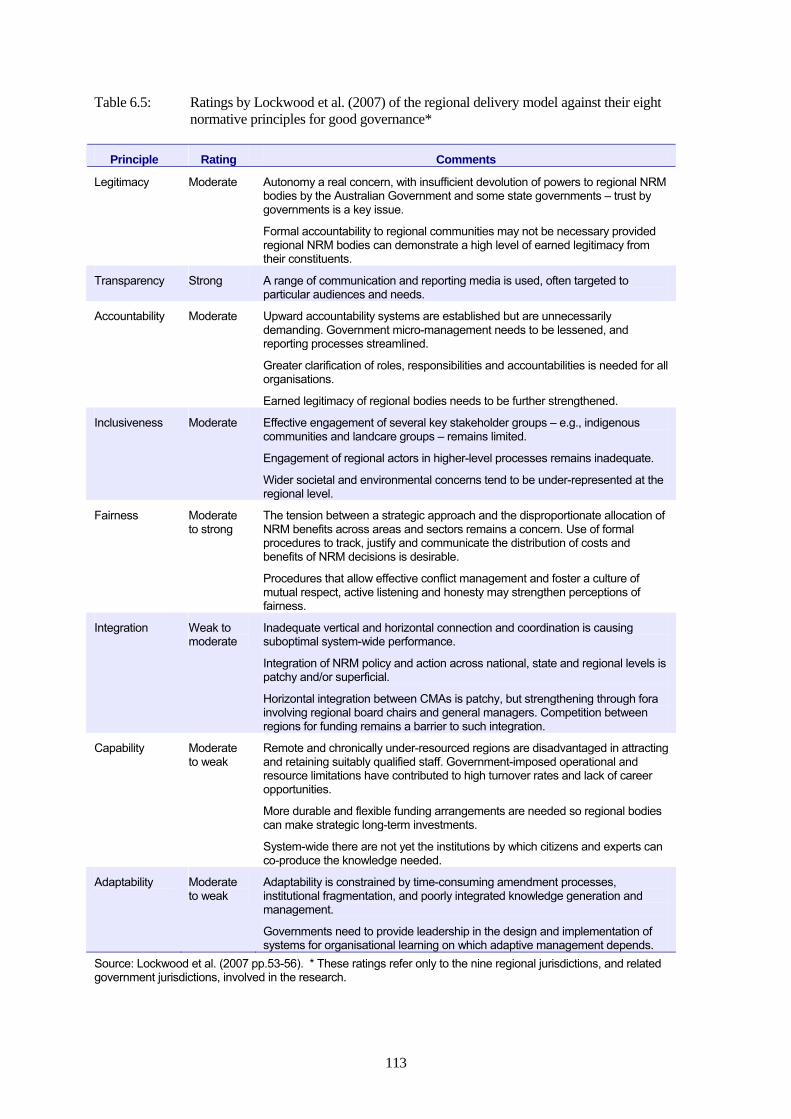
113
Table 6.5: Ratings by Lockwood et al. (2007) of the regional delivery model against their eight normative principles for good governance*
Principle Rating Comments
Legitimacy Moderate Autonomy a real concern, with insufficient devolution of powers to regional NRM bodies by the Australian Government and some state governments – trust by governments is a key issue.
Formal accountability to regional communities may not be necessary provided regional NRM bodies can demonstrate a high level of earned legitimacy from their constituents.
Transparency Strong A range of communication and reporting media is used, often targeted to particular audiences and needs.
Accountability Moderate Upward accountability systems are established but are unnecessarily demanding. Government micro-management needs to be lessened, and reporting processes streamlined.
Greater clarification of roles, responsibilities and accountabilities is needed for all organisations.
Earned legitimacy of regional bodies needs to be further strengthened.
Inclusiveness Moderate Effective engagement of several key stakeholder groups – e.g., indigenous communities and landcare groups – remains limited.
Engagement of regional actors in higher-level processes remains inadequate.
Wider societal and environmental concerns tend to be under-represented at the regional level.
Fairness Moderate to strong
The tension between a strategic approach and the disproportionate allocation of NRM benefits across areas and sectors remains a concern. Use of formal procedures to track, justify and communicate the distribution of costs and benefits of NRM decisions is desirable.
Procedures that allow effective conflict management and foster a culture of mutual respect, active listening and honesty may strengthen perceptions of fairness.
Integration Weak to moderate
Inadequate vertical and horizontal connection and coordination is causing suboptimal system-wide performance.
Integration of NRM policy and action across national, state and regional levels is patchy and/or superficial.
Horizontal integration between CMAs is patchy, but strengthening through fora involving regional board chairs and general managers. Competition between regions for funding remains a barrier to such integration.
Capability Moderate to weak
Remote and chronically under-resourced regions are disadvantaged in attracting and retaining suitably qualified staff. Government-imposed operational and resource limitations have contributed to high turnover rates and lack of career opportunities.
More durable and flexible funding arrangements are needed so regional bodies can make strategic long-term investments.
System-wide there are not yet the institutions by which citizens and experts can co-produce the knowledge needed.
Adaptability Moderate to weak
Adaptability is constrained by time-consuming amendment processes, institutional fragmentation, and poorly integrated knowledge generation and management.
Governments need to provide leadership in the design and implementation of systems for organisational learning on which adaptive management depends.
Source: Lockwood et al. (2007 pp.53-56). * These ratings refer only to the nine regional jurisdictions, and related government jurisdictions, involved in the research.
114
which the entire spectrum of challenges facing the regional delivery model might be addressed. It was also more focussed than the research question addressed by Armitage (2008), which was similarly concerned with multi-level governance but not confined to the specific challenges of succeeding with a community-based approach. Of the three studies reviewed in the previous section, the method and research problem of the present study was closest to that of Ribot (2004) which used case studies of natural resource decentralisation programs as a way of identifying key lessons or recommendations for making such programs truly community-based – i.e., representative of, and downwardly accountable to, local citizens and their self-defined communities. Nevertheless, all the attributes or principles identified by Armitage (2008) and Lockwood et al. (2007) for complex environmental governance in general are clearly relevant to the narrower focus of Ribot and the present research. Now we proceed to consider the contributions of the present research to the set of normative guidelines available to policymakers in successfully applying community-based approaches to governance of large-scale and otherwise complex problems of environmental policy. 6.3 This study’s contributions to guidelines for multi-level environmental governance The search in the present study for principles or guidelines of value to policymakers in realising the benefits of community-based governance approaches for complex environmental problems began in section 1.4 with the theoretical analysis presented there of the potential advantages of nested governance for such problems. Insights from this initial literature review were then supplemented with further lessons drawn from a review of a broader set of literature that (i) distinguishes nested governance, as conceptualised by Ostrom (1990), from the broader genus of multi-level governance of which it is part, and (ii) indicates some key guidelines for applying the ‘nesting principle’ when establishing or reforming multi-level governance systems. Findings from this second-stage literature review were reported in Marshall (2008), but a summary of the key insights and findings is presented in sections 6.3.1 to 6.3.5. Finally, the guidelines identified in the previous step were validated against findings from the empirical research, both qualitative and quantitative, conducted in this study, and refined and elaborated accordingly. As such, the empirical basis for the final set of guidelines is the experience with Australia’s regional delivery model for natural resource management, or at least the experience in the three regions and subregions used as case studies for the empirical research. 6.3.1 Distinguishing nested systems of multi-level governance Although multi-level systems of governance are quite common, most of these are hierarchies designed and directed for the most part from the top down. Such systems are monocentric since most key decisions are made centrally and implemented through a unified command structure that is under centralised control. A nested multi-level system is polycentric, in contrast, since it comprises multiple decision-making centres that retain considerable autonomy from one another (V. Ostrom et al. 1999[1961]). The direction in which nesting occurs in such systems is often from the bottom up rather than from the top down. E. Ostrom (2005 p.269) observed accordingly that ‘among long-enduring self-governed regimes, smaller-scale organizations tend to be nested in ever larger organizations’. Coordination of decisions across a polycentric system relies substantially on collaboration between the multiple centres. Collaboration requires voluntary cooperation, which ‘involves individuals or groups moving in concert in a situation in which no party has the power to command the behaviour of others’ (Wondolleck and Yaffee 2000 p.xiii). Accordingly, nested governance is co-management applied across multiple levels of governance. It is important then to improve our understanding of how the nesting concept might be applied in practice given that: (a) co-management is the most widely discussed institutional arrangement for coping with commons management at more than one level (Berkes 2006); (b) its adoption is growing as states increasingly reach the limits of their authority and come pragmatically to negotiate agreements giving lower-level actors a real voice in decision making (Young 2006); and (c) efforts to establish nested systems remain handicapped by weak development of the relevant theory (Berkes 2002).

115
Young (2002) divided the challenge of succeeding with multi-level environmental governance into two problems. The first is to decide how to assign governance responsibilities across the different levels. The second is to manage the cross-level interactions, or ‘vertical interplay’, arising from any assignment. He proposed that the best strategy for solving these problems lies in assigning responsibilities to the appropriate level of organisation and acting then to ensure that the resulting cross-level interactions yield actions that are complementary rather than conflicting. The focus in this study was primarily on the first step of this strategy. 6.3.2 The principle of subsidiarity The focus on the problem of assigning responsibilities across governance levels has revolved largely around the ‘principle of subsidiarity’. Although various definitions of this principle exist, they generally share in common the implication that any particular responsibility should be decentralised to the lowest level of governance with the capacity to conduct it satisfactorily. The relevance of this principle to community-based governance of larger-scale environmental problems has not gone unnoticed by common property scholars. For instance, McKean (2002 p.8) proposed that the advantages of small groups in achieving voluntary cooperation be extended to large-scale CPR problems by means of ‘nested groups … with subsidiarity’. Moreover, we saw in section 6.2 how Ribot (2004) also identified the subsidiarity principle as central to efforts seeking to decentralise environmental governance functions to community-based systems. Despite endorsement of the subsidiarity principle as a guide for assigning responsibilities across a nested governance system, consensus on its interpretation is typically elusive. Nevertheless, Carozza (2003) observed that the value of the principle lies in stimulating deeper consideration about how, in any context, s should be allocated vertically within a multi-level system. As it challenges presumptions that all governance responsibilities should be centralised, it also highlights how decentralisation of all responsibilities to local levels is usually too simplistic. Even so, we are not without guideposts in applying the subsidiarity principle to design nested systems of community-based environmental management. There is much to learn from previous experience in this direction. Some key lessons to date are considered below. 6.3.3 The question of capacity 6.3.3.1 Appraising capacity How do we identify, as required in applying the principle of subsidiarity, the lowest possible level of governance with the capacity to conduct a given responsibility satisfactorily. McKean (2002 p.10) proposed the following guideline for deciding how low ‘possible’ is: an individual subunit of the governance system is free to undertake all the responsibilities that do not affect anyone in another subunit, ‘but we move up a notch to a higher level if a subunit wants to engage in behaviour that will affect any other subunit’. This guideline is consistent with Ribot’s (2004 p.23) proviso when identifying the lowest possible level ‘that making the decision at this level does not cause negative effects at higher social or political-administrative scales’. It follows that the subsidiarity principle requires any responsibility to be centralised to higher, more inclusive, levels until a level is reached where all individuals with a substantive interest in the responsibility are represented adequately (Reeve et al. 2002). Nevertheless, this guideline fails to account for all relevant aspects of capacity. Aside from whether an organisational subunit can discharge a without conferring spillovers on other subunits, its capacity to perform a responsibility effectively will normally depend also on additional factors. A subunit may be able to fulfil a particular responsibility without generating spillovers, yet may be at a disadvantage compared with a higher-level subunit in accessing all the physical, financial, human and social capacities needed to discharge that responsibility effectively. When this is the case, it is reasonable to interpret the subsidiarity principle as justifying centralisation of that responsibility further than the level needed to represent all individuals with an interest in the responsibility − but only to the minimum extent necessary to ensure that it is conducted to the required standard. For instance, governments can have advantages over local community-based groups in responsibilities like: establishing a legal framework which allows local groups

116
to gain legally-enforceable acknowledgement of their identity and rights; and supplying formal conflict-resolution mechanisms when groups resolving their own conflicts would be too divisive. For attempts to extend community-based governance to larger geographic scales through a process of nesting, the subsidiarity principle is particularly relevant to the responsibility of deciding how nesting of subunits at progressively higher levels should occur. As observed by V. Ostrom et al. (1999[1961]), it is a common mistake of policymakers to underestimate the capacities of subunits at any level to self-organise governance arrangements for which they are currently ‘too small’. It can sometimes be possible for subunits to deal with higher-level (i.e., spatially broader) problems by reconstituting themselves to represent all key interests at that higher level. Otherwise, they may be capable of closing mismatches of this kind by cooperating voluntarily with one or more other units operating at a similar level, perhaps agreeing to federate to address such problems. Even if the former two possibilities are beyond their capacities, they might still play key roles by participating in deliberations on the design of higher-level governance arrangements – particularly to ensure that the new arrangements add value to the self-organising capacities that do already exist. Denial of opportunities for such participation runs the risk of disenfranchising the lower-level subunits, leading them to cooperate less voluntarily with higher-level decisions than would otherwise be the case. 6.3.3.2 Building capacity Where there is potential for a subunit at any level to overcome an existing capacity shortfall, the subsidiarity principle implies an obligation on higher-level enterprises, including governments, to help realise that potential. However, often there is reluctance to decentralise tasks to lower-level subunits before their capacity has been proven, even though it is impossible to establish such proof until decentralisation has occurred. One solution to this problem is to begin by decentralising simpler tasks for which lower-level capacity is clearly evident and/or the costs of failure would not be severe. This strategy has been followed since 1979 in the Gal Oya district of Sri Lanka to revive an abandoned irrigation system that was the largest in the country and reputedly the most run-down. McKean (2002 p.17) reviewed the outcome as follows:
Each small success improved the confidence level of the farmers and led to a larger success. In this way the project and the farmers struggled, from the bottom up, to create social capital where there was none. … [The] project achieved a remarkable turnaround in the functioning of the system and agricultural production, in farmer confidence in tacking all sorts of other problems, and eventually in the government’s new-found respect for these farmers.
Nevertheless, attempts to emulate the success of such capacity-building efforts overlook frequently what is probably the most fundamental reason for success: the successful efforts are demand-led. Individuals participate in capacity-building activities only to the extent that they expect participation to further their goals. For people to perceive that participation in capacity-building activities will further their goals, they must have secure rights to reap benefits from exercising the capacities developed. In many environmental projects, like those concerned with biodiversity, these favourable conditions are unlikely to exist at the outset. Moreover, often the resources to be conserved are not already valued highly by those whose participation is sought. 6.3.4 Barriers and bridges to nested governance 6.3.4.1 Barriers Cases where lucrative management rights, in terms of either their commercial value or their value for protecting vested interests (including the power and status of senior government officials), are decentralised to local communities are more the exception than the rule. Governments usually retain such rights for themselves, transferring only those rights they least value. Meanwhile, fiscal crises are driving governments to decentralise the least tractable problems. In the few cases where valuable rights are transferred, moreover, central governments often attach conditions to these transfers such that local authorities are left little discretion in how to exercise their new rights.

117
Most governments are better at talking about decentralisation than doing it. One aspect of this problem derives from higher-level organisations generally, and central governments in particular, tending to overestimate the pace at which lower-level subunits early in their life cycle can build their capacities to perform demanding tasks. Uphoff et al. (1998 p.33) observed that this mistake arises usually from ‘a linear way of thinking about schedules, expecting to accomplish equal amounts of work during each time period, rather than having a logistic (S-shaped) curve in mind’. The logistic perspective allows decentralisation to proceed gradually, allowing lower-level capacities to accumulate incrementally until capacity reaches the critical mass at which the pace of decentralisation can be accelerated. The more fundamental part of the problem, however, is usually opposition to effective decentralisation from parties with vested interests in preserving the existing order. Governments and other actors that ordinarily have benefited from centralised regimes of governance are reluctant often to relinquish or share them. Central governments are often especially wary of catalysing ‘people power’ through effective decentralisation. Lack of government commitment to effective decentralisation is partly the result of rent-seeking by those politicians, officials and others benefiting from the existing order through power, salary, access to political influence, and so on. The ability of such parties to impede effective decentralisation results not only from any formal authority allocated to them (e.g., through legislation) but also from any de facto powers they can use to their advantage. The most obvious of such de facto powers are those of ‘fiscal dominance’ that derive from central governments typically controlling much of the material resources available to the public sector. Nevertheless, Young (2006 p.5) observed that de facto powers can derive just as much from ‘cognitive hegemony’, which is ‘the ability to control the discourses embedded in environmental or resource regimes …’. Supporters of maintaining centralised governance regimes are perhaps no different from anyone else in seeking to exercise cognitive hegemony given that ‘those steeped in the cognitive processes and decision-making practices associated with each level typically regard their way of doing things as preferable to others, and push more or less aggressively for changes that would move the whole, multi-level system toward their own mode of operation’ (ibid. p.13). Even so, supporters of the existing order are advantaged in preserving dominance of their favoured discourses, since when a pattern of behaviour takes hold ‘stakeholders become attached to the way things are done, existing social practices become routines, and the status quo turns into the default option’ (ibid. p.13). Such is the nature of cognitive hegemony that most people subjected to it come to accept as common sense the presumptions of the discourse it supports. Accordingly, the reluctance of central governments to decentralise key natural resource management responsibilities more than nominally often reflects genuine, but often misguided, concerns about maintaining performance and political stability. Berger and Neuhaus (1996:148) referred to this as a problem of ‘sluggish mindsets’. Particularly relevant for the present discussion is the lingering perception by many policy makers that the multiplicity of organisational subunits in polycentric systems of governance – including subsidiarity-guided nested systems - is necessarily inefficient. The typical judgements of policy makers that V. Ostrom et al. (1999[1961]) recorded almost half a century ago – i.e., that polycentric systems entail ‘duplication of functions’ and ‘too many governments and not enough government’ – remain influential today. 6.3.4.2 Bridges The barriers presented by vested interests and sluggish mindsets to effective decentralisation can often be bridged. Uphoff et al. (1998 p.177) found that enduring success here depends on ‘maintaining a strategic long-term view and commitment, grounded on solid support from rural populations, and balanced by short-term tactical moves that build up goodwill and blunt attacks …’. Demonstrating good performance can be a particularly powerful way of turning opposition into support, even if only of a grudging kind. Alternatively, opposition might be avoided by ‘flying below the radar’ until enough capacity evolves to withstand or outmanoeuvre it. Another common way to win over higher-level support for effective decentralisation involves forming alliances. Such alliances can allow the bottom to co-opt the top.

118
Patience is needed most in challenging the cognitive hegemony exercised by those who support central governments retaining key governance responsibilities. The difficulty of arriving at a governance system with wide legitimacy, by finding an accommodation between the perspectives of all actors whose cooperation is required for the system to succeed, has been labelled the challenge of plurality (Cash et al. 2006). Berkes (2006) identified this challenge as the most pervasive scale-related obstacle to success with community-based environmental governance and proposed that its solution lies in deliberative discourse. Such discourse relies on ‘establishing conditions of free public reasoning among equals who are governed by the decisions’ (Cohen 1998 p.186). The problem with deliberative discourse as a solution is that it depends on those advantaged by the existing order, including government agencies, refraining from exercising their advantage when they enter deliberation. Yet this problem is sometimes overcome through committed leadership within the ranks of government agencies, as documented by Koontz et al. (2004) in the case of community-based watershed management by the Animas River Stakeholder Group (Colorado, USA), and by Marshall (2002, 2004b, 2005) in the case of industry-based salinity management in Australia’s Murray-Darling Basin. Otherwise, its solution often lies in preparing strategically for what Young (2006 p.14) called ‘those rare and ordinarily brief periods in which opportunities arise to introduce more fundamental changes in existing institutional orders’. 6.3.5 Preliminary guidelines for community-based governance of complex environmental problems The preliminary guidelines derived from the foregoing discussion were reported previously in Marshall (2008). Table 6.6 presents those guidelines in a revised format. Table 6.6: Preliminary guidelines for community-based governance of complex environmental
problems, as proposed by Marshall (2008)
Guideline Elaboration
Subsidiarity Each governance responsibility should be undertaken at the lowest level of a multi-level system with capacity to conduct it effectively. This guideline should not be interpreted solely from the top-down, but rather through deliberation among all affected parties.
Representation The capacity at a given level to conduct a responsibility effectively depends partly on whether all parties substantively affected by the responsibility are represented at that level.
Competence The capacity at a given level to conduct a responsibility effectively depends also on whether there is sufficient access at that level to the requisite physical, financial, human (including motivation and morale) and social (including leadership) capacities.
Build lower-level capacities
The capacity at a given level to discharge a responsibility effectively can often be enhanced by strengthening access to the requisite capacities. Subsidiarity obliges decision-makers at one level to exhaust all reasonable opportunities before ruling out a lower level undertaking that responsibility. Meanwhile, it cautions against over-optimistic expectations of how quickly lower-level capacities can be developed.
Secure lower-level rights
Efforts to build capacity at lower levels are unlikely to succeed unless the target population has secure rights to benefit from the capacities developed.
Respect lower-level autonomy
Units assigned responsibilities in accordance with the subsidiarity principle should be allowed substantive autonomy in how they decide to pursue those responsibilities.
Counter resistance Higher-level units often resist application of the subsidiarity principle as decided deliberatively between the relevant levels. Such resistance can often be countered through leadership (including by individuals at higher levels), patient strategic moves, demonstrating good performance, preparing for ‘windows of opportunity’, and establishing horizontal and vertical alliances.
Source: Marshall (2008 p.93). 6.3.6 Validating and revising the preliminary guidelines The guidelines presented in Table 6.6 are well supported by literatures on decentralised and community-based approaches to environmental governance, as well as by related literatures focussed on rural
119
development. Nevertheless, how consistent are they with the qualitative and quantitative evidence collected in the present research concerning Australia’s regional delivery model? As discussed in Chapter 5, four main themes were identified from the qualitative research undertaken in this project that explored stakeholders’ perceptions of the regional delivery model as an exercise in community-based natural resource governance, their assessments of its weaknesses in this respect, and their views on how these weaknesses might be ameliorated. These four themes are listed below: 1. Don’t do what a lower-level group can do for itself. 2. Appraise lower-level capacities, and recruit with respect. 3. Invest in strengthening lower-level capacities. 4. Establish and maintain vertical trust. The first of the themes – ‘don’t do what a lower-level group can do for itself’ – is essentially equivalent to the ‘subsidiarity’ guideline included in Table 6.6. Moreover, the results of the quantitative analysis presented in Chapter 7 offer tentative support for the proposition that devolution of responsibilities to a level closer to individual landholders makes it more likely landholders will cooperate voluntarily with efforts to discharge those responsibilities – at least to the extent that they trust the responsible unit to act in their interests. It seems landholders may be more likely to adopt the reciprocity strategies underpinning voluntary cooperation the closer the interaction they have with the responsible unit, and thus the greater the opportunity they have to observe – at least where this is true – that the unit is serious about fostering their self-reliance. This opportunity is important in so far as landholders’ long experience with paternalistic governance would seem to have left a legacy where significant numbers remain accustomed to following non-cooperative strategies of free-riding and opposition in their dealings with higher authorities. Overall, therefore, the empirical evidence was assessed as corroborating the relevance of ‘subsidiarity’ as a guideline for successful community-based governance under the regional delivery model. The second of the themes – ‘appraise lower-level capacities, and recruit with respect’ – has much in common with the ‘competence’ guideline included in Table 6.6. However, the guideline lacks the emphasis of the theme on utilising lower-level capacities with respect – by not exploiting them or otherwise taking them for granted. Rather than revising the ‘competence’ guideline to accommodate this aspect of the theme, a tidier solution is to accommodate this theme within a revised ‘build capacities wherever possible’ guideline. This is considered below. The third of the themes from the qualitative research – ‘invest in strengthening lower-level capacities’ – corroborates the ‘build lower-level capacities’ guideline listed in Table 6.6. Nevertheless, there is value in generalising this guideline to accommodate the emphasis of the second theme on recruiting lower-level capacities with respect, given that lack of such respect risks (e.g., by reducing morale and encouraging volunteers to channel their energies elsewhere, and by causing antagonism and mistrust) undoing any benefits achieved from capacity-building efforts. The fourth and final theme from the qualitative research – ‘establish and maintain vertical trust’ – has no obvious counterpart in the guidelines compiled in Table 6.6. This is due to the theme being stated with a greater degree of generality than was the case for the individual guidelines. It is evident from the discussions in sections 6.3.2 to 6.3.4, from which the guidelines were distilled, that the theme of vertical trust is indeed a common thread linking each of the guidelines. In addition, an officer from the Fitzroy Basin Association commented on the preliminary guidelines in the final consultation round for this research that:
… the thing that makes it all happen effectively is trust and respect. And possibly that’s where government falls down because of that ongoing mistrust. Organisation to organisation, there is often not a lot of respect. With individual people within government, yes, but not with others. … A lot of these

120
papers coming out of government, they don’t display that trust and respect we thought we had built up over the years. … To be able to recognise what respect and trust between organisations means, what it means for how you communicate, and what you communicate, is incredibly important to an ongoing relationship. And I don’t think that is there in your principles.
Moreover, the results of the quantitative analysis reported in Chapter 7 demonstrated that farmers’ vertical trust in the regional delivery model (as functioning in the three case-study regions) – and particularly in their subregional and regional bodies – was among factors most likely to be associated with their future plans to adopt conservation practices promoted under that model. Given the evident central importance of vertical trust, there is value in reflecting this importance by including an overarching guideline designed to inform interpretation of the other guidelines, and capable also of providing guidance on issues that might be important for successful community-based governance in specific contexts but nonetheless risk ‘falling between the cracks’ of the other guidelines. Indeed, a number of key attributes of ‘good environmental governance’ as identified in other studies are particularly relevant to the challenge of establishing vertical trust. Such attributes include transparency, accountability and inclusiveness, as identified by Lockwood et al. (2007), and deliberativeness as identified by Armitage (2008). Highlighting the link between vertical trust and these attributes would be useful in a revised set of guidelines. The guideline ‘representation’ was implicit to many of the discussions analysed for the qualitative research. The lack of explicit focus on the need to ensure adequate representation of stakeholders is explained in large part by this need having become taken for granted. Given the clear importance of this issue, as well as the emphasis placed on it in the literature, retaining the guideline ‘representation’ was judged to be justified. Discussions surrounding the theme ‘establish and maintain vertical trust’ referred explicitly to the issues addressed by the guidelines ‘secure lower-level rights’, ‘respect lower-level autonomy’ and ‘counter resistance’. Moreover, each of these guidelines has counterparts in the principles and recommendations of Ribot (2004) as presented in Tables 6.2 and 6.3. The guideline ‘secure lower-level rights’ is essentially equivalent to Ribot’s principle ‘ensure security’. The guideline ‘respect lower-level autonomy’ corresponds closely with Ribot’s principle ‘create discretion’. Finally, the guideline ‘counter resistance’ has much in common with Ribot’s recommendations ‘counter resistance’ and ‘seize opportunities’. On this basis, retaining the guidelines ‘secure lower-level rights’, ‘respect lower-level autonomy’ and ‘counter resistance’ was considered justified. The final set of guidelines for community-based governance under the regional delivery model for natural resource management, as revised in accordance with the foregoing comments, is presented in Table 6.7. 6.4 Closing remarks The revised guidelines presented in Table 6.7 are not offered as necessary conditions for success with community-based governance under the regional delivery model for natural resource management. Rather, they are presented in the spirit of both: (i) Young’s (2002) call for an ‘institutional diagnostics’ approach to addressing environmental issues
which recognised that all issues (e.g., faced across different regions under the regional delivery model) are unique to some extent and consequently that caution is warranted in applying a single set of guidelines for institutional design to all issues on a one-size-fits-all basis; and
(ii) Ostrom’s (2005) argument that principles or guidelines for institutional design derived
systematically from research will often be superior to ad hoc hunches as starting points when searching for solutions to complex problems of institutional design. Following this argument, the guidelines presented in Table 6.7 can be translated into a series of initial questions to be asked when diagnosing how the existing governance system for any region might be reformed to increase its performance as a community-based system. For instance, the ‘establish vertical trust’

121
Table 6.7: Guidelines for community-based governance under the regional delivery model for natural resource management
Guideline Elaboration
Establish vertical trust
Fulfil responsibilities at any level in ways that establish trust from units at other levels. Various attributes of ‘good governance’ are relevant here, including: transparency, accountability (upward and downward), inclusiveness, fairness, and deliberativeness. Procedures for establishing such attributes should be decided deliberatively between the relevant levels, not imposed from the top down.
Subsidiarity Each governance responsibility should be undertaken at the lowest level of a multi-level system with capacity to conduct it effectively. This guideline should not be interpreted solely from the top-down, but rather through deliberation between the relevant levels.
Representation The capacity at a given level to conduct a responsibility effectively depends partly on whether all parties substantively affected by the responsibility are represented at that level.
Competence The capacity at a given level to conduct a responsibility effectively depends also on whether there is sufficient access at that level to the requisite physical, financial, human and social capacities.
Build and maintain lower-level capacities
The capacity at a given level to discharge a responsibility effectively can often be enhanced by strengthening access to the requisite capacities. Subsidiarity obliges decision-makers at one level to exhaust all reasonable opportunities before ruling out decentralising a responsibility to a lower level. Meanwhile, it urges due caution in ensuring decisions do not weaken lower-level capacities (e.g., over-stretching or under-utilising capacities, encouraging dependency, triggering conflict, causing demoralisation, etc.).
Secure lower-level rights
Efforts to build capacity at lower levels are unlikely to succeed unless the target population has secure rights to benefit from the capacities developed.
Respect lower-level autonomy
Units assigned responsibilities in accordance with the subsidiarity principle should be allowed substantive autonomy in how they decide to pursue those responsibilities.
Counter resistance Higher-level units often resist application of the subsidiarity principle as decided deliberatively between the relevant levels. Such resistance can often be countered through leadership (including by individuals at higher levels), patient strategic moves, demonstrating good performance, preparing for ‘windows of opportunity’, and establishing horizontal and vertical alliances.
guideline might be translated into the following question: ‘How might we fulfil responsibility ‘X’ at our level so we establish greater trust from the levels above and below us?’. Beyond recommending that the guidelines be translated into initial questions, relevant to the specific circumstances at hand, as a start in searching for ways to improve the regional delivery model as an exercise in community-based environmental management, it is inappropriate to be more prescriptive. This position is admittedly inconsistent with one of the original objectives of the present research, which was to develop a user-friendly manual advising policymakers and practitioners how the guidelines (referred to originally as design principles) might be translated to specific settings. However, the author’s views on the worth of this objective have changed considerably since the research was originally planned, particularly as a consequence of exposure to the critiques of the design principles approach that were surveyed in section 6.1. Young’s (2002 p.176) compelling justification for an institutional diagnostics approach, for instance, presents the approach as a procedure where ‘problems are considered on a case-by-case basis and prescriptions and recommendations are developed to take into account particular combinations of conditions’. Given the multidimensional contingencies involved in such an approach, it would be irresponsible to offer policymakers and practitioners a manual of one-size-fits-all recipes promising to help them apply the guidelines to their own specific circumstances. Finally, the guidelines arising from the present research should be regarded as complementary to other sets of guidelines, principles and attributes proposed by other studies for design of institutional arrangements for environmental governance, rather than as a substitute for them. Aside from researchers bringing unique perspectives to bear due to their different disciplinary backgrounds and professional experiences, the

122
subject matter from which they have identified their different sets of guidelines also differs markedly. For instance, the Lockwood et al. (2007) study shared with the present study a concern with identifying guidelines for effective environmental governance under the regional delivery model. Nevertheless, the focus of the former study was on the full array of challenges faced by this governance, whereas the focus of the present study was on a subset of these challenges, viz. concerned with pursuing a community-based approach in this governance. It should not be surprising, therefore, that the resulting two sets of guidelines differ. Nor should it be surprising, as highlighted in the previous section, that there is substantial overlap between the two sets.
123
7. Conclusions, Implications, and Recommendations In this final chapter, policy implications of the research findings are considered, and two key recommendations are made. First, however, an overview of the research and its conclusions is presented as context for the subsequent discussion. 7.1 Overview of the research and its conclusions 7.1.1 Research problem The research presented in this report was concerned with the problem of succeeding with a community-based approach to governance under Australia’s regional delivery model for natural resource management (NRM). The nature of this research problem was examined in Chapter 1. The potential value of a community-based approach in promoting voluntary cooperation among farmers in implementing the on-ground changes needed to address problems of natural resource degradation was highlighted, together with the challenges of pursuing such an approach. These challenges included the large scale of the regions over which community-based processes were expected to extend, and the pressures on regional bodies to assume responsibilities that risked them becoming perceived by their constituents as extensions of government and as favouring the interests of some areas and sectors over others. The ‘nesting concept’ was identified as a possible way of responding to such challenges. This response involves structuring programs concerned with larger-scale NRM problems as nested multi-level systems of community-based governance. Nested governance systems of this kind differ from conventional multi-level systems which tend to be designed from the top down. In contrast, a nested multi-level system arises predominantly from a bottom-up process in which lower-level units are active participants in the design and operation of higher levels of the system. Such a bottom-up process offers the possibility of making manageable the problems of establishing trust, reciprocity and voluntary cooperation from large and diverse populations that otherwise would likely remain insurmountable. It offers this possibility to the extent that smaller, lower-level, units (e.g., subregional groups) become nested inside of larger, higher-level, units (e.g., regional bodies), in comparison to becoming absorbed or sidelined as tends to be the case when design of multi-level systems is imposed from the top down. This is not to deny important roles for governments in resourcing and facilitating the bottom-up process of institutional development, and in defining parameters for the process so that it might integrate effectively with governmental programs. The possibility of nesting helping to solve problems of motivating voluntary cooperation in large-scale complex settings derives from the reasonable prospect that units at each level of a nested multi-level system remain trusted by their respective constituents (despite their integration into a larger system), and thereby maintain a capacity to mediate the trust and reciprocity needed for voluntary cooperation both upwards and downwards into the wider system. In this way, the possibility exists for farmers, at the ‘bottom’ of the system, to develop sufficient trust in the whole system to justify cooperating voluntarily on the basis of reciprocity – at least with the level of the system closest ‘above’ them. That is, farmers may cooperate to the extent that (a) they trust the unit closest above them, (b) this closest unit trusts the wider system to reciprocate any cooperation its farmer constituents offer, and (c) this closest unit assures its farmer constituents of its trust in the wider system’s reciprocity. 7.1.2 Method A pluralistic case-study methodology, involving complementary application of qualitative techniques (data from workshops and semi-structured interviews) and quantitative techniques (data from mail-out farmer surveys analysed by multiple regression) was applied to explore the applicability of the foregoing reasoning to the circumstances faced by farmers under the regional delivery model. The qualitative research elicited stakeholders’ perceptions of the regional delivery model as an exercise in community-based NRM, their assessments of its strengths and weaknesses in this respect, and their views on how the weaknesses might be ameliorated (including through nesting). The quantitative research was concerned primarily with

124
identifying whether farmers’ trust in the regional delivery model was in fact associated with their plans to cooperate with that model by adopting the kinds of conservation practices promoted to them under the model, and identify the significance of the regional and subregional (where such exists) levels of the model in respect of any associations of this kind found to exist. Three case studies were chosen for the purpose of data triangulation; i.e., to allow identification of patterns across cases that provide some basis for framing conclusions that may apply more generally to the wider population of cases under the regional delivery model. The three regions used as case studies in the present project were the South West Catchments Region in Western Australia, the Fitzroy Basin Region in Queensland, and the Mallee Region in Victoria. While regional bodies in Western Australia and Queensland are constituted on a non-statutory basis, in Victoria they are statutory authorities. Given the research interest in nested community-based governance, the focus in two of the case-study regions was on parts of those regions where subregional arrangements were in place to which key elements of the regional delivery model had been devolved closer to the geographic level where farmers might be expected to feel some tangible sense of community. The first of these regions was the South West Catchments Region, where the subregional focus was on the Blackwood Basin for which the South West Catchments Council (SWCC) had devolved various NRM governance responsibilities to the Blackwood Basin Group (BBG). The second of these regions was the Fitzroy Basin Region, where the subregional focus was on the Central Highlands for which the Fitzroy Basin Association (FBA) has devolved various NRM governance responsibilities to the Central Highlands Regional Resources Use Planning Cooperative (CHRRUP). The third case-study region, Victoria’s Mallee NRM Region, offered an additional contrast to the other two (i.e., aside from the status of its regional body, the Mallee Catchment Management Authority, as a statutory authority) since it had decided against establishing subregional arrangements with similar stature as in the other two cases. To maintain reasonable comparability across the three cases, our focus in the Mallee Region was on dryland farming districts of that region, since agricultural activity in the other two subregions is predominantly dryland-based. 7.1.3 Qualitative conclusions From the qualitative research, four main themes concerning how the regional delivery model might be made more community-based were identified as common across the three cases. The first was: Don’t do what a lower-level group can do for itself. The second was: Appraise lower-level capacities, and recruit with respect. The third was: Invest in strengthening lower-level capacities. The fourth and last was: Establish and maintain vertical trust. This last theme covered an array of sub-themes concerned with inherited mistrust of authority, as well as accountability, autonomy, nesting, and countering obstacles to building and maintaining vertical trust. The qualitative research also identified an array of issues associated with farmers’ vertical trust in the regional delivery model, which were listed in Table 4.44. This list of issues was the basis for developing questionnaire items for the mail-out survey from which variables concerning farmers’ trust in the regional delivery model were constructed for the subsequent stage of quantitative analysis. 7.1.4 Quantitative conclusions The quantitative stage of research involved multiple regression analyses designed to identify variables associated statistically with farmer respondents’ plans to change their adoption levels of various conservation practices over the ensuing decade. The conservation practices for which analyses were undertaken were those being promoted to respondents under the regional delivery model as configured for their respective subregions. Many of the types of variables conventionally hypothesised in farmer adoption studies to be associated with adoption of innovations generally, and conservation practices particularly, were included in the regression models. In addition, five variables were included to: (a) enable statistical testing of whether farmers’ vertical trust in the regional delivery model was
indeed associated, as suggested by the theory reviewed, with their adoption plans in respect of conservation practices promoted under the regional delivery model;

125
(b) assess whether farmers’ vertical trust in the regional delivery model was more, or less, likely to be associated with their adoption plans compared with other variables commonly hypothesised to be associated with such plans;
(c) assess whether farmers’ adoption plans were more, or less, sensitive to changes in their trust in the
regional delivery model relative to changes in other variables commonly hypothesised to be associated with such plans; and
(d) assess whether farmers’ vertical trust in the regional delivery model was more likely to be
associated with their adoption plans for ‘green’ conservation practices (i.e., associated with biodiversity conservation) than for ‘brown’ conservation practices (i.e., associated with sustaining the natural resource base for agricultural production).
These five ‘farmers’ vertical trust’ variables were: (i) trust in subregional body; (ii) trust in regional body; (iii) trust in government commitment to community empowerment; (iv) trust in government integrity; and (v) trust in regional/subregional autonomy. The first of these was not included in regression models for the Mallee dryland case since that case lacked a subregional body devolved a similar degree of responsibilities as in the other two cases. Findings in respect of assessments (a) to (d) are now briefly reviewed. In respect of (a), the quantitative analyses did indicate that farmers’ vertical trust in the regional delivery model was associated with their adoption plans for most of the conservation practices promoted to them under that model. In respect of (b), the quantitative analysis indicated, at least in the Blackwood Basin case and Central Highlands case for which a subregional body existed, that trust in subregional body was the element of farmers’ trust in the regional delivery model most likely to be associated with their adoption plans. Trust in regional body was the element of this trust second most likely to be associated with farmers’ adoption plans. Of all 17 variables included in the models, the quantitative analysis indicated that trust in subregional body, where relevant, was second most likely to be associated with farmers’ adoption plans. Trust in regional body was found to be the variable sixth most likely to be associated with these plans. An interesting pattern emerging from the quantitative analysis was that in the two cases with subregional bodies, coefficient signs for trust in subregional body and trust in regional body indicated that farmers were, when such trust was associated with their adoption plans, predominantly following reciprocity strategies in respect of their subregional body, and free-rider strategies in respect of their regional body. This pattern indicates that subregional bodies in these two cases, by virtue of working more directly with farmers than the respective regional bodies, have been more successful than regional bodies in turning around the dynamics of free-riding (dependency) and opposition that earlier paternalistic approaches to natural resources governance tended to entrench. This is considered less likely to reflect deficiencies in the community engagement efforts of the regional bodies in these two cases than the fact that these regional bodies have substantially devolved to subregional bodies the responsibility for community engagement through which a new dynamic with farmers might be forged. In the Mallee dryland case which lacked a subregional body, in contrast, the coefficient sign for trust in regional body indicated that farmers were, in the one instance when trust was found to be associated with their adoption plans, predominantly following reciprocity strategies in respect of their regional body. This suggests that the regional body in this case (the Mallee Catchment Management Authority (CMA)) has been more successful than the regional bodies in the other two cases in turning around inherited dynamics of farmer free-riding (dependency) and opposition. This is consistent with the earlier comments, in so far as the Mallee CMA has not, as in the other two cases, substantially devolved the responsibility for community engagement to a subregional body. Accordingly, it has been in a better position to forge a reciprocity dynamic with farmers than has been true of the other two regional bodies. Overall, however, the subregional bodies in the other two cases appear to have been more successful than the Mallee CMA in forging such a dynamic with farmers, at least in terms of the proportion of conservation practices for which such a dynamic appears to have been established. This is consistent with, but only tentatively corroborates

126
(given the limitations of establishing a pattern with three cases), the reasoning above suggesting we should expect a lower (e.g., subregional) level of a multi-level governance system to be more successful, compared with a higher (e.g., regional) level, at motivating voluntary cooperation from farmers on the basis of trust and reciprocity. Concerning (c), the quantitative analysis indicated that farmers’ adoption plans were more sensitive to changes in trust in subregional body than to most other variables found to be associated with such plans – at least in the two cases where this variable was relevant. Hence, it appears that trust in subregional body was not only more likely than most other variables to be associated with farmers’ adoption plans in these cases but also, when association exists, to be relatively strongly associated with those plans (i.e., such that a relatively small proportionate change in this trust is associated with a relatively large proportionate change in these plans). In respect of (d), the quantitative analysis did indicate that farmers’ vertical trust in the regional delivery model was more likely to be associated with their adoption plans for ‘green’ conservation practices than for ‘brown’ conservation practices. This suggests that establishing such trust may be more important for efforts to promote farmers’ adoption of green conservation practices than it is for efforts to promote adoption of brown practices. This is consistent with claims that the introduction of government regulations restricting farmers’ rights to clear native vegetation has led many farmers to distrust anything with the ‘whiff of a green agenda’. However, it seems that regional bodies, and subregional bodies where they exist, will be advantaged compared with governments in reversing this distrust only to the extent that they do not become perceived as extensions of government or ‘under their thumb’. Overall, the research findings suggest that community-based approaches are capable of succeeding under the regional delivery model in motivating greater voluntary cooperation from farmers than would be possible without such approaches. However, they also highlight that success of this kind cannot be taken for granted. In particular, the findings highlight the importance of farmers coming to adopt reciprocity strategies in respect of their key relationships under the regional delivery model. It seems that subregional bodies have an advantage over regional bodies in eliciting such strategic behaviour from farmers because the former are better positioned to engage them effectively. This indicates the value of a nested multi-level approach to community-based NRM within regions, at least where capacities below the regional level are sufficient to justify devolution of significant responsibilities to subregional or other levels in accordance with the principle of subsidiarity. Nevertheless, leading farmers to follow reciprocity strategies with higher levels of authority is no easy matter given that paternalistic governance of generations of farmers has tended in many settings to entrench free-riding or opposition strategies as an ongoing norm. Only when farmers come to trust that governance structures are prepared to reciprocate their cooperation – by valuing their input, rather than dismissing it, taking it for granted or using it against them – can they be expected to progress from free-riding and opposition to adoption of reciprocity strategies. These findings were based on patterns observed over a sample comprising three of the 56 NRM regions defined under the regional delivery model. There is a need for further case-study research to be undertaken across a broader sample of regions to determine the degree to which it is valid to generalise these findings across the full population of regions. 7.1.5 Guidelines for community-based governance under the regional delivery model for natural resource management The qualitative and quantitative findings complemented one another in highlighting the challenges of successfully pursuing a community-based approach under the regional delivery model, and in identifying guidelines for how such challenges might fruitfully be addressed. A final set of eight guidelines were identified as follows: (1) establish vertical trust; (2) subsidiarity; (3) representation; (4) competence; (5) build and maintain lower-level capacities; (6) secure lower-level rights; (7) respect lower-level autonomy; and (8) counter resistance. Each of these guidelines was elaborated in Table 6.7.
127
These guidelines were not presented as necessary conditions for success with community-based approach under the regional delivery model, but rather as starting points for a process of ‘institutional diagnosis’ seeking to identify and remedy the key issues in any specific setting that are limiting the effectiveness of such an approach in motivating voluntary cooperation from farmers and other constituents. 7.2 Policy implications 7.2.1 Getting to ‘good science’ in designing community-based processes The findings of the research, as distilled in the eight guidelines for community-based governance presented in Table 6.7, demonstrate the complexity of realising the benefits of such governance under Australia’s regional delivery model. Regional NRM bodies are expected, compared with governments, to establish markedly greater voluntary cooperation from their constituents in solving natural resource degradation problems. The key to their advantage over governments in this respect is held, by national and state governments at least, to be ‘the community ownership principle’ (Natural Resource Management Ministerial Council 2006 p.5). Beyond promoting this principle, however, governments are yet to present rigorous reasoning or empirical evidence offering confidence that pursuit of this principle is plausible given the scale over which regional bodies are expected to forge some sense of community ownership (and the vertical trust and reciprocity this implies), the potentially divisive decisions they are expected to make, and governmental pressures on them to operate more bureaucratically. An officer in the Victorian Government involved in administration of the regional delivery model in that state remarked along these lines that: ‘Too often we develop policy on the basis of a bit of noise and assumptions, without doing the work to collect the information that should inform policy. Too often we respond to noise. … Sometimes it’s the loudest voice that ends up being the strongest message’. This would seem a notable weakness in a model that was introduced in the name of ‘good science’. A key part of the problem here would appear to be the continuing pervasive influence of ideas that many policymakers, and indeed citizens, have come to regard as conventional wisdom and thus in little need of justification. Martin et al. (1992) identified a prevalent view among administrators in Australian natural resource agencies that knowledge of social processes is self-evident and does not justify the level of research devoted to technical problems. From this view often follows a judgement that it is not necessary to employ specialists to study or promote social processes (Mobbs et al. 1999). Some of this conventional wisdom has its origins in the social sciences but has become applied beyond its valid domain. In other instances, the ideas are ideological but have gained quasi-scientific or ‘scientistical’ status (Ribot 2004 p.74) (e.g., the neo-liberal idea that community capacities for self-reliance will ‘roll-out’ automatically as the ‘crowding-out’ effects of government intervention are ‘rolled back’). Another likely part of the problem is that substantial numbers of policymakers, and indeed citizens, perceive problems of governance, and especially of multi-level governance, to be ‘so messy and hard to understand’ (Ostrom 2005 p.286) as to lie beyond the reach of systematic scientific investigation. A further key aspect of this problem derives from the political pressures under which policymakers necessarily operate. Politicians often have shorter planning horizons than needed to convince them of the value of going to the trouble of applying social-scientific knowledge in designing community-based approaches, and consequently incurring costs of investing in requisite capacities. Moreover, voters disgruntled with bureaucratic empire-building can be easy targets for politicians who see community-based programs as a way of ‘more funds reaching the ground’ and, consequently, decry research support for capacity-building as an excuse for empire-building to return ‘through the back door’. Even so, Australian governments have not lacked exposure to policy advice stressing the need to pursue more systematically their vision of a community-based approach to natural resource governance. In their review of Australian programs of integrated catchment management (ICM) more than a decade ago, AACM and the Centre for Water Policy Research (1995 p.32) identified ‘a profound lack of understanding’ by both governments and communities about the meaning of community empowerment, and emphasised the importance of employing social-scientific knowledge when designing new generations of such programs. In their mid-term review of administrative arrangements for the first phase of the Natural Heritage Trust (NHT), Howard Partners (1999 Attachment F) observed that mechanisms for developing
128
community ownership of that program too often entailed ‘practical solutions’ based on outdated or inappropriate theories. They observed that the prevailing administration paradigm in Australian governments was preoccupied with reducing costs and increasing efficiency within government, and based on presumptions that processes for community engagement could simply be ‘bolted on’ to existing mechanisms. They recommended that the NHT be viewed as an opportunity to build organisational structures and processes in accordance with a ‘capability model’ involving the systematic building of corporate and social competencies. 7.2.2 Steps forward and back Encouragingly, capacity-building was emphasised as a key element of the regional delivery model (Council of Australian Governments 2000). The National Natural Resource Management Capacity Building Framework released subsequently (Natural Resource Management Ministerial Council 2002 pp.1, 2) was focused on:
… enhancing genuine community engagement in all aspects of NRM, from planning to on-ground actions. Therefore, in addition to the transfer of technology and technical capability, capacity building should foster social cohesion within communities, and build both human and social capital. … [S]ocial capital refers to the level to which social networks, relationships and processes within a community support individuals to exercise their capabilities. … In essence, long-term sustainable NRM depends largely on building human and social capital.
Moreover, this framework reflected a sound appreciation of recent developments in social-scientific knowledge. For instance, one of its guiding principles was that capacity building ‘should be based on principles of trust, mutual reciprocity and norms of action’ (ibid. p.3). This governmental acknowledgement of the importance of social-scientific knowledge for succeeding with the regional delivery model was certainly an encouraging development. However, it is not yet evident that this acknowledgement has been followed up by concerted efforts to determine whether it is plausible to develop social capital sufficiently across large and complex regions for community ownership and voluntary cooperation to emerge from the populations of such regions and, if this is plausible, how this challenge might systematically be addressed across varying regional contexts. Although the research presented in this report is encouraging in this respect, addressing the challenge of identifying appropriate community-based arrangements for particular settings necessitates adaptive management founded on a complementary process of judicious policy experimentation and social learning therefrom. Institutional analysis such as undertaken in the present research has an important ongoing role to play within this wider process of social learning. Governmental administration of the regional delivery model continues to be criticised in terms of undermining the opportunities of regional bodies to establish community ownership and cooperation. For instance, the NRM Community Forum (2004) (comprising chairs of regional bodies) urged governments to reduce their micro-management and recognise regional bodies as equal partners. In its federally-commissioned review of the regional delivery model, RM Consulting (2006) warned that continuing governmental lack of confidence in these bodies was depriving them of the flexibility they required to create structures and processes capable of winning the trust and enthusiasm of those whose cooperation is needed for on-ground implementation of regional NRM plans. 7.2.3 Encouraging signs Nevertheless, there are reasonable grounds for optimism that the mainly ad hoc attention given in the past to building the social capacities required for successful community-based NRM is giving way to acceptance of the need to proceed more systematically in this area. Regional bodies are joining forces with increasing effectiveness to counter-balance governmental power with powers borne of solidarity and superior knowledge of what is feasible on the ground. The Natural Resource Management Community Forum held annually for chairs of regional groups across the nation is becoming increasingly effective in this respect, with its recommendations clearly influencing the advice governments are receiving from the consultancies they commission. The Regional Groups Collective has been providing similar advantages specifically for regional groups in the state of Queensland.

129
Experience is also proving to be a powerful teacher. Government policy-makers have learned over the eight years since the regional delivery model was announced that a purchaser-provider model of NRM governance is much more complex in practice than quasi-scientific arguments led them to expect. Encouragingly too, the recent Review of Arrangements for Regional Delivery of Natural Resource Management Programmes, commissioned by the Australian Government, found that:
Autonomy for local groups is important … An important issue is how to most effectively link the enthusiasm and knowledge of these local groups with … processes that occur at a regional scale. One successful model in creating this link has been through the establishment and support of subcatchment groups. These groups are close enough to the ground to understand the needs of smaller groups but are typically more strategically placed and better able to provide coordination and administrative support for larger-scale project delivery (Keogh et al. 2006 pp.39-40).
Moreover, it seems from feedback obtained from government officers and regional stakeholders in the final consultation round of the present research that considerable support exists for the guidelines presented in Table 6.7 for community-based NRM under the regional delivery model. In some instances, indeed, the guidelines were regarded as almost too obvious to be of value. As E.F. Schumacher (1973) observed in his influential Small is Beautiful, when discussing principles for large-scale organisation, such principles can often seem self-evident until realisation dawns of how often actual behaviour deviates from them. Accordingly, an officer with the Fitzroy Basin Association commented in the final consultation round that certain of the guidelines from Table 6.7 – subsidiarity, competence, build and maintain lower-level capacities, secure lower-level rights, and respect lower-level autonomy – are ‘not rocket science … [T]hey are basically straight out of the organisational management textbooks for delegation, aren’t they?’ Nevertheless, she proceeded to observe how the logic of delegation often gets lost, especially within the governmental sphere, when assignment of responsibilities is not, as in the textbooks, across levels of a single organisation but rather between distinct organisations situated at different levels. She identified the problem as:
They [government officers] only see line management. If they don’t have line-management facilities for delegation, they don’t know what to do. There are people in government who will try to tell us what to do. And it causes them a lot of frustration if we say ‘Nah, don’t think we can do that’. They really have nothing to come back with.
7.2.4 Integration, deliberation and politics This is essentially the challenge in a multi-level governance system of integrating decision-making across organisational boundaries, as identified by Davidson et al. (2006) or, similarly, of interactivity throughout such a system as identified by Armitage (2008). It is the challenge for decision-makers in one part of the overall system of considering the consequences of their decisions for the overall system, not only for their own part. As highlighted in section 6.3.4, international experience reveals that the two most formidable barriers to managing a multi-level environmental governance system as an integrated whole are typically vested interests and sluggish mindsets. Meaningful devolution of responsibilities to community-based systems of governance in accordance with the subsidiarity principle and the other guidelines listed in Table 6.7 can mean loss of revenues, power and status for organisations and individuals from which responsibilities are transferred. Beneficial opportunities for such devolution can also be resisted for well-intentioned reasons by individuals in positions of power whose mindsets prejudice them against appraising those opportunities accurately. Deliberative communication – wherein dialogue occurs on an equal footing between organisations at different levels – is one of the keys to surmounting these barriers. Sluggish mindsets can be awakened by the surfacing and challenging of assumptions that communication of this kind makes possible. Where perceptions of vested interests are based on erroneous assumptions, deliberative communication may also expose such errors and thereby lessen self-interest-based barriers to integration. In those instances where

130
the perceptions of vested interests causing barriers are accurate, however, no amount of deliberation will erode these barriers. For this reason, as argued below by Ribot (2004 p.6), most initiatives seeking to decentralise environmental policymaking powers to community-based systems are irreducibly political:
Decentralization reforms involve the relocation of power, producing winners, losers and resistance. … [P]romoters of decentralized natural resource management … will have to confront and counter this resistance within their own ranks and throughout the larger set of institutions affected by decentralization reforms. … Few powerful bodies are willing to give up their power for the sake of equity and efficiency, which is probably why most decentralization takes place during times of economic and political crisis, not through well-planned reforms.
Arguably, therefore, it seems that success with community-based NRM under the regional delivery model, and reaping the consequent rewards of increased voluntary cooperation from the multitude of individuals on which its on-ground success depends, will ultimately require authentic deliberation as well as astute political maneuvering. (Often this will not be ‘Capital P’ politics involving politicians but rather the less tangible politics that occurs on a day-to-day basis within and across governments, communities and other stakeholders.) Behind any such success, we can expect to find enlightened and committed leadership. Accordingly, the eight guidelines presented in Table 6.7 are recommended to such leaders as a point of departure for their efforts to bring to fruition the community-based vision underpinning the regional delivery model. 7.3 Recommendations Two recommendations are drawn from the conclusions of the present study. 1. That leaders at all levels of the regional delivery model (federal, state/territory, regional,
subregional, local, etc.) apply the eight guidelines presented in Table 6.7 as points of departure for adaptive management towards community-based governance systems capable of establishing on-ground voluntary cooperation from farmers.
2. That the conclusions drawn from the three regions studied in the present research be further
validated and refined through additional case-study research covering a broader sample of the regions defined under the regional delivery model.

131
References AACM, and the Centre for Water Policy Research, 1995. Enhancing the effectiveness of catchment
management planning: Final report, Department of Primary Industries and Energy, Adelaide. Abadi Ghadim, A. K., and Pannell, D. J., 1999. 'A conceptual framework of adoption of an agricultural
innovation', Agricultural Economics 21(2), 145-154. Agrawal, A., 2002. 'Common resources and institutional sustainability', in: Ostrom, E., Dietz, T., Dolšak,
N., Stern, P.C., Stonich, S. and Weber, E.U. (eds) The Drama of the Commons. National Academy Press, Washington, D.C., 41-85.
Agriculture Fisheries and Forestry Australia (AFFA), 1999. Managing natural resources in rural Australia for a sustainable future: A discussion paper for developing a national policy, Agriculture, Fisheries and Forestry Australia, Canberra.
Anderies, J. M., Janssen, M. A., and Ostrom, E., 2004. 'A framework to analyze the robustness of social-ecological systems from an institutional perspective', Ecology and Society 9(1): 18. [online: http://www.ecologyandsociety.org/vol9/iss1/art18]
Anderson, A. M., 1979. How advisors advise: Agricultural extension as a social process, Hawkesbury Agricultural College, Richmond.
Anderson, A. M., 1981. Farmers' expectations and use of agricultural extension services, Hawkesbury Agricultural College, Richmond.
Armitage, D., 2008. 'Governance and the commons in a multi-level world', International Journal of the Commons 2(1), 7-32. [online: http://www.thecommonsjournal.org/index.php/ijc/article/viewFile/28/16]
Arthur, W. B., 1999. 'Complexity and the economy', Science 284(5411), 107-109. Australian Government, 2007. Phase Three of the Natural Heritage Trust, Department of Agriculture
Fisheries and Forestry, and Department of the Environment and Water Resources. [online: http://www.nrm.gov.au/funding/pubs/nht-questions.pdf]
Axelrod, R., 1984. The Evolution of Cooperation. Basic Books, New York. Baland, J.-M., and Platteau, J.-P., 1996. Halting Degradation of Natural Resources: Is There a Role for
Rural Communities? Clarendon Press, for the Food and Agriculture Organisation, Oxford. Barzelay, M., 2002. 'Origins of the New Public Management: An international view from public
administration/political science', in: McLaughlin, K., Osborne, S.P. and Ferlie, E. (eds) New Public Management: Current Trends and Future Prospects. Routledge, London, 15-33.
Bellamy, J. A., and Johnson, A. K. L., 2000. 'Integrated resource management: Moving from rhetoric to practice in Australian agriculture', Environmental Management 25(3), 265-280.
Bellamy, J. A., Ross, H., Ewing, S. A., and Meppem, T., 2002. Integrated catchment management: Learning from the Australian experience for the Murray-Darling Basin, CSIRO Sustainable Ecosystems, Brisbane.
Berger, P. L., and Neuhaus, R. J., 1977. To Empower People: The Role of Mediating Structures in Public Policy. American Enterprise Institute, Washington, D.C.
Berger, P. L., and Neuhaus, R. J., 1996. 'Peter L. Berger and Richard John Neuhaus respond', in: Novak, M. (ed.) To Empower People: From State to Civil Society. AEI Press, Washington, D.C., 145-154.
Berkes, F., 2002. 'Cross-scale institutional linkages: Perspectives from the bottom up', in: Ostrom, E., Dietz, T., Dolšak, N., Stern, P.C., Stonich, S. and Weber, E.U. (eds) The Drama of the Commons. National Academy Press, Washington, D.C., 293-321.
Berkes, F., 2006. 'From community-based resource management to complex systems: The scale issue and marine commons', Ecology and Society 11(11), 45. [online http://www.ecologyandsociety.org/vol11/iss1/art45/]
Berkes, F., 2008. 'Commons in a multi-level world', International Journal of the Commons 2(1), 1-6. Berkes, F., Hughes, T. P., Steneck, R. S., Wilson, J. A., Bellwood, D. R., Crona, B., Folke, C., Gunderson,
L. H., Leslie, H. M., Norberg, J., Nystrom, M., Olsson, P., and Osterblom, H., Schoffer, M., and Worm, B., 2006. 'Globalization, roving bandits, and marine resources', Science 311, 1557-1558.
Betts, K., 1998. 'The evolution of social capital: On the origins of the social contract', The Social Contract 8(3), 252-261.

132
Booth, C. A., and Hooper, B., 1996. 'Debate - Topic: Can ICM be effective in urbanising catchments?' Paper presented at the Integrated Catchment Management Forum: Effective ICM in an Urbanising Catchment, 28 February, Radisson Rum Corp Resort.
Bromley, D. W., 1989. Economic Interests and Institutions: The Conceptual Foundations of Public Policy. Basil Blackwell, New York.
Brunckhorst, D., and Reeve, I., 2006. 'A geography of place: Principles and application for defining 'eco-civic' resource governance regions', Australian Geographer 37(2), 147-166.
Camazine, S., Deneubourg, J. L., Franks, N. R., Sney, J., Theraulaz, G., and Bonabeau, E., 2001. Self-organization in Biological Systems. Princeton University Press, Princeton.
Carozza, P. G., 2003. 'Subsidiarity as a structural principle of international human rights law', The American Journal of International Law 97(38), 38-79.
Carr, A., 2002. Grass Roots and Green Tape: Principles and Practices of Environmental Stewardship. Federation Press, Sydney.
Carroll, P., and Steane, P., 2002. 'Australia, the New Public Management and the new millennium', in: McLaughlin, K., Osborne, S.P. and Ferlie, E. (eds) New Public Management: Current Trends and Future Prospects. Routledge, London, 195-209.
Cary, J., and Webb, T., 2000. Community landcare, the National Landcare Program and the landcare movement: The social dimensions of landcare, Bureau of Rural Sciences, Department of Agriculture, Fisheries and Forestry, Canberra.
Cary, J., Webb, T., and Barr, N., 2002. Understanding landholders' capacity to change to sustanable practices: Insights about practice adoption and social capacity for change, Bureau of Rural Sciences, Canberra.
Cash, D. W., Adger, W. N., Berkes, F., Garden, P., Lebel, L., Olsson, P., Pritchard, L., and Young, O., 2006. 'Scale and cross-scale dynamics: Governance and information in a multi-level world', Ecology and Society 11(2), 8. [online: http://www.ecologyandsociety.org/vol11/iss2/art8/]
Central Highland Regional Resources Use Planning Cooperative Limited, 2003. Central Highlands Natural Resource Management Plan, CHRRUP, Emerald.
Chambers, R., 1983. Rural Development: Putting the Last First. Institute of Development Studies, Brighton.
Cheng, A. S., Kruger, L. E., and Daniels, S. E., 2003. ''Place' as an integrating concept in natural resource politics: Propositions for a social science research agenda', Society and Natural Resources 16, 87-104.
Cohen, J., 1998. 'Democracy and liberty', in: Elster, J. (ed.) Deliberative Democracy. Cambridge University Press, Cambridge, 185-231.
Commonwealth of Australia, c2001. Intergovernmental agreement on a National Action Plan for Salinity and Water Quality, Canberra.
Cooksey, R. W., 1997. Statistics for Behavioural and Social Research: A Descriptive Handbook. Department of Marketing and Management, University of New England, Armidale.
Council of Australian Governments (COAG), 2000. Our Vital Resources: A National Action Plan for Salinity and Water Quality, Parliament of Australia
Crowley, K., 2001. 'Effective environmental federalism? Australia's Natural Heritage Trust', Journal of Environmental Policy and Planning 3(4), 255-272.
Cunningham, G. M., 1988. 'Total Catchment Management', Journal of Soil Conservation 44(1), 42-45. Coughenour, C. M., and Chamala, S., 2000. Conservation Tillage and Cropping Innovation: Constructing
the New Culture of Agriculture. Iowa University Press, Ames, USA. Curtis, A., 1997. 'Landcare, stewardship and biodiversity conservation', in: Klomp, N.I. and Lunt, I. (eds)
Frontiers in Ecology: Building the Links. Elsevier Science, Oxford, 143-153. Curtis, A., 1998. 'Agency-community partnership in Landcare: Lessons for state-sponsored citizen resource
management', Environmental Management 22(4), 563-574. Curtis, A., and De Lacy, T., 1998a. 'Landcare, stewardship and sustainable agriculture in Australia',
Environmental Values 7(1), 59-78. Curtis, A. L., and De Lacy, T., 1996. 'Landcare in Australia: Does it make a difference?' Journal of
Environmental management 46, 119-147.

133
Curtis, A., and Lockwood, M., 1998b. 'Natural resource policy for rural Australia', in: Pratley, J. and Robertson, A. (eds) Agriculture and the Environmental Imperative. CSIRO Publishing, Collingwood, 211-242.
Davidson, J., Lockwood, M., Curtis, A., Stratford, E., and Griffith, R., 2006. Governance principles for regional natural resource management. Report no. 1 of the project 'Pathways to good practice in regional NRM governance', School of Geography and Environmental Studies, University of Tasmania, Hobart. [online: http://www.geog.utas.edu.au/geography/nrmgovernance]
Dovers, S., 1999. 'Public policy and institutional R&D for natural resource management: Issues and directions for LWRRDC', in: Mobbs, C. and Dovers, S. (eds) Social, Economic, Legal, Policy and Institutional R&D for Natural Resource Management: Issues and Directions for LWRRDC. Land and Water Resources Research and Development Corporation, Canberra, 78-107.
Ecker, S., and Chadwick, D., 2000. 'Zone Action Planning: Delivering integrated catchment management in the Blackwood River Basin', Paper presented at the International Landcare Conference, Melbourne.
Environment Australia, and Agriculture Forestry and Fisheries Australia, 2002. Framework for the extension of the Natural Heritage Trust. Canberra. [online: http://www.nht.gov.au/extension/framework/index.html]
Farrier, D., Lyster, R., and Pearson, L., 1999. The Environmental Law Handbook: Planning and Land Use in New South Wales. 3rd ed., Redfern Legal Centre Publishing, Sydney.
Feder, G., Just, R. E., and Zilberman, D., 1985. 'Adoption of agricultural innovations in developing countries: A survey', Economic Development and Cultural Change 33, 255-297.
Gardner, A., 1999. 'The administrative framework of land and water management in Australia', Environmental and Planning Law Journal 16(3), 212-257.
Goodwin, B. K., and Schroeder, T. C., 1994. 'Human capital, producer education programs, and adoption of forward-pricing methods', American Journal of Agricultural Economics 76, 936-947.
Gordon, H. S., 1954. 'The economic theory of a common property resource: The fishery', The Journal of Political Economy 62, 124-142.
Greene, W. H., 2000. Econometric Analysis. 4th ed., Prentice Hall, Upper Saddle River. Hardin, G., 1968. 'The tragedy of the commons', Science 162, 1243-1248. Hollick, M., 1992. 'Why won’t they do it? Problems of implementing catchment management at the farm
level', Paper presented at the 5th Australian Soil Conservation Conference, Perth. House of Representatives Standing Committee on the Environment and Heritage, 2000. Co-ordinating
catchment management: Report of the inquiry into catchment management, Parliament of Australia, Canberra.
Howard, J., 2000. Transcript of the Prime Minister The Hon. John Howard MP press conference on natural resource management, Parliament House, Canberra. [online: http://www.pm.gov.au/news/interviews/2000/interview475.htm]
Howard Partners, 1999. Mid-term review of the Natural Heritage Trust: Review of administration, Howard Partners, Canberra.
Industry Commission, 1998. A full repairing lease: Inquiry into ecologically sustainable land management, Industry Commission, Canberra.
Janssen, M. A., and Anderies, J. M., 2007. 'Robustness tradeoffs in social-ecological systems', International Journal of the Commons 1(1), 43-65.
Keogh, K., Chant, D., and Frazer, B., 2006. Review of arrangements for regional delivery of natural resource management programmes. Report prepared by the Ministerial Reference Group for Future NRM Programme Delivery, Australian Government NRM Team, Canberra.
Kilpatrick, S., 2000. 'Education and training: Impacts on farm management pracice', Journal of Agricultural Education and Extension 7, 105-116.
Kington, E. A., and Pannell, D. J., 2003. 'Dryland salinity in the Upper Kent River catchment of Western Australia: Farmer perceptions and practices', Australian Journal of Experimental Agriculture 43, 19-28.
Koontz, T. M., Steelman, T. A., Carmin, J., Korfmacher, K. S., Mosely, C., and Thomas, C. W., 2004. Collaborative Environmental Management: What Roles for Government? Resources for the Future, Washington, D.C.

134
Lebel, L., Anderies, J. M., Campbell, B., Folke, C., Hatfield-Dodds, S., Hughes, T. P., and Wilson, J., 2006. 'Governance and the capacity to manage resilience in regional social-ecological systemos', Ecology and Society 11(1), 19. [online: http://www.ecologyandsociety.org/vol11/iss1/art19/]
Lemos, M. C., and Agrawal, A., 2006. 'Environmental governance', Annual Review of Environment and Resources 31, 297-325.
Lockwood, M., Davidson, J., Curtis, A., Griffith, R., and Stratford, E., 2007. Strengths and challenges of regional NRM governance: Interviews with key players and insights from the literature. Report no. 4 of the project 'Pathways to good practice in regional NRM governance', School of Geography and Environmental Studies, University of Tasmania, Hobart. [online: http://www.geog.utas.edu.au/geography/nrmgovernance]
Manor, J., 1999. The Political Economy of Democratic Decentralization. World Bank, Washington, D.C. Marshall, G. R., 2001. Crafting cooperation in the commons: An economic analysis of prospects for
collaborative environmental governance. Unpublished Ph.D. thesis, School of Economics, University of New England, Armidale.
Marshall, G. R., 2002. 'Institutionalising cost sharing for catchment management: Lessons from land and water management planning in Australia', Water, Science and Technology 45(11), 101-111.
Marshall, G. R., 2003. 'Towards a resource economics for adaptive managers', Paper presented to the 47th Annual Conference of the Australian Agricultural and Resource Economics Society, 12-14 February, Fremantle.
Marshall, G. R., 2004a. 'Farmers cooperating in the commons? A study of collective action in salinity management', Ecological Economics 51(3-4), 271-286.
Marshall, G. R., 2004b. 'From words to deeds: Enforcing farmers' conservation cost-sharing commitments', Journal of Rural Studies 20(2), 157-167.
Marshall, G. R., 2005. Economics for Collaborative Environmental Management: Renegotiating the Commons. Earthscan, London.
Marshall, G. R., 2008. 'Nesting, subsidiarity, and community-based environmental governance beyond the local level', International Journal of the Commons 2(1), 75-97. [online: http://www.thecommonsjournal.org/index.php/ijc/article/viewFile/50/19]
Marshall, G. R., Wall, L. M., and Jones, R. E., 1996. 'Economics of integrated catchment management', Review of Marketing and Agricultural Economics 64(2), 166-176. [online: http://agecon.lib.umn.edu/cgi-bin/pdf_view.pl?paperid=25614&ftype=.pdf]
Martin, P., Tarr, S., and Lockie, S., 1992. 'Participatory environmental management in New South Wales: Policy and practice', in: Lawrence, G., Vanclay, F. and Furze, B. (eds) Agriculture, Environment and Society: Contemporary Issues for Australia. MacMillan, Melbourne, 184-207.
McKean, M. A., 2002. 'Nesting institutions for complex common-pool resource systems', in: Graham, J., Reeve, I. and Brunckhorst, D. (eds) Landscape Futures II: Social and Institutional Dimensions. Proceedings of the 2nd International Symposium on Landscape Futures, Armidale, 4-6 December 2001. Institute for Rural Futures, University of New England, Armidale.
Miller, G. J., 1992. Managerial Dilemmas: The Political Economy of Hierarchy. Cambridge University Press.
Mobbs, C., and Dovers, S., (eds), 1999. Social, Economic, Legal, Policy and Institutional R&D for Natural Resource Management: Issues and Directions for LWRRDC. Occasional Paper No. 01/99, Land and Water Resources Research and Development Corporation, Canberra.
Mues, C., Chapman, L., and Van Hilst, R., 1998. Survey of Landcare and land management practices: 1992-93, Australian Bureau of Agricultural and Resource Economics, Canberra.
Musgrave, W., 2002. 'Integrated water management in Australia: Some new institutional thoughts', in: Garnaut, R. (ed.) Resource Management in Asia Pacific Developing Countries. Asia Pacific Press, Canberra, 140-159.
Natural Resource Management Ministerial Council, 2002. National natural resource management framework, NRM Ministerial Council, Canberra.
NRM (Natural Resource Management) Community Forum, 2004. Report of the Natural Resource Community Forum 2004, Natural Resource Management Ministerial Council, Canberra.
Natural Resource Management Ministerial Council, 2006. Framework for future NRM programmes, Natural_Resource_Management_Ministerial_Council, Canberra. [online: http://www.nrm.gov.au/publications/future/index.html]

135
Nee, V., 1998. 'Norms and networks in economic and organizational performance', American Economic Review 88(2), 85-89.
Nelson, R. H., 1987. 'The economics profession and the making of public policy', Journal of Economic Literature 25, 49-91.
Olson, M., 1965. The Logic of Collective Action. Harvard University Press, Cambridge. Ostrom, E., 1990. Governing the Commons: The Evolution of Institutions for Collective Action. Cambridge
University Press, Cambridge. Ostrom, E., 1998. 'A behavioral approach to the rational choice theory of collective action', American
Political Science Review 92(1), 1-22. Ostrom, E., 1999. 'Coping with tragedies of the commons', Annual Review of Political Science 2, 493-535. Ostrom, E., 2005. Understanding Institutional Diversity. Princeton University Press, Princeton. Ostrom, V., Tiebout, C. M., and Warren, R., 1999[1961]. 'The organization of government in metropolitan
areas: A theoretical inquiry', in: McGinnis, M.D. (ed.) Polycentricity and Local Public Economies: Readings from the Workshop in Political Theory and Policy Analysis. University of Michigan Press, Ann Arbor, 31-51.
Pannell, D. J., Marshall, G. R., Barr, N., Curtis, A., Vanclay, F., and Wilkinson, R., 2006. 'Understanding and promoting adoption of conservation practices by rural landholders', Australian Journal of Experimental Agriculture 46, 1407-1424.
Pannell, D. J., McFarlane, D. J., and Ferdowsian, R., 2001. 'Rethinking the externality issue for dryland salinity in Western Australia', Australian Journal of Agricultural and Resource Economics 45(3), 459-475.
Prime Minister's Science Engineering and Innovation Council (PMSEIC), 1998. Dryland salinity and its impacts on rural industries and the landscape, Office of the Prime Minister, Parliament House, Canberra.
Putnam, R. D., 1993. Making Democracy Work: Civic Traditions in Modern Italy. Princeton University Press, Princeton.
Quiggin, J., 2001. 'Environmental economics and the Murray-Darling river system', Australian Journal of Agricultural and Resource Economics 45(1), 67-94.
Reeve, I., 1997. 'Property and participation: An institutional analysis of rural resource management and Landcare in Australia', in: Lockie, S. and Vanclay, F. (eds) Critical Landcare. Centre for Rural Social Research, Charles Sturt University, Wagga Wagga, 83-95.
Reeve, I., 2003. Principles for the nested governance of water resources. IRF Occasional Paper 2003/1, Institute of Rural Futures, University of New England, Armidale.
Reeve, I., Marshall, G. R., and Musgrave, W., 2002. Resource governance and integrated catchment management. Issues Paper no. 2 for Murray-Darling Basin Commission project MP2004, Institute for Rural Futures, Armidale.
Rhoades, R. E., 2000. 'The participatory multipurpose watershed project: Nature's salvation or Schumacher's nightmare?' in: Lal, R. (ed.) Integrated Watershed Management in the Global Ecosystem. CRC Press, Boca Raton, 327-343.
Ribot, J. C., 2002. Democratic Decentralization of Natural Resources: Institutionalizing Popular Participation. World Resources Institute, Washington, D.C.
Ribot, J. C., 2004. Waiting for Democracy: The Politics of Choice in Natural Resource Decentralization. World Resources Institute, Washington D.C.
RM Consulting Group, 2006. Evaluation of sustainable agriculture outcomes from regional investment (NAP and NHT): Final report, RM Consulting Group, Canberra.
Sandler, T., 1992. Collective Action: Theory and Applications. University of Michigan Press, Ann Arbor. Schumacher, E. F., 1973. Small is Beautiful: A Study of Economics as if People Mattered. Blond and
Briggs, London. Scott, A. D., 1955. 'The fishery: The objectives of sole ownership', Journal of Political Economy 63, 116-
124. Simon, H. A., 1946. 'The proverbs of administration', Public Administration Review 6(1), 53-67. Simon, H. A., 1981. Sciences of the Artificial. 2nd edition. MIT Press, Cambridge. Sribney, W., 2007. Pseudo-R2 for tobit. Frequently asked questions, StataCorp. [online:
http://www.stata.com/support/faqs/stat/pseudor2.html] StataCorp., 2007. Stata Statistical Software: Release 10. StataCorp LP, College Station, Texas.

136
Stratford, E., Davidson, J., Griffith, R., Lockwood, M., and Curtis, A., 2007. Sustainable development and good governance: The 'big ideas' influencing Australian NRM. Report no. 3 of the project 'Pathways to good practice in regional NRM governance', School of Geography and Environmental Studies, University of Tasmania, Hobart. [online: http://www.geog.utas.edu.au/geography/nrmgovernance]
Syme, G. J., 1995. 'Looking backwards to the future: Re-creating community responsibility for catchment management', Paper presented at the ‘People Power in Catchment Care’ conference, 25-26 February, Maleny, Queensland.
Tabachnick, B. G., and Fidell, L. S., 1989. Using Multivariate Statistics. 2nd edition. Harper Collins, New York.
United Nations Conference on Environment and Development, 1992. The Rio Declaration: Report of the United Nations Conference on Environment and Development, 3-14 June, Rio de Janeiro.
Uphoff, N., Esman, M. J., and Krishna, A., 1998. Reasons for Success: Learning from Instructive Experiences in Rural Development. Vistaar Publications, New Delhi.
van Laerhoven, F., and Ostrom, E., 2007. 'Traditions and trends in the study of the commons', International Journal of the Commons 1(1), 3-28 [online: http://www.thecommonsjournal.org/index.php/ijc/article/view/76]
Vanclay, F., 2004. 'Social principles for agricultural extension to assist in the promotion of natural resource management', Australian Journal of Experimental Agriculture 44, 213-222.
Vaske, J. J., and Kobrin, K., 2001. 'Place attachment and environmentally responsible behavior', Journal of Environmental Education 32(4), 116-121.
Williams, D. R., and Vaske, J. J., 2003. 'The measurement of place attachment: Validity and generalizability of a psychometric approach', Forest Science 49(6), 830-840.
Wade, R., 1988. Village Republics: Economic Conditions for Collective Action in South India. Cambridge University Press, Cambridge.
Walker, B., and Salt, D., 2006. Resilience Thinking: Sustaining Ecosystems and People in a Changing World. Island Press, Washington, D.C.
WalterTurnbull, 2005. Evaluation of current governance arrangements to support regional investment under the NHT and NAP, WalterTurnbull, Canberra.
Wilkinson, R. L., and Barr, N. F., 1993. Community Involvement in Catchment Management: An Evaluation of Community Planning and Consultation in the Victorian Salinity Program – A Report to the Department of Agriculture Victoria, Melbourne.
Wondolleck, J. M., and Yaffee, S. L., 2000. Making Collaboration Work: Lessons from Innovation in Natural Resource Management. Island Press, Washington, D.C.
Woodhill, J., 1997. 'Resource sharing for on-ground change: A systemic perspective', Paper presented at the Second National Workshop on Integrated Catchment Management, 29 September - 1 October, Australian National University, Canberra.
Yin, R. K., 1984. Case Study Research. Sage Publications, Beverly Hills. Young, O. R., 2002. The Institutional Dimensions of Environmental Change: Fit, Interplay, and Scale.
MIT Press, Cambridge. Young, O. R., 2006. 'Vertical interplay among scale-dependent environmental and resource regimes',
Ecology and Society 11(1), 27. [online: http://www.ecologyandsociety.org/vol11/iss1/art27/]

137
Appendix A: Regression results for the Blackwood Basin case Table A.1: Double-censored regression model for revegetation and protective fencing LR chi2(17) = 44.5 Total no. obs = 214
Prob > chi2 = 0.000 No. left-censored obs = 46
Log likelihood = -1,035.7 No. right-censored obs = 1
Explanatory variable Exp. sign Coef. P > | t | Sig. Elasticity
Property area (ha) + / - 0.01 0.075 *** 2.0
% net income from grazing + / - -0.33 0.241
Years experience farming + / - -1.26 0.080 *** -4.5
Local group involvement + 14.22 0.043 ** 1.4
Formal education + / - 4.85 0.427
Place attachment + / - -15.69 0.295
Profitability + / - 2.19 0.839
Equity ratio + 2.85 0.779
% income from farm business + / - -0.26 0.969
Perceived contribution to goals + 2.56 0.711
Perceived commons problem + / - 6.25 0.109
Expected future district adoption + / - 19.84 0.055 * 6.0
Trust in subregional body + / - 24.31 0.066 * 9.3
Trust in regional body + / - -16.25 0.184
Trust in gov't commitment to community empowerment + / - -1.36 0.870
Trust in government integrity + / - 0.14 0.990
Trust in regional/subregional autonomy + / - 9.55 0.414
Constant + / - -78.60 0.385
Table A.2: Double-censored regression model for establish perennial vegetation
LR chi2(17) = 59.1 Total no. obs = 205
Prob > chi2 = 0.000 No. left-censored obs = 75
Log likelihood = -864.2 No. right-censored obs = 1
Explanatory variable Exp. sign Coef. P > | t | Sig. Elasticity
Property area (ha) + / - 0.00 0.801
% net income from grazing + / - -0.16 0.713
Years experience farming + / - -1.02 0.358
Local group involvement + 19.69 0.061 ** nc
Formal education + / - 19.08 0.041 ** nc
Place attachment + / - -59.45 0.009 *** nc
Profitability + / - -5.87 0.722
Equity ratio + -21.13 0.175
% income from farm business + / - 10.00 0.330
Perceived contribution to goals + 24.01 0.033 ** nc
Perceived commons problem + / - 5.72 0.369
Expected future district adoption + / - 31.39 0.076 * nc
Trust in subregional body + / - 68.83 0.001 *** nc
Trust in regional body + / - -3.30 0.861
Trust in gov't commitment to community empowerment + / - -0.89 0.945
Trust in government integrity + / - -23.66 0.157
Trust in regional/subregional autonomy + / - -5.32 0.773
Constant + / - -173.17 0.257
*, ** and *** indicate that the hypothesis associated with the explanatory variable is supported at the 90%, 95% and 99% confidence level, respectively. na ~ not applicable. nc ~ unable to calculate.

138
Table A.3: Double-censored regression model for establish perennial pastures LR chi2(17) = 52.2 Total no. obs = 219
Prob > chi2 = 0.000 No. left-censored obs = 62
Log likelihood = -1,076.8 No. right-censored obs = 4
Explanatory variable Exp. sign Coef. P > | t | Sig. Elasticity
Property area (ha) + / - 0.03 0.050 ** 1.9
% net income from grazing + / - 0.23 0.686
Years experience farming + / - -1.10 0.457
Local group involvement + 25.18 0.080 ** 1.0
Formal education + / - 13.14 0.297
Place attachment + / - -31.53 0.301
Profitability + / - -4.20 0.852
Equity ratio + 22.91 0.246
% income from farm business + / - 1.48 0.911
Perceived contribution to goals + 74.10 0.000 *** 16.6
Perceived commons problem + / - -1.97 0.840
Expected future district adoption + / - 29.04 0.195
Trust in subregional body + / - 71.80 0.007 *** 11.4
Trust in regional body + / - -10.03 0.689
Trust in gov't commitment to community empowerment + / - -22.33 0.200
Trust in government integrity + / - 19.28 0.381
Trust in regional/subregional autonomy + / - -37.70 0.123
Constant + / - -576.76 0.005 ***
Table A.4: Double-censored regression model for soil remediation
LR chi2(17) = 51.1 Total no. obs = 208
Prob > chi2 = 0.000 No. left-censored obs = 95
Log likelihood = -761.2 No. right-censored obs = 18
Explanatory variable Exp. sign Coef. P > | t | Sig. Elasticity
Property area (ha) + / - 0.01 0.711
% net income from grazing + / - 0.02 0.985
Years experience farming + / - -6.98 0.023 ** nc
Local group involvement + 54.62 0.075 ** nc
Formal education + / - 37.36 0.151
Place attachment + / - -90.73 0.155
Profitability + / - 13.10 0.783
Equity ratio + 1.63 0.968
% income from farm business + / - 30.21 0.270
Perceived contribution to goals + 52.46 0.140 * nc
Perceived commons problem + / - 3.88 0.849
Expected future district adoption + / - 158.66 0.001 *** nc
Trust in subregional body + / - 38.22 0.478
Trust in regional body + / - -15.40 0.762
Trust in gov't commitment to community empowerment + / - 11.50 0.756
Trust in government integrity + / - 49.05 0.291
Trust in regional/subregional autonomy + / - -30.98 0.521
Constant + / - -829.41 0.051 *
*, ** and *** indicate that the hypothesis associated with the explanatory variable is supported at the 90%, 95% and 99% confidence level, respectively. na ~ not applicable. nc ~ unable to calculate.
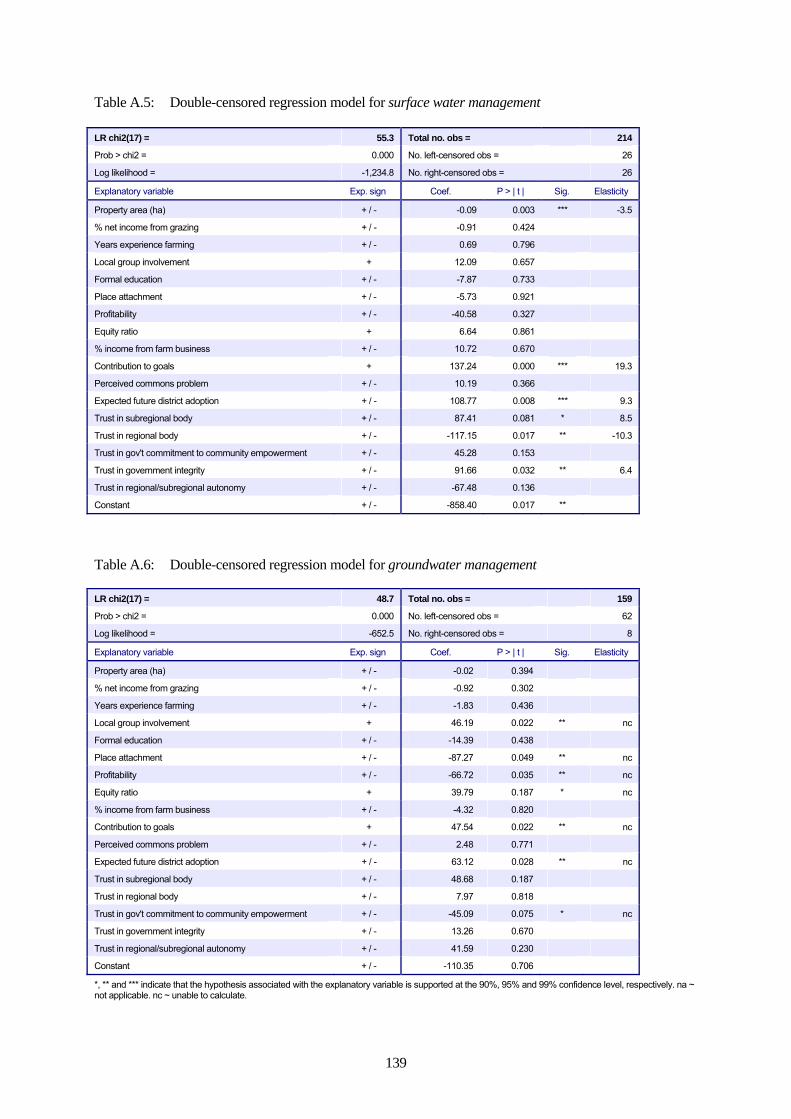
139
Table A.5: Double-censored regression model for surface water management LR chi2(17) = 55.3 Total no. obs = 214
Prob > chi2 = 0.000 No. left-censored obs = 26
Log likelihood = -1,234.8 No. right-censored obs = 26
Explanatory variable Exp. sign Coef. P > | t | Sig. Elasticity
Property area (ha) + / - -0.09 0.003 *** -3.5
% net income from grazing + / - -0.91 0.424
Years experience farming + / - 0.69 0.796
Local group involvement + 12.09 0.657
Formal education + / - -7.87 0.733
Place attachment + / - -5.73 0.921
Profitability + / - -40.58 0.327
Equity ratio + 6.64 0.861
% income from farm business + / - 10.72 0.670
Contribution to goals + 137.24 0.000 *** 19.3
Perceived commons problem + / - 10.19 0.366
Expected future district adoption + / - 108.77 0.008 *** 9.3
Trust in subregional body + / - 87.41 0.081 * 8.5
Trust in regional body + / - -117.15 0.017 ** -10.3
Trust in gov't commitment to community empowerment + / - 45.28 0.153
Trust in government integrity + / - 91.66 0.032 ** 6.4
Trust in regional/subregional autonomy + / - -67.48 0.136
Constant + / - -858.40 0.017 **
Table A.6: Double-censored regression model for groundwater management LR chi2(17) = 48.7 Total no. obs = 159
Prob > chi2 = 0.000 No. left-censored obs = 62
Log likelihood = -652.5 No. right-censored obs = 8
Explanatory variable Exp. sign Coef. P > | t | Sig. Elasticity
Property area (ha) + / - -0.02 0.394
% net income from grazing + / - -0.92 0.302
Years experience farming + / - -1.83 0.436
Local group involvement + 46.19 0.022 ** nc
Formal education + / - -14.39 0.438
Place attachment + / - -87.27 0.049 ** nc
Profitability + / - -66.72 0.035 ** nc
Equity ratio + 39.79 0.187 * nc
% income from farm business + / - -4.32 0.820
Contribution to goals + 47.54 0.022 ** nc
Perceived commons problem + / - 2.48 0.771
Expected future district adoption + / - 63.12 0.028 ** nc
Trust in subregional body + / - 48.68 0.187
Trust in regional body + / - 7.97 0.818
Trust in gov't commitment to community empowerment + / - -45.09 0.075 * nc
Trust in government integrity + / - 13.26 0.670
Trust in regional/subregional autonomy + / - 41.59 0.230
Constant + / - -110.35 0.706
*, ** and *** indicate that the hypothesis associated with the explanatory variable is supported at the 90%, 95% and 99% confidence level, respectively. na ~ not applicable. nc ~ unable to calculate.

140
Table A.7: Double-censored regression model for pest and weed control
LR chi2(17) = 14.2 Total no. obs = 236
Prob > chi2 = 0.655 No. left-censored obs = 39
Log likelihood = -954.1 No. right-censored obs = 78
Explanatory variable Exp. sign Coef. P > | t | Sig. Elasticity
Property area (ha) + / - 0.02 0.586
% net income from grazing + / - 0.97 0.329
Years experience farming + / - -0.99 0.712
Local group involvement + 11.98 0.669
Formal education + / - -40.36 0.077 * -1.5
Place attachment + / - -38.03 0.524
Profitability + / - -48.22 0.252
Equity ratio + 9.10 0.803
% income from farm business + / - -8.11 0.738
Perceived contribution to goals + 19.95 0.541
Perceived commons problem + / - 13.10 0.312
Expected future district adoption + / - 64.66 0.132
Trust in subregional body + / - -52.81 0.300
Trust in regional body + / - 5.73 0.908
Trust in gov't commitment to community empowerment + / - 28.89 0.371
Trust in government integrity + / - -16.63 0.682
Trust in regional/subregional autonomy + / - -15.81 0.730
Constant + / - 283.80 0.443
Table A.8: Double-censored regression model for zero or minimum tillage cropping
LR chi2(17) = 13.2 Total no. obs = 177
Prob > chi2 = 0.723 No. left-censored obs = 28
Log likelihood = -930.6 No. right-censored obs = 24
Explanatory variable Exp. sign Coef. P > | t | Sig. Elasticity
Property area (ha) + / - 0.01 0.858
% net income from grazing + / - 0.76 0.473
Years experience farming + / - -1.50 0.590
Local group involvement + -5.69 0.810
Formal education + / - 1.11 0.959
Place attachment + / - -50.80 0.338
Profitability + / - -38.31 0.318
Equity ratio + -2.79 0.934
% income from farm business + / - 31.81 0.175
Perceived contribution to goals + 33.39 0.167 * 7.4
Perceived commons problem + / - 4.03 0.851
Expected future district adoption + / - -8.06 0.879
Trust in subregional body + / - 22.10 0.625
Trust in regional body + / - 26.45 0.552
Trust in gov't commitment to community empowerment + / - 19.45 0.510
Trust in government integrity + / - 36.82 0.321
Trust in regional/subregional autonomy + / - -44.80 0.284
Constant + / - -116.53 0.754
*, ** and *** indicate that the hypothesis associated with the explanatory variable is supported at the 90%, 95% and 99% confidence level, respectively. na ~ not applicable. nc ~ unable to calculate.

141
Appendix B: Regression results for the Central Highlands case Table B.1: Double-censored regression model for fencing riparian areas & installing watering points
LR chi2(17) = 33.1 Total no. obs = 95
Prob > chi2 = 0.011 No. left-censored obs = 32
Log likelihood = -510.7 No. right-censored obs = 15
Explanatory variable Exp. sign Coef. P > | t | Sig. Elasticity
Property area (ha) + / - 0.06 0.025 ** nc
% net income from grazing + / - 21.66 0.356
Years experience farming + / - -73.81 0.277
Local group involvement + -81.44 0.916
Formal education + / - 731.68 0.291
Place attachment + / - -2,499.40 0.143
Profitability + / - 94.83 0.930
Equity ratio + -365.58 0.712
% income from farm business + / - 185.91 0.797
Perceived contribution to goals + 1,678.75 0.026 ** nc
Perceived commons problem + / - 498.02 0.233
Expected future district adoption + / - 994.46 0.334
Trust in subregional body + / - 2,697.53 0.062 * nc
Trust in regional body + / - -1,647.32 0.307
Trust in gov't commitment to community empowerment + / - 699.39 0.461
Trust in government integrity + / - -1,315.84 0.197
Trust in regional/subregional autonomy + / - -474.12 0.693
Constant + / - -5,079.88 0.649
Table B.2: Double-censored regression model for environmental weeds control LR chi2(17) = 16.1 Total no. obs = 116
Prob > chi2 = 0.517 No. left-censored obs = 22
Log likelihood = -555.3 No. right-censored obs = 44
Explanatory variable Exp. sign Coef. P > | t | Sig. Elasticity
Property area (ha) + / - 0.00 0.916
% net income from grazing + / - 24.48 0.290
Years experience farming + / - 113.57 0.085 * 3.2
Local group involvement + 1,145.26 0.148 * 0.8
Formal education + / - 567.58 0.394
Place attachment + / - -1,745.66 0.330
Profitability + / - -1,254.73 0.277
Equity ratio + 311.17 0.773
% income from farm business + / - -111.96 0.876
Perceived contribution to goals + 548.62 0.463
Perceived commons problem + / - 102.36 0.744
Expected future district adoption + / - 811.04 0.476
Trust in subregional body + / - 2,773.10 0.082 * 8.9
Trust in regional body + / - -4,676.69 0.009 *** -14.2
Trust in gov't commitment to community empowerment + / - 100.32 0.914
Trust in government integrity + / - -1,381.82 0.214
Trust in regional/subregional autonomy + / - 1,363.21 0.269
Constant + / - 3,659.48 0.741
*, ** and *** indicate that the hypothesis associated with the explanatory variable is supported at the 90%, 95% and 99% confidence level, respectively. na ~ not applicable. nc ~ unable to calculate

142
Table B.3: Double-censored regression model for maintain groundcover on grazing land LR chi2(17) = 49.5 Total no. obs = 114
Prob > chi2 = 0.000 No. left-censored obs = 8
Log likelihood = -547.0 No. right-censored obs = 48
Explanatory variable Exp. sign Coef. P > | t | Sig. Elasticity
Property area (ha) + / - -0.01 0.258
% net income from grazing + / - 35.61 0.000 *** 1.9
Years experience farming + / - 34.74 0.078 * 0.8
Local group involvement + 355.75 0.166 * 0.2
Formal education + / - 13.50 0.948
Place attachment + / - -371.76 0.502
Profitability + / - -241.05 0.492
Equity ratio + 44.59 0.893
% income from farm business + / - 122.44 0.595
Perceived contribution to goals + 184.80 0.620
Perceived commons problem + / - 27.99 0.833
Expected future district adoption + / - 82.68 0.842
Trust in subregional body + / - 1,844.43 0.000 *** 4.7
Trust in regional body + / - -2,661.76 0.000 *** -6.5
Trust in gov't commitment to community empowerment + / - 279.58 0.362
Trust in government integrity + / - -615.38 0.073 * -1.5
Trust in regional/subregional autonomy + / - 367.78 0.390
Constant + / - 394.46 0.920
Table B.4: Double-censored regression model for soil conservation measures
LR chi2(17) = 43.0 Total no. obs = 96
Prob > chi2 = 0.001 No. left-censored obs = 20
Log likelihood = -662.9 No. right-censored obs = 16
Explanatory variable Exp. sign Coef. P > | t | Sig. Elasticity
Property area (ha) + / - 0.17 0.001 *** 1.4
% net income from grazing + / - 7.91 0.819
Years experience farming + / - -13.51 0.888
Local group involvement + -557.42 0.625
Formal education + / - 2,174.98 0.022 ** 4.6
Place attachment + / - 4,671.16 0.066 * 11.3
Profitability + / - 1,389.36 0.415
Equity ratio + -694.08 0.690
% income from farm business + / - -136.75 0.902
Perceived contribution to goals + 996.04 0.556
Perceived commons problem + / - 1,409.66 0.008 *** 2.0
Expected future district adoption + / - 732.41 0.733
Trust in subregional body + / - 5,451.94 0.016 ** 13.5
Trust in regional body + / - -1,942.16 0.446
Trust in gov't commitment to community empowerment + / - 819.90 0.587
Trust in government integrity + / - -1,712.71 0.314
Trust in regional/subregional autonomy + / - -3,231.30 0.074 * -6.9
Constant + / - -35,030.76 0.082 *
*, ** and *** indicate that the hypothesis associated with the explanatory variable is supported at the 90%, 95% and 99% confidence level, respectively. na ~ not applicable. nc ~ unable to calculate.

143
Table B.5: Double-censored regression model for fencing to land type for grazing LR chi2(17) = 53.1 Total no. obs = 108
Prob > chi2 = 0.000 No. left-censored obs = 35
Log likelihood = -535.0 No. right-censored obs = 21
Explanatory variable Exp. sign Coef. P > | t | Sig. Elasticity
Property area (ha) + / - 0.02 0.173
% net income from grazing + / - 19.68 0.231
Years experience farming + / - 1.26 0.974
Local group involvement + 566.71 0.251
Formal education + / - 828.45 0.031 ** 6.3
Place attachment + / - -645.90 0.516
Profitability + / - 879.90 0.194
Equity ratio + -468.92 0.437
% income from farm business + / - -297.59 0.470
Perceived contribution to goals + 1,486.70 0.009 *** 19.1
Perceived commons problem + / - -858.45 0.041 ** -1.2
Expected future district adoption + / - 379.13 0.565
Trust in subregional body + / - 4,056.85 0.000 *** 37.0
Trust in regional body + / - -2,866.76 0.006 *** -25.0
Trust in gov't commitment to community empowerment + / - 290.37 0.605
Trust in government integrity + / - -1,555.77 0.013 ** -14.1
Trust in regional/subregional autonomy + / - -275.83 0.707
Constant + / - -9,903.78 0.151
Table B.6: Double-censored regression model for property management planning
LR chi2(17) = 43.2 Total no. obs = 88
Prob > chi2 = 0.001 No. left-censored obs = 25
Log likelihood = -216.1 No. right-censored obs = 45
Explanatory variable Exp. sign Coef. P > | t | Sig. Elasticity
Property area (ha) + / - 0.49 0.000 *** 1.3
% net income from grazing + / - 39.56 0.143
Years experience farming + / - 130.23 0.179
Local group involvement + 1,111.19 0.199 * 0.2
Formal education + / - 819.13 0.341
Place attachment + / - 2,431.24 0.244
Profitability + / - -3,221.67 0.029 ** -2.3
Equity ratio + 2,168.69 0.154 * 1.4
% income from farm business + / - -1,095.36 0.279
Perceived contribution to goals + 2,656.04 0.015 *** 2.5
Perceived commons problem + / - -5.25 0.993
Expected future district adoption + / - 86.06 0.947
Trust in subregional body + / - 913.72 0.649
Trust in regional body + / - -4,263.20 0.054 * -3.2
Trust in gov't commitment to community empowerment + / - -201.51 0.851
Trust in government integrity + / - -1,731.59 0.168
Trust in regional/subregional autonomy + / - 2,721.22 0.097 * 1.9
Constant + / - -13,396.43 0.378
*, ** and *** indicate that the hypothesis associated with the explanatory variable is supported at the 90%, 95% and 99% confidence level, respectively. na ~ not applicable. nc ~ unable to calculate.

144
Table B.7: Double-censored regression model for minimum or zero tillage cropping LR chi2(17) = 19.6 Total no. obs = 75
Prob > chi2 = 0.297 No. left-censored obs = 9
Log likelihood = -491.5 No. right-censored obs = 2
Explanatory variable Exp. sign Coef. P > | t | Sig. Elasticity
Property area (ha) + / - 0.00 0.722
% net income from grazing + / - 1.73 0.378
Years experience farming + / - 8.04 0.152
Local group involvement + -39.38 0.485
Formal education + / - 78.19 0.111
Place attachment + / - 47.39 0.731
Profitability + / - 246.43 0.026 ** 39.2
Equity ratio + 5.86 0.947
% income from farm business + / - -27.62 0.659
Perceived contribution to goals + 277.23 0.015 *** 75.0
Perceived commons problem + / - -9.62 0.797
Expected future district adoption + / - 163.67 0.150
Trust in subregional body + / - 64.29 0.636
Trust in regional body + / - 82.79 0.536
Trust in gov't commitment to community empowerment + / - 110.68 0.189
Trust in government integrity + / - 132.44 0.164
Trust in regional/subregional autonomy + / - 59.48 0.571
Constant + / - -5,010.50 0.001 ***
*, ** and *** indicate that the hypothesis associated with the explanatory variable is supported at the 90%, 95% and 99% confidence level, respectively. na ~ not applicable. nc ~ unable to calculate.

145
Appendix C: Regression results for the Mallee Region dryland case Table C.1: Double-censored regression model for link patches of native vegetation
LR chi2(16) = 37.6 Total no. obs = 128
Prob > chi2 = 0.002 No. left-censored obs = 66
Log likelihood = -330.0 No. right-censored obs = 2
Explanatory variable Exp. sign Coef. P > | t | Sig. Elasticity
Property area (ha) + / - 0.00 0.094 * nc
% net income from grazing + / - 0.45 0.092 * nc
Years experience farming + / - -0.20 0.578
Local group involvement + 0.80 0.834
Formal education + / - 0.61 0.846
Place attachment + / - -7.75 0.262
Profitability + / - -7.90 0.135
Equity ratio + -1.43 0.778
% income from farm business + / - 3.93 0.316
Perceived contribution to goals + 7.74 0.027 ** nc
Perceived commons problem + / - -1.24 0.423
Expected future district adoption + / - 14.51 0.005 *** nc
Trust in subregional body na
Trust in regional body + / - 12.36 0.016 ** nc
Trust in gov't commitment to community empowerment + / - -0.35 0.937
Trust in government integrity + / - 3.79 0.491
Trust in regional/subregional autonomy + / - -9.51 0.053 * nc
Constant + / - -59.82 0.214
Table C.2: Double-censored regression model for remove grazing pressure from native vegetation
LR chi2(16) = 16.3 Total no. obs = 111
Prob > chi2 = 0.431 No. left-censored obs = 60
Log likelihood = -367.5 No. right-censored obs = 3
Explanatory variable Exp. sign Coef. P > | t | Sig. Elasticity
Property area (ha) + / - 0.03 0.155
% net income from grazing + / - -1.94 0.326
Years experience farming + / - 0.25 0.930
Local group involvement + -11.86 0.700
Formal education + / - 36.62 0.166
Place attachment + / - -92.83 0.202
Profitability + / - 62.85 0.135
Equity ratio + -26.52 0.536
% income from farm business + / - -53.84 0.134
Perceived contribution to goals + 32.75 0.229
Perceived commons problem + / - 1.31 0.936
Expected future district adoption + / - 56.79 0.190
Trust in subregional body na
Trust in regional body + / - 16.78 0.726
Trust in gov't commitment to community empowerment + / - -66.35 0.091 * nc
Trust in government integrity + / - 89.37 0.085 * nc
Trust in regional/subregional autonomy + / - -32.84 0.456
Constant + / - -139.42 0.683
*, ** and *** indicate that the hypothesis associated with the explanatory variable is supported at the 90%, 95% and 99% confidence level, respectively. na ~ not applicable. nc ~ unable to calculate.

146
Table C.3: Double-censored regression model for control environmental weeds LR chi2(16) = 43.6 Total no. obs = 216
Prob > chi2 = 0.000 No. left-censored obs = 71
Log likelihood = -488.6 No. right-censored obs = 95
Explanatory variable Exp. sign Coef. P > | t | Sig. Elasticity
Property area (ha) + / - -0.05 0.112
% net income from grazing + / - -0.14 0.963
Years experience farming + / - 2.41 0.608
Local group involvement + 97.63 0.043 ** 1.8
Formal education + / - 11.58 0.796
Place attachment + / - 62.95 0.506
Profitability + / - 149.98 0.023 ** 7.6
Equity ratio + -148.38 0.022
% income from farm business + / - -36.19 0.460
Perceived contribution to goals + 103.91 0.075 ** 8.2
Perceived commons problem + / - 58.20 0.012 ** 2.8
Expected future district adoption + / - 235.11 0.001 *** 10.7
Trust in subregional body na
Trust in regional body + / - 18.11 0.816
Trust in gov't commitment to community empowerment + / - 45.27 0.412
Trust in government integrity + / - -72.15 0.340
Trust in regional/subregional autonomy + / - 66.36 0.289
Constant + / - -1,619.29 0.010 **
Table C.4: Double-censored regression model for establish high water-use plants
LR chi2(16) = 33.4 Total no. obs = 153
Prob > chi2 = 0.007 No. left-censored obs = 77
Log likelihood = -537.5 No. right-censored obs = 4
Explanatory variable Exp. sign Coef. P > | t | Sig. Elasticity
Property area (ha) + / - 0.02 0.110
% net income from grazing + / - -0.95 0.572
Years experience farming + / - -2.53 0.306
Local group involvement + -15.41 0.503
Formal education + / - -10.77 0.645
Place attachment + / - 19.43 0.671
Profitability + / - -35.36 0.274
Equity ratio + -2.31 0.945
% income from farm business + / - 1.30 0.961
Perceived contribution to goals + 51.91 0.064 ** nc
Perceived commons problem + / - -11.48 0.473
Expected future district adoption + / - 123.03 0.001 *** nc
Trust in subregional body na
Trust in regional body + / - -33.22 0.387
Trust in gov't commitment to community empowerment + / - 31.34 0.238
Trust in government integrity + / - 28.49 0.450
Trust in regional/subregional autonomy + / - 1.85 0.953
Constant + / - -526.58 0.084 *
*, ** and *** indicate that the hypothesis associated with the explanatory variable is supported at the 90%, 95% and 99% confidence level, respectively. na ~ not applicable. nc ~ unable to calculate.

147
Table C.5: Double-censored regression model for continuous cropping LR chi2(16) = 44.6 Total no. obs = 194
Prob > chi2 = 0.000 No. left-censored obs = 57
Log likelihood = -948.4 No. right-censored obs = 26
Explanatory variable Exp. sign Coef. P > | t | Sig. Elasticity
Property area (ha) + / - 0.06 0.069 * 1.8
% net income from grazing + / - -3.41 0.388
Years experience farming + / - -13.70 0.023 ** -5.7
Local group involvement + -31.14 0.589
Formal education + / - -41.81 0.465
Place attachment + / - -138.96 0.295
Profitability + / - -136.24 0.101
Equity ratio + 70.10 0.373
% income from farm business + / - 141.36 0.033 ** 7.5
Perceived contribution to goals + 124.78 0.011 *** 6.7
Perceived commons problem + / - 44.71 0.295
Expected future district adoption + / - 323.50 0.006 *** 13.2
Trust in subregional body na
Trust in regional body + / - 68.25 0.484
Trust in gov't commitment to community empowerment + / - 82.46 0.235
Trust in government integrity + / - -1.12 0.990
Trust in regional/subregional autonomy + / - 23.98 0.761
Constant + / - -1,407.32 0.096 *
Table C.6: Double-censored regression models for control pest animals
LR chi2(16) = 30.2 Total no. obs = 215
Prob > chi2 = 0.017 No. left-censored obs = 65
Log likelihood = -492.1 No. right-censored obs = 99
Explanatory variable Exp. sign Coef. P > | t | Sig. Elasticity
Property area (ha) + / - -0.02 0.535
% net income from grazing + / - -2.93 0.300
Years experience farming + / - -0.18 0.965
Local group involvement + 65.64 0.115 * 0.8
Formal education + / - 12.62 0.756
Place attachment + / - 78.07 0.348
Profitability + / - 16.41 0.779
Equity ratio + -38.38 0.501
% income from farm business + / - -9.90 0.822
Perceived contribution to goals + 4.71 0.919
Perceived commons problem + / - 28.70 0.157
Expected future district adoption + / - 222.30 0.000 *** 6.4
Trust in subregional body na
Trust in regional body + / - 52.63 0.452
Trust in gov't commitment to community empowerment + / - 56.49 0.244
Trust in government integrity + / - -13.22 0.845
Trust in regional/subregional autonomy + / - 36.21 0.507
Constant + / - -1,182.69 0.028 **
*, ** and *** indicate that the hypothesis associated with the explanatory variable is supported at the 90%, 95% and 99% confidence level, respectively. na ~ not applicable. nc ~ unable to calculate.
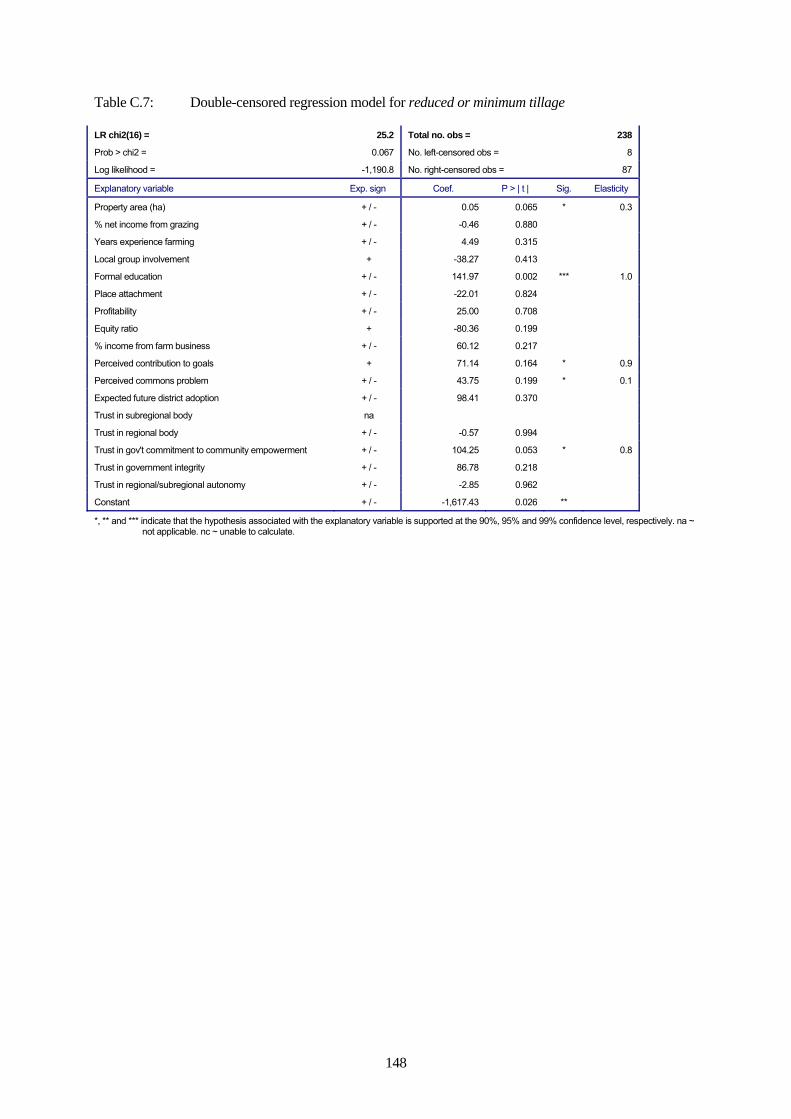
148
Table C.7: Double-censored regression model for reduced or minimum tillage LR chi2(16) = 25.2 Total no. obs = 238
Prob > chi2 = 0.067 No. left-censored obs = 8
Log likelihood = -1,190.8 No. right-censored obs = 87
Explanatory variable Exp. sign Coef. P > | t | Sig. Elasticity
Property area (ha) + / - 0.05 0.065 * 0.3
% net income from grazing + / - -0.46 0.880
Years experience farming + / - 4.49 0.315
Local group involvement + -38.27 0.413
Formal education + / - 141.97 0.002 *** 1.0
Place attachment + / - -22.01 0.824
Profitability + / - 25.00 0.708
Equity ratio + -80.36 0.199
% income from farm business + / - 60.12 0.217
Perceived contribution to goals + 71.14 0.164 * 0.9
Perceived commons problem + / - 43.75 0.199 * 0.1
Expected future district adoption + / - 98.41 0.370
Trust in subregional body na
Trust in regional body + / - -0.57 0.994
Trust in gov't commitment to community empowerment + / - 104.25 0.053 * 0.8
Trust in government integrity + / - 86.78 0.218
Trust in regional/subregional autonomy + / - -2.85 0.962
Constant + / - -1,617.43 0.026 **
*, ** and *** indicate that the hypothesis associated with the explanatory variable is supported at the 90%, 95% and 99% confidence level, respectively. na ~ not applicable. nc ~ unable to calculate.