community-based natural resource management in oregon: a
TRANSCRIPT

Community-based natural resource management in Oregon: a profile of organizational capacity
E C O S Y S T E M W O R K F O R C E P R O G R A M W O R K I N G P A P E R N U M B E R 3 9
EMILY JANE DAVIS, CASSANDRA MOSELEY, CODY EVERS, KATE
MACFARLAND, MAX NIELSEN-PINCUS, ALAINA POMEROY, AND MAIA J. ENZER
SUMMER 2012

About the authorsEmily Jane Davis is a faculty research associate at the Ecosystem Workforce Program, Institute for a Sustainable Environment, University of Oregon.
Cassandra Moseley is director of the Ecosystem Workforce Program, Institute for a Sustainable Environment, University of Oregon.
Cody Evers is a faculty research assistant at the Ecosystem Workforce Program, Institute for a Sustainable Environment, University of Oregon
Kate MacFarland was a faculty research assistant at the Ecosystem Workforce Program, Institute for a Sustainable Environment, University of Oregon
Max Nielsen-Pincus is a faculty research associate at the Ecosystem Workforce Program, Institute for a Sustainable Environment, University of Oregon
Alaina Pomeroy is a program associate at Sustainable Northwest
Maia J. Enzer is the policy program director at Sustainable Northwest
About the Dry Forest Investment ZoneThe Dry Forest Investment Zone (DFZ) is a five-year project to address common natural resource-based economic development challenges through increased networking and capacity building at a regional scale. Sustainable Northwest leads this project in partnership with Wallowa Resources in northeastern Oregon, the Watershed Research and Training Center in northern California, and the Ecosystem Workforce Pro-gram at the University of Oregon. The central components of the DFZ strategy are: 1) To build strong local nonprofit organizations and collaborative processes to achieve forest and economic resilience, 2) Create multiple value streams from land management and incentives for forest restoration and stewardship, 3) Develop integrated biomass utilization and renewable energy; and 4) Create the policy conditions to sup-port sustainable forest stewardship on public and private lands.
AcknowledgementsThis study was made possible with funding from the US Endowment for Forestry and Communities and USDA Rural Development. We thank those who responded to our survey.
Photo credits: Front cover, page 1, page 2, Emily Jane Davis—Ecosystem Workforce Program; front cover inset, page 6, back cover, Caleb Dean—Sustainable Northwest.
Map credits: Liz Podowski and Autumn Ellison
For additional information about the Dry ForestInvestment Zone project and its partners:Sustainable Northwest813 SW Alder Street, Suite 500Portland OR 97205-3113503-221-6911info@sustainablenorthwest.orgsustainablenorthwest.org/programs/dfiz
An equal-opportunity, affirmative-action institution committed to cultural diversity and compliance with the Americans with Disabilities Act. This publication will be made available in accessible formats upon request. ©2012 University of Oregon DES0712-044bb-C50211
For more information about this report:Ecosystem Workforce ProgramInstitute for a Sustainable Environment5247 University of OregonEugene OR [email protected]

Executive summary
Community-based organizations (CBOs) in Oregon are fostering natural resource man-agement and economic development, par-
ticularly in public lands communities where the capacity of federal agencies, businesses, and others has dwindled. They have also become integral in reducing social conflict over land management and seeking community economic wellbeing. CBOs in-clude non-governmental organizations and collab-orative groups. These groups have broad missions that are grounded in local needs and integrate a number of priorities, but tend to have smaller staff and budgets than other groups such as environmen-tal advocacy organizations. Little is known about how CBOs accomplish a range of goals with limited resources. This study examined the organizational capacity of Oregon’s CBOs to build understanding of their financial and human resources, and their external relationships. It is part of a larger study of CBOs across the US West.
First, we found that CBOs tended to have limited and uncertain financial capacity. Over two-thirds of the study CBOs had a budget of $250,000 or less. About three-quarters had a budget of $500,000 or less. No CBOs in our survey had more than a year of fiscal reserves; and most had less than three
months. Informal groups were more likely than nonprofits to have smaller budgets and fewer re-serves. In addition, CBOs largely relied on federal and foundation grants, making them vulnerable to shifts in federal policies and appropriations, and philanthropic funder priorities. Organizations without 501(c)3 status may be even more vulnerable than nonprofits because they are often ineligible for foundation funding, and tend to have less diver-sity in their funding sources. At any given point in time, the fiscal future of CBOs doing crucial work in Oregon’s rural communities can be uncertain.
Second, CBOs are small organizations that rely on a few staff members to perform a great range of functions. Seventy percent of Oregon CBOs had an executive director, but less than half had any other type of position that we surveyed for; thus, execu-tive directors likely perform many functions for their organizations. We also found that more than half of the Oregon CBOs with executive directors paid them $45,000 or less per year. Over half of the CBOs surveyed had at least some full time staff. Seventy percent had at least some part time staff. However, 21 percent had only part-time staff. Vol-unteers are also significant to Oregon CBOs’ capac-ity. About 21 percent of all Oregon CBOs surveyed

2 Community-basednaturalresourcemanagementinOregon:aprofileoforganizationalcapacity
had no paid staff at all and used only volunteers to accomplish their work. CBOs may also draw on the human resources of their decision-making bodies by having members that have specific skills such as fiscal or project management, or by contracting out services that they may not need regularly. In gen-eral, CBOs often rely on the talents and resources of a few people, including volunteers, which can pose challenges when there are staff or leadership transitions.
Third, CBOs draw on both diverse and deep part-nerships to accomplish their work. CBOs most com-monly partnered with federal agencies and other CBOs, which reflects missions related to public
lands management. CBOs used these partnership to both give and receive assistance. CBOs tended to receive technical assistance from the USDA Forest Service and from volunteers for specialized activi-ties such as training workshops, GIS and scientific analysis, and legal assistance. They tended to pro-vide skills such as facilitation, staff services, and policy advocacy to others. In particular, we found that CBOs played significant roles in collaboration. About half of the Oregon CBOs surveyed identified themselves as a collaborative group, and/or provid-ed services to a collaborative group. Although the nonprofits surveyed gave a good deal of technical assistance to collaborative processes, 46 percent of them were not compensated for this work.

Community-basednaturalresourcemanagementinOregon:aprofileoforganizationalcapacity3
Community-based organizations (CBOs) in Oregon are performing numerous valuable services that help “glue” together natural re-
source management and economic development at the local level. They have typically been funded to implement projects on the ground, yet research and practice increasingly suggest that organizations that can provide intermediary functions such as networking, facilitation and knowledge transfer are necessary for community and ecological resilience. However, there is little understanding of the spe-cific financial and human organizational capacities that underpin these functions. As a result, there has been increased reliance on CBOs without sustained or stable investments in their durability. As com-munity-based and collaborative approaches to natu-ral resource management continue to grow, there is a need to recognize and support local institutions and the kinds of skills that will enable improved land management and economic wellbeing. In many places in Oregon, non-governmental or-ganizations and collaborative groups have become integral in reducing social conflict over land man-agement and seeking community economic wellbe-ing (see Figure 1, page 4). CBOs have broad missions grounded in local needs and contexts. They do not readily resemble environmental advocacy organi-zations or economic development groups because they perform integrated, collaborative work with diverse stakeholders to build linked ecological and socioeconomic resilience.
Increasingly, the USDA Forest Service and other federal agencies recognize the importance of col-laboration in achieving forest management and res-toration objectives. However, there has been less emphasis on and investment in the capacities that allow CBOs to play these significant roles. CBOs accomplish their work by piecing together a variety of resources and relationships. There has been little documentation of how CBOs maintain their orga-nizational capacity. More robust understanding of CBO structures and needs could help foster consis-tent investment and durable institutional capacity in Oregon’s public lands communities, leading to improved land management outcomes. This paper helps address this gap by examining the financial, human, and network resources of CBOs in Oregon.
ApproachIn 2010, we conducted a survey of CBOs across in eleven states in the American West. We sampled 154 organizations and received responses from 92. This paper focuses only on CBOs based in the state of Oregon (See Appendix A, page 12, for a list of CBOs in Oregon contacted for this survey). Oregon CBOs composed 22 percent of all survey respondents.
We define a CBO as an entity that has a locally-oriented mission that includes natural resource management. CBOs include nonprofit organiza-tions with 501(c)3 status and informal collabora-tive groups that do not fit into easily-identifiable categories. For the purposes of this study, they do not include watershed councils or local goverment institutions. We identified CBOs by obtaining list-serves from Sustainable Northwest and the Nation-al Forest Foundation, two intermediaries that work with many CBOs. We also asked key informants to provide additional names, and conducted an online search. We considered this study to be a pilot, and therefore the list may not be comprehensive.
We analyzed results based on respondents’ self-identified nonprofit status because official status has important implications for accessing funding and other capacities. We describe groups that do not and are not seeking nonprofit status as informal groups. We use the term “CBOs” to refer to both nonprofit and informal groups.
What CBOs doIn our west-wide study, we looked at the mission ar-eas and strategies of CBOs. Oregon CBOs are similar to others found across the west. CBOs typically have broad missions dedicated to sustainable natural re-source use, economic development, and environ-mental stewardship. More than three-quarters of the CBOs surveyed in Oregon work on public lands forest and watershed management issues. More than half of the CBOs in Oregon work at the watershed scale. Their most common activities include imple-menting natural resource management projects, col-laboration and facilitation, and education.

4 Community-basednaturalresourcemanagementinOregon:aprofileoforganizationalcapacity
§̈¦
§̈¦
§̈¦
§̈¦"
"
"
" "
"
§̈¦
"
This map was completed through discussions with CBOs and intermediary leaders in Oregon. It does not represent the organizations who responded to our survey, but rather is an attempt to provide a comprehensive map of all CBOs active in Oregon as of spring 2012.
Blue Mountains Forest Partners
Breitenbush Special Forest Products Group
Central Oregon Partnerships for Wildfire Risk Reduction
Crook County Natural Resources Committee
Harney County Restoration Collaborative
Lakeview Stewardship Group
Ochoco Forest Restoration Collaborative (emerging)
Southern Oregon Forest Restoration Collaborative
Umatilla Forest Collaborative Group
Wallowa-Whitman National Forest Collaborative (emerging)
Alsea Stewardship Group
Applegate Partnership
Clackamas Stewardship Partners
Hebo Stewardship Group
Josephine County Stewardship Group
Mary’s Peak Stewardship Group
McKenzie Collaborative Group
Siuslaw Stewardship Group
Sweet Home All Lands Collaborative
Wallowa County NRAC
Baker County Small Woodland Owners
Klamath-Lake Forest Health Partnership
CFLR project areas
Community-based natural resource organizations
Interstates
BLM Lands
US Forest Service Lands
Public lands collaboratives All lands collaboratives
Private nonindustrial lands collaboratives
Portland
Salem
Eugene
Medford
Bend
California Nevada
Oregon
Washington
Idaho
Figure 1 Community-based natural resource management organizations and collaborative capacity in Oregon

Community-basednaturalresourcemanagementinOregon:aprofileoforganizationalcapacity5
No financial reserveLess than 3 monthsLess than 6 monthsMore than 6 monthsVariable/Don’t know
3060691318
4060602020
2361761115
Percent of organizations
All Nonprofit Informal
the U.S. west, as our west-wide survey showed that only 27 percent of all nonprofits had budgets under $500,000.
In addition to their small budgets, Oregon CBOs also had limited financial reserves (see Table 1, below; and Appendix B, Table B2, page 13). Fund-ing accessibility often relies on public policy and philanthropic priorities, which can change rapidly. Financial reserves can help organizations weather
gaps in funding and transi-tions, and endure unexpected events or challenges. None of the Oregon CBOs surveyed had more than a year of finan-cial reserves. Thirty percent
had no financial reserve. Informal organizations were less likely than nonprofits to have reserves.
Funding sources are important to an organization’s stability and its direction. We found that both non-profit and informal CBOs derive about half of their
$0–50,000
$51,000–100,000
$101,000–250,000
$251,000–500,000
$501,000–1,000,000
$1,000,000+
Don’t know
Informal Nonprofit
Financial capacityFinancial capacity includes financial resources and fiscal management systems. Organizations with smaller budgets may be constrained in building staff capacity, and may spread a few people thin to achieve their diverse goals. They may also rely heavily on partnerships and networks to access external capacity where their internal capacity is lacking. In this study, we focused on the size and diversity of CBO funding. We found that more than two-thirds of the study CBOs had a budget of $250,000 or less. Of these, 80 percent were informal groups. They are smaller than many environ-mental advocacy or economic development organizations. Eighty percent of infor-mal groups and 69 percent of nonprofit organiza-tions reported having a budget of $500,000 or less (see Figure 2, below; and Appendix B, Table B1, page 13). Nonprofit CBOs in Oregon appeared to have smaller budgets than nonprofit CBOs across
More than two-thirds of CBOs had a budget of
$250,000 or less.
Figure 2 Comparison of annual budgets of nonprofit and informal groups
Table 1 Financial reserves
$0–50,000
$51,000–100,000
$101,000–250,000
$251,000–500,000
$501,000–1,000,000
$1,000,000+
Don’t know
40%
20%
20%
10%10%
23%23%
15%
8%8%
23%
0%
0%
0%

6 Community-basednaturalresourcemanagementinOregon:aprofileoforganizationalcapacity
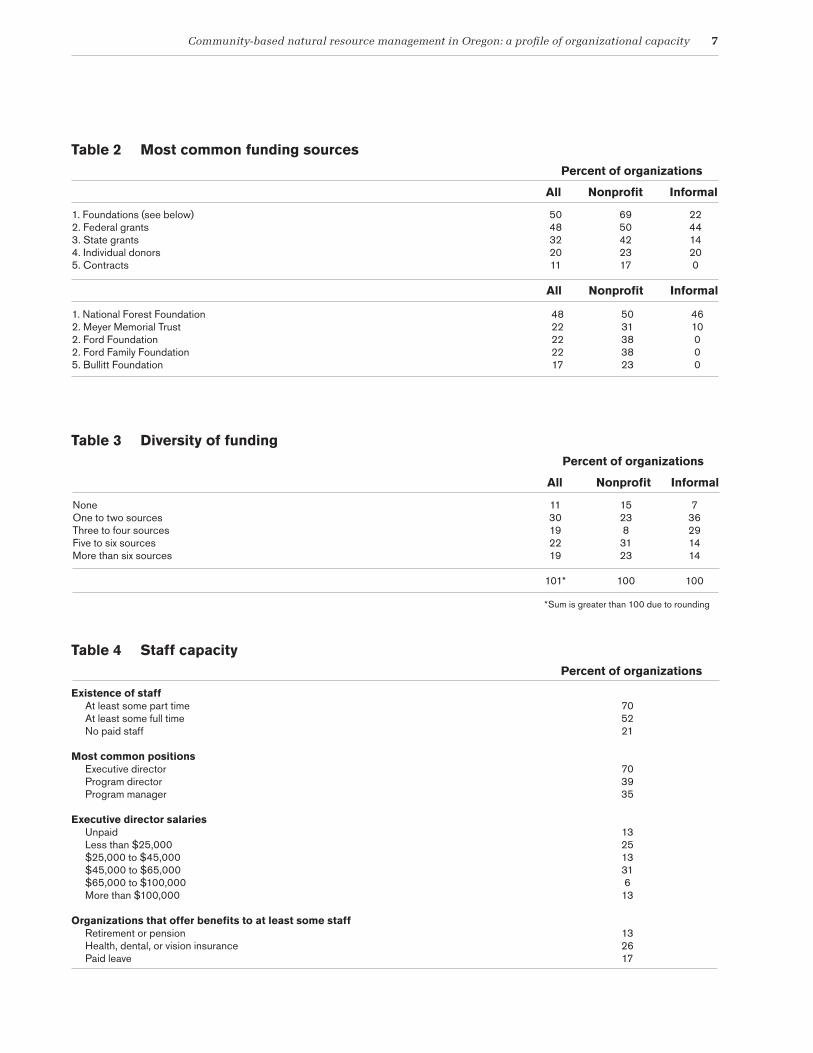
budgets from federal grants and foundations (see Table 2, page 7; and Appendix B, Table B3, page 13). Federal grants are likely important due to the high proportions of federal land in many of the areas where CBOs are active. For example, federal agen-cies may draw on the technical or labor capacities of CBOs by using grants and agreements for a range of activities, such as collaborative facilitation and project planning. Opportuni-ties for federal funding depend on appropriations and policy changes, which means that there may be fluctuations in availability of resources from the agencies.
Oregon CBOs also relied on foundations for signifi-cant amounts of their budget. This was especially true for nonprofits, who obtain an average of 69 percent of their budgets from foundations. Infor-mal groups obtained 22 percent of their funding from this source. Of the informal groups that had foundation support, nearly half of this support was from one source—the National Forest Foundation. This indicates that many informal groups had not attracted diverse foundation investments in their work—a similar finding to our west-wide survey. The most common source of foundation funding for informal groups and non-profits was the National
Forest Foundation, which had funded nearly half of the CBOs surveyed. This was followed by the Meyer Memorial Trust (which only invests in Or-egon-based organizations), Ford Foundation, and Ford Family Foundation. Foundation funding can
provide organizations with multi-year investments, but can be subject to shifts in di-rection and priorities.
Funding diversity can also inf luence the resilience of CBOs. CBOs that have long relied on a small number of fund-ing sources may be less adaptable in chang-ing circumstances, and less familiar with a range of possible funders and their interests. We found that 30 percent of Oregon CBOs report-ed having only one to two sources of funding (see Table 3, page 7; and Appendix B, Table B4, page 14). However, 40 percent had five or more sources. Further broken down, over half of the nonprofits had five or more sources of funding, while only 28 percent of informal groups did. This indicates that some Oregon CBOs, and particularly nonprofits, are fairly diversified in their funding. Even if they are not drawing much from all their sources, having this diversity of funders means that CBOs may at least have experience with a range of funders, and may have relationships that they could build or ex-
None of the CBOs had more than a year of financial reserves.
Community-basednaturalresourcemanagementinOregon:aprofileoforganizationalcapacity7
Percent of organizations
All Nonprofit Informal
NoneOne to two sourcesThree to four sourcesFive to six sourcesMore than six sources
1130192219
101*
15238
3123
100
736291414
100
Percent of organizations
All Nonprofit Informal
1. Foundations (see below)2. Federal grants3. State grants4. Individual donors5. Contracts
All Nonprofit Informal
1. National Forest Foundation2. Meyer Memorial Trust2. Ford Foundation2. Ford Family Foundation5. Bullitt Foundation
5048322011
6950422317
224414200
4822222217
5031383823
4610000
Percent of organizations
Existence of staff At least some part time At least some full time No paid staff
Most common positions Executive director Program director Program manager
Executive director salaries Unpaid Less than $25,000 $25,000 to $45,000 $45,000 to $65,000 $65,000 to $100,000 More than $100,000
Organizations that offer benefits to at least some staff Retirement or pension Health, dental, or vision insurance Paid leave
705221
703935
13251331613
132617
Table 2 Most common funding sources
Table 3 Diversity of funding
Table 4 Staff capacity
*Sum is greater than 100 due to rounding

8 Community-basednaturalresourcemanagementinOregon:aprofileoforganizationalcapacity
pand in the future. Informal groups with a lower diversity of funding sources may be more vulner-able to shifts in funder priorities, and have fewer relationships, especially with individual donors, on which they could draw for support.
Staff capacityStrong human resources are crucial to the capacity of CBOs. With limited funding and rural locations, it may be difficult for some CBOs to recruit and retain skilled staff. CBOs may take different approaches to staff-ing depending on their size and resources. Some CBOs may have program-specific staff, and others may have a few staff performing a wide range of tasks. We examined the types of staff that Oregon CBOs had and their compensation to better under-stand their management capacities.
Staff positionsWe found that 70 percent of Oregon CBOs had an executive director, but less than half had any other positions that we surveyed for (see Table 4, page 7; and Appendix B, Table B5, page 14). Less than 20 percent of these CBOs had positions such as opera-tions managers, development directors, or informa-tion technology managers. This suggests that Oregon CBOs often have one or a few staff, and that some executive directors likely try to accomplish diverse objectives while managing in-ternal organizational functions. This could lead to extensive de-mands on and burnout among these leaders. Moreover, when an executive director “is” the organization, all of that organization’s relationships can be highly dependent on that person. The ability to offer full-time employment is another component of organizational capacity. It can be dif-ficult for small organizations to acquire adequate resources for dedicated full-time positions. How-ever, over half of the Oregon CBOs surveyed had at least some full-time staff. Seventy percent had at least some part-time staff. We also found that about half of Oregon CBOs had both full and part-time staff (see Table 4, page 7; and Appendix B, Table B6, page 14), while 21 percent had only part-time staff.
Staff salaries and benefitsCompensation is another important dimension of staff capacity (see Appendix B, Table B5, page 14). CBOs that can offer higher salaries may be able to
attract more skilled directors and staff. We found that more than half of the Oregon CBOs with executive directors pay them $45,000 or less per year (see Table 4, page 7). This may
not be a very competitive salary for an executive director that has many roles and responsibilities, and few if any support staff. Volunteers are also significant to Oregon CBOs’ capacity. Twenty-one percent of all Oregon CBOs surveyed had no paid staff and used only volun-teers. We also found that several types of positions were often unpaid. For example, every CBO with an information technology manager reported that it was an unpaid job. More than half of the CBOs who had development directors did not pay them. This may be due to a lack of funding that can be used to support these specific kinds of in-house capacities. CBOs with unpaid positions rely on individuals who choose to give their time, and may lose these capacities if they cease to volunteer.
Benefits can be another important factor in attract-ing skilled staff. Benefits packages may help make
low salary positions more fea-sible for staff. However, it can be difficult for small organiza-tions to obtain enough fund-ing to support positions with benefits. Our survey found that
less than 20 percent of Oregon CBOs offered paid leave or retirement benefits (see Appendix B, Table B7, page 15). About one quarter provided health, dental, or vision insurance.
Internal operational functionsThe functions that a CBO is able to perform are key to their capacity. We examined if CBOs conducted their operational functions with in-house or outside actors; and if the skills for these functions tended to be found in staff, volunteers, or decision-making bodies such as boards of directors.
Twenty-one percent of all CBOs relied only on
volunteers.
Many informal groups had not attracted
foundation funding.

Community-basednaturalresourcemanagementinOregon:aprofileoforganizationalcapacity9
We found that most Oregon CBOs (>70 percent) performed financial management, strategic plan-ning, and operational/organizational management in-house (see Appendix B, Table B8, page 15). More than half of the surveyed CBOs also performed fa-cilitation and fundraising in-house.
Skills that more CBOs tended to receive from out-side sources were technical and included GIS and other mapping services and training workshops. This may indicate that CBOs need “systems ca-pacities” such as financial and organizational management on a more regular basis than special-ized technical skills like GIS. When CBOs go out of house to obtain services—such as attending train-ing workshops—they may also benefit from the op-portunity to network and learn with other similar organizations. As we found, many CBOs had one or a few staff performing a range of roles. However, CBOs may augment their staff resources by having technical skills represented on their boards of directors or other decision-making bodies. More than 70 per-cent of Oregon CBOs had project, fiscal/financial, and organizational management skills on their de-cision-making bodies (see Appendix B, Table B9, page 16). More than half of these groups also had communications, fundraising, and policy skills represented. Boards of directors may contribute substantial volunteer hours and resources to small organizations.
Small organizations may also seek assistance by contracting out services. This may allow organi-zations that cannot afford to support a full staff position to still accomplish specific tasks. However, organizations doing this could miss opportunities to develop committed and skilled in-house human resources. Contracting out services was far more common among informal groups. Half of the infor-mal CBOs surveyed reported using three-quarters or more of their budgets for contracted services (see Appendix B, Table B10, page 16). In contrast, only 15 percent of nonprofits used three-quarters or more of their budgets for contracting.
External relationshipsSmall organizations may also derive resources and skills from their partnerships and networks, par-ticularly when their in-house capacities are limited. Additionally, some may provide important services or skills to partners; e.g., to land management agen-cies that want to take collaborative approaches, but have limited time or are not allowed to lead col-laboration. We examined with whom Oregon CBOs partner, and how they use these relationships to provide and procure various forms of technical ssistance. PartnershipsAll CBOs in this survey partnered with federal agencies a great deal (see Table 5, page 10; and Ap-pendix B, Table B11, page 16). This likely reflects the prevalence of public lands in Oregon and the importance of public land management to commu-nity resilience. About three-quarters of these CBOs also partnered extensively with other CBOs. CBO leaders may be learning and benefiting from their relationships with others who have similar roles and capacities but operate in different landscapes. Sixty-eight percent of the CBOs in this survey also partnered a great deal with county agencies. In many public lands communities, the county is the primary unit of government and often interfaces with federal agencies around forest management.
Further, more than half of the surveyed CBOs iden-tified collaborative groups, conservation or envi-ronmental organizations, universities or research entities, state agencies, or private ranchland owners as important partners. This suggests that numerous partnerships are significant to CBOs’ missions, and that they do not merely work with a few interests. The least common partners for Oregon CBOs were economic development organizations and tribal agencies. This may suggest that CBOs conceive of economic development differently than these enti-ties, or that these entities do not have many resourc-es for conservation-based economic development.

10 Community-basednaturalresourcemanagementinOregon:aprofileoforganizationalcapacity
Technical assistance receivedOne key function of partnerships is obtaining and receiving technical assistance. More than half of the CBOs surveyed used the Forest Service as well as volunteers for a great deal of their techni-cal assistance needs. Informal groups in particu-lar tended to receive technical assistance from the Forest Service, reflecting the role that these groups likely play in public lands collaboration. In addi-tion, the importance of volunteers aligns with our other findings; namely, that CBOs accomplished their work with unpaid staff and technical assis-tance from their decision-making bodies. Informal groups were more likely to use volunteers for tech-nical assistance than non-profits.
We also examined the kinds of technical assistance that CBOs received (see Table 6, below; and Appen-
dix B, Table B8, page 15). More than half of Oregon CBOs went to outside sources for training work-shops, GIS and other mapping, scientific analysis, and legal assistance. These activities often require specialized skills and training that a small organi-zation may not have. CBOs may need these skills ad-hoc and for particular projects, rather than on a regular basis. In addition, half or more of the infor-mal groups also obtained technical assistance for staff services, program support, data collection, me-dia/communications, and policy advocacy. Some of these services are important to operational func-tion, such as staff services and program support, yet were not done not-in house. This suggests that in-formal groups may rely on a minimal structure and only invest in services as needed. They may also draw on nonprofits, which may act as intermediar-ies and service providers, for technical assistance.
Percent of organizations
All Nonprofit Informal
Most common partners 1. Federal agencies 2. Community-based organizations 3. County agencies
Most common sources of technical assistance 1. USDA Forest Service 1. Volunteers 3. Nonprofits/community-based organizations
1007468
575741
1008558
384642
1006080
807040
Percent of organizations
All Nonprofit Informal
Most common technical assistance received 1. Training workshops 2. Scientific analysis 3. GIS or other mapping services 3. Legal assistance
Most common technical assistance given 1. Facilitation 2. Training and workshops 3. Staff services 3. Policy advocacy
65575252
48433535
85465462
54624631
40705040
40202040
Table 5 Partnerships and sources of technical assistance
Table 6 Types of technical assistance received and given

Community-basednaturalresourcemanagementinOregon:aprofileoforganizationalcapacity11
Technical assistance providedWe examined the types of technical assistance that Oregon CBOs provided to others (see Table 6, page 10; and Appendix B, Table B8, page 15). The most common type of assistance given was facilitation (48 percent), and the second most common was training workshops (43 percent). This indicates that CBOs may play important intermediary roles in bringing together diverse stakeholders and helping others build their skills. The number of CBOs giv-ing all other types of assistance that we surveyed for was lower. For example, less than 20 percent of all CBOs provided services for fundraising, fiscal man-agement, GIS, scientific analysis, contractor man-agement, web management, media/communications, or legal assistance to others.
More nonprofits than informal groups provided var-ious types of technical assistance. With the excep-tion of facilitation, shuttle diplomacy, and policy advocacy, fewer than 20 percent of the informal groups gave any of the types of technical assistance covered in this survey. This may be because they are smaller organizations that tend to use outside services more frequently than nonprofits to accom-plish their goals.
CollaborationThe Forest Service increasingly relies on collabo-ration to foster active land management. Forest Service policy and programs, such as the Healthy Forests Restoration Act and the Collaborative For-est Landscape Restoration Program, advocate using collaborative approaches, but there are few resourc-es to support collaborative capacity. We examined how Oregon CBOs are involved in collaboration, and how they are compensated for this activity.
We found that over half of the Oregon CBOs sur-veyed identified themselves as a collaborative group (see Appendix B, Table B12, page 17). One hundred percent of the informal organizations stated they were collaborative groups, and only 23 percent of nonprofits did. However, 85 percent of the non-
profit organizations indicated that they participate in a collaborative group, and 62 percent reported that they either coordinate or provide services to a collaborative group. This suggests that informal groups have formed primarily to facilitate collabo-ration, and nonprofits play strong supporting roles in coordinating and providing technical assistance to collaborative processes.
CBOs had variety of ways that they support their collaborative work (see Appendix B, Table B13, page 17). Seventy percent of all CBOs surveyed received
grants to do collaboration. Informal groups were far more likely to have grants; 90 percent of informal groups received grants in comparison to about half of the nonprofit groups. Non-profits were more likely (46
percent) than informal groups (30 percent) to use an operating surplus to fund this work. We also found that 46 percent of nonprofit groups did not receive compensation for their collaborative work, while no informal groups were uncompensated. This means that nearly half of the nonprofit CBOs in Oregon were performing important collaborative support services, but were not paid to do so.
ConclusionsDespite limited financial resources and staff capac-ity, community-based organizations across Oregon develop and rely on diverse and collaborative part-nerships to accomplish their objectives. Together, these unique non-governmental and collaborative groups foster natural resource management and economic development in public lands communi-ties by linking diverse stakeholders and advancing ecological and socioeconomic resilience. The part-nerships that CBOs participate in provide and re-ceive assistance, facilitate collaboration, and maxi-mize resources. This research provides a more ro-bust understanding of CBO capacity and needs that can help encourage consistent investment in CBOs, and create durable institutions with improved land management outcomes across the state.
Nonprofits play strong supporting roles in providing
technical assistance to collaborative processes.

12 Community-basednaturalresourcemanagementinOregon:aprofileoforganizationalcapacity
Appendix A
The following is a list of Oregon-based CBOs that we identified at the time of our survey in 2010. It is not a list of those who responded to our survey. Where contact names are listed, they are derived from organizations’ websites.
Applegate Partnership and Watershed CouncilJacksonville, Oregonhttp://www.applegatepartnership.org/Janelle Dunlevy541- 899-9982
Blue Mountains Forest PartnersJohn Day, Oregonhttp://sites.google.com/site/bluemountainsforestpartners/Mike Billman, 541-575-2929Tim Lillebo, 541-382-2616
Clackamas Stewardship PartnersClackamas, Oregonhttp://clackamasstewardshippartners.org/wp/Nathan Poage541-760-8755
Central Oregon Partnerships for Wildfire Risk Reduction/Central Oregon Intergovernmental CouncilBend, Oregonhttp://www.coic.org/copwrr/Phil Chang541-548-9534
Deschutes River ConservancyBend, Oregonhttp://www.deschutesriver.org/541- 382-4077
Forestry Action CommitteeCave Junction, Oregonhttp://www.forestryaction.org/541-592-4098
Grand Ronde Model WatershedLa Grande, Oregonhttp://www.grmw.org/541-663-0570
High Desert Partnership and Harney County Restoration CollaborativeBurns, Oregonhttp://www.highdesertpartnership.org/Hilda Allison541-573-7820
Josephine County Stewardship Grouphttp://josephinecountystewardshipgroup.com/
Klamath Basin Rangeland TrustKlamath Falls, Oregonhttp://www.kbrt.org/541-273-2189
Klamath Watershed PartnershipKlamath Falls, Oregonhttp://www.klamathpartnership.org/541-850-1717
Lomakatsi Restoration ProjectAshland, Oregonhttp://lomakatsi.org/541-488-0208
Oregon Paleo Lands InstituteFossil, Oregonhttp://www.paleolands.org/541-763-4480
Siuslaw InstituteDeadwood, Oregonhttp://www.siuslawinstitute.org/Johnny Sundstrom541-964-5901
Southern Oregon Small Diameter CollaborativeGreen Springs, Oregonhttp://pacrimrcd.org/
Upper Deschutes River CoalitionSunriver, Oregonhttp://www.udrc.org/541-390-9798
Upper Klamath Water Users Associationhttp://ukwua.com/Karl Scronce541-883-3264
Wallowa ResourcesEnterprise, Oregonhttp://www.wallowaresources.org/541-426-8053

Community-basednaturalresourcemanagementinOregon:aprofileoforganizationalcapacity13
Organization type
All Nonprofit Informal
$0-50,000$51,000-100,000$101,000-250,000$251,000-500,000$501,000-1,000,000$1,000,000+Don’t know
30172244176
100
23152388
230
100
402020001010
100
Annual budget
Organization type
All Nonprofit Informal
NoneLess than 3 monthsLess than 6 monthsLess than 1 yearMore than 1 yearIt dependsDon’t know
30309130134
100
23381580150
100
40200
2001010
100
Amount of reserve
Organization type
All Nonprofit Informal
Philanthropic foundationsFederal grantsState grantsIndividual donorsContractsBank loansFederal loansCongressional earmarksState loansProgram related investmentsPrivate investorsProduct sales
50483220116000000
69504223179000000
2244141400000000
Funding source
Table B1 Percent of organizations by annual budget
Table B2 Percent of organizations by duration of financial reserves
Table B3 Percent of organizations that receive “much” or a “good deal” of their annual operating budget from various funding types
Appendix B

14 Community-basednaturalresourcemanagementinOregon:aprofileoforganizationalcapacity
Organization type
All Nonprofit Informal
NoneOne to twoThree to fourFive to sixMore than six
1130192219
100
15238
3123
100
736291414
100
Number of funding sources
Percent of organizations paying in salary ranges
% org with unpaid 0k–25k 25k–45k 45k–65k 65k–100k >100k
Executive directorProgram directorProgram managersSeasonal staff membersOffice mangerProgram assistantsOperations managerDevelopment directorSeasonal staff membersOtherIT manager
3144132900
500000
611014000
25000
130000000000
Employee type
13111329141725502550100
253325292933252550500
130
500
575000
2500
703935303026171717174
100100100100100100100100100100100
All types of staffFull-time and part-time staffFull-time and seasonal staffOnly full-time staffOnly part-time staffPart-time and seasonal staffSeasonal staffUnknown
262655
211205
100
Employee work status Percent
Table B4 Percent of organizations by diversity of funding types that contribute “more than a little” to the organizations’ annual operating budgets
Table B5 Percent of organizations and salary scales by common staff position titles
Table B6 Percent of organizations with paid staff, percent with full-time, part-time, and seasonal staff members

Community-basednaturalresourcemanagementinOregon:aprofileoforganizationalcapacity15
Offered to
None Full time Part time All Don’t know Blank
Flexible hoursMileage reimbursementPaid leave Unpaid leaveHealth insuranceProfessional developmentRetirement or pensionLife or disability insuranceBenefits stipend
48394
2217221340
040900005
171717221717221718
Benefit type
131735353939526177
17131713261713170
49
26004000
100100100100100100100100100
Percent of organizations
All Nonprofit Informal
4839659
13265726
1317874
417834
1326784
5438698
1523698
158
1000
88
920
1523778
40406010
10304050
10307010
0307010
1030800
Functions
Facilitation Gave Received Done in-house Not applicable Fundraising Gave Received Done in-house Not applicable Fiscal management Gave Received Done in-house Not applicable Operations Gave Received Done in-house Not applicable Strategic planning Gave Received Done in-house Not applicable
Table B7 Percent of organizations with staff members who receive various benefits
Table B8 Organizational functions by percent of organizations that provide them to other groups, receive them from other groups, or do them in-house

16 Community-basednaturalresourcemanagementinOregon:aprofileoforganizationalcapacity
Percent of organizations
All Nonprofit Informal
Project managementTechnical skillsFinancial managementOrganizational managementFundraisingPolicy makingCommunicationsOtherDon’t know
83787474706557130
100906060506060200
6969858585695480
Skills
Percent of organizations
All Nonprofit Informal
< 2525-5050-75> 75Don’t know
354
22309
100
300105010
100
388
31158
100
Percent of budget
Percent of organizations
All Nonprofit Informal
Federal agenciesCommunity-based organizationsCounty agenciesCollaborative groupsConservation or environmental organizationsUniversities/Research institutesState agenciesPrivate ranchland ownersMill and forest companiesRural for-profit businessesPrivate forestland ownersElected officialsEnergy developers and facilitiesEconomic development organizationsTribal agencies
1007468656155505045363633232220
1006080508030502060202033302022
1008558774675507533505033172318
Organization partner
Table B9 Percent of organizations with various skills represented on their decision-making bodies
Table B10 Proportion of organization’s budget used to pay for contracted services
Table B11 Percent of organizations that frequently partner with other groups

Community-basednaturalresourcemanagementinOregon:aprofileoforganizationalcapacity17
Percent of organizations
All Nonprofit Informal
Grant supportedPaid through a contractUse operating surplus Not financially supportedDon’t knowOther
70263926017
54234646015
90303000
20
Financial support
Percent of organizations
All Nonprofit Informal
Are a collaborative groupCoordinate collaborativeParticipate as a stakeholderProvide services to collaborativeDon’t participate with collaborativeDon’t knowOther
57435748404
23628562808
100202030000
Type of collaborative work
ENDNOTES
1Community-based natural resource management in the western US: a pilot study of capacity. Moseley, C., MacFarland, K., Nielsen-Pincus, M., Grimm, K., Pomeroy, A., and M.J. Enzer. 2011. Ecosystem Workforce Program Working Paper #27. Available at: http://ewp.uoregon.edu/sites/ewp.uoregon.edu/files/WP_27.pdf.2 Please see Appendix A of Ecosystem Workforce Program Working Paper #27 for detailed discussion of the study methods.3See Training Resources for the Environmental Community, 2008 Salary and Benefits Survey (Sante Fe: Training Resources for the Environmental Community. 2008).
Table B12 Percent of organizations that are collaborative groups or work with collaborative groups
Table B13 Percent of organizations receiving financial support for collaborative work
